
 Login
Login Register
 Submit a Paper
 Propose a Special lssue
 Open Access
ARTICLE
Mechanism-Derived Rainfall Thresholds for Shallow Slope Failure: Infiltration-Controlled Instability under Variable Rainfall Patterns
Department of Resources Engineering, National Cheng Kung University, Tainan, Taiwan
* Corresponding Author: Hsin-Fu Yeh. Email:
(This article belongs to the Special Issue: Advanced Numerical and Data-Driven Modeling for Geoengineering and Subsurface Systems)
Computer Modeling in Engineering & Sciences 2026, 148(3), 19 https://doi.org/10.32604/cmes.2026.086972
Received 08 June 2026; Accepted 31 August 2026; Issue published 28 September 2026
 View Full Text
 Download PDF
Abstract
Traditional rainfall intensity–duration (I–D) thresholds for shallow landslides are predominantly empirical and lack explicit linkage to internal slope hydrological processes, limiting their reliability under variable rainfall conditions. This study establishes a physically based early warning framework by integrating critical suction stress–depth profiles with rainfall I–D thresholds derived from limit equilibrium analysis and unified effective stress theory. Requiring only rainfall data, the framework does not depend on real-time subsurface monitoring and thus remains applicable in data-limited regions. Antecedent rainfall effects are incorporated through an antecedent rainfall duration estimation method, enabling a physically interpretable definition of the initial slope infiltration state. Coupled transient infiltration–stability simulations reveal that infiltration amount, rather than total rainfall depth, is the dominant control on failure initiation. Variations in rainfall temporal distribution produce distinct infiltration responses: earlier intensity concentrations promote more effective infiltration and earlier destabilization, whereas later-stage intensity peaks enhance surface saturation and runoff, limiting infiltration and delaying failure onset. The proposed framework advances existing physically based rainfall threshold studies by explicitly incorporating antecedent rainfall conditions and rainfall temporal distribution into rainfall threshold analysis. Based on these findings, the rainfall pattern associated with the earliest failure timing under comparable conditions is identified as a conservative basis for early warning. Additional analyses considering incomplete rainfall records indicate that prediction performance depends on rainfall update intervals, historical data completeness, and specification of antecedent rainfall conditions. Even under partial data loss, reliable pre-failure warning remains achievable. The results provide a physically interpretable and operationally robust basis for rainfall-triggered slope failure prediction.Keywords
In common slope stability analysis methods, the empirical threshold method is the most widely used preliminary prediction tool [1–4]. It mainly evaluates the possibility of landslide occurrence by comparing expected rainfall characteristics (such as rainfall intensity and duration) with empirical thresholds for rainfall–landslide occurrence [5–9]. It is applicable to landslide prediction and early warning across various spatial scales, especially for large-scale shallow landslide phenomena. These empirical relationships are usually expressed as power-law functions between rainfall intensity and duration; however, they neglect the importance of hydrological processes within the slope during rainfall events. As a result, the predictive performance of the model is reduced, leading to a large number of false alarms in early warning systems [10]. Recent studies have confirmed that integrating hydrological information, such as catchment water storage or antecedent soil moisture, can effectively enhance the accuracy of landslide prediction and strengthen the reliability of empirical threshold methods [11,12]. Fusco et al. [13] further indicated that slope materials and hydrological properties exert strong control over the timing and intensity of hydrological processes associated with rainfall-induced landslides, thereby influencing hillslope hydrological responses across different temporal scales.
On the other hand, existing research has focused on investigating the triggering mechanisms of rainfall-induced shallow landslides and has progressively developed physically based assessment methods [14–18]. These methods reasonably account for soil hydraulic and mechanical properties, initial pore water pressure distributions, and atmosphere–soil interactions. They employ analytical solutions or numerical simulations, such as the finite element method and the finite difference method, to calculate rainfall infiltration–induced changes in pore water pressure, thereby enabling a further evaluation of slope stability. Lu et al. [19] proposed an evaluation approach that integrates geotechnical engineering methods, retaining the simplicity of approaches based on rainfall and landslide historical data while enabling the description and quantification of physical processes such as hydrological and mechanical processes. This approach enhances the predictive accuracy of slope instability occurrence. Yang et al. [20] investigated the relationship between soil moisture and rainfall, proposing relationships among soil moisture content, suction stress, and shear strength, and developed a stability assessment model based on moisture variations by integrating numerical models, thereby providing theoretical support for slope stability analysis. These studies highlight that incorporating hydrological processes into slope stability assessments enhances the robustness and accuracy of landslide early warning systems. Recent studies have also highlighted that adopting the wetting branch of the soil-water retention curve (SWRC) together with the corresponding hydraulic conductivity function (HCF) can improve the representation of rainfall infiltration processes by accounting for hydraulic hysteresis [21,22].
When examining the triggering mechanisms of slope failure, the influence of antecedent rainfall on the moisture condition of the slope mass cannot be overlooked. Several studies have indicated that slopes exhibit significantly different hydrological responses to rainfall under varying soil moisture conditions [23–27]. Durukan [28] evaluated the effects of antecedent saturation and rainfall conditions on rainfall-triggered slope failure mechanisms, highlighting the importance of considering initial wetness conditions and rainfall characteristics in slope stability assessment. Traditional models commonly focus on rainfall intensity and duration, but they may not fully capture variations in rainfall temporal distribution or the impacts of short-duration and abrupt rainfall events [29–32]. Yeh and Tsai [33] investigated the effect of variations in long-duration rainfall intensity on unsaturated slope stability and demonstrated that changes in rainfall intensity can significantly influence pore water pressure responses and slope stability. Therefore, this study further investigates the impacts of different rainfall patterns on slope stability. By integrating transient rainfall simulations with analyses of rainfall temporal distribution, an early warning mechanism capable of predicting failure timing is developed. In addition, an estimation method for antecedent rainfall duration is proposed to explicitly define the critical temporal scale governing slope wetting conditions. This approach enhances the applicability and predictive accuracy of I–D models under atypical rainfall conditions while mitigating errors associated with uncertainties in rainfall data.
Existing rainfall threshold and early warning approaches may still exhibit reduced predictive accuracy under extreme rainfall conditions or when data are insufficient, and their limitations become more evident when non-uniform rainfall patterns or antecedent wetting states are involved. Although Lu et al. [19] proposed a suction stress–based rainfall intensity–duration threshold curve method for slope instability prediction, variations in rainfall patterns were not explicitly considered in their early warning procedure. More recently, Zhao et al. [34] further incorporated rainfall temporal distribution into rainfall thresholds for shallow landslides; however, the influence of antecedent conditions was not further examined. Therefore, the linkage among initial wetting conditions, infiltration evolution, and suction stress variation still requires further clarification. To address these research gaps, this study constructs critical suction stress–depth profiles based on the limit equilibrium method and the unified effective stress theory, and develops physically meaningful rainfall threshold curves to enhance the understanding of slope failure development processes. Additionally, this study proposes a method for estimating antecedent rainfall duration and defines simple and explicit parameters and operational procedures. This approach overcomes limitations imposed by data gaps while reasonably accounting for physical mechanisms, thereby addressing the shortcomings of traditional forecasting methods. This study further analyzes the impacts of different rainfall patterns on slope stability by incorporating rainfall characteristics into threshold models. Through transient rainfall analysis, failure timing is predicted, thereby enhancing forecasting capability for non-uniform rainfall events. The proposed methodology can be applied to shallow slopes lacking monitoring equipment and, when combined with real-time weather forecasts, provides dynamic predictions and decision support for disaster risk management.
The main contributions of this study are summarized as follows:
• The effects of different rainfall temporal patterns on physically based rainfall thresholds were systematically investigated, demonstrating how rainfall distribution influences infiltration behavior, failure timing, and the distribution of rainfall intensity–duration (I–D) threshold curves.
• An antecedent rainfall duration estimation method was developed to account for antecedent wetting conditions and initial infiltration conditions in physically based rainfall threshold analysis.
• A physically based shallow slope early warning procedure was established by integrating rainfall pattern–dependent threshold curves with antecedent rainfall estimation, enabling rainfall warning using rainfall information alone without relying on real-time subsurface monitoring.
The overall framework of this study is illustrated in Fig. 1. First, critical suction stress depth profiles are analyzed to identify potential slope failure mechanisms and corresponding failure depths under different wetting conditions. Based on this analysis, physically based rainfall intensity–duration (I–D) threshold curves are established to serve as the foundation for early-warning decisions. Second, an estimation method for antecedent rainfall duration is proposed to evaluate the initial wetting condition of the slope prior to the main rainfall event. Next, rainfall data are organized and rainfall events are segmented to accurately define the duration and cumulative precipitation of each event, forming the basis for subsequent case analysis and model application. Finally, transient rainfall simulations are conducted by integrating different rainfall patterns with real-time rainfall forecasts, thereby establishing an early-warning procedure capable of predicting the timing of slope failure. Through this five-stage workflow, a physically based, easy-to-use, and flexible landslide prediction system is developed that is applicable across different scenarios and regions.
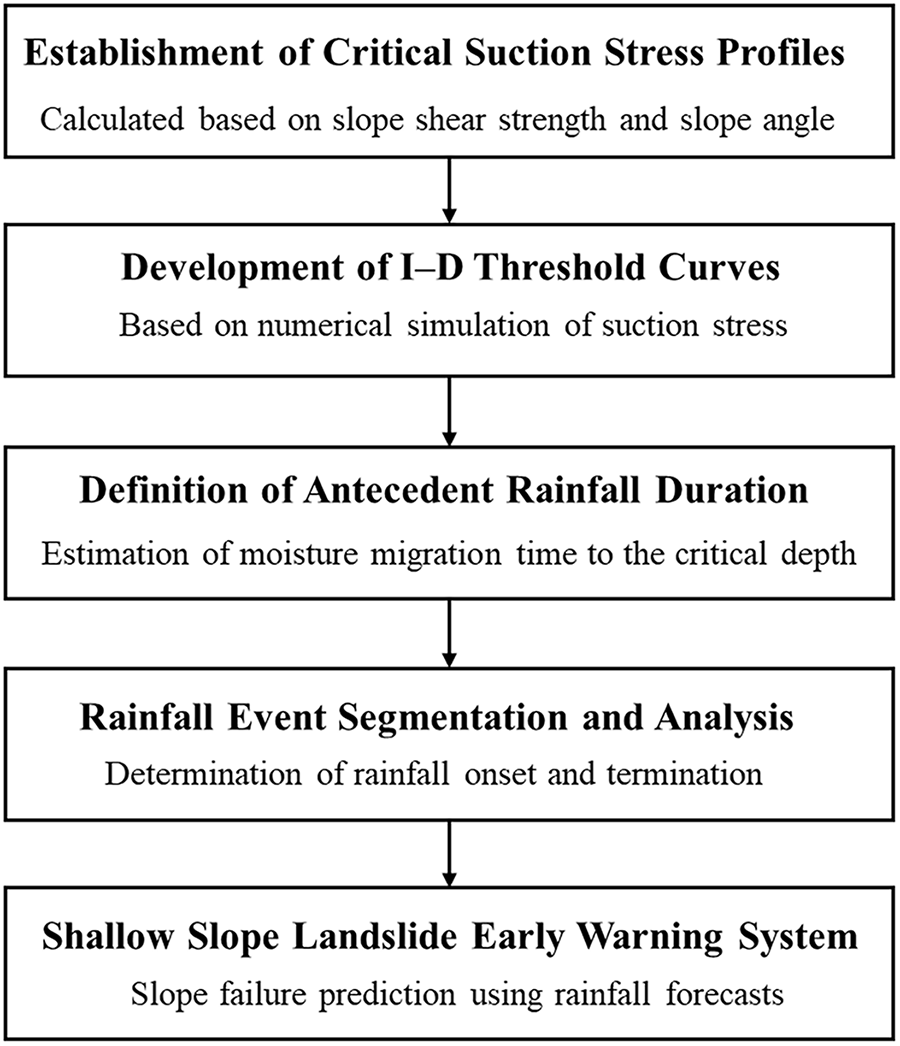
Figure 1: Research flowchart.
2.1 Construction of Critical Suction Stress–Depth Profiles
The critical suction stress of a slope refers to the suction stress corresponding to the limit equilibrium state (FS = 1) under a given slope angle and shear strength conditions. It is an intrinsic property of the slope, governed solely by its shear strength parameters and slope geometry, and is independent of soil suction or moisture content. Although soil suction and moisture content influence the transient evolution of pore water pressure and seepage behavior, thereby affecting the timing of slope failure, the critical suction stress at a given depth is a steady-state quantity. Therefore, it represents an intrinsic mechanical property of the slope. Once the slope angle and soil shear strength parameters are fixed, the critical suction stress profile with depth is determined.
The unified effective stress theory developed by Lu and Likos [35] and Lu et al. [36] was adopted in this study. Accordingly, the effective stress in variably saturated soils can be expressed as follows:
where
Under saturated conditions, pore water pressure in soils may be either in a compressive state (i.e., positive relative to atmospheric pressure) or in a tensile state (i.e., negative relative to atmospheric pressure), depending on the imposed boundary conditions. Under a hydrostatic pressure distribution, the maximum negative pore water pressure that a soil can sustain, which represents the lower limit at which it remains saturated, is an intrinsic property known as the air-entry pressure. When pore water pressure falls below this pressure, the soil enters an unsaturated state. Under unsaturated conditions, suction stress constitutes a component of the internal effective stress. When the soil becomes saturated, the contribution of suction stress approaches zero and is replaced by pore water pressure. This is consistent with the concept of pore water pressure in Terzaghi [37] theory, reflecting the continuity of effective stress across the saturated–unsaturated transition.
where
Therefore, regardless of whether the soil is saturated or unsaturated, its shear strength can be described by the Mohr–Coulomb failure criterion [37]:
When examining rainfall-induced slope failures, the failure plane typically occurs at shallow depths and is generally parallel to the slope surface. Therefore, this study employs an infinite slope model, as shown in Fig. 2a, which allows the failure plane to form at any depth, with its specific location determined by the prevailing hydrological and mechanical conditions. Based on this, for a homogeneous slope with a given slope angle (β), the Factor of Safety (FS) under variably saturated conditions can be expressed by applying the unified effective stress theory to the limit equilibrium formulation proposed by Duncan et al. [38] as follows [39]:
where
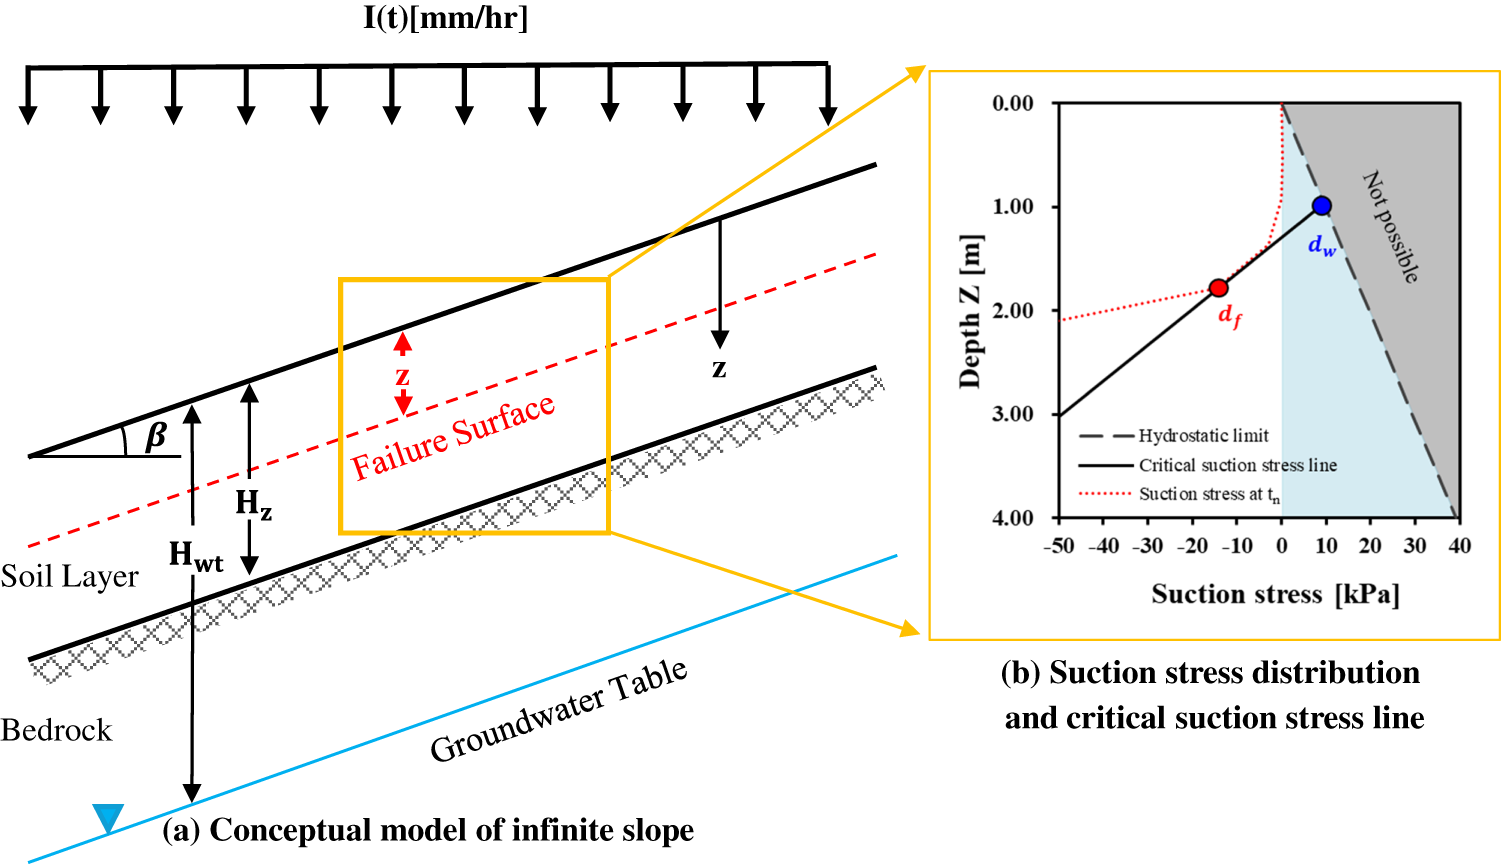
Figure 2: (a) Conceptual model of an infinite slope; (b) Critical suction stress–depth profile.
When the geometric conditions and mechanical properties (β,
2.2 Development of Suction Stress–Based Rainfall Intensity–Duration Threshold Curves
The rainfall intensity–duration (I–D) threshold curve reflects the hydrological and mechanical characteristics of a slope and is primarily controlled by its hydraulic properties and critical suction stress. To establish the threshold curve, transient rainfall infiltration is first simulated to obtain the temporal evolution of suction stress within the slope. The simulated suction stress profiles are then compared with the critical suction stress profile developed in Section 2.1 to determine the critical failure time under each rainfall condition. This study employed HYDRUS [41] to simulate rainfall infiltration, and the corresponding computational procedure is illustrated in Fig. 3.
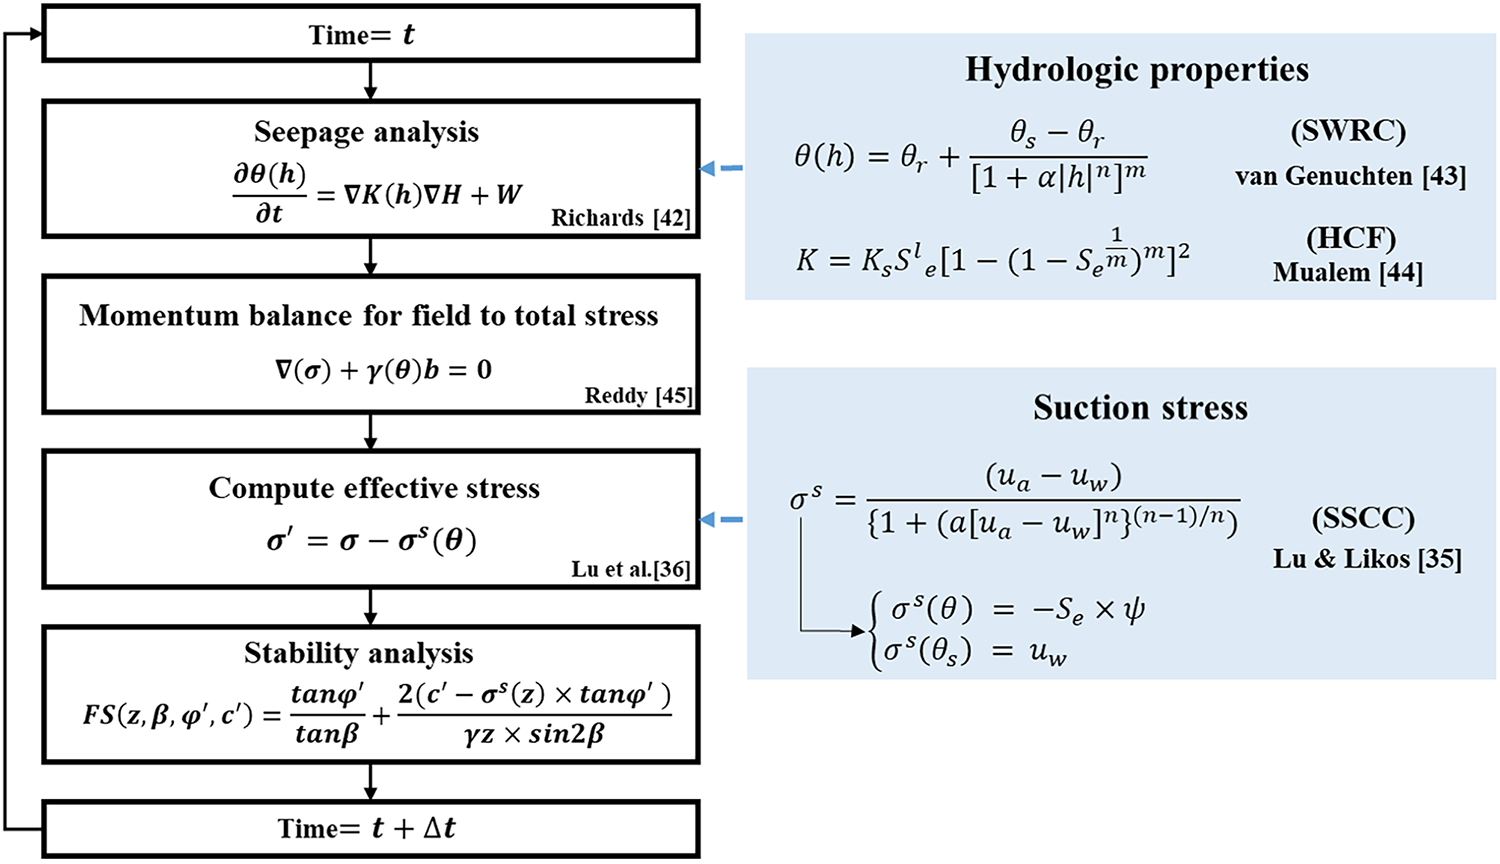
Figure 3: Coupled variably saturated flow and stress computation procedure.
The simulated variables include matric suction, soil water content, hydraulic conductivity, and temporal and depth-dependent variations of suction stress. The governing equation for seepage flow is based on the transient unsaturated flow equation proposed by Richards [42] and is expressed as follows:
where θ is volumetric water content [-]; t is time [T];
where θs is the saturated water content [–]; θr is the residual water content [-]; ψ is the matric suction [ML−1T−2]. The parameters
where l denotes the pore-connectivity parameter and is commonly assumed to have a value of 0.5. Together, Eqs. (6)–(8) describe the hydraulic properties of unsaturated soils and characterize the transient water movement within the slope during rainfall infiltration. Based on these constitutive relationships, transient rainfall infiltration was simulated using the HYDRUS software package [41]. According to the finite element framework proposed by Reddy [45], the hydrological response of the slope during rainfall infiltration was computed, and the simulated volumetric water content was subsequently converted into suction stress using the unified effective stress formulation proposed by Lu and Likos [35], as defined in Eq. (2).
The critical suction stress–depth profile established under the condition of FS = 1 is shown in Fig. 4a. The blue curve represents the critical suction stress distribution with depth, corresponding to the limit equilibrium state of the slope as defined by Eq. (5). The red dashed curve represents the rainfall-induced suction stress profile simulated using HYDRUS-2D. The initial suction profile was established based on hydrostatic equilibrium; therefore, the initial pressure head and the corresponding matric suction varied linearly with depth. However, after rainfall infiltration began, the suction stress profile evolved dynamically in both time and depth through the numerical solution of the Richards equation, resulting in a nonlinear distribution.
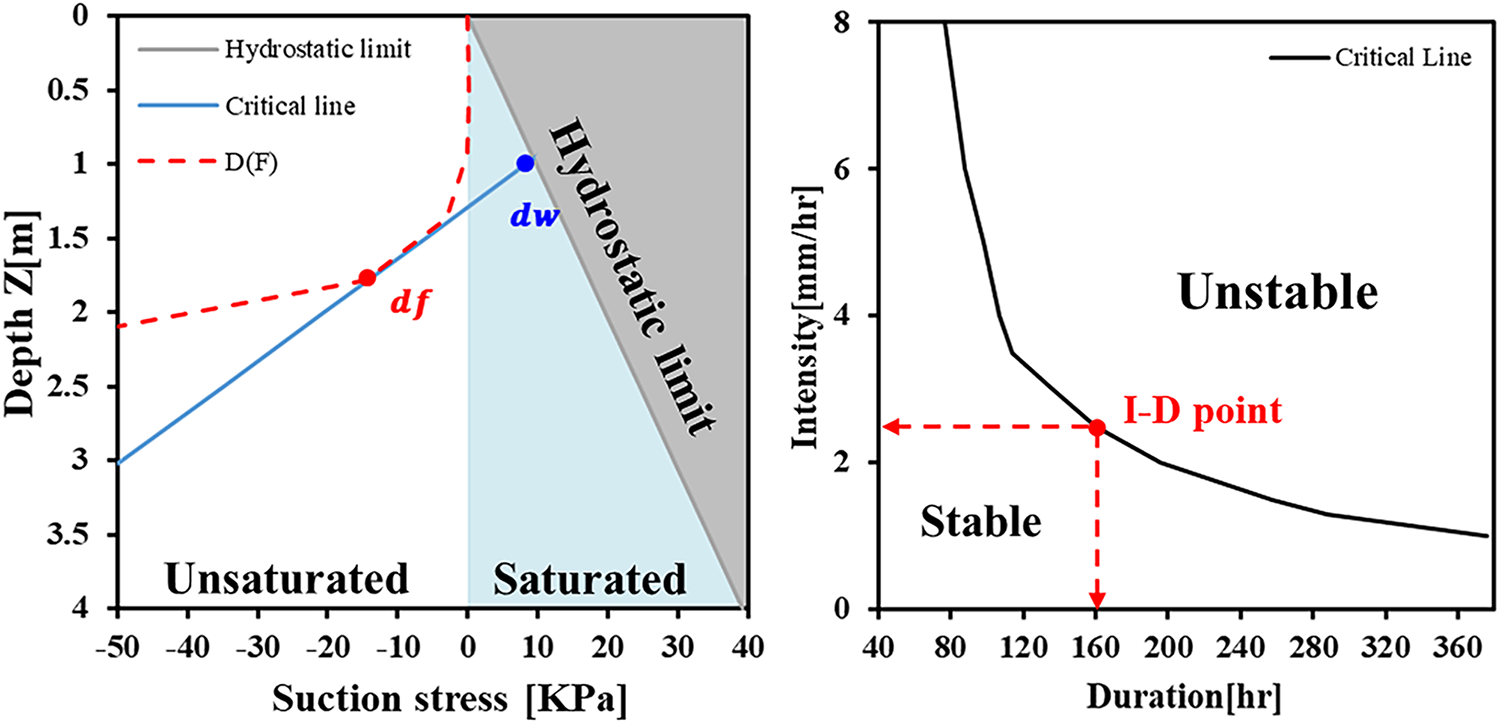
Figure 4: (a) Critical suction stress–depth profile; (b) Suction stress–based rainfall intensity–duration threshold curve.
For a given rainfall intensity, the infiltration process was simulated until the rainfall-induced suction stress profile first intersected the critical suction stress profile. The depth of this first intersection was defined as the critical landslide depth (df), and the corresponding simulation time was defined as the failure time. In addition, the hydrostatic critical depth (dw) was determined from the intersection between the critical suction stress profile and the hydrostatic limit (i.e., the gray region where σs > uw), representing the depth at which the slope reaches the critical condition under hydrostatic conditions.
By repeating this procedure under different rainfall intensities, multiple pairs of critical rainfall intensity and failure duration were obtained to construct the rainfall intensity–duration (I–D) threshold curve, as shown in Fig. 4b. Rainfall conditions above the threshold curve indicate unstable conditions, whereas those below the curve correspond to stable conditions. The red point in Fig. 4b represents one critical I–D combination determined from the first intersection shown in Fig. 4a.
2.3 Definition of Antecedent Rainfall Duration
Previous studies investigating the effects of antecedent rainfall have commonly employed regression analyses based on cumulative rainfall over a fixed number of days prior to slope failure, or have estimated soil moisture conditions using the Antecedent Precipitation Index (API) [46,47]. However, such approaches often require long-term and high-resolution continuous observational data, thereby increasing data requirements and limiting the applicability of the models. To overcome this limitation, this study proposes an estimation method for the duration of antecedent rainfall, which derives key parameters based on critical suction stress–depth profiles. This approach enables the assessment of the time span over which antecedent rainfall influences slope wetting conditions and stability, even in the absence of complete records of slope failure events. First, based on the assumptions of the limit equilibrium method and considering the influence of hydrostatic pressure, this study describes the evolution and migration of the critical depth at which the factor of safety within the slope reaches its minimum during rainfall infiltration, ultimately reaching the critical failure depth. The time required for this critical depth to migrate to the critical failure depth is defined as the duration of antecedent rainfall, which quantifies the temporal influence of rainfall on slope stability.
where DA is the antecedent rainfall duration [T],
2.4 Rainfall Event Separation and Rainfall Event Analysis
Because rainfall in Taiwan is predominantly associated with the Mei-yu (plum rain) season and summer convective precipitation, the rainfall pattern classification proposed by Lu et al. [19] cannot effectively distinguish the characteristics of local rainfall events. Therefore, this study replaces the conventional hydrological breakthrough time with the antecedent rainfall duration DA to establish a more representative rainfall ensemble. For rainfall segmentation, this study adopts the definition of the rainfall frequency index R10 proposed by the Expert Team on Climate Change Detection and Indices (ETCCDI), defined as the number of days with cumulative daily rainfall exceeding 10 mm [48–50]. This indicator aims to simplify the identification of extreme rainfall events, with a daily rainfall of 10 mm typically representing rainfall events of moderate intensity or higher. It has been widely applied across most climate zones. To meet the requirements of hourly rainfall data used in this study, the definition of the R10 indicator has been converted from a “daily scale” to an “hourly scale” to enhance its ability to identify short-duration heavy rainfall events.
where Pi represents the rainfall amount [L] during the i-th hour [L], and N denotes the total number of hours [T] within the analysis period. If the cumulative rainfall over the preceding 24 h satisfies Pi ≥ 10 mm, the corresponding time is identified as the onset of a rainfall event. The termination of a rainfall event is defined as the time when the 24-h cumulative rainfall falls below Pi < 10 mm, as illustrated in Fig. 5. The red and green dashed lines indicate cumulative rainfall reaching the threshold for rainfall onset, representing past and present time points that satisfy the onset criterion, respectively, while the gray dashed line corresponds to the cumulative rainfall decreasing to the threshold defining rainfall termination. Whenever a rainfall event meets the termination criterion, the cumulative rainfall is reset to zero. Subsequent rainfall is regarded as a new antecedent rainfall event only when the rainfall onset criterion is satisfied again. Because a rain-free period often exists between rainfall termination and the onset of subsequent rainfall, hydrological processes within the slope may continue even after surface rainfall has ceased. Therefore, in this study, such rain-free periods are also taken into account to evaluate their influence on slope stability and potential failure conditions. Subsequently, all rainfall events occurring within the antecedent rainfall duration DA are integrated to derive a set of antecedent rainfall events capable of influencing slope failure. By combining these events with rainfall forecasts, prediction points can be superimposed onto the rainfall intensity–duration (I–D) threshold curve, allowing the stability state of the slope to be assessed based on the threshold relationship.
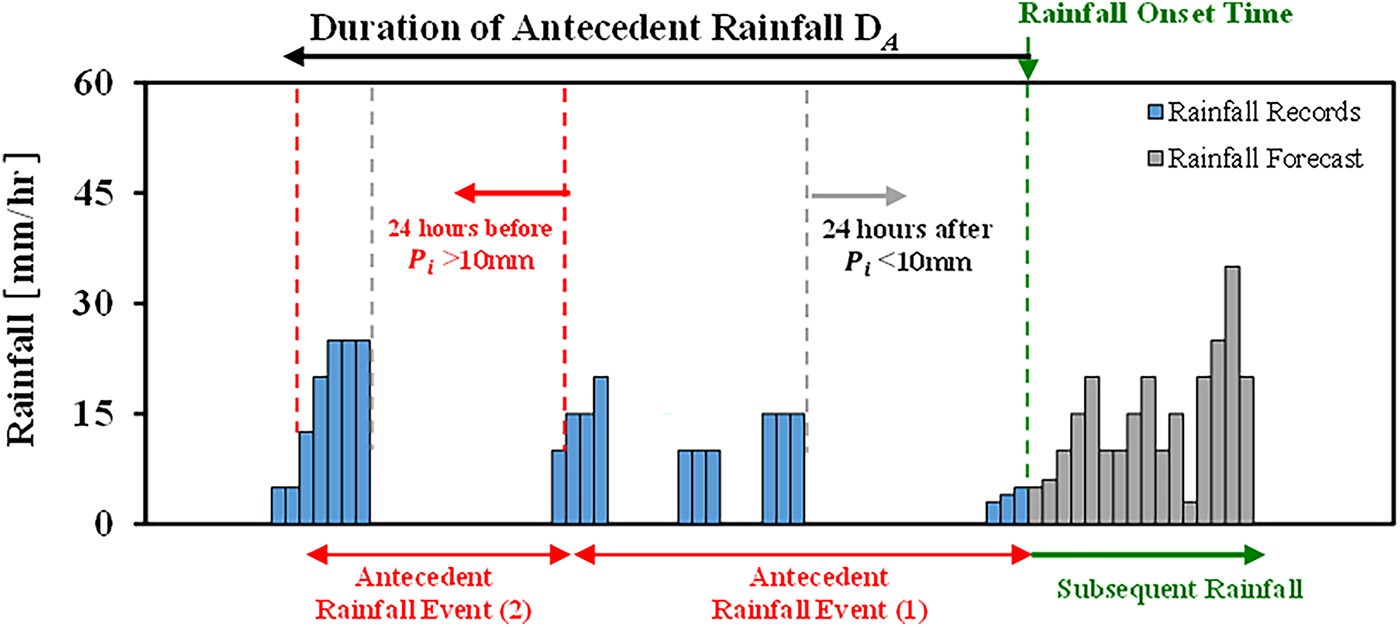
Figure 5: Method for constructing rainfall event sets.
2.5 Landslide Early Warning System
The rainfall combination method developed in this study can be applied to slope early warning procedures based on rainfall intensity–duration (I–D) threshold curves proposed by the U.S. Geological Survey [51,52]. The slope early warning procedure uses Quantitative Precipitation Forecasts (QPF) provided by meteorological agencies as model inputs. The overall workflow is illustrated in Fig. 6 and is described as follows:
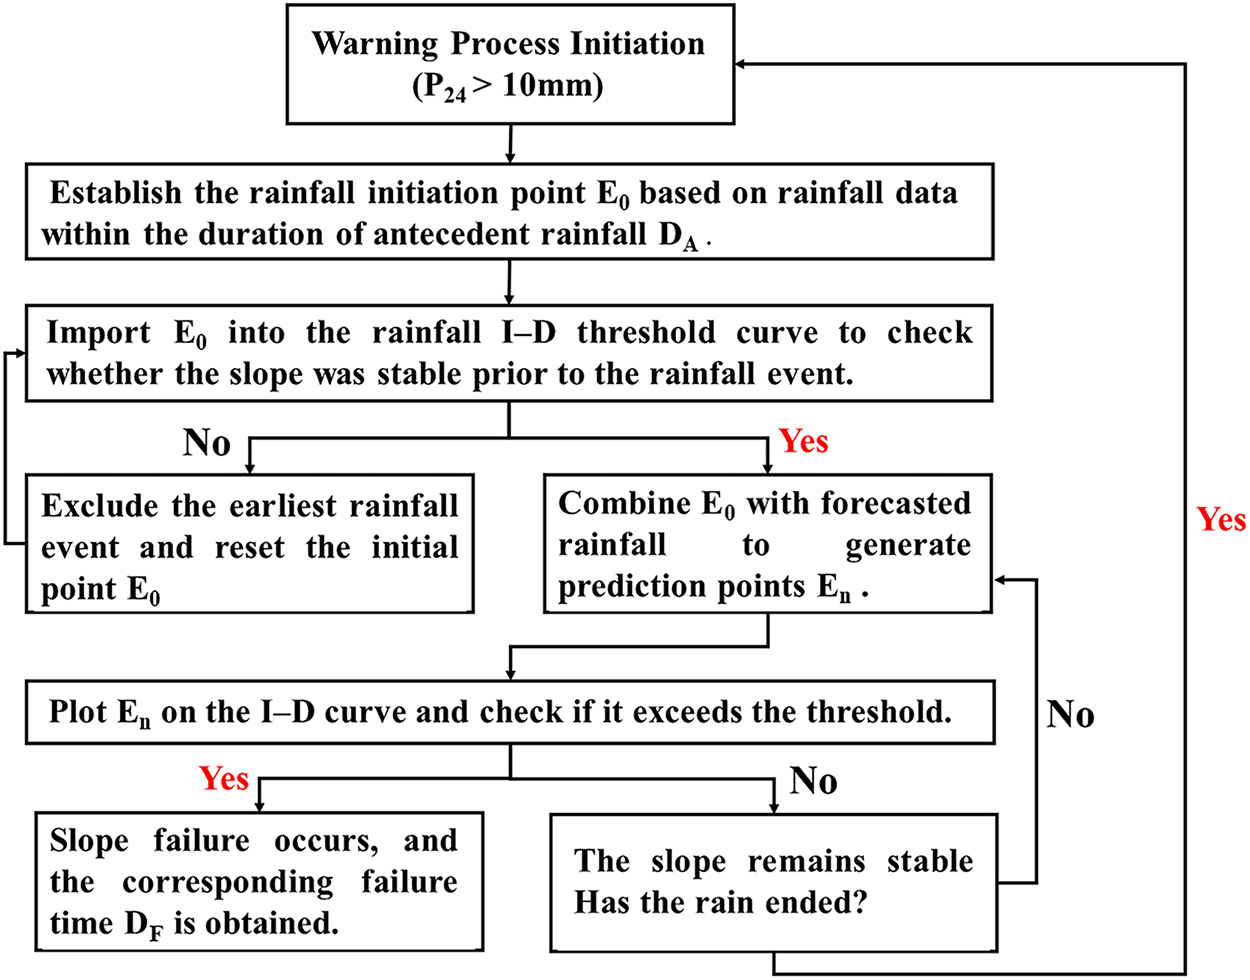
Figure 6: Workflow of the slope early warning procedure.
Step 1: Initiation of the Landslide Early Warning Procedure
Following the termination of the previous rainfall event, the time at which the cumulative rainfall over the subsequent 24 h reaches 10 mm is identified as the onset of the current rainfall event, as indicated by the green dashed line in Fig. 5. At this time, the landslide early warning procedure is initiated.
Step 2: Establishment of the Rainfall Initial Point
To mark the onset of the current rainfall event on the rainfall intensity–duration (I–D) threshold curve and to ensure that the early warning procedure can accurately identify subsequent rainfall-induced failure behavior, this study, the position of the rainfall initial point is determined based on different combinations of antecedent rainfall events. The position of the initial point is constrained to lie below the threshold curve, indicating that the warning procedure is initiated while the slope remains in a stable state. If the rainfall initial point lies above the threshold curve, it implies that the slope has already reached failure conditions prior to the onset of rainfall, rendering the system incapable of predicting the failure timing. Considering that the influence of antecedent rainfall diminishes over time, rainfall events that are furthest from the rainfall onset are progressively excluded. The combination with the longest antecedent rainfall duration that remains below the threshold curve is selected as the rainfall initial point, ensuring that the prediction system is activated under stable conditions.
Step 3: Integration of Rainfall Forecasts
After confirming that the slope remains in a stable condition prior to rainfall onset, stability prediction for subsequent rainfall events can be conducted. Subsequent rainfall data are obtained from QPF. The system dynamically updates the prediction information based on the latest rainfall forecasts and continuously generates new rainfall prediction points. These points are sequentially plotted on the rainfall intensity–duration (I–D) threshold curve for stability assessment.
Step 4: Stability Analysis and Prediction of Rainfall-Induced Failure Timing
Before the termination of the subsequent rainfall event, the system continuously evaluates the position of each prediction point on the rainfall intensity–duration (I–D) threshold curve. If any prediction point reaches or exceeds the threshold curve, it indicates that the rainfall conditions at that time have attained the critical threshold for slope failure. The time corresponding to this prediction point is then defined as the predicted failure time and is used as a key basis for assessing slope failure risk within the early warning system.
2.6 Evaluation of the Early-Warning Performance of the Rainfall Threshold Model
To evaluate the performance of the rainfall threshold curve model based on critical suction stress in predicting shallow landslides, this study compared the model prediction results with long-term actual observational data. Based on this comparison, an error matrix was constructed to quantify the prediction accuracy of the model. The error matrix can be divided into four scenarios [53,54], as shown in Table 1, including hits, where landslide events are successfully predicted; misses, where actual landslide events are not predicted; false alarms, where landslides are predicted but do not actually occur; and correct negatives, where neither a warning is issued nor a landslide occurs.

Since shallow landslides are low-frequency hazard events, the overall accuracy is easily influenced by the proportion of non-event samples and may overestimate the model performance. Therefore, this study adopts Probability of Detection (POD), False Alarm Ratio (FAR), and Threat Score (TS) as the primary evaluation indicators to analyze the feasibility and predictive accuracy of the practical early warning system developed in this study. The evaluation indicators are described as follows:
• Probability of Detection (POD):
This represents the proportion of actual landslide events that are successfully predicted by the model. It is used to measure the model’s ability to detect landslide events that actually occur. The POD value ranges from 0 to 1, with higher values indicating better predictive capability of the model for landslide events. The definition is as follows [55]:
• False Alarm Ratio (FAR):
This represents the proportion of warning signals issued by the model in which no landslide event actually occurs. It is used to evaluate the extent of false warnings generated by the model. A lower FAR value indicates higher reliability of the model’s warning results. The definition is as follows [55]:
• Threat Score (TS):
This metric comprehensively considers hits, misses, and false alarms, and is used as an indicator to evaluate the overall predictive performance of the model. The TS value also ranges from 0 to 1, with higher values indicating better overall prediction performance of the model in balancing landslide detection capability and false alarm control. The definition is as follows [56]:
In summary, this study establishes an early warning performance evaluation framework based on the confusion matrix and the metrics POD, FAR, and TS, while avoiding the use of overall accuracy to reduce potential bias. This framework can be further applied to compare the effects of different rainfall conditions on early warning performance, providing a basis for subsequent analyses.
3.1 Study Area and Geological Setting
The Babao-Liao landslide site is located in Dongxing Village, Zhongpu Township, Chiayi County, Taiwan, as shown in Fig. 7. It lies in the southern segment of the western foothills and represents a mountainous slope that is highly sensitive to rainfall. The terrain is generally steep, dominated by fifth- and sixth-grade slopes with inclinations exceeding 40°, and elevations ranging from approximately 400 to 580 m. The slope morphology is strongly influenced by structural planes and drainage patterns, and areas of exposed slope surface are observed. The slope mass is primarily composed of muddy sandstone and sandy shale of Miocene to Pleistocene age. These lithologies are highly fractured and contain well-developed structural joints. Owing to the combined influence of typhoons and southwesterly monsoon flows, the region experiences high annual rainfall, with a mean annual precipitation of approximately 2900 mm. Rainfall is mainly concentrated between April and September during the Mei-yu season and the summer rainy period. As a result, the Babao-Liao area frequently experiences short-duration, high-intensity rainfall events during the rainy season, which have repeatedly triggered slope failures. The dominant failure mode in this area is shallow landsliding, which is closely associated with the reduction in shear strength of loose, weathered surface soils after saturation. Rainfall infiltration into the subsurface progressively increases pore water pressure, ultimately inducing slope failure.
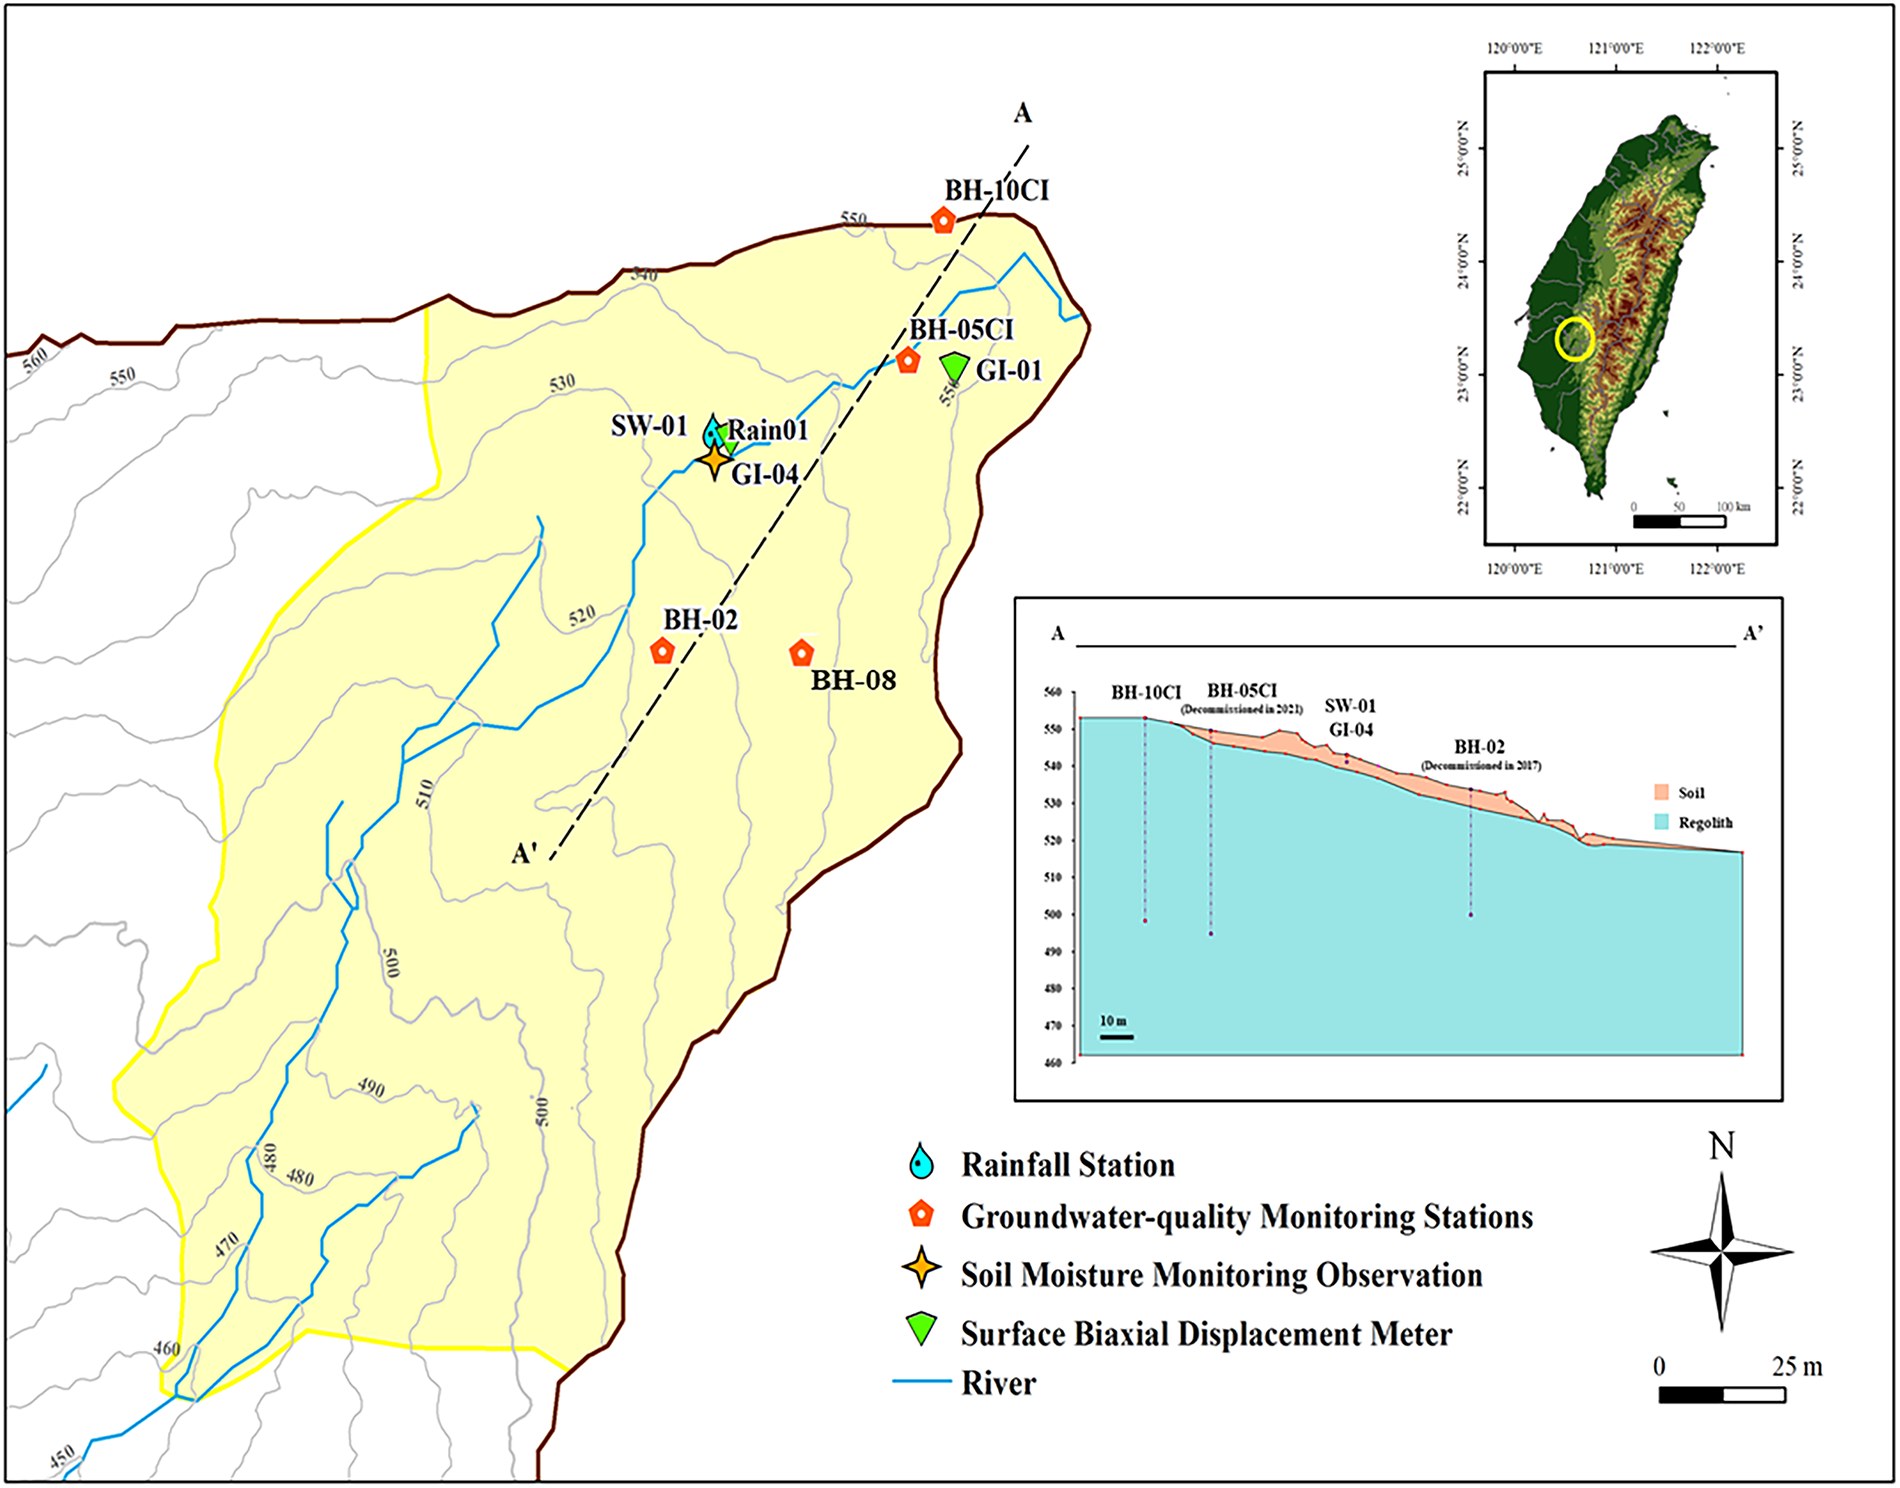
Figure 7: Location map of the Babao-Liao landslide area from Yang et al. [20].
The Babao-Liao area exhibits high susceptibility to slope failure and has well-documented records of slope failure events, making it a suitable case site for validating the proposed early warning system. According to the engineering geological borehole data at the main analysis location, BH-10CI, the colluvial deposits in the Babao-Liao area mainly consist of brown soils mixed with gravels and are classified as low-plasticity clay based on the Unified Soil Classification System (USCS). Since particle-size analysis was not conducted at BH-10CI, particle-size analysis data from a nearby borehole, BH-08, were used as supplementary information to characterize the fine-particle content and soil classification of the study area, as shown in Fig. 8. The results indicate that the sand content is approximately 32%–39%, the silt content is approximately 39%–54%, and the clay content is approximately 6%–12%.
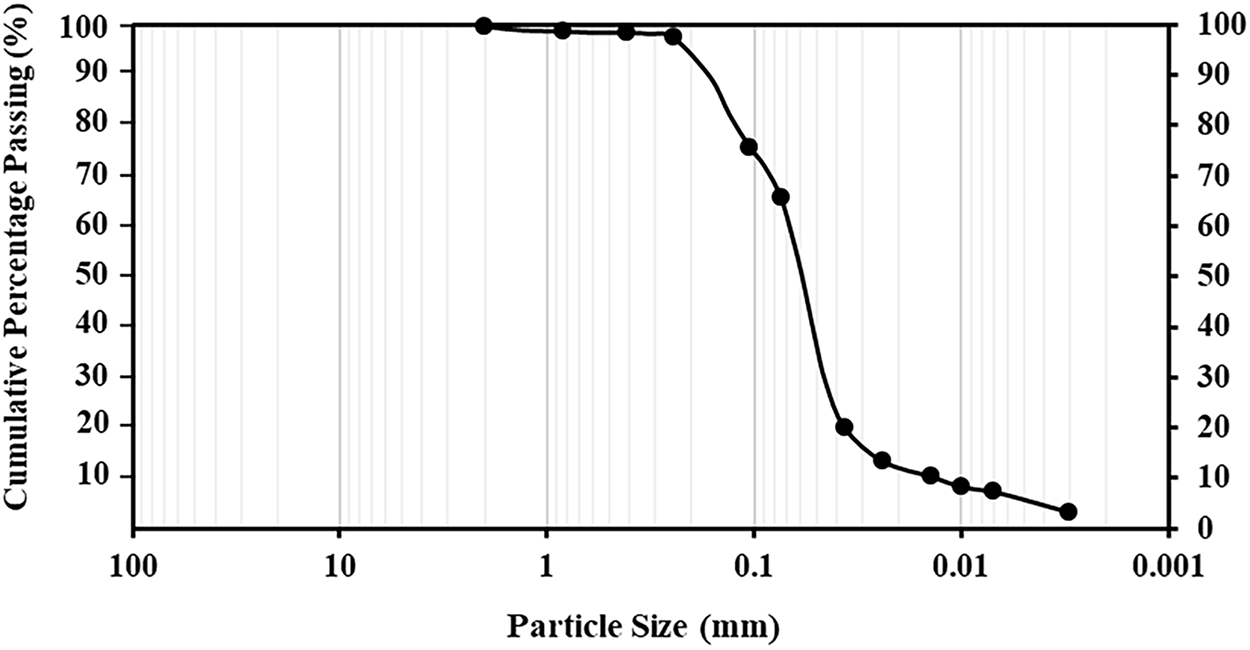
Figure 8: Particle-size distribution curve of the Babao-Liao soil sample.
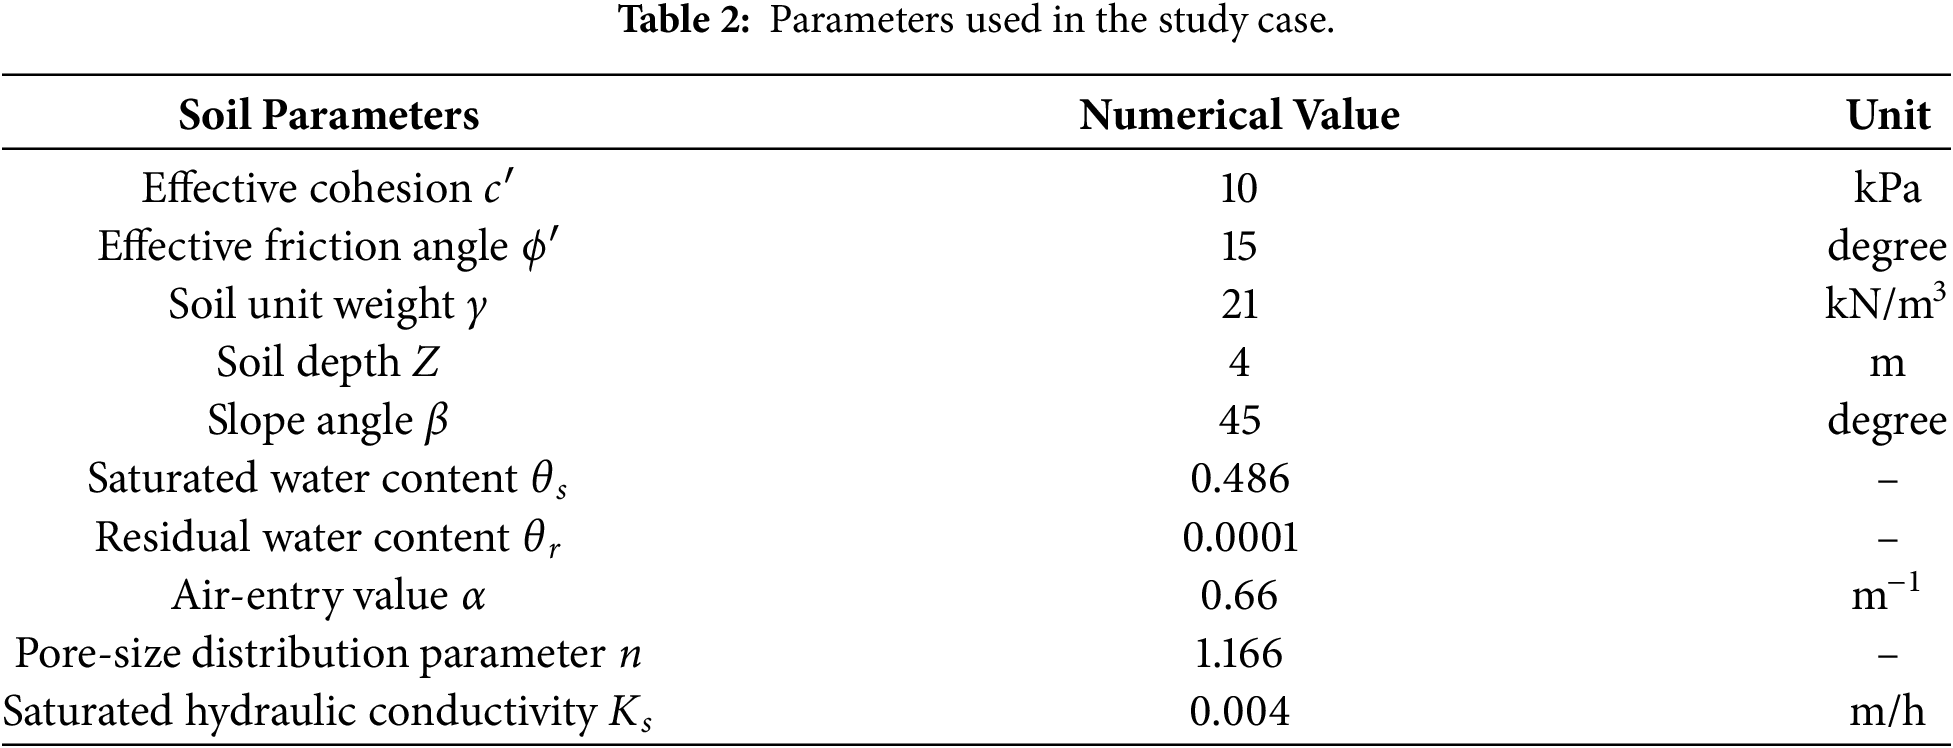
The soil hydraulic parameters reported by Yang et al. [20] were adopted in this study and are summarized in Table 2. Among these parameters, the saturated water content (θs), residual water content (θr), air-entry parameter (α), and pore-size distribution parameter (n) were obtained by fitting the SWRC to soil water characteristic test data, whereas the saturated hydraulic conductivity (Ks) was adopted from the calibrated results reported by Yang et al. [20]. The procedure for determining the van Genuchten (1980) model parameters is described as follows:
(1) The relationship between volumetric water content and matric suction was established using soil water characteristic test data.
(2) The van Genuchten model was fitted to the soil-water retention curve (SWRC) using a nonlinear least-squares method, with θs, θr, α, and n simultaneously treated as fitting parameters.
(3) The optimized values of the saturated water content (θs) and residual water content (θr) were obtained directly from the simultaneous fitting procedure.
(4) The optimized values of the air-entry parameter (α) and pore-size distribution parameter (n) were also obtained directly from the same simultaneous fitting procedure. The parameter α primarily controls the location at which the SWRC begins to decline (air-entry region), whereas n primarily controls the slope of the SWRC and reflects the soil pore-size distribution.
Based on the adopted van Genuchten–Mualem hydraulic parameters, the corresponding soil hydraulic functions, including the SWRC, SSCC, and HCF, were further established, as shown in Fig. 9. These curves describe the unsaturated hydraulic behavior of the selected soil and serve as the hydraulic input functions for the HYDRUS-2D simulations.
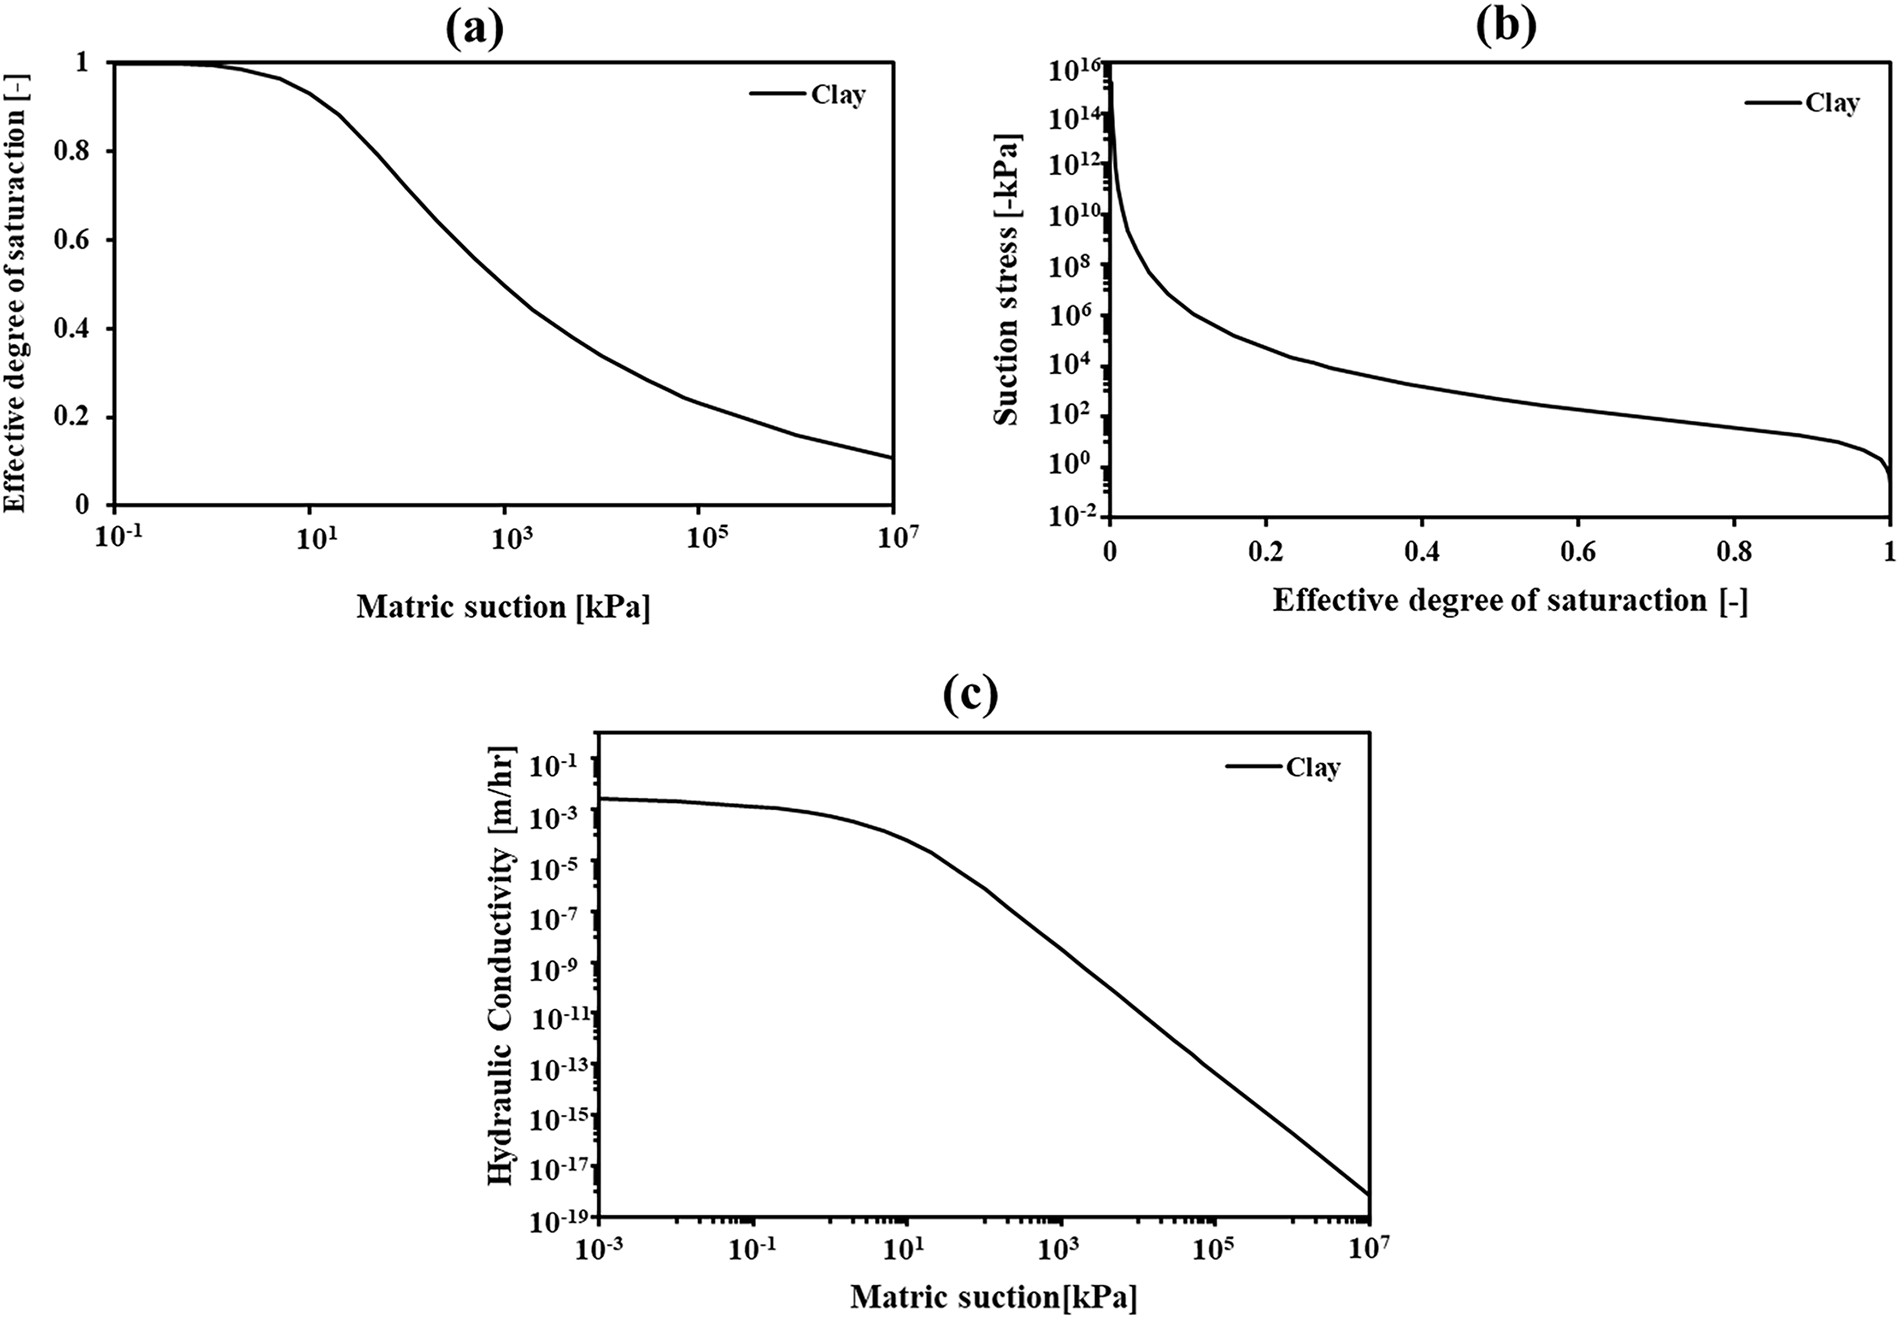
Figure 9: Hydraulic properties of materials (a) SWRC; (b) SSCC; (c) HCF.
3.2 Numerical Model Configuration and Boundary Conditions
In this study, the SW-01 rain gauge station was selected as the target location for analysis. A conceptual infinite slope model was established with a soil layer thickness of 4 m and a groundwater table located 26 m below the ground surface. Previous studies have reported that approximately 33.57% of the Babao-liao landslide area belongs to the sixth slope class (55%–100% slope, corresponding to a slope angle of approximately 29°–45°), representing the dominant slope category in the study area [57]. Therefore, a slope angle of 45°, corresponding to the upper limit of the sixth slope class, was adopted in this study.
The conceptual infinite slope model is illustrated in Fig. 10, with the simulation domain extending from the slope surface to the soil–bedrock interface. The initial hydraulic conditions were established under hydrostatic equilibrium, with the groundwater table assumed to be parallel to the slope surface and located below the bedrock. The upper boundary was specified as an atmospheric boundary condition, with excess rainfall automatically converted into surface runoff when the rainfall intensity exceeded the soil infiltration capacity. The left and lower boundaries were assigned as no-flux boundaries, whereas the right boundary at the soil–bedrock interface and the boundary below the bedrock were specified as seepage and constant-head boundaries (pressure head = 0 m), respectively. The hydrostatic equilibrium state was subsequently adopted as the initial condition for the transient rainfall infiltration simulations.
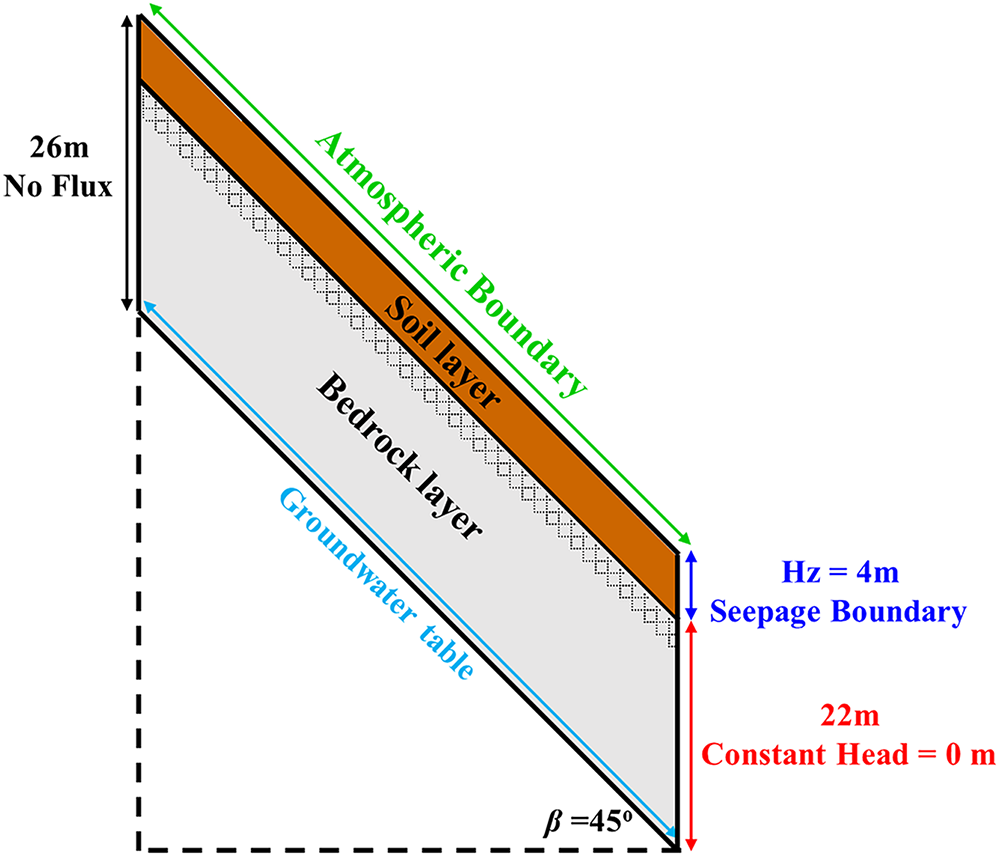
Figure 10: Hydrological boundary conditions of the numerical model.
The boundary and initial conditions used in the rainfall infiltration analysis are described as follows. The upper boundary was specified as an atmospheric boundary condition with a prescribed rainfall flux. Under unsaturated conditions, the rainfall intensity (Is) was applied to the slope surface as the infiltration flux. When the rainfall intensity exceeded the infiltration capacity of the soil and the surface became saturated, the actual infiltration flux was automatically governed by the soil hydraulic conductivity and the pressure head gradient.
Where Is denotes the rainfall intensity [LT−1], K(h) represents the hydraulic conductivity as a function of pressure head [LT−1], and ∂h/∂z is the pressure head gradient [-]. When the groundwater table is located at a depth of z = Hwt [L], the matric suction is zero:
Assuming hydrostatic equilibrium as the initial condition, the distribution of matric suction expressed as pressure head with depth can be expressed as follows:
This expression indicates that, under hydrostatic equilibrium, matric suction varies linearly with depth, and its distribution is mainly governed by the position of the groundwater table. This distribution was adopted as the initial condition for the subsequent rainfall infiltration analysis. Subsequently, in the transient infiltration analysis, rainfall intensity was incorporated into the calculation as the upper atmospheric flux boundary condition in the HYDRUS-2D model, as shown in Eq. (14). The Richards equation, Eq. (6), was then numerically solved to calculate the temporal and spatial variations in pressure head and volumetric water content within the slope under different rainfall intensities. The influence of rainfall intensity on volumetric water content was therefore reflected through the transient infiltration process. Finally, the simulated volumetric water content, or the corresponding effective degree of saturation derived from the SWRC, was converted into suction stress using Eq. (2).
Antecedent rainfall can cause natural slopes to deviate from hydrostatic initial conditions, thereby affecting the timing of shallow slope failure [23,58]. Based on the critical suction stress–depth profile shown in Fig. 4a, the average critical failure depth df of the slope in the study area is determined to be 1.78 m, and the critical hydrostatic depth dw is 0.98 m. Subsequently, by computing the volumetric water content profile under critical conditions, the average seepage velocity from the slope surface to the critical failure depth is estimated as Ks = 0.002 m/h. Accordingly, the antecedent rainfall duration DA for the study area can be calculated using Eq. (9):
The results indicate that the antecedent rainfall duration that should be considered for the study area is approximately 400 h, equivalent to about 16 days, suggesting that rainfall occurring within this period may exert a significant influence on slope stability. This finding is consistent with the results reported by Chen et al. [59], who analyzed 283 geological hazard events in Taiwan and identified a critical antecedent rainfall period ranging from 15 to 18 days. The agreement between these results demonstrates the rationality and reliability of the estimation proposed in this study.
4.1 Sensitivity Analysis of SWRC Assumptions
Rainfall infiltration is inherently a soil wetting process, and different assumptions regarding the SWRC may influence the infiltration process and slope stability analysis. Therefore, this study adopted the wetting-path assumption proposed by Yang and Yeh [18] to conduct a sensitivity analysis of the air-entry parameter (α). At the onset of rainfall, the hydraulic state of the soil follows the initial drying curve. As rainfall infiltration proceeds and the hydraulic path reverses, the hydraulic state transitions to the wetting scanning curve and gradually approaches the main wetting curve with increasing wetting. In the sensitivity analysis, the α value of the wetting path was set to 1.5 and 2 times that of the drying path (i.e., αw = 1.5αd and 2αd), while all other SWRC shape parameters were kept unchanged. The numerical model simultaneously accounts for hydraulic hysteresis in both the SWRC and the HCF, allowing the effects of the wetting path on water retention characteristics and unsaturated hydraulic conductivity to be reflected in the simulated rainfall infiltration, surface runoff, and slope failure delay. In addition, three representative rainfall intensities of 2, 4, and 8 mm/h, corresponding to approximately 0.5, 1, and 2 times the saturated hydraulic conductivity Ks, respectively, were selected to compare the influence of different SWRC assumptions under varying infiltration conditions.
The failure delay under different SWRC assumptions is summarized in Table 3. When the rainfall intensity exceeded the saturated hydraulic conductivity (I = 8 mm/h), the rainfall supply exceeded the infiltration capacity of the soil, resulting in surface runoff under all three scenarios. An increase in the α value shifted the wetting SWRC toward lower matric suction, resulting in lower matric suction at the same volumetric water content and consequently shortening the failure delay.

When the rainfall intensity was close to the saturated hydraulic conductivity (I = 4 mm/h), the wetting path caused the surface soil to approach saturation more rapidly, leading to earlier initiation of surface runoff. On the other hand, the wetting path produced lower matric suction at the same volumetric water content, allowing the soil to approach the critical failure state more rapidly. As a result, the differences among the various SWRC assumptions were relatively limited under this rainfall condition.
When the rainfall intensity was lower than the saturated hydraulic conductivity (I = 2 mm/h), the three SWRC assumptions resulted in different cumulative infiltration amounts. Under the drying-path assumption, rainfall continued to infiltrate into the soil with little restriction from surface runoff. In contrast, under the wetting-path assumption, hydraulic hysteresis reduced the unsaturated hydraulic conductivity represented by the HCF, allowing surface runoff to occur even under low-intensity rainfall conditions. The generation of surface runoff reduced the effective infiltration reaching the critical depth, thereby slowing the increase in volumetric water content and the dissipation of matric suction at that depth, ultimately prolonging the time required for the slope to reach the failure condition.
Overall, the differences in failure delay among the various SWRC assumptions under low-intensity rainfall conditions were approximately 10–15 h, corresponding to an approximately 5%–7% variation in the resulting rainfall intensity–duration (I–D) threshold curves. After considering the wetting path, the failure delay under low-intensity rainfall conditions increased because hysteresis in the HCF promoted surface runoff and reduced the effective infiltration reaching the critical depth, thereby prolonging the time required for water to propagate to the critical depth. In contrast, the I–D threshold curve established using the drying-path assumption with complete rainfall infiltration predicted an earlier failure time. Therefore, it can be regarded as the conservative lower bound of the predicted failure time window, maintaining a conservative basis for early warning when accounting for the uncertainty associated with the wetting-path assumption of the SWRC.
4.2 Sensitivity Analysis of Rainfall Intensity–Duration Threshold Curves
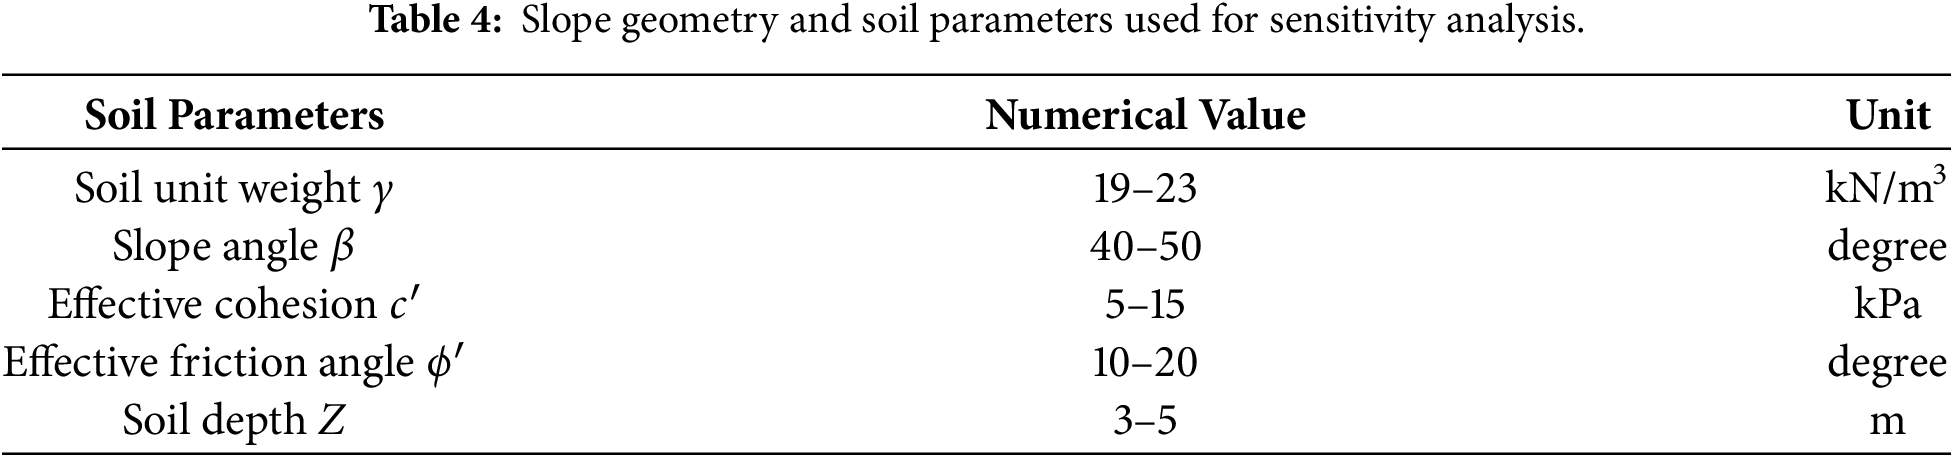
To evaluate the influence of various parameters on the critical suction stress curve and the rainfall intensity–duration threshold curve, a sensitivity analysis was conducted for the study area. Since the critical suction stress profile is derived from the limit equilibrium method in Eq. (5) under the condition of FS = 1, parameters such as soil unit weight, slope angle, internal friction angle, cohesion, and soil layer thickness directly affect the critical condition of the slope. These parameters further influence the position and shape of the I–D threshold curve. The parameter settings used in the sensitivity analysis are listed in Table 4.
The results of the sensitivity analysis are shown in Fig. 11. The degree of influence, ranked from highest to lowest, is cohesion > internal friction angle > soil unit weight > slope angle > soil layer thickness. Among these parameters, cohesion, which represents the intercept of the Mohr–Coulomb failure criterion, produces the largest upward and downward shifts in the threshold curve when varied. The internal friction angle has the second greatest influence. Soil unit weight and slope angle exert a moderate influence on failure delay by altering the gravitational driving component. In contrast, soil layer thickness has the weakest effect on the suction stress distribution and infiltration pathways. This is likely because, in the Babao-Liao case, the groundwater table is located far below the soil–bedrock interface, making it difficult for rainfall infiltration to induce groundwater level rise and deep-seated failure, thereby resulting in the lowest sensitivity. The results of this analysis not only serve as a basis for physical model calibration and parameter setting, but also suggest prioritizing field testing of highly sensitive parameters, such as cohesion and internal friction angle, in engineering practice. This approach improves the accuracy and reliability of rainfall threshold design under conditions of parameter uncertainty. The parameter sensitivity ranking established in this study can also serve as a reference for slope stability assessment and disaster prevention design.
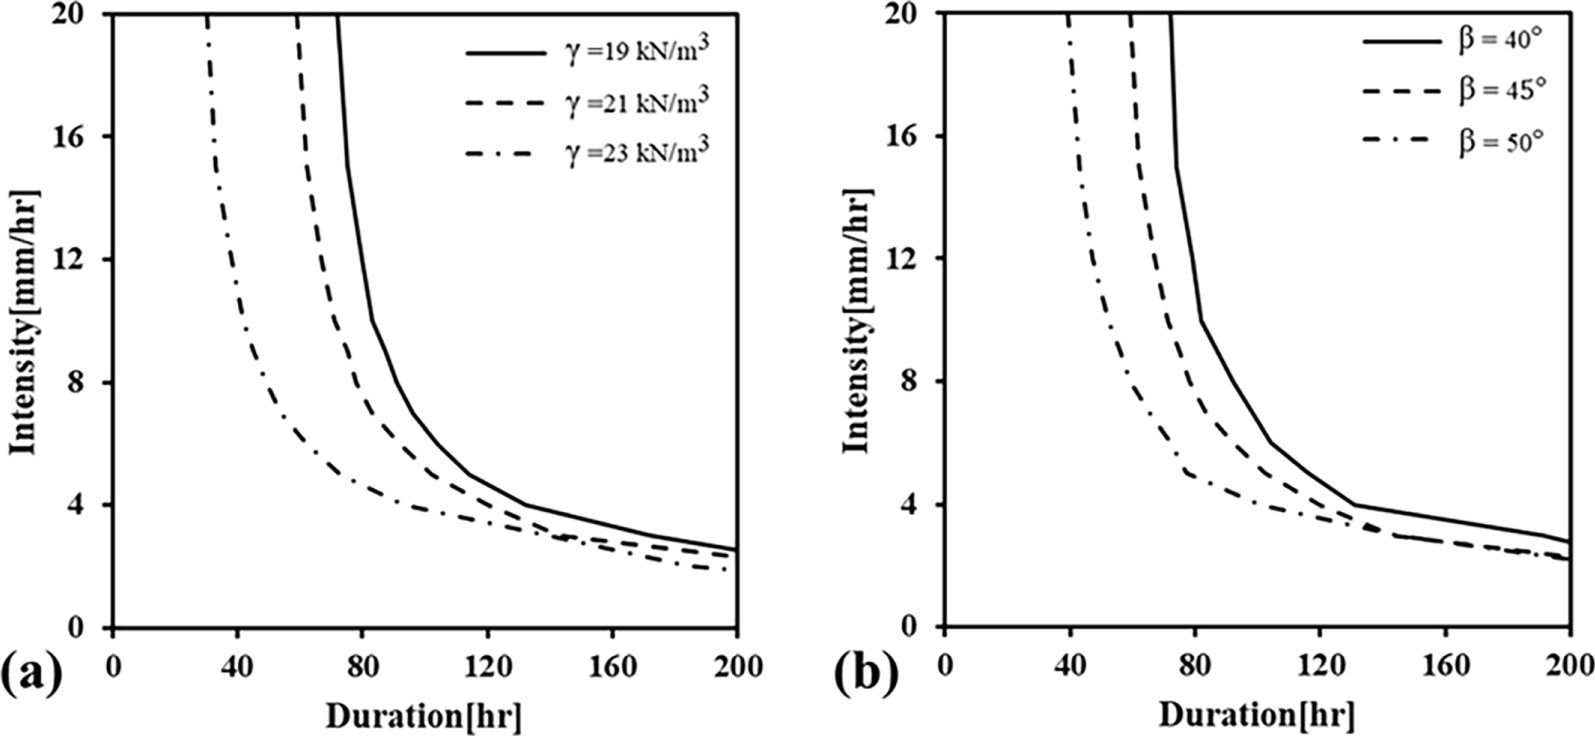
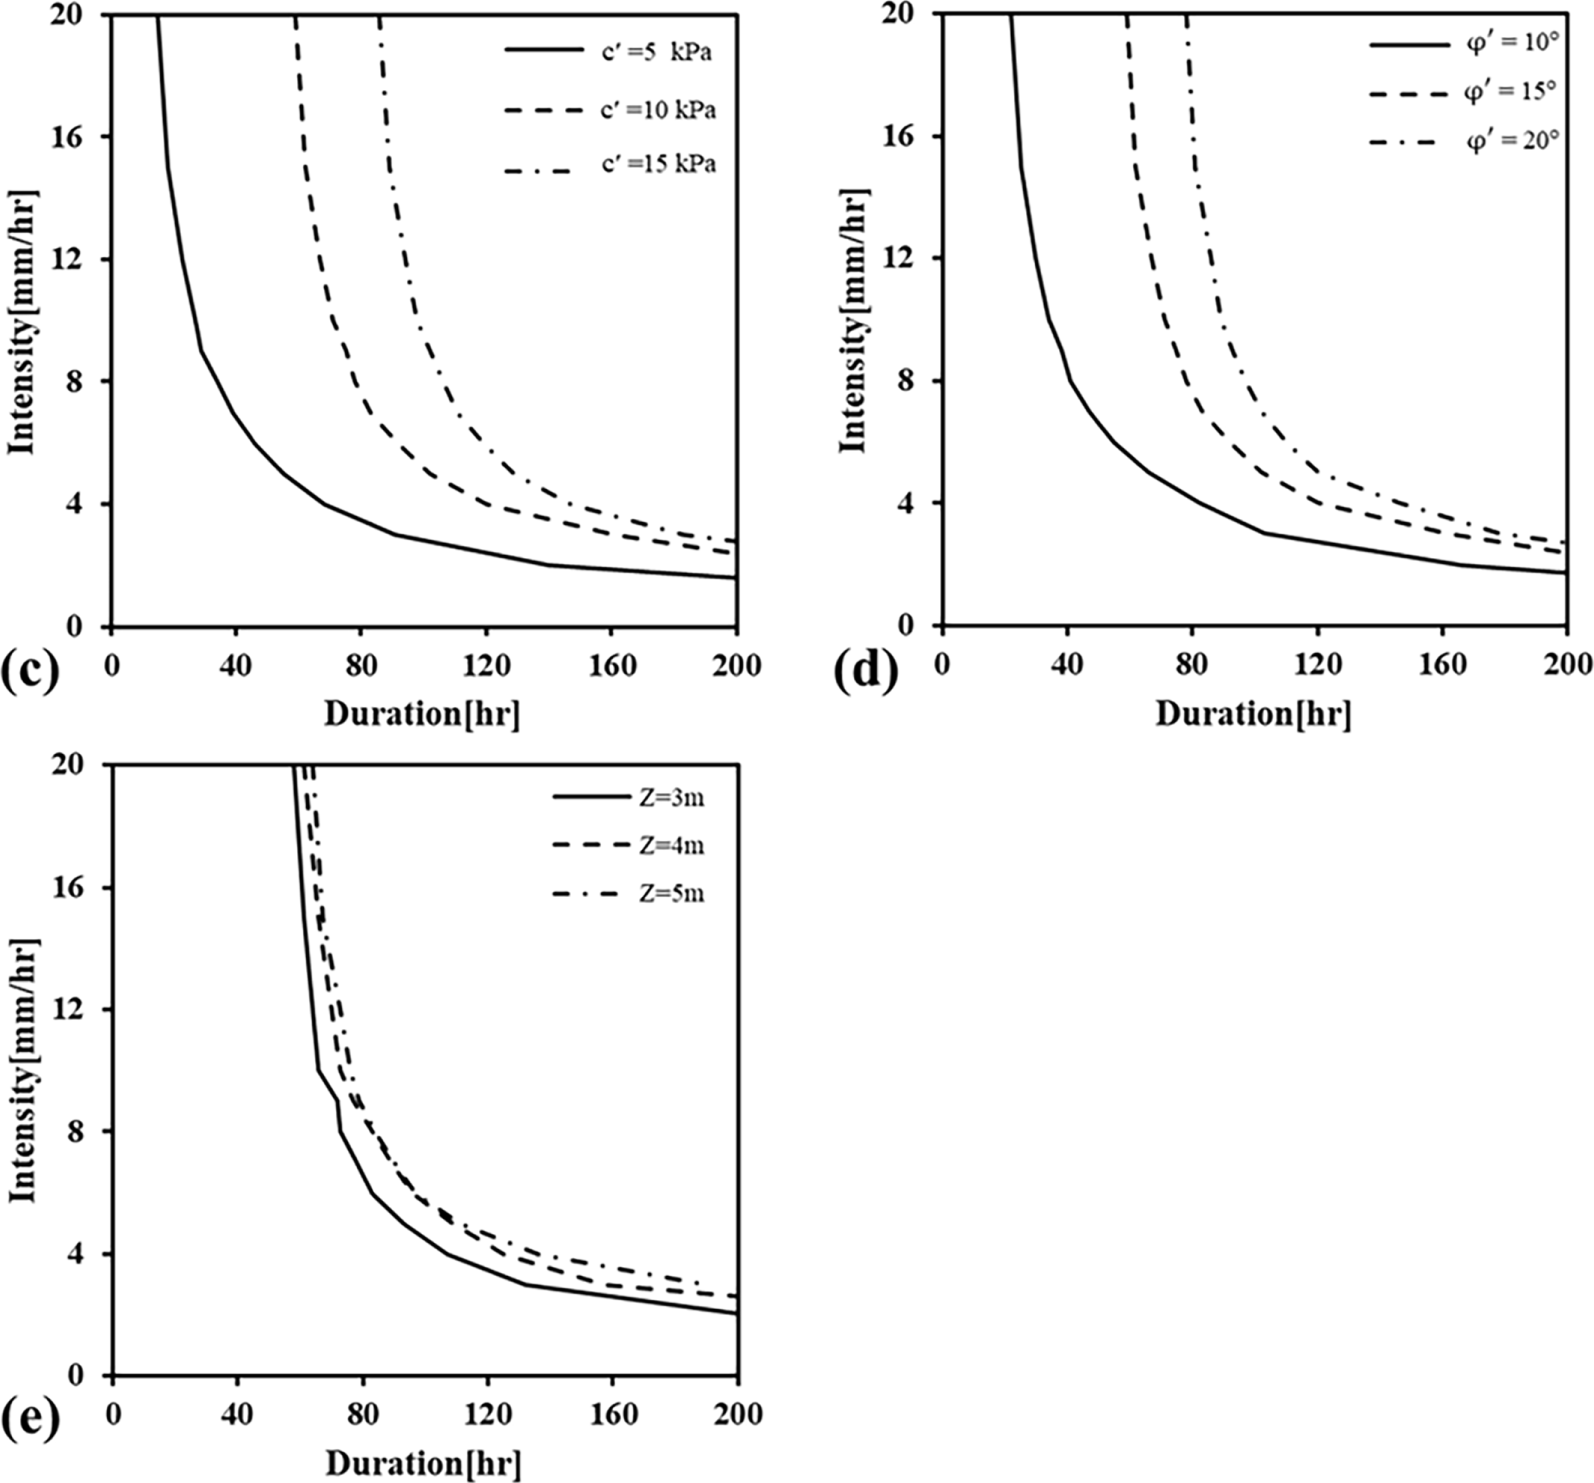
Figure 11: Sensitivity analysis of rainfall intensity–duration threshold curves to mechanical parameters: (a) unit weight, (b) slope angle, (c) cohesion, (d) friction angle, (e) soil thickness.
4.3 Influence of Rainfall Patterns on Infiltration Response and Threshold Relationships
To investigate the impact of different rainfall patterns on failure conditions, this study established three representative non-uniform rainfall patterns (advanced, intermediate, and delayed) based on uniform rainfall threshold conditions, and plotted their corresponding failure threshold curves. Referring to the four typical rainfall patterns used by Ran et al. [60], the rainfall distributions were redistributed based on the cumulative rainfall and rainfall duration defined by the uniform rainfall threshold curve, as shown in Fig. 12.
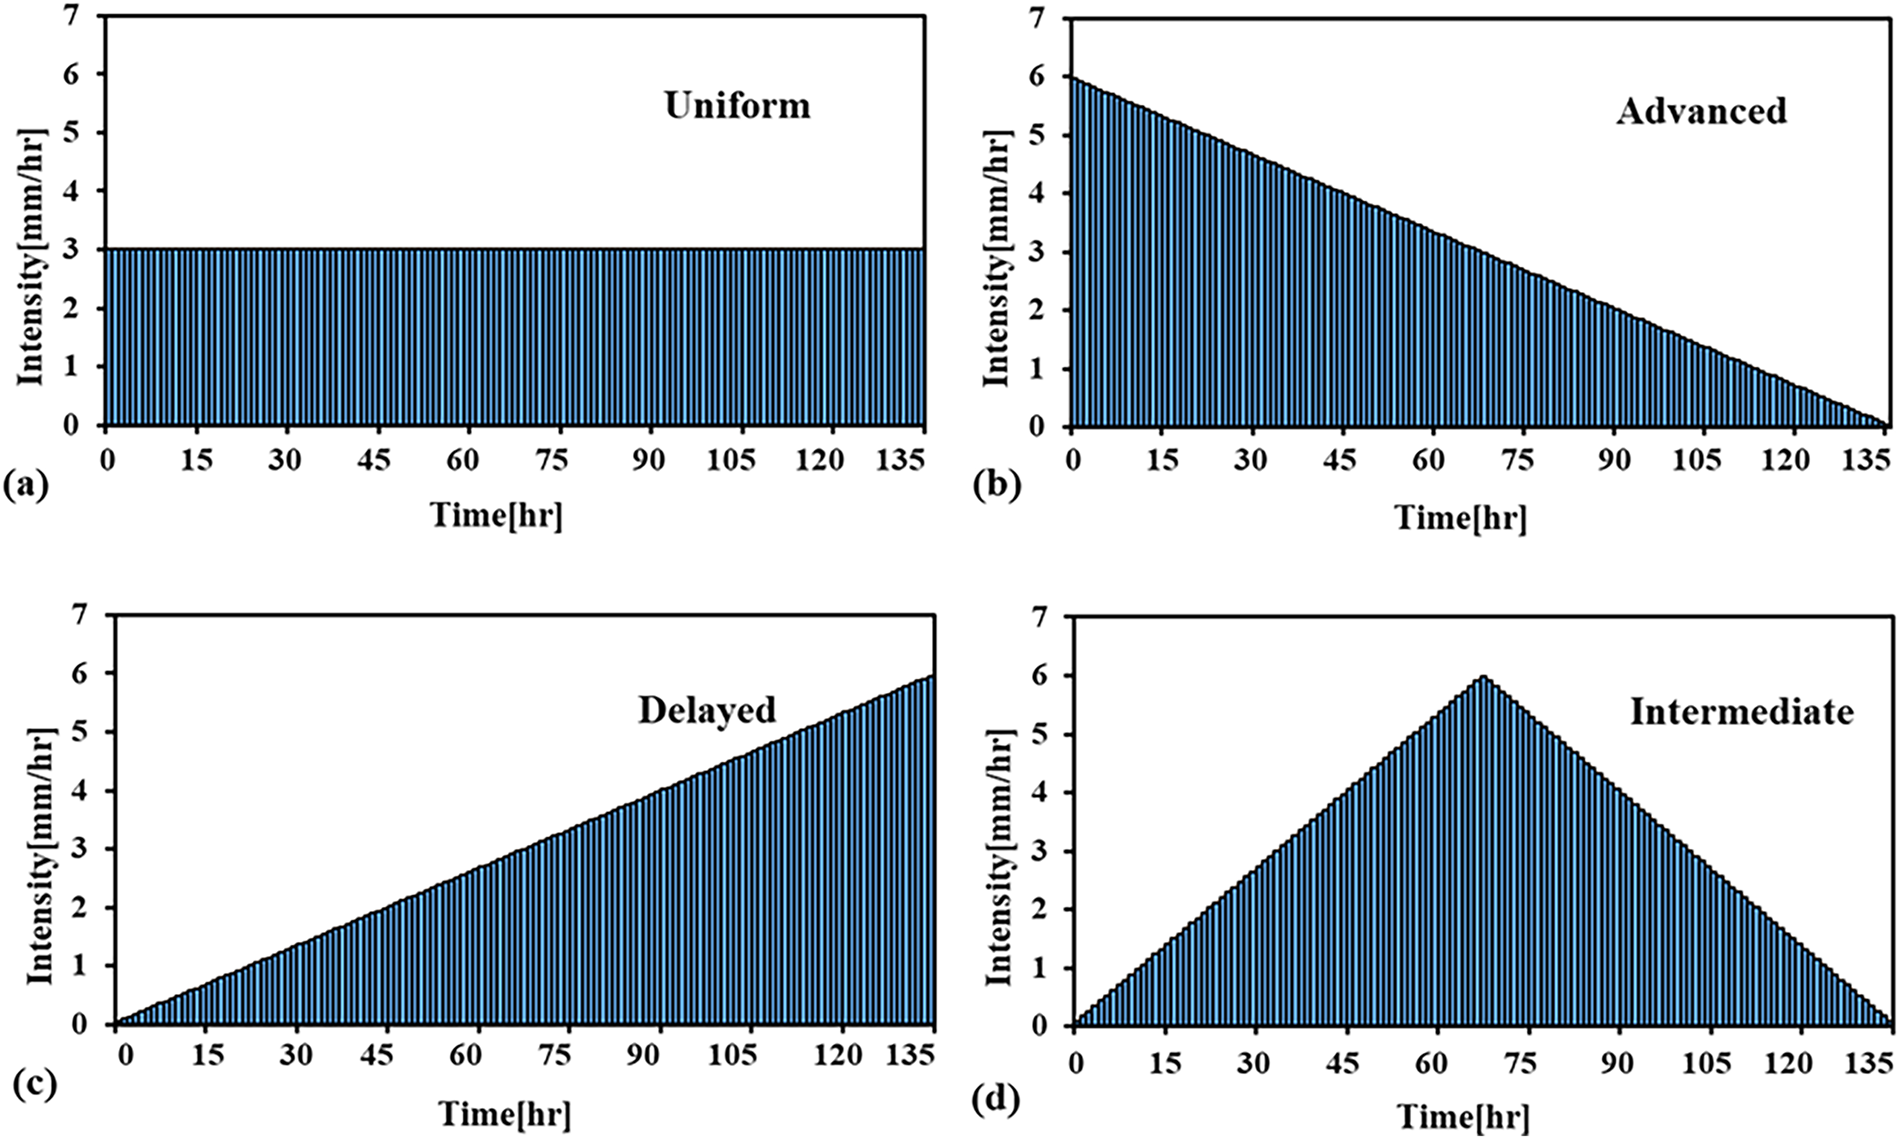
Figure 12: Typical rainfall patterns: (a) uniform, (b) advanced, (c) delayed, and (d) intermediate.
Fig. 13 illustrates changes in matric suction and suction stress at the critical failure depth for four typical rainfall patterns, with an average rainfall intensity of 3 mm/h and a rainfall duration of 136 h. The temporal variation in matric suction explains the differences in infiltration behavior induced by different rainfall patterns, while changes in suction stress reflect variations in the soil effective stress state. Among all rainfall patterns, the advanced rainfall pattern induces changes in matric suction at the earliest stage. The rapid increase in water content leads to an increase in suction stress, thereby allowing failure conditions to be reached earlier. This is followed by the uniform and intermediate rainfall patterns. Because uniform rainfall delivers a greater rainfall amount during the early stage than the intermediate pattern, the matric suction response occurs slightly earlier. Under uniform rainfall, the relatively steady infiltration rate causes suction stress to increase gradually, resulting in failure occurring later than under the advanced rainfall pattern. Meanwhile, the rainfall intensity of the intermediate pattern increases progressively over time, and the rate of matric suction reduction exceeds that of the uniform rainfall pattern during the middle stage of precipitation; however, subsequent changes in suction stress are insufficient to reach failure conditions. In contrast, the delayed rainfall pattern exhibits the latest onset of changes in matric suction, reflecting a pronounced delay in the infiltration process and consequently postponing the time at which the wetting front reaches the failure depth. Because the intermediate and delayed rainfall patterns are more prone to generating surface runoff, the resulting infiltration is insufficient to reach failure conditions. This indicates that variations in rainfall patterns modify the boundary infiltration conditions; therefore, assessing slope stability solely based on cumulative rainfall may underestimate the influence of rainfall temporal distribution on slope failure.
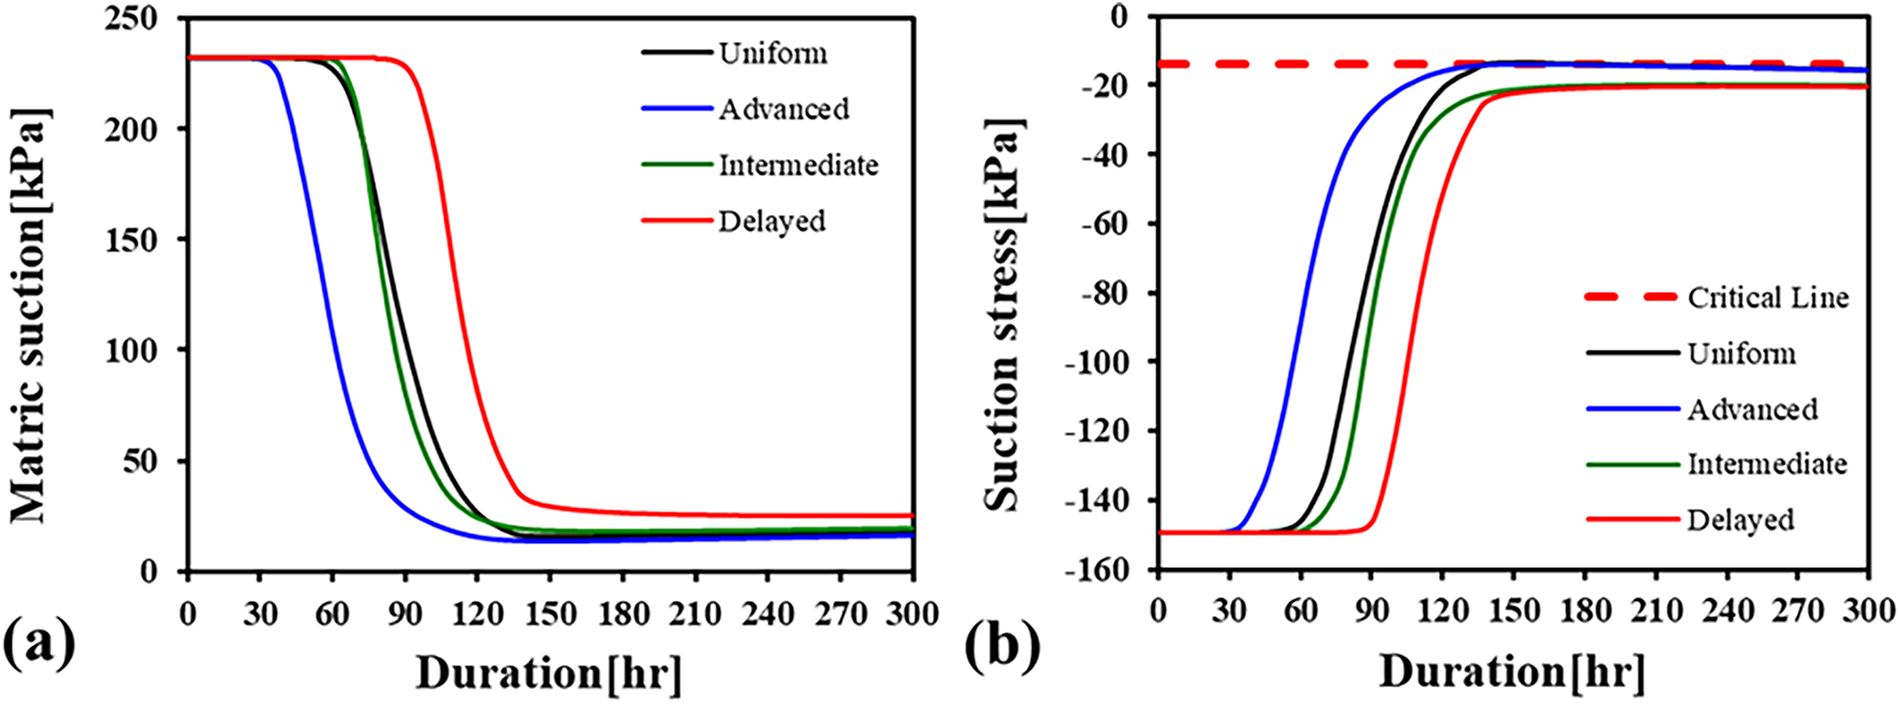
Figure 13: Analysis results of matric suction and suction stress at critical failure depth under four typical rainfall patterns: (a) matric suction and (b) suction stress.
These findings are consistent with those reported by Ran et al. [60], who also found that the advanced rainfall pattern triggered the earliest slope failure under identical rainfall depth and duration. Their study primarily attributed this behavior to greater infiltration during the early stage of rainfall. Similarly, the present study shows that the advanced rainfall pattern promotes earlier wetting-front propagation and suction stress reduction, leading to earlier failure. In contrast, the delayed rainfall pattern produced higher rainfall intensity in the later stage, when the slope surface was closer to saturation, thereby increasing surface runoff and reducing effective infiltration. As a result, the delayed rainfall pattern did not trigger failure under the conditions considered in this study. While Ran et al. [60] mainly focused on the influence of rainfall patterns on failure timing, the present study further demonstrates that these differences in infiltration behavior are reflected in the distribution of physically based rainfall intensity–duration (I–D) threshold curves, highlighting the importance of considering rainfall temporal distribution in physically based slope early warning.
The rainfall intensity–duration threshold curves under different rainfall patterns are shown in Fig. 14. For the intermediate and delayed rainfall patterns, the changes in suction stress within the slope do not reach the critical failure value under any rainfall condition because the infiltrated rainfall is insufficient. Consequently, a critical state cannot be achieved, and corresponding rainfall threshold curves cannot be established. In contrast, the advanced rainfall pattern typically results in delayed failure under most conditions (I > Ks), because the excessively high rainfall intensity during the early stage causes a large portion of rainfall to be converted into surface runoff. However, when the rainfall intensity I is less than or equal to the saturated hydraulic conductivity (Ks), compared with uniform rainfall, the advanced rainfall pattern promotes infiltration and rapid downward migration of the wetting front due to intense early rainfall. This leads to a rapid decrease in suction stress within the slope and allows failure conditions to be reached earlier, advancing the failure time by approximately 6–30 h. When the rainfall intensity decreases to 1.5 mm/h, the difference in failure delay between the advanced and uniform rainfall patterns reaches a maximum of 30 h. This indicates that the advanced rainfall pattern is more likely to trigger failure under identical rainfall conditions and thus exhibits higher hazard potential. Therefore, the threshold curve associated with the advanced rainfall pattern can serve as an important basis for issuing earlier warnings in the early warning system, providing effective alerts before slope failure occurs.
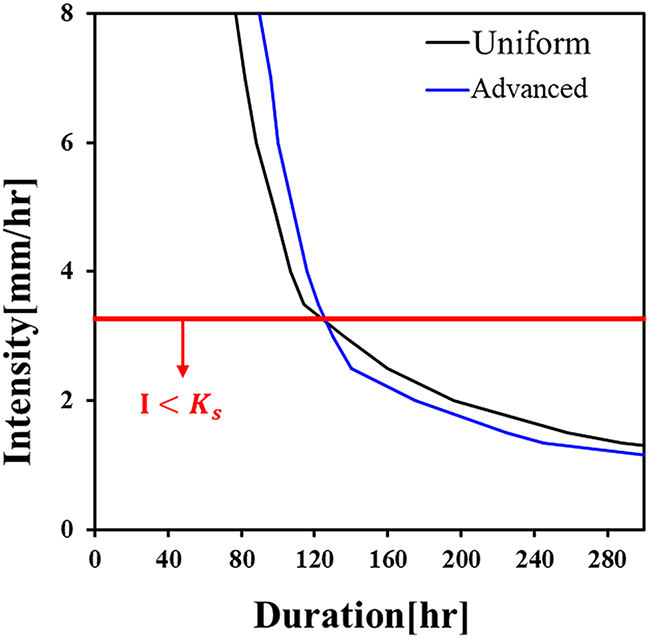
Figure 14: Rainfall threshold curves for multiple rainfall patterns (failure not triggered under intermediate and delayed rainfall conditions).
4.4 Application of the Slope Failure Early Warning System to the Study Case
Rainfall-induced shallow slope failures depend, to a significant extent, on the actual amount of water infiltrating into the slope body rather than solely on rainfall patterns themselves. In comparison, infiltration amount more directly reflects the potential impact of rainfall on changes in slope moisture conditions and stability. Differences in infiltration rates may also cause failure timing to occur earlier or later, thereby affecting the accuracy of early warning timing. Therefore, under conditions where the rainfall intensity I is less than or equal to the saturated hydraulic conductivity (Ks), that is, when rainfall can fully infiltrate into the slope, the slope early warning system proposed in this study uses the combined “advanced + uniform” rainfall patterns as the criterion for identifying failure conditions. This approach encompasses the range of infiltration variations potentially induced by different rainfall patterns, thereby enhancing the conservativeness and practical applicability of risk assessment.
The prediction results of this study are evaluated with reference to two different rainfall threshold curves, corresponding to the “Predicted Failure Time” and the “Warning Time”, as illustrated in Fig. 15. The predicted failure time is estimated based on the uniform rainfall threshold curve, which represents failure timing under antecedent wetting conditions where the initial infiltration state has approached a relatively stable condition, and is therefore considered representative of failure timing under most rainfall scenarios. Therefore, it serves as the primary basis for decision-making in the early warning system. The warning time is estimated using the advanced rainfall threshold curve. Under rainfall conditions where the rainfall intensity is lower than or equal to the saturated hydraulic conductivity (I ≤ Ks), the advanced rainfall pattern may result in earlier failure due to the temporal distribution of rainfall. Therefore, it is used as a supplementary reference for issuing earlier warnings in the system. To characterize the temporal distribution of actual rainfall and rainfall patterns, this study employs the QPF issued by the Central Weather Administration as input for subsequent rainfall simulations and failure timing prediction. The minimum forecast update interval of the QPF is 6 h. Considering practical operational requirements and consistency with the QPF forecast timescale, the permissible error range for predicted failure timing is set to 6 h.
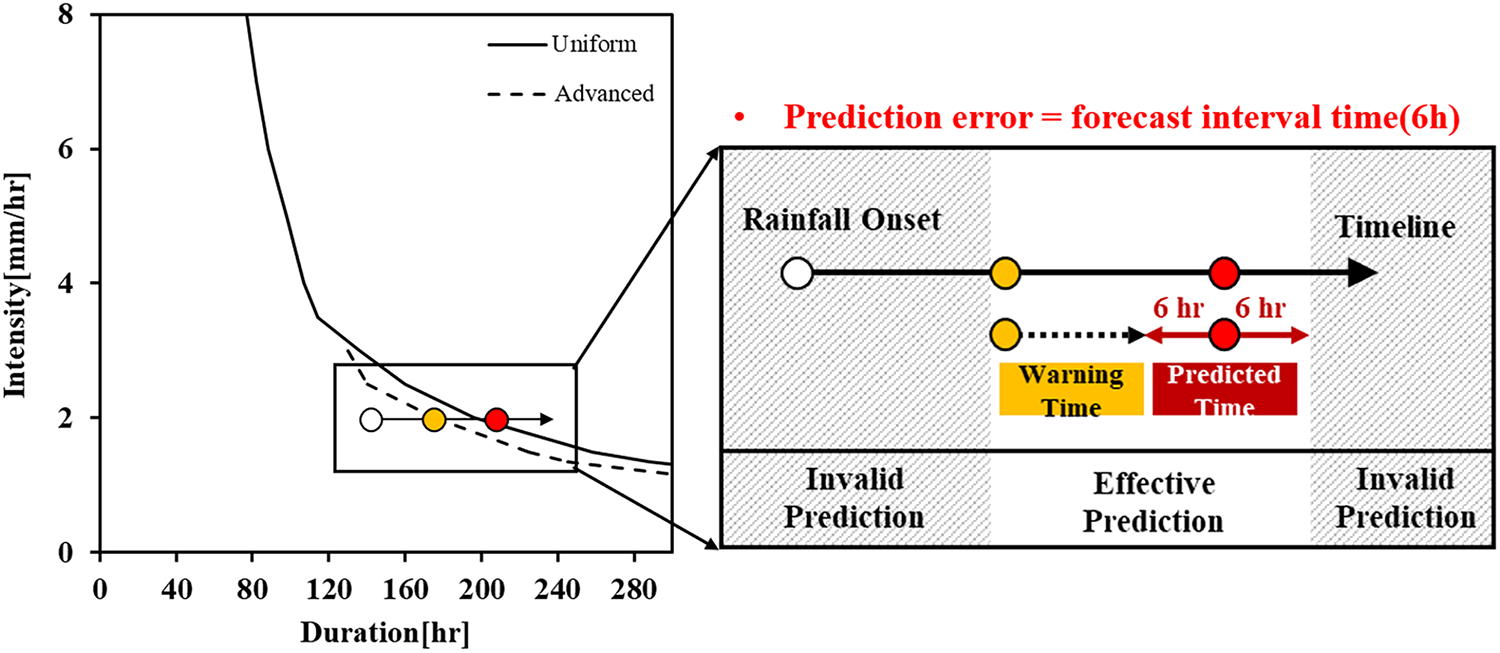
Figure 15: Criteria for slope failure early warning.
This study used slope failure data from the Babao-Liao area in Chiayi County on 3 August 2021 as a validation case. The effectiveness of the developed slope failure early warning system was evaluated by comparing the simulated failure time with the actual failure occurrence time. The criteria for identifying slope failure events follow the Technical Guidelines for Landslide Countermeasure Design and Implementation proposed by the Japan Landslide Countermeasure Technical Association in 1978, in which a daily displacement exceeding 0.1 mm is defined as significant movement. For the rainfall event considered, the cumulative displacement reached 1.06 mm over a duration of 144 h, satisfying the definition of significant movement and thus serving as the basis for subsequent validation of the early warning system performance. If the discrepancy between the simulated prediction time and the actual failure time is within 6 h, meaning that the error is smaller than the rainfall forecast interval, it is considered an effective prediction. Conversely, if the discrepancy exceeds 6 h, it is classified as an ineffective prediction. Furthermore, if the actual failure time falls between the warning time and the predicted failure time, although the exact timing of failure is not precisely predicted, the early warning system can still issue warnings before actual damage occurs. Therefore, this scenario is also categorized as an Effective Prediction, as illustrated in Fig. 15.
4.4.1 Influence of Rainfall Data Completeness on Predicted Failure Time
Since rainfall serves as a critical input variable in this study, its accuracy directly determines the reliability of slope failure early warning systems. To investigate the impact of rainfall data completeness on the accuracy of slope failure prediction, this study evaluates the performance of the proposed early warning system under three rainfall data scenarios: (A) high data completeness with high accuracy, (B) high data accuracy but incomplete coverage, and (C) high data completeness but insufficient accuracy. Under these three data-condition settings, the impacts of antecedent rainfall duration and data completeness on the prediction of slope failure timing can be systematically evaluated. This approach also allows verification of the applicability of the proposed early warning system under different data availability conditions encountered in practical applications. In this study, the scenario design is based on the rainfall data associated with Slope Failure Event, and the complete rainfall event is illustrated in Fig. 16a. The early warning system detected that the cumulative rainfall over the preceding 24 h reached 10 mm at 12:00 on 3 August, and this time was therefore identified as the rainfall onset (green line). According to the rainfall field segmentation method, the 400-h antecedent rainfall period was divided into four individual rainfall events. Based on the antecedent rainfall duration correction, the results indicate that antecedent rainfall Events (1) and (2) are effective for predictive analysis.
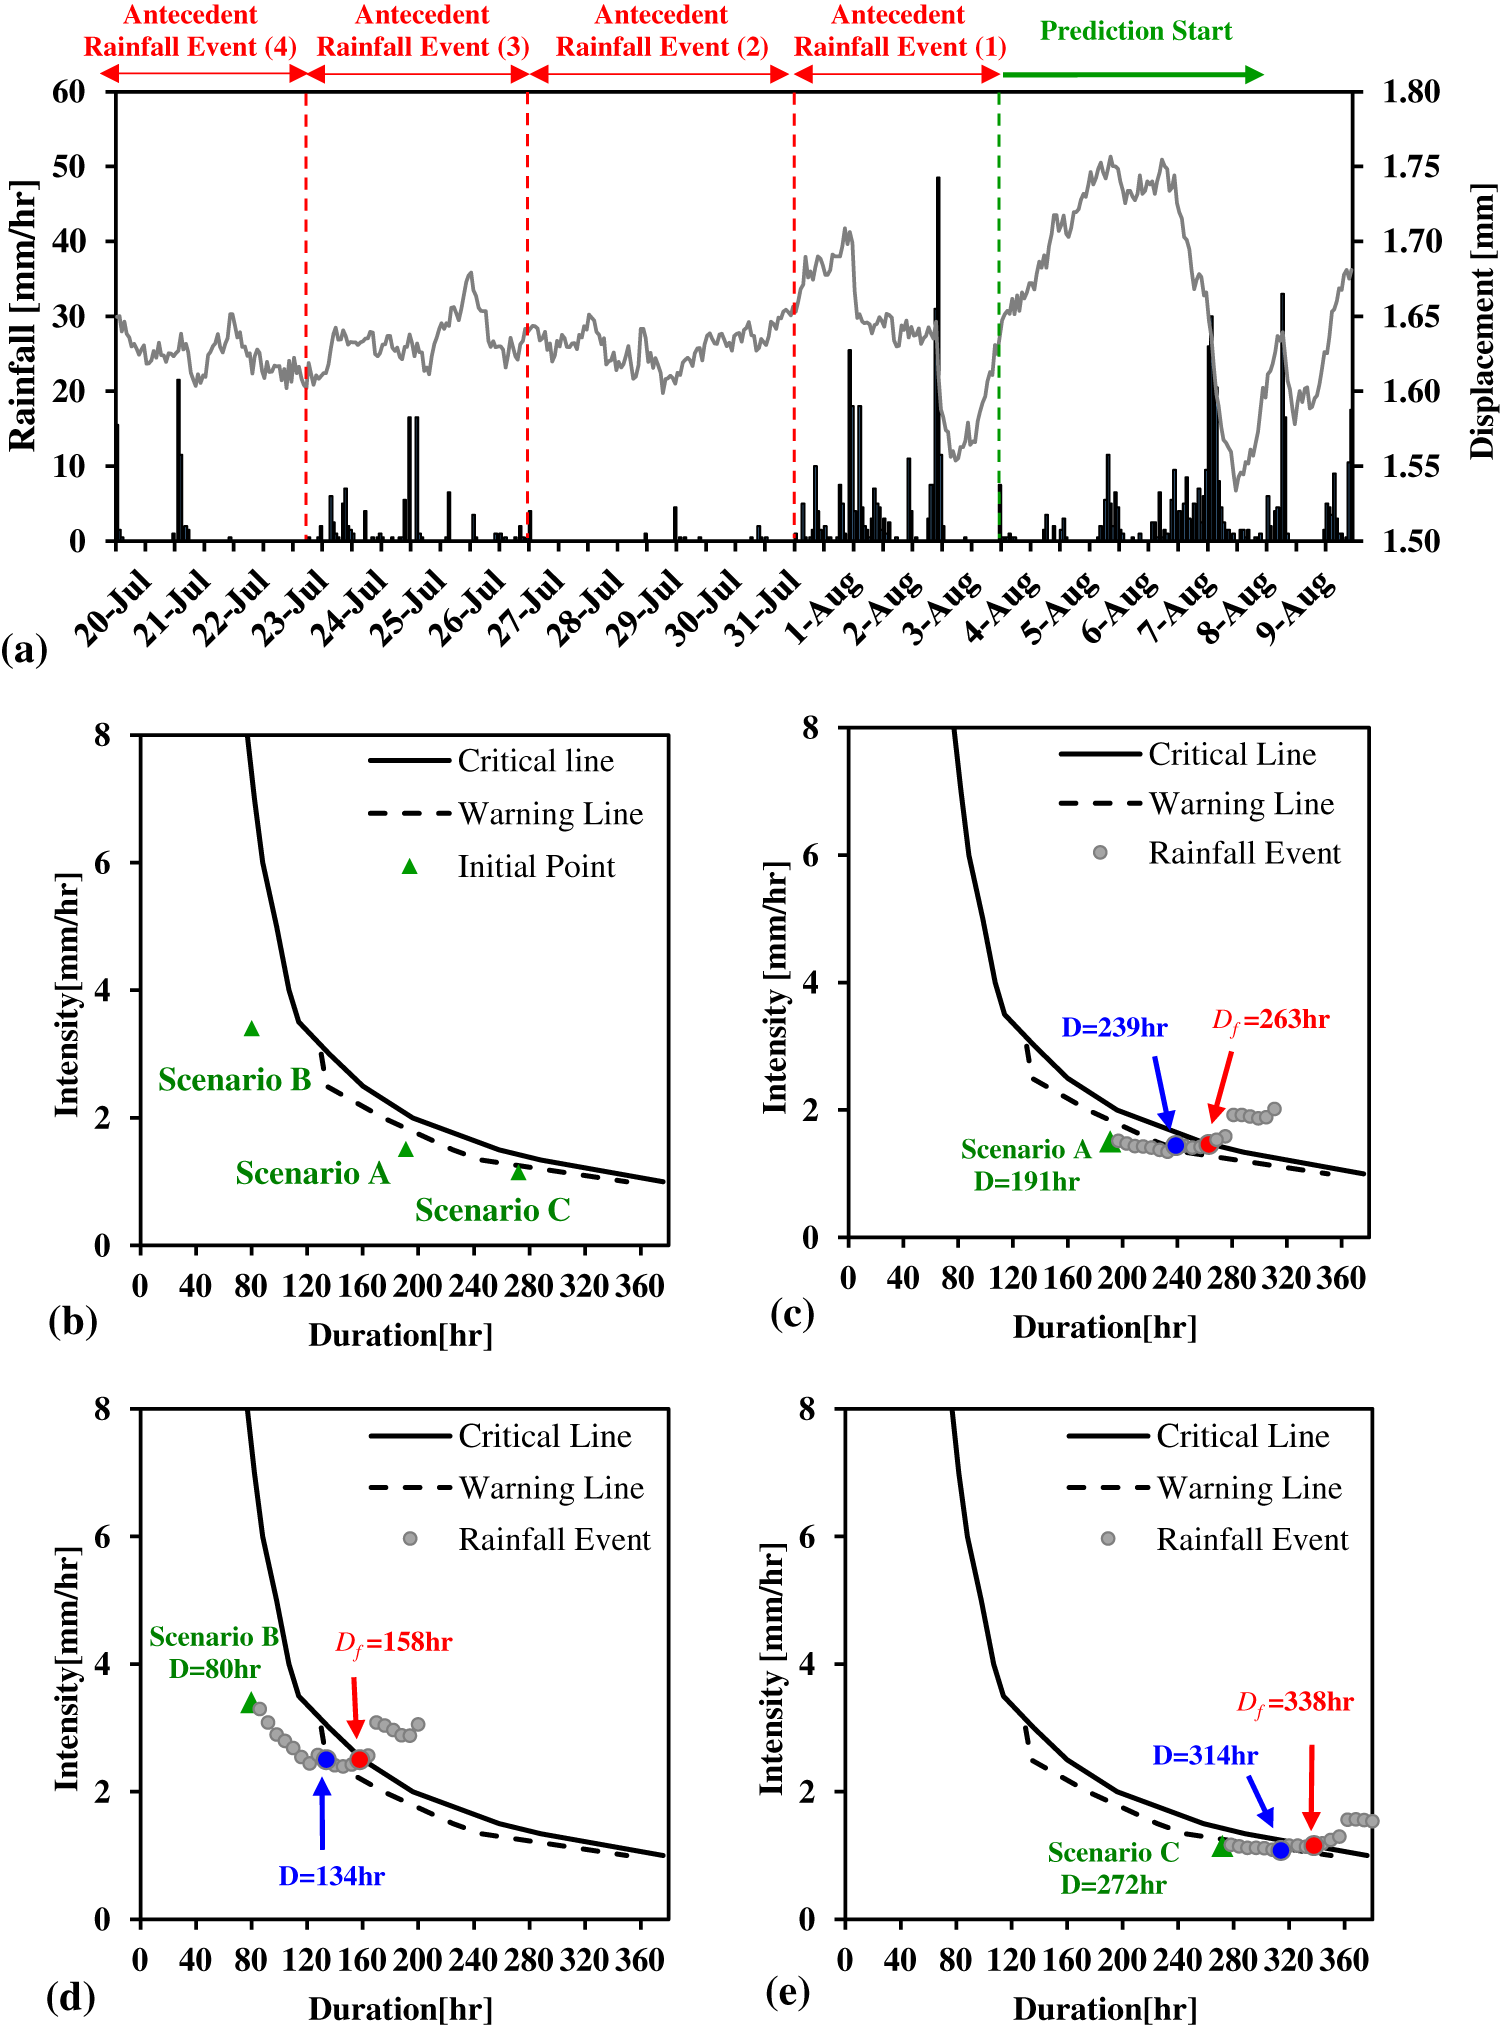
Figure 16: Slope failure event: (a) rainfall data and rainfall event segmentation, (b) initial points under different scenarios, (c) complete rainfall data, (d) incomplete rainfall data, and (e) measurement error rainfall data.
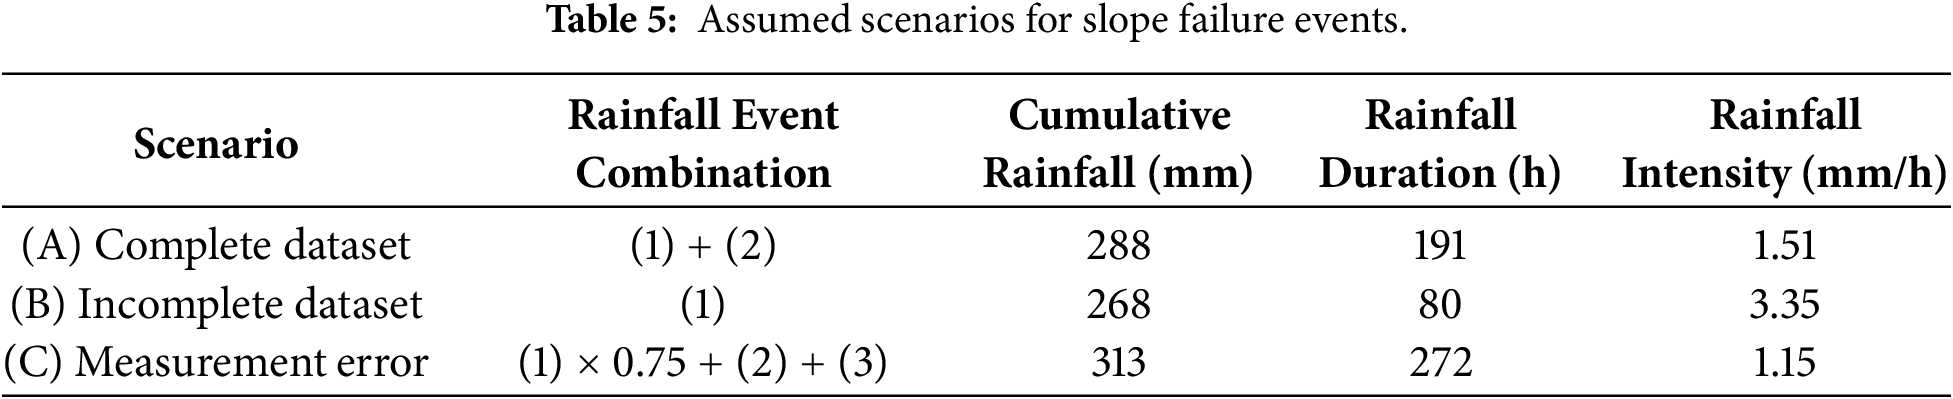
The three rainfall scenarios designed in this study are summarized in Table 5. Scenario (A) represents a case with complete rainfall data, in which the antecedent rainfall includes two complete rainfall events. Scenario (B) represents a case with incomplete data, where the rainfall record covers only part of the critical period; in this scenario, rainfall data are assumed to include only rainfall Event (1), while data from other rainfall events are missing. Scenario (C) represents a case with potential rainfall measurement errors, where the rainfall data are assumed to be affected by spatial heterogeneity. In this scenario, the cumulative rainfall of Event (1) is reduced by 25%, and rainfall Event (3) is incorporated to compensate for the total rainfall amount, provided that slope stability is not affected. This scenario design is intended to mitigate the impacts of data completeness and spatial heterogeneity on slope stability prediction, thereby enabling an evaluation of the model’s adaptability under uncertain conditions.
In this study, the onset of slope failure was identified based on observed displacement data, where the hourly displacement of the monitored gray points exhibited a clear downward movement and the spacing between points gradually increased. This behavior was regarded as an indicator of slope failure initiation. Accordingly, slope failure was confirmed to have occurred at 07:00 on 6 August, corresponding to the 67th hour after rainfall onset, as shown in Fig. 16a. Following the initiation of rainfall at 12:00 on 03 August, the rainfall distribution prior to the actual slope failure was relatively uniform. The maximum cumulative rainfall over any 6-h period was only 31 mm, indicating that even in the absence of extreme rainfall intensity, failure could still be triggered by persistently accumulated rainfall. The initial points for the three comparative scenarios are illustrated in Fig. 16b.
The predicted failure time under conditions of complete rainfall data is shown in Fig. 16c. After the slope experienced 191 h of antecedent rainfall, it entered the subsequent rainfall stage. Through continuous integration of rainfall forecasts within the early warning system, slope failure predictions were repeatedly updated. The results indicate that the rainfall prediction point intersected the warning line at the 239th hour and reached the critical threshold line at the 263rd hour. This outcome suggests that within 24 h after reaching the warning line, the slope may undergo premature failure due to sudden changes in rainfall patterns. At this stage, the rainfall conditions had already reached the critical state for slope failure, implying that failure could occur at any time. In contrast, the predicted failure time under conditions of insufficient antecedent rainfall data is shown in Fig. 16d. After the slope experienced 80 h of antecedent rainfall, the rainfall prediction point intersected the warning line at the 134th hour, and subsequently reached the critical threshold line at the 158th hour, indicating that the rainfall conditions had reached the critical state for slope failure. This scenario indicates that insufficient antecedent rainfall data cannot adequately represent the accumulation of soil moisture within the slope, thereby affecting the determination of initial conditions and leading to deviations in the prediction results. The predicted failure time under conditions of insufficient rainfall data accuracy is shown in Fig. 16e. In this scenario, the cumulative rainfall of rainfall event (1) was reduced by 67 mm, and rainfall event (3) was incorporated to compensate for the total rainfall amount. After the slope experienced 272 h of antecedent rainfall, the rainfall initiation point was located near the warning line. However, the rainfall prediction point did not intersect the warning line until the 314th hour, indicating that subsequent rainfall was relatively weak and that the warning threshold was reached mainly through steady cumulative rainfall. The prediction point then reached the critical threshold line at the 338th hour, signifying that the slope had entered the critical state for failure.
These results suggest that even when rainfall data contain measurement errors, as long as the cumulative rainfall is reasonably represented, reliable prediction of slope stability can still be maintained.
This study compared the prediction results under the three scenarios with the observed displacement data, as shown in Fig. 17.
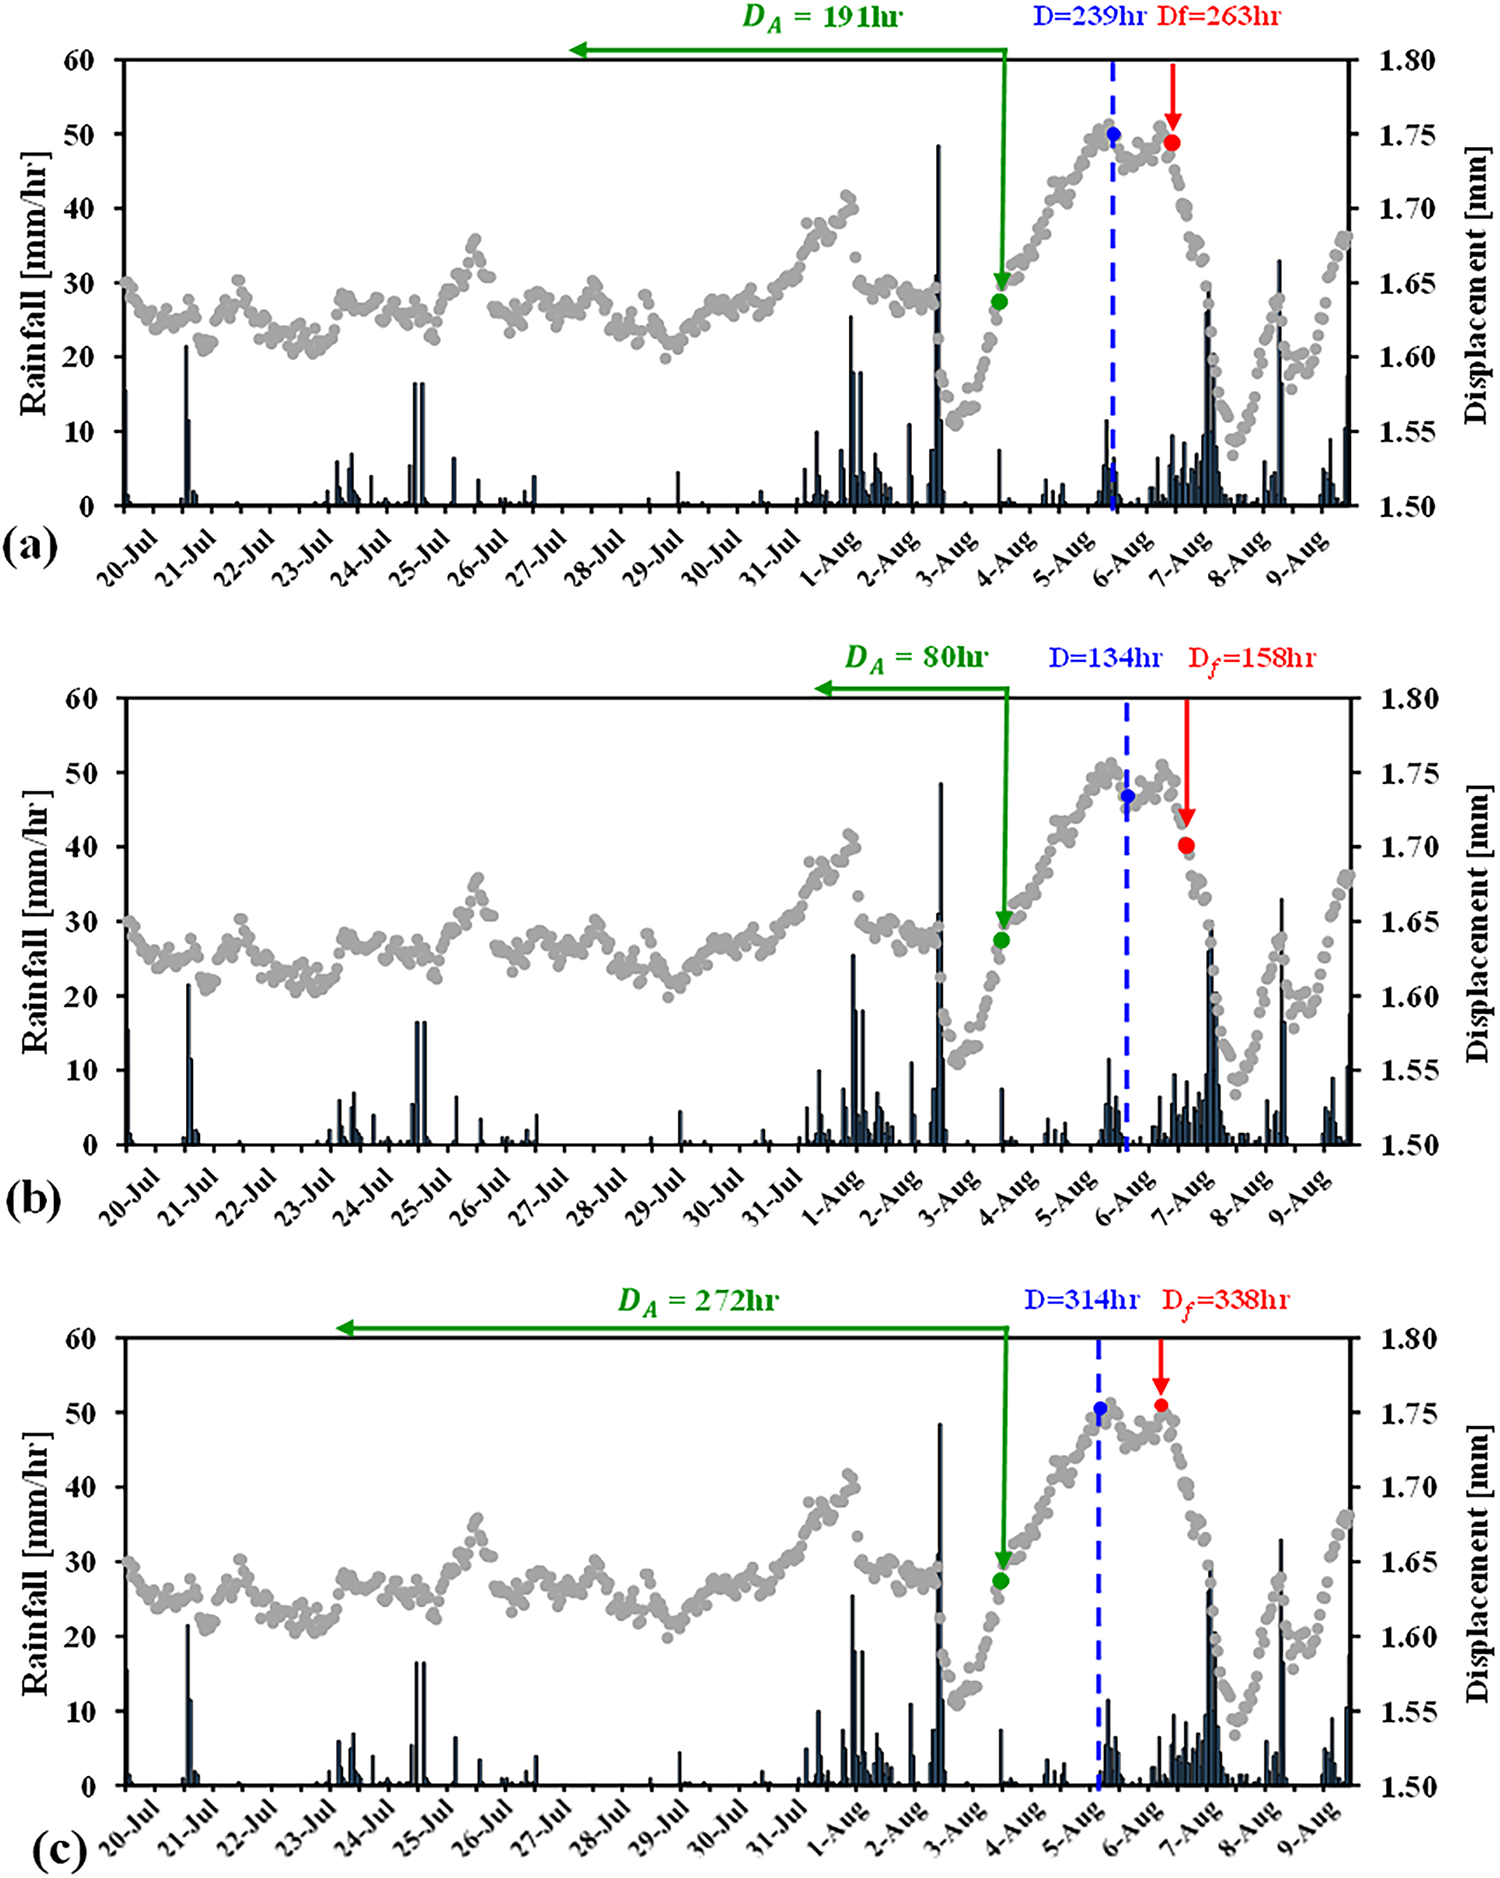
Figure 17: Prediction results of slope failure events: (a) complete rainfall data, (b) insufficient rainfall data, and (c) missing rainfall data.
• Scenario A: The predicted failure time was 12:00 on 06 August. The discrepancy between the predicted and actual failure times was smaller than the rainfall forecast interval (6 h) and can therefore be regarded as an effective prediction.
• Scenario B: The predicted failure time was 18:00 on 06 August, which is 11 h later than the actual failure time. This exceeds the allowable prediction error range defined in this study (6 h), and according to the prediction criteria, the result should be classified as an ineffective prediction. However, under this scenario, the warning time was issued 12 h prior to the actual failure, indicating that the early warning system was still capable of providing advance alerts despite incomplete rainfall data. Therefore, this prediction result can be revised and classified as an effective prediction.
• Scenario C: The predicted failure time was 06:00 on 06 August. In this scenario, the cumulative rainfall amount of rainfall Event (1) was reduced by 25%, and rainfall Event (3) was additionally incorporated into the antecedent rainfall estimation process to account for rainfall measurement uncertainty and spatial heterogeneity. The difference between the predicted failure time and the actual failure time was only 1 h. These results indicate that the proposed antecedent rainfall estimation method can maintain reliable predictive capability under rainfall measurement uncertainty and spatial heterogeneity.
The results indicate that even when anomalies occur in the rainfall data, the early warning system is still able to issue effective warnings prior to actual slope failure through the establishment of a slope failure warning time, demonstrating a certain degree of fault tolerance. However, the accuracy of the predicted failure time remains influenced by the completeness of rainfall data, with more complete datasets leading to more accurate predictions. When the cumulative rainfall amount of rainfall event (1) is reduced by 25%, the early warning system is still capable of accurately predicting the slope failure time. This suggests that the early warning system proposed in this study does not rely on high-precision rainfall data; nevertheless, a minimum level of data accuracy is still required. When data errors exceed a critical threshold, the prediction accuracy decreases significantly.
4.4.2 Early-Warning Accuracy Analysis
This study uses the Babao-Liao landslide site in Chiayi County, Taiwan, as the research case. Rainfall and slope displacement data measured at the SW-01 monitoring station in 2021 and 2023 were adopted to analyze the prediction accuracy of the practical early-warning system. According to the rainfall event segmentation method described in Section 2.4, a total of 36 rainfall events were identified, among which 15 events exhibited a daily cumulative displacement exceeding 0.1 mm/day and were therefore classified as landslide events. The definition of a landslide event follows Section 4.4, with daily cumulative displacement exceeding 0.1 mm/day serving as the criterion for determining landslide events. When the rainfall forecast point reaches the threshold curve for either the advanced-type or uniform-type rainfall pattern, the model is deemed to have issued a warning signal. Based on this event classification, the results of the error matrix are summarized in Table 6.

Based on the classification results of the error matrix, the predictive performance evaluation indicators of the model were calculated. The resulting POD, FAR, and TS are 0.60, 0.00, and 0.60, respectively. These results indicate that the early-warning system can effectively avoid false alarms, but its ability to detect landslide events remains relatively limited. However, the displacement threshold specified in the technical guidelines may not necessarily be applicable to case slopes in different regions. Its applicability may still be influenced by variations in geological conditions and slope characteristics; therefore, further verification and adjustment are required in practical applications.
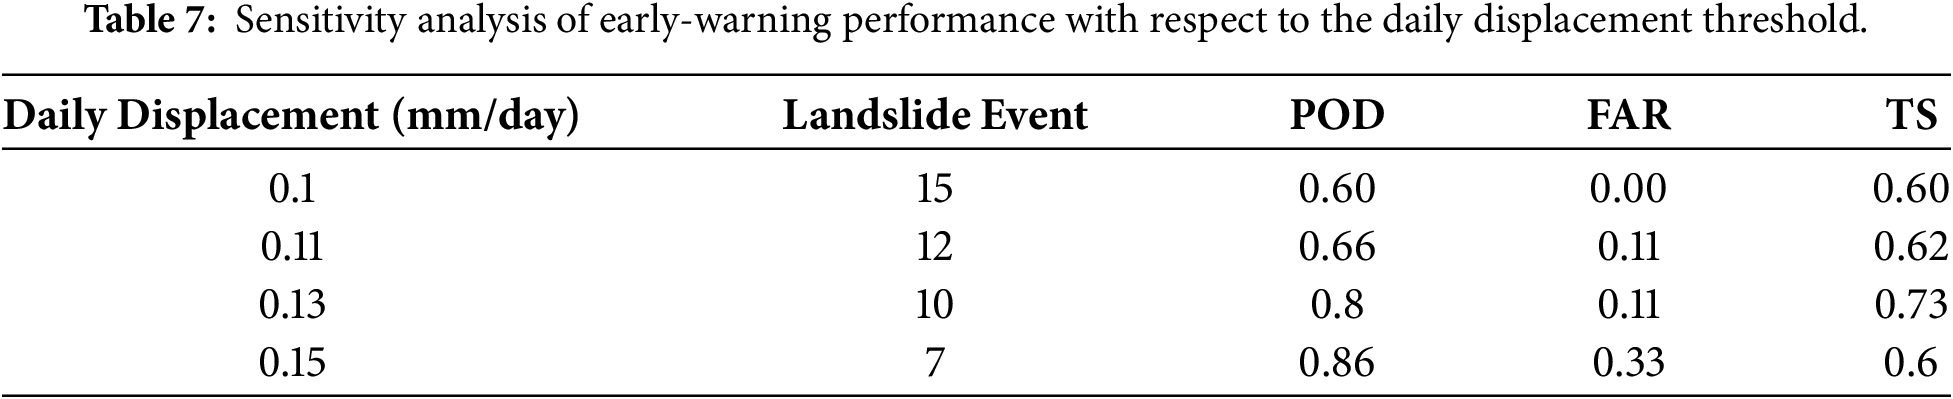
Therefore, this study conducted a sensitivity analysis on the daily displacement threshold used to define landslide events in order to investigate the influence of different displacement thresholds on the predictive performance of the model and to identify the threshold that yields the optimal prediction accuracy. The analysis results are shown in Table 7. As the daily displacement threshold gradually increases, the number of rainfall-induced failure events defined in the dataset correspondingly decreases. The increase in the POD indicates that raising the displacement threshold helps reduce missed events (Misses). However, when the displacement threshold becomes excessively high, some events previously classified as hits are no longer identified as landslide events, which consequently increases the proportion of false alarms and leads to an increase in the FAR. Considering the combined effects of hits, misses, and false alarms, this study adopts the TS—which better reflects the overall predictive performance of the early-warning system—as the criterion for determining the optimal threshold. Based on this criterion, a daily displacement threshold of 0.13 mm/day was selected as the landslide event identification threshold for the Babao-Liao slope, and this value was used for subsequent analyses.
Since slope displacement data may be affected by external factors other than rainfall, this study uses box plots to compare the distribution characteristics of rainfall amount (P), rainfall duration (D), and rainfall intensity (I) under different prediction result scenarios. This comparison aims to examine the differences between antecedent rainfall and subsequent rainfall across different prediction classifications under the displacement criterion of daily displacement (S) = 0.13 mm/day, thereby enhancing the capability of the slope early warning system to identify high-risk rainfall events. The analysis results are shown in Fig. 18. Under the subsequent rainfall condition, boundary values are observed between the 75th percentile of hits and the 25th percentile of misses in the distributions of rainfall amount and rainfall duration, as shown in Fig. 18d,e. These boundary values further distinguish miss events from hit events, indicating that the proposed rainfall amount and rainfall duration boundary values have practical value for identifying prediction outcomes.
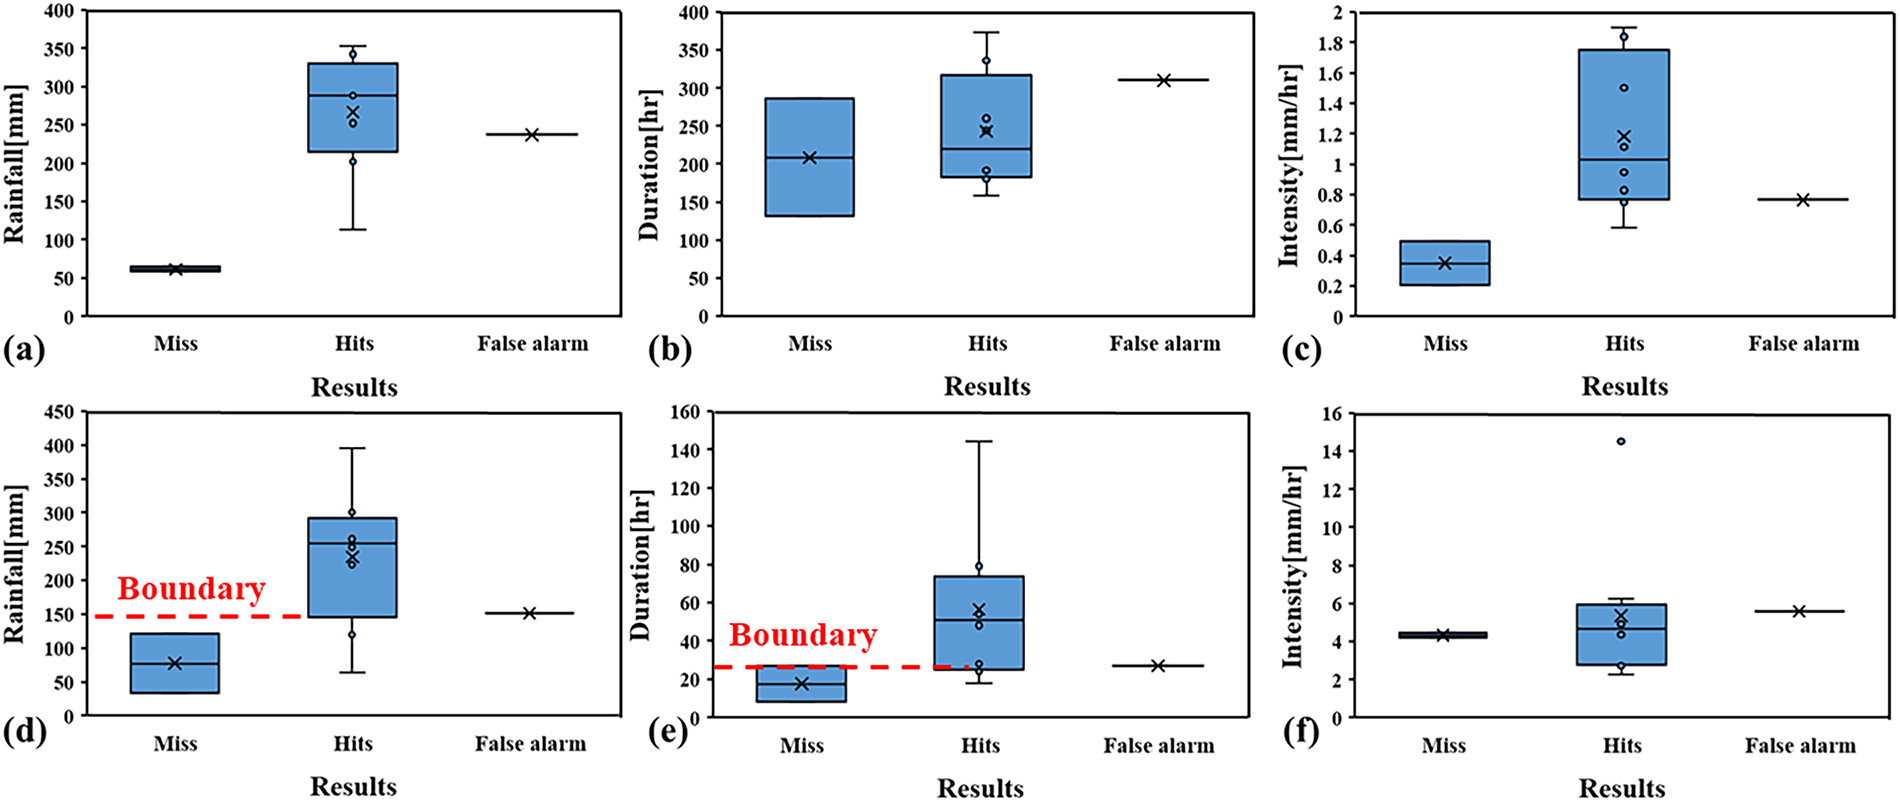
Figure 18: Box plot analysis of rainfall amount (P), rainfall duration (D), and rainfall intensity (I) corresponding to different prediction outcomes under the daily displacement criterion S = 0.13 mm/day: (a–c) antecedent rainfall; (d–f) subsequent rainfall.
Based on the box plot analysis, this study conducted a re-evaluation of prediction accuracy by incorporating rainfall amount (P = 150 mm) and rainfall duration (D = 24 h) into the existing displacement criterion (S = 0.13 mm/day). The results are summarized in Table 8. When the rainfall-induced failure event criterion considers only the subsequent rainfall amount (P), the POD increases to 1, and the TS reaches the highest value of 0.86. The second-best performance is obtained when both subsequent rainfall amount and rainfall duration (P + D) are considered. Therefore, rainfall events with a cumulative rainfall exceeding 150 mm represent the most suitable conditions under which the early-warning system developed in this study achieves the best identification performance. In contrast, when rainfall amounts are below this threshold, the predictive capability of the early-warning system becomes relatively limited.
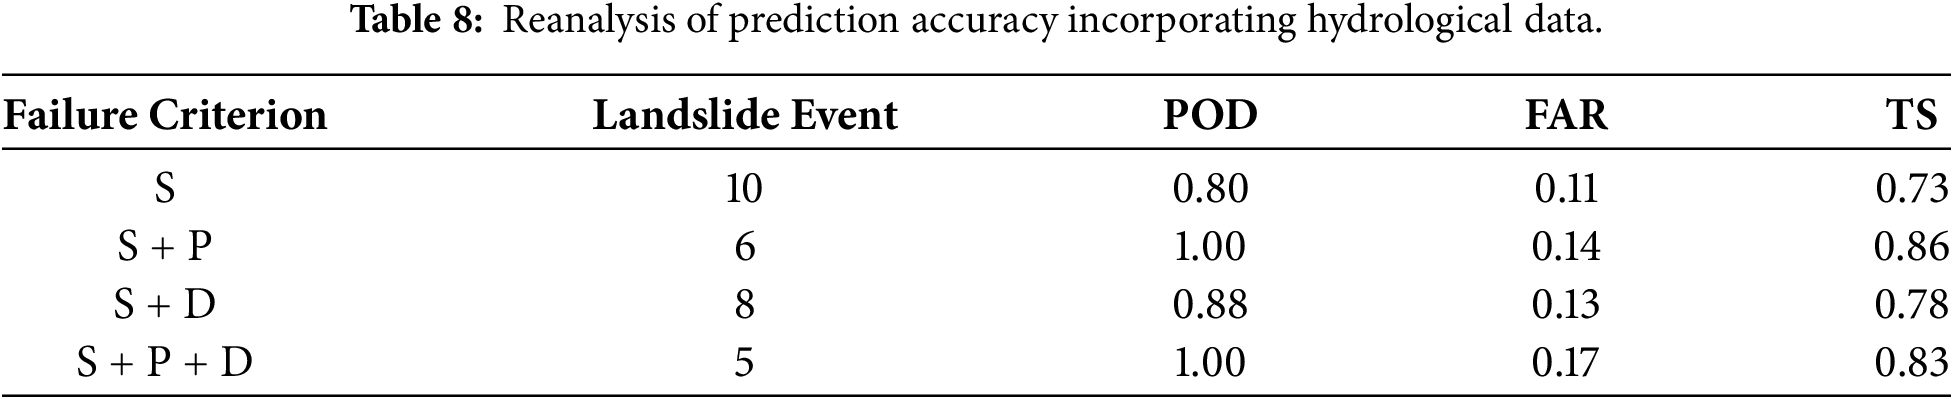
These results indicate that integrating this identification criterion into the activation mechanism of the proposed early warning system, together with rainfall forecasts at different temporal scales, can improve prediction performance. Long-term rainfall forecasts can be used during the early stage of a rainfall event to determine whether the cumulative rainfall has exceeded the activation threshold (P > 150 mm), whereas short-term rainfall forecasts can capture the influence of rainfall temporal distribution on prediction results. Overall, the integration of multi-temporal-scale rainfall information can effectively enhance the capability of the slope early warning system to identify high-risk rainfall events and improve the reliability of early warning.
The physically based rainfall threshold analysis and early warning framework proposed in this study is mainly developed under homogeneous soil-layer conditions. Recent studies have shown that the hydrological response and failure behavior of layered slopes may be affected by soil-layer configuration, permeability contrast, and interlayer failure mechanisms [61–63]. In addition, soil pore-size distribution and uncertainty in SWRC parameters influence soil water retention and hydraulic conductivity behavior, thereby affecting rainfall infiltration processes and the assessment of unsaturated slope stability [64,65]. Therefore, future studies may incorporate soil-property heterogeneity, soil-layer heterogeneity, and bimodal hydraulic behavior to improve the applicability of the proposed framework under complex stratigraphic conditions.
In addition, the standard van Genuchten [43] hydraulic model was adopted in this study to describe the relationship between the SWRC and the HCF based on the main drying path. Although the effects of the wetting path and hydraulic hysteresis were evaluated through the sensitivity analysis in Section 4.1, these conditions were not incorporated into the subsequent primary I–D threshold and early warning system analyses. However, rainfall infiltration is essentially a soil wetting process, and previous studies have indicated that the wetting path of the SWRC and its corresponding HCF may affect soil water content, matric suction, and hydraulic conductivity during rainfall infiltration in unsaturated slopes [21,22]. Hydraulic parameters obtained from field or laboratory measurements are commonly fitted using the main drying path, whereas hydraulic parameters for the wetting path generally require additional measurements or estimation. Therefore, future studies may further incorporate the wetting path, hydraulic hysteresis, and the corresponding hydraulic conductivity function throughout the rainfall threshold and early warning analyses to evaluate their effects on rainfall infiltration behavior and physically based rainfall threshold prediction.
This study develops a simplified slope failure early warning procedure by integrating critical suction stress depth profiles with rainfall intensity–duration (I–D) threshold curves. The proposed procedure does not rely on on-site real-time monitoring equipment and uses rainfall data alone as inputs. It further evaluates the influence of rainfall characteristics on failure timing to improve prediction sensitivity to extreme and sudden rainfall events. The results show that when peak rainfall occurs during the middle to later stages of a rainfall event, shallow saturated zones are likely to develop within the slope, thereby reducing infiltration rates and promoting surface runoff, which prevents the rainfall from reaching failure-triggering conditions. This finding confirms that infiltration amount, rather than total rainfall, is the key factor controlling the initiation of slope failure. The simulation results can be classified into steady-state and transient conditions according to the initial soil infiltration state. Under the same infiltration amount, the rainfall pattern combination that triggers failure at the earliest time—namely the “uniform + advanced” pattern—is adopted as the basis for early warning. This approach simultaneously incorporates the effects of antecedent rainfall, rainfall pattern, and infiltration conditions on the internal hydrological characteristics of the slope.
In addition, the predictive performance of the early warning system was validated using rainfall and slope displacement data from the Babao-Liao landslide site. The results show that the POD, FAR, and TS values are 0.60, 0.00, and 0.60, respectively, indicating that the system can effectively avoid false alarms but still has limited capability in detecting landslide events. Sensitivity analysis indicates that when the daily displacement threshold is adjusted to 0.13 mm/day and the cumulative rainfall exceeds 150 mm, the prediction performance improves further, with the TS increasing to 0.86. These results indicate that incorporating both displacement and rainfall conditions can improve the prediction accuracy of the early warning system.
Finally, this study investigates the influence of rainfall data completeness on slope failure prediction results by simulating data-missing scenarios commonly encountered in practical applications. The results indicate that early warning accuracy is primarily affected by factors such as the update interval of rainfall forecast data, the completeness of historical rainfall records, and the specification of initial wetting conditions. Even under conditions of partial data loss or forecasting uncertainty, the system is still capable of issuing effective warnings prior to slope failure. Overall, the proposed early warning system is characterized by operational simplicity, high flexibility, and stable predictive performance, demonstrating strong potential for practical application under variable rainfall conditions.
Acknowledgement: Not applicable.
Funding Statement: The authors received no specific funding for this study.
Author Contributions: Jyun-Kai Yang and Ya-Sin Yang: Conceptualization, Methodology, Software, Validation, Writing—Original Draft. Hsin-Fu Yeh: Supervision, Writing—Review & Editing. All authors reviewed and approved the final version of the manuscript.
Availability of Data and Materials: The data that support the findings of this study are available from the corresponding author upon reasonable request.
Ethics Approval: Not applicable.
Conflicts of Interest: Given Ya-Sin Yang and Hsin-Fu Yeh’s role as guest editors of this special issue, they had no involvement in the peer review of this article and had no access to information regarding its peer review. Full responsibility for the editorial process for this article was delegated to another journal editor. The authors declare no other conflicts of interest.
References
1. Guzzetti F, Melillo M, Mondini AC. Landslide predictions through combined rainfall threshold models. Landslides. 2025;22(1):137–47. doi:10.1007/s10346-024-02340-7. [Google Scholar] [CrossRef]
2. Li P, Xu Q, Liu J, Zhang F, Ji X, Peng D, et al. Establishing radar-derived rainfall thresholds for a landslide early warning system: a case study in the Sichuan Basin, Southwest China. Sci Rep. 2025;15(1):26308. doi:10.1038/s41598-025-10464-6. [Google Scholar] [CrossRef]
3. Segoni S, Nocentini N, Barbadori F, Medici C, Gatto A, Rosi A, et al. A novel prototype national-scale landslide nowcasting system for Italy combining rainfall thresholds and risk indicators. Landslides. 2025;22(5):1341–66. doi:10.1007/s10346-024-02452-0. [Google Scholar] [CrossRef]
4. Zhao Y, Li Y, Zheng J, Wang Y, Meng X, Yue D, et al. A new rainfall intensity–duration threshold curve for debris flows using comprehensive rainfall intensity. Eng Geol. 2025;347:107949. doi:10.1016/j.enggeo.2025.107949. [Google Scholar] [CrossRef]
5. Caine N. The rainfall intensity–duration control of shallow landslides and debris flows. Geogr Ann Ser A Phys Geogr. 1980;62(1–2):23–7. doi:10.1080/04353676.1980.11879996. [Google Scholar] [CrossRef]
6. Aleotti P. A warning system for rainfall-induced shallow failures. Eng Geol. 2004;73(3–4):247–65. doi:10.1016/j.enggeo.2004.01.007. [Google Scholar] [CrossRef]
7. Guzzetti F, Peruccacci S, Rossi M, Stark CP. The rainfall intensity–duration control of shallow landslides and debris flows: an update. Landslides. 2008;5(1):3–17. doi:10.1007/s10346-007-0112-1. [Google Scholar] [CrossRef]
8. Brunetti MT, Peruccacci S, Rossi M, Luciani S, Valigi D, Guzzetti F. Rainfall thresholds for the possible occurrence of landslides in Italy. Nat Hazards Earth Syst Sci. 2010;10(3):447–58. doi:10.5194/nhess-10-447-2010. [Google Scholar] [CrossRef]
9. Saito H, Nakayama D, Matsuyama H. Relationship between the initiation of a shallow landslide and rainfall intensity—duration thresholds in Japan. Geomorphology. 2010;118(1–2):167–75. doi:10.1016/j.geomorph.2009.12.016. [Google Scholar] [CrossRef]
10. Bogaard T, Greco R. Invited perspectives: hydrological perspectives on precipitation intensity-duration thresholds for landslide initiation: proposing hydro-meteorological thresholds. Nat Hazards Earth Syst Sci. 2018;18(1):31–9. doi:10.5194/nhess-18-31-2018. [Google Scholar] [CrossRef]
11. Ciavolella M, Bogaard T, Gargano R, Greco R. Is there predictive power in hydrological catchment information for regional landslide hazard assessment? Procedia Earth Planet Sci. 2016;16(1):195–203. doi:10.1016/j.proeps.2016.10.021. [Google Scholar] [CrossRef]
12. Marino P, Siva Subramanian S, Fan X, Greco R. Changes in debris-flow susceptibility after the Wenchuan earthquake revealed by meteorological and hydro-meteorological thresholds. Catena. 2022;210:105929. doi:10.1016/j.catena.2021.105929. [Google Scholar] [CrossRef]
13. Fusco F, Bordoni M, Tufano R, Vivaldi V, Meisina C, Valentino R, et al. Hydrological regimes in different slope environments and implications on rainfall thresholds triggering shallow landslides. Nat Hazards. 2022;114(1):907–39. doi:10.1007/s11069-022-05417-5. [Google Scholar] [CrossRef]
14. Cho SE. Prediction of shallow landslide by surficial stability analysis considering rainfall infiltration. Eng Geol. 2017;231:126–38. doi:10.1016/j.enggeo.2017.10.018. [Google Scholar] [CrossRef]
15. Yeh HF, Tsai YJ. Analyzing the effect of soil hydraulic conductivity anisotropy on slope stability using a coupled hydromechanical framework. Water Switz. 2018;10(7):905. doi:10.3390/w10070905. [Google Scholar] [CrossRef]
16. Marin RJ, Velásquez MF. Influence of hydraulic properties on physically modelling slope stability and the definition of rainfall thresholds for shallow landslides. Geomorphology. 2020;351:106976. doi:10.1016/j.geomorph.2019.106976. [Google Scholar] [CrossRef]
17. Wei X, Fan W, Chai X, Cao Y, Nan Y. Field and numerical investigations on triggering mechanism in typical rainfall-induced shallow landslides: a case study in the Ren River catchment, China. Nat Hazards. 2020;103(2):2145–70. doi:10.1007/s11069-020-04075-9. [Google Scholar] [CrossRef]
18. Yang YS, Yeh HF. Effects of hysteretic soil water characteristic curves on the hydromechanical behaviour. J Earth Syst Sci. 2023;132(3):136. doi:10.1007/s12040-023-02146-6. [Google Scholar] [CrossRef]
19. Lu N, Calderon ARA, Wayllace A, Lovekin J, Crandall A. Suction stress–based rainfall intensity–duration method for slope instability prediction. J Geotech Geoenviron Eng. 2024;150(8):04024069. doi:10.1061/jggefk.gteng-12597. [Google Scholar] [CrossRef]
20. Yang YS, Yeh HF, Ke CC, Wei LW. Assessing shallow slope stability using electrical conductivity data and soil hydraulic characteristics. Eng Geol. 2024;331:107447. doi:10.1016/j.enggeo.2024.107447. [Google Scholar] [CrossRef]
21. Johari A, Hooshmand Nejad A. An approach to estimate wetting path of soil–water retention curve from drying path. Iran J Sci Technol Trans Civ Eng. 2018;42(1):85–9. doi:10.1007/s40996-017-0074-z. [Google Scholar] [CrossRef]
22. Johari A, Talebi A. Stochastic analysis of rainfall-induced slope instability and steady-state seepage flow using random finite-element method. Int J Geomech. 2019;19(8):04019085. doi:10.1061/(asce)gm.1943-5622.0001455. [Google Scholar] [CrossRef]
23. Rahardjo H, Li XW, Toll DG, Leong EC. The effect of antecedent rainfall on slope stability. Geotech Geol Eng. 2001;19(3):371–99. doi:10.1023/A:1013129725263. [Google Scholar] [CrossRef]
24. Rahimi A, Rahardjo H, Leong EC. Effect of hydraulic properties of soil on rainfall-induced slope failure. Eng Geol. 2010;114(3–4):135–43. doi:10.1016/j.enggeo.2010.04.010. [Google Scholar] [CrossRef]
25. Marino P, Peres DJ, Cancelliere A, Greco R, Bogaard TA. Soil moisture information can improve shallow landslide forecasting using the hydrometeorological threshold approach. Landslides. 2020;17(9):2041–54. doi:10.1007/s10346-020-01420-8. [Google Scholar] [CrossRef]
26. Yang YS, Yeh HF, Ke CC, Chen NC, Chang KC. Assessment of probability of failure on rainfall-induced shallow landslides at slope scale using a physical-based model and fuzzy point estimate method. Front Earth Sci. 2022;10:957506. doi:10.3389/feart.2022.957506. [Google Scholar] [CrossRef]
27. Yang YS, Yeh HF, Huang CC, Chen HY. Reviews and syntheses: promoting the advancement of hillslope hydrology and stability in Taiwan from the perspective of critical zone science. Water. 2023;15(6):1234. doi:10.3390/w15061234. [Google Scholar] [CrossRef]
28. Durukan S. Evaluation of the antecedent saturation and rainfall conditions on the slope failure mechanism triggered by rainfalls. Appl Sci. 2024;14(20):9478. doi:10.3390/app14209478. [Google Scholar] [CrossRef]
29. Liu Y, Deng Z, Wang X. The effects of rainfall, soil type and slope on the processes and mechanisms of rainfall-induced shallow landslides. Appl Sci. 2021;11(24):11652. doi:10.3390/app112411652. [Google Scholar] [CrossRef]
30. Liu X, Wang Y, Leung AK. Numerical investigation of rainfall intensity and duration control of rainfall-induced landslide at a specific slope using slope case histories and actual rainfall records. Bull Eng Geol Environ. 2023;82(8):333. doi:10.1007/s10064-023-03359-1. [Google Scholar] [CrossRef]
31. Chellamuthu SN, Ganapathy GP. Quantifying the impact of changing rainfall patterns on landslide frequency and intensity in the Nilgiris District of Western Ghats, India. Prog Disaster Sci. 2024;23(3):100351. doi:10.1016/j.pdisas.2024.100351. [Google Scholar] [CrossRef]
32. Gui MW, Chu HA, Chung MC, Chih LS. Integrating rainfall distribution patterns and slope stability analysis in determining rainfall thresholds for landslide occurrences: a case study. Water. 2025;17(8):1240. doi:10.3390/w17081240. [Google Scholar] [CrossRef]
33. Yeh HF, Tsai YJ. Effect of variations in long-duration rainfall intensity on unsaturated slope stability. Water. 2018;10(4):479. doi:10.3390/w10040479. [Google Scholar] [CrossRef]
34. Zhao B, Marin RJ, Luo W, Yu Z, Yuan L. Rainfall thresholds for shallow landslides considering rainfall temporal patterns. Bull Eng Geol Environ. 2025;84(3):132. doi:10.1007/s10064-025-04144-y. [Google Scholar] [CrossRef]
35. Lu N, Likos WJ. Suction stress characteristic curve for unsaturated soil. J Geotech Geoenviron Eng. 2006;132(2):131–42. doi:10.1061/(asce)1090-0241(2006)132:. [Google Scholar] [CrossRef]
36. Lu N, Godt JW, Wu DT. A closed-form equation for effective stress in unsaturated soil. Water Resour Res. 2010;46(5):2009WR008646. doi:10.1029/2009wr008646. [Google Scholar] [CrossRef]
37. Terzaghi K. Theoretical soil mechanics. Hoboken, NJ, USA: John Wiley & Sons, Inc.; 1943. doi:10.1002/9780470172766. [Google Scholar] [CrossRef]
38. Duncan JM, Wright SG, Brandon TL. Soil strength and slope stability. Hoboken, NJ, USA: John Wiley & Sons, Inc.; 2014. [Google Scholar]
39. Lu N, Godt J. Infinite slope stability under steady unsaturated seepage conditions. Water Resour Res. 2008;44(11):2008WR006976. doi:10.1029/2008wr006976. [Google Scholar] [CrossRef]
40. Lu N, Godt JW. Hillslope hydrology and stability. Cambridge, UK: Cambridge University Press; 2013. doi:10.1017/cbo9781139108164. [Google Scholar] [CrossRef]
41. Šimůnek J, van Genuchten MT, Šejna M. Development and applications of the HYDRUS and STANMOD software packages and related codes. Vadose Zone J. 2008;7(2):587–600. doi:10.2136/vzj2007.0077. [Google Scholar] [CrossRef]
42. Richards LA. Capillary conduction of liquids through porous mediums. Physics. 1931;1(5):318–33. doi:10.1063/1.1745010. [Google Scholar] [CrossRef]
43. van Genuchten MT. A closed-form equation for predicting the hydraulic conductivity of unsaturated soils. Soil Science Soc Amer J. 1980;44(5):892–8. doi:10.2136/sssaj1980.03615995004400050002x. [Google Scholar] [CrossRef]
44. Mualem Y. A new model for predicting the hydraulic conductivity of unsaturated porous media. Water Resour Res. 1976;12(3):513–22. doi:10.1029/wr012i003p00513. [Google Scholar] [CrossRef]
45. Reddy JN. An introduction to the finite element method. New York, NY, USA: McGraw Hill; 1993. [Google Scholar]
46. Heggen RJ. Normalized antecedent precipitation index. J Hydrol Eng. 2001;6(5):377–81. doi:10.1061/(asce)1084-0699(2001)6:5(377). [Google Scholar] [CrossRef]
47. Zhao B, Dai Q, Han D, Dai H, Mao J, Zhuo L, et al. Estimation of soil moisture using modified antecedent precipitation index with application in landslide predictions. Landslides. 2019;16(12):2381–93. doi:10.1007/s10346-019-01255-y. [Google Scholar] [CrossRef]
48. Alexander LV, Zhang X, Peterson TC, Caesar J, Gleason B, Klein Tank AMG, et al. Global observed changes in daily climate extremes of temperature and precipitation. J Geophys Res Atmos. 2006;111(D5):2005JD006290. doi:10.1029/2005jd006290. [Google Scholar] [CrossRef]
49. Zhang X, Alexander L, Hegerl GC, Jones P, Tank AK, Peterson TC, et al. Indices for monitoring changes in extremes based on daily temperature and precipitation data. Wires Clim Change. 2011;2(6):851–70. doi:10.1002/wcc.147. [Google Scholar] [CrossRef]
50. Alexander L, Herold N. ClimPACT2: indices and software. 2016 [cited 2026 Aug 30]. Available from: https://epic.awi.de/id/eprint/49274/1/ClimPACTv2_manual.pdf. [Google Scholar]
51. Keefer DK, Wilson RC, Mark RK, Brabb EE, Brown WM III, Ellen SD, et al. Real-time landslide warning during heavy rainfall. Science. 1987;238(4829):921–5. doi:10.1126/science.238.4829.921. [Google Scholar] [CrossRef]
52. Wilson RC, Wieczorek GF. Rainfall thresholds for the initiation of debris flows at La Honda, California. Environ Eng Geosci. 1995;I(1):11–27. doi:10.2113/gseegeosci.i.1.11. [Google Scholar] [CrossRef]
53. Ho JY, Lee KT. Performance evaluation of a physically based model for shallow landslide prediction. Landslides. 2017;14(3):961–80. doi:10.1007/s10346-016-0762-y. [Google Scholar] [CrossRef]
54. Ho JY, Liu CH, Chen WB, Chang CH, Lee KT. Using ensemble quantitative precipitation forecast for rainfall-induced shallow landslide predictions. Geosci Lett. 2022;9(1):22. doi:10.1186/s40562-022-00231-0. [Google Scholar] [CrossRef]
55. Wilks DS. Statistical methods in the atmospheric sciences. Vol. 100. Cambridge, MA, USA: Academic Press; 2011. [Google Scholar]
56. Schaefer JT. The critical success index as an indicator of warning skill. Wea Forecasting. 1990;5(4):570–5. doi:10.1175/1520-0434(1990)005<0570:tcsiaa>2.0.co;2. [Google Scholar] [CrossRef]
57. Chang KC, Wen HY, Chen NC, Li FM, Lin JJ, Ke CC, et al. Correlation analysis of landslide precursor factors and concentrations of cations and anions. J Chin Soil Water Conserv. 2021;52(1):1–15. doi:10.29417/JCSWC.202103_52(1).0001. [Google Scholar] [CrossRef]
58. Rahimi A, Rahardjo H, Leong EC. Effect of antecedent rainfall patterns on rainfall-induced slope failure. J Geotech Geoenviron Eng. 2011;137(5):483–91. doi:10.1061/(asce)gt.1943-5606.0000451. [Google Scholar] [CrossRef]
59. Chen CW, Oguchi T, Chen H, Lin GW. Estimation of the antecedent rainfall period for mass movements in Taiwan. Environ Earth Sci. 2018;77(5):184. doi:10.1007/s12665-018-7377-7. [Google Scholar] [CrossRef]
60. Ran Q, Hong Y, Li W, Gao J. A modelling study of rainfall-induced shallow landslide mechanisms under different rainfall characteristics. J Hydrol. 2018;563(2):790–801. doi:10.1016/j.jhydrol.2018.06.040. [Google Scholar] [CrossRef]
61. Bian S, Chen G, Meng X, Yang Y, Wu J, Huang F, et al. Physical model experiment of rainfall-induced instability of a two-layer slope: implications for early warning. Landslides. 2024;21(12):3149–67. doi:10.1007/s10346-024-02339-0. [Google Scholar] [CrossRef]
62. Yuan C, Qin C, Yang Y, Sun Z, Li L, Lei X, et al. An analytical insight into stability analysis of unsaturated multi-layered slopes subjected to rainfall infiltration. Num Anal Meth Geomech. 2024;48(17):4291–303. doi:10.1002/nag.3833. [Google Scholar] [CrossRef]
63. Tang J, Ma Z, Li M, Xu J, Uchimura T, Xiao W, et al. Failure patterns and hydrological response of layered slope. Geomorphology. 2026;492(3):110071. doi:10.1016/j.geomorph.2025.110071. [Google Scholar] [CrossRef]
64. Yeh HF, Huang TT, Yang YS, Ke CC. Influence of uncertainty of soil hydraulic parameters on stability of unsaturated slopes based on Bayesian updating. Geofluids. 2021;2021:6629969. doi:10.1155/2021/6629969. [Google Scholar] [CrossRef]
65. Huang TH, Yang YS, Yeh HF. A novel bimodal hydro-mechanical coupling model for evaluating rainfall-induced unsaturated slope stability. Geosciences. 2025;15(7):265. doi:10.3390/geosciences15070265. [Google Scholar] [CrossRef]
Cite This Article
 Copyright © 2026 The Author(s). Published by Tech Science Press.
This work is licensed under a Creative Commons Attribution 4.0 International License , which permits unrestricted use, distribution, and reproduction in any medium, provided the original work is properly cited.
 Downloads
 Citation Tools
