
 Login
Login Register
 Submit a Paper
 Propose a Special lssue
 Open Access
ARTICLE
An Interpretable Metaheuristic-Optimized XGBoost Model for Plastic Zone Depth Prediction and Target-Oriented Parameter Screening in Underground Powerhouse Caverns
1 School of Resources and Safety Engineering, Central South University, Changsha, China
2 Kunming Prospecting Design Institute of China Nonferrous Metals Industry Co., Ltd., Kunming, China
3 Department of Mining Engineering, Faculty of Engineering, University of Kurdistan, Sanandaj, Iran
4 School of Civil, Environmental and Sociotechnical Engineering, University of Technology Sydney, Sydney, NSW, Australia
* Corresponding Authors: Su Wang. Email: ; Danial Jahed Armaghani. Email:
Computer Modeling in Engineering & Sciences 2026, 148(3), 21 https://doi.org/10.32604/cmes.2026.087513
Received 17 June 2026; Accepted 27 August 2026; Issue published 28 September 2026
 View Full Text
 Download PDF
Abstract
Rapid prediction of the plastic zone depth (PZD) at key points in the rock mass around underground powerhouse caverns is important for surrounding-rock stability assessment. However, existing machine-learning studies have primarily focused on forward prediction under prescribed conditions, with insufficient attention to model stability, prediction uncertainty, and the statistical significance of performance differences. Moreover, model interpretation has rarely been integrated with target-oriented cavern-layout parameter screening. To address these limitations, this study develops a metaheuristic-optimized XGBoost framework based on a numerical database containing 1920 two-dimensional finite-element results. The Runge-Kutta optimizer (RUN) and the weighted mean of vectors optimizer (INFO) are employed to search seven key XGBoost hyperparameters, while an unoptimized XGBoost model is established as a baseline within the same model family. Cross-validation, an independent test set, six evaluation metrics, bootstrap confidence intervals, residual diagnostics, and the Wilcoxon signed-rank test are combined to comprehensively evaluate model accuracy, stability, and statistical differences. The test results show that, compared with the unoptimized XGBoost model, RUN-XGBoost and INFO-XGBoost reduce RMSE by 27.63% and 28.94%, respectively, and MAE by 35.16% and 35.12%, respectively. Both optimized models achieve statistically significant reductions in absolute prediction errors, whereas the performance difference between them is not statistically significant. SHAP analysis indicates that, within the current database and parameter ranges, the coefficient of lateral stress, overburden depth, rock mass unit weight, tensile strength, and cavern-layout parameters are the main variables influencing the model predictions. The trained RUN-XGBoost model was further incorporated into a target-oriented parameter-screening framework. This framework rapidly identifies cavern-layout combinations that satisfy a prescribed PZD-control target and may reduce the need for repeated numerical simulations during preliminary scheme comparison. Finally, a graphical user interface integrating PZD prediction, local interpretation, parameter screening, result visualization, and data export is developed. The proposed framework can provide auxiliary support for rapid PZD prediction and preliminary cavern-layout scheme assessment within the parameter ranges covered by the current numerical database.Keywords
Underground powerhouse caverns serve as critical structures in hydropower and energy engineering projects, where their stability is directly linked to the safe operation and economic performance of the entire system. During cavern excavation, the initial in situ stress field is inevitably disturbed and redistributed, causing stress concentration in the surrounding rock mass. Once the local stress level exceeds the yield strength of the rock mass, irreversible deformation may occur near the excavation boundary and gradually form a plastic zone (PZ). The development of the PZ may adversely affect nearby caverns and auxiliary structures, thereby increasing the risk to the integrity and operational safety of the cavern group [1–3]. The depth of the PZ is a fundamental basis for assessing surrounding rock stability and designing support schemes. Therefore, accurately predicting the plastic zone depth (PZD) at key locations in underground powerhouse caverns is of great significance for optimizing support design, controlling rock deformation, and enhancing engineering safety [4,5].
Previous theoretical, numerical, and experimental studies have shown that the extent and spatial distribution of plastic or excavation-damaged zones are strongly affected by the in situ stress state and rock mass mechanical properties [6–9]. Excavation-induced unloading, stress-path evolution, hydraulic effects, and disturbance loading may further influence the development and propagation of surrounding-rock damage [10–14]. In addition, cavern geometry, geological discontinuities, and interactions with adjacent structures can considerably modify the distribution of plastic deformation around underground openings [15–18]. For large underground cavern groups under high geostress, the staged excavation process and the resulting stress-path evolution may substantially affect the initiation and propagation of surrounding-rock damage. Li et al. [19] investigated the failure mechanisms and evolution of excavation-damaged zones in a deeply buried underground powerhouse, while Jiang et al. [20] demonstrated the importance of excavation sequencing and stability-control measures for large underground caverns under high geostress. Analytical, numerical, and experimental approaches have also been developed to estimate plastic-zone distributions and deformation responses around underground openings [2,21–24]. However, repeated high-fidelity numerical analyses require model construction, parameter assignment, meshing, staged excavation, and post-processing, and therefore become inefficient when numerous geological, stress, and cavern-layout parameters must be evaluated. Some studies have additionally examined key points where displacement, strain, or plastic-zone extension becomes particularly pronounced. For displacement-based assessments of underground powerhouse caverns, such key points have frequently been identified on the high sidewalls [2,25–28]. However, the location corresponding to the maximum PZD is not necessarily fixed. Depending on the rock mass properties, in situ stress state, and relative cavern arrangement, it may occur at the left sidewall, right sidewall, or floor. Therefore, the prediction target considered in this study is the maximum PZD at the numerically identified key point, rather than the PZD at a predetermined monitoring point.
With the continuous advancement of research on the PZ, some scholars have begun to focus on key points within its spatial distribution. These key points typically correspond to regions in the surrounding rock where plastic strain or displacement responses reach extreme values, representing the most likely locations for local failure or instability. As such, they are often regarded as critical areas for structural safety assessment and support system optimization. Although their specific positions may vary, numerous studies have shown that in large-span underground caverns such as those found in hydropower stations, key points are commonly located near the mid-height of the sidewalls [2,25,26]. Zhu et al. [25,26] revised the proposed predictive equations for displacements at key points on the high sidewalls of underground powerhouse caverns by accounting for the influence of cavern spacing. Zhang and Goh [27] applied multivariate adaptive regression splines to characterize the dependence of twin cavern key-point displacement and strain on factors including rock mass quality, cavern geometry, and in situ stress. Rajabi et al. [28] employed numerical analysis and gene expression programming to establish equations for predicting elastoplastic sidewall displacements at key points in powerhouse caverns, while identifying the extent of critical zones and locating the corresponding key points. They also verified the accuracy of the equations and introduced a new stability classification system based on critical displacement thresholds.
Machine learning has increasingly been adopted as an efficient surrogate-modeling strategy in geotechnical and underground engineering. Once trained on reliable numerical or field datasets, machine-learning models can rapidly approximate the nonlinear relationship between input parameters and engineering responses, thereby improving the efficiency of parametric analysis, preliminary design, and stability assessment. In recent years, such methods have been widely applied to rock mechanical property prediction [29–31], tunnel deformation prediction [32,33], and surrounding-rock stability and structural response evaluation [34,35]. Xue and Xiao [36] developed a particle-swarm-optimized least-squares support vector machine to estimate surrounding-rock deformation and reported good agreement with field measurements. Rajabi et al. [37] constructed an ANN-based model for predicting the peak horizontal displacement around powerhouse caverns, demonstrating the feasibility of data-driven models for deformation estimation in large underground caverns. Rezaei and Rajabi [1] adopted neural networks to estimate roof- and floor-vertical displacements at mid and key points in underground powerhouse caverns. Mahmoodzadeh et al. [38] applied six machine-learning models to forecast sidewall displacement in underground caverns. Zhou et al. [5] further utilized three metaheuristic-optimized random forest models to predict the PZD at different locations around underground powerhouse caverns. Recent studies have further introduced optimized boosting algorithms, probabilistic modeling, and explainable artificial intelligence into tunnel and underground-engineering applications [32,39–42]. In addition, finite-element-analysis-informed machine-learning models have been used to rapidly approximate tunnel stability responses under different geometrical and loading conditions [43,44]. These developments indicate that current research is gradually extending from prediction accuracy alone toward statistically supported, interpretable, and decision-oriented modeling.
Despite these advances, several important issues remain in machine-learning-based PZD assessment. First, most existing studies on underground cavern stability have focused on forward prediction, namely estimating surrounding-rock deformation, cavern displacement, or PZD under prescribed rock mass properties, in situ stress conditions, and cavern geometries [2,5,38]. Recent studies have demonstrated the potential of interpretable machine learning for parameter inversion, support optimization, and multi-objective decision-making in underground engineering [45,46]. However, systematic research on using trained models to screen feasible engineering parameter combinations according to predefined response targets remains limited. In particular, the relationship between predicted PZD and adjustable layout parameters, such as pillar width and relative cavern position, has not been sufficiently investigated for underground powerhouse caverns. This limitation restricts the use of machine learning models for preliminary scheme comparison and target-oriented parameter assessment. Second, existing studies commonly rely on conventional performance metrics obtained from a test set, while paying less attention to prediction stability under different data partitions, model uncertainty, residual characteristics, and the statistical significance of performance differences. Consequently, model generalization and the reliability of reported improvements may not be fully evaluated. Third, conventional feature-importance analysis generally provides only an overall ranking of the input variables and cannot simultaneously reveal the direction, magnitude, and sample-specific variation of their contributions. Information overlap and correlations among rock mass mechanical parameters may further affect the attribution and interpretation of individual variable effects. Therefore, a unified analytical framework integrating robust prediction, statistical evaluation, global and local interpretation, and target-oriented parameter screening is needed.
To address the above issues, this study develops an integrated machine-learning framework for PZD prediction at key points around underground powerhouse caverns and for cavern-layout parameter screening. First, the Runge-Kutta optimizer (RUN) and the weighted mean of vectors optimizer (INFO) are employed to search seven key hyperparameters of the extreme gradient boosting (XGBoost) model. An unoptimized XGBoost model is established as a baseline within the same model family to evaluate the improvement in predictive performance achieved through hyperparameter optimization. Second, cross-validation, an independent test set, six evaluation metrics, bootstrap confidence intervals, residual diagnostics, and the Wilcoxon signed-rank test are combined to comprehensively assess model accuracy, stability, and statistical differences. Third, SHapley Additive exPlanations (SHAP) are used to analyze the contribution magnitude, influence direction, and sample-specific variation of rock mass properties, in situ stress conditions, and cavern-layout parameters with respect to the predicted PZD. On this basis, the representative surrogate model is used to conduct target-oriented screening of the cavern-layout parameter combinations contained in the database, thereby identifying candidate schemes that satisfy the prescribed PZD-control requirement. Finally, a graphical user interface integrating PZD prediction, local interpretation, parameter screening, result visualization, and data export is developed to improve model operability and enhance its efficiency in preliminary scheme evaluation. The proposed framework is primarily intended for rapid prediction and scheme comparison within the parameter ranges covered by the current numerical database and may provide auxiliary support for the preliminary assessment of underground powerhouse cavern-layout parameters.
2.1 Metaheuristic Optimization Algorithms
Metaheuristic algorithms have been widely applied to complex engineering optimization problems because of their global search capability and flexibility in handling nonlinear, nonconvex, and constrained search spaces [47]. In this study, the Runge-Kutta optimizer (RUN) and the weighted mean of vectors optimizer (INFO) were selected to optimize the key hyperparameters of XGBoost because they employ distinct and complementary population-update mechanisms. RUN combines a Runge-Kutta-inspired search strategy with an enhanced solution quality mechanism to balance global exploration and local exploitation, whereas INFO uses weighted mean vectors and local search to maintain population diversity and refine promising solutions. Their derivative-free search characteristics and suitability for bounded nonlinear optimization make them appropriate for the XGBoost hyperparameter-tuning problem considered in this study.
2.1.1 Runge–Kutta Optimizer (RUN)
RUN is a population-based metaheuristic algorithm developed from the fourth-order Runge–Kutta (RK4) numerical integration scheme [48]. The algorithm utilizes multiple slope estimation terms to generate and update candidate solutions, enabling efficient exploration of complex nonlinear search spaces [49]. As shown in Fig. 1, the RUN framework comprises three main components: the RK4 search mechanism, the enhanced solution quality (ESQ) mechanism, and the best-solution selection process. During the optimization process, candidate solutions are first generated based on population fitness information and then further improved through the ESQ mechanism. Finally, a greedy selection strategy is adopted to preserve superior solutions and promote convergence toward the global optimum.
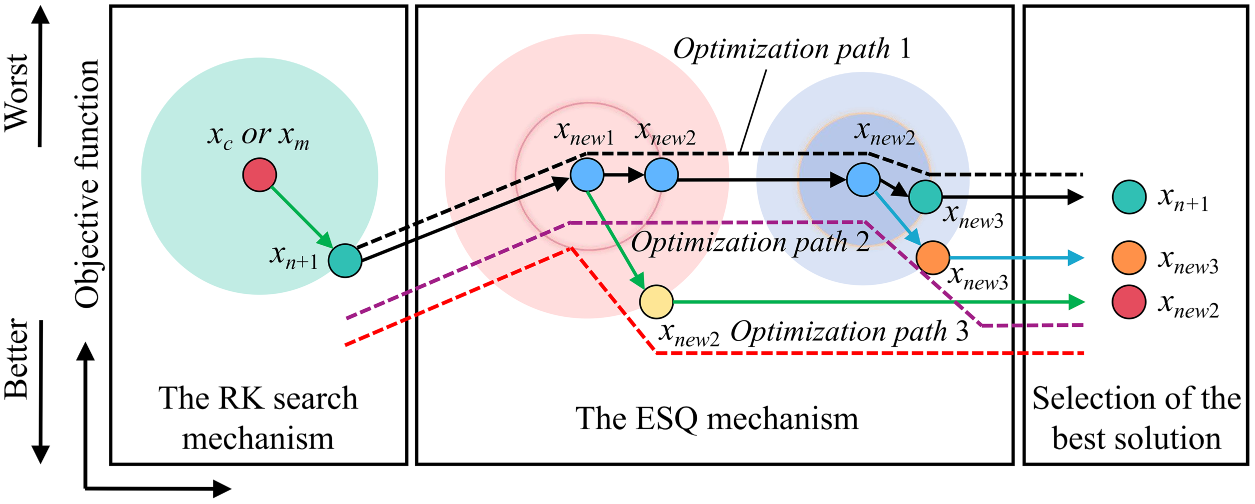
Figure 1: The workflow of the RUN algorithm.
In the RUN algorithm, the RK4 search mechanism serves as the fundamental search strategy. For the current candidate solution, several slope estimation terms are constructed to approximate the potential search direction and generate a new solution. The corresponding formulation is given as follows:
where xn denotes the current candidate solution, h is the search step size, and k1, k2, k3, and k4 are the slope estimation terms calculated at different locations. The function f(·) defines the search direction according to the fitness information and the positional relationships within the population. By combining these four slope terms, RUN is able to obtain a more stable search step for solution updating. The corresponding update scheme can be expressed as:
where xn+1 represents the updated candidate solution.
During the optimization process, RUN coordinates global exploration and local exploitation through stochastic mechanisms. The exploration phase focuses on expanding the search range to reduce the risk of being trapped in local optima, whereas the exploitation phase performs refined searches around promising solutions to improve convergence accuracy. In addition, RUN incorporates an ESQ mechanism, which generates new candidate solutions by combining the current best solution, randomly selected individuals, and population mean information. The updated candidates are further screened through an elitist selection rule, ensuring that better solutions are inherited while preserving the coordination between global exploration and local exploitation.
2.1.2 Weighted Mean of Vectors Optimizer (INFO)
INFO is a metaheuristic optimization algorithm based on the concept of weighted mean of vectors [50]. Its core idea is to assign different weights to candidate solutions according to their quality differences within the population and to guide individuals toward potentially promising regions using weighted mean vectors. The fundamental principle of INFO is illustrated in Fig. 2. The algorithm mainly comprises three key processes: weighted mean updating, vector combining, and local search. Among these processes, weighted mean updating determines the primary search direction of candidate solutions, vector combining enhances population diversity, and local search improves the local exploitation capability and convergence accuracy during the later stages of optimization.
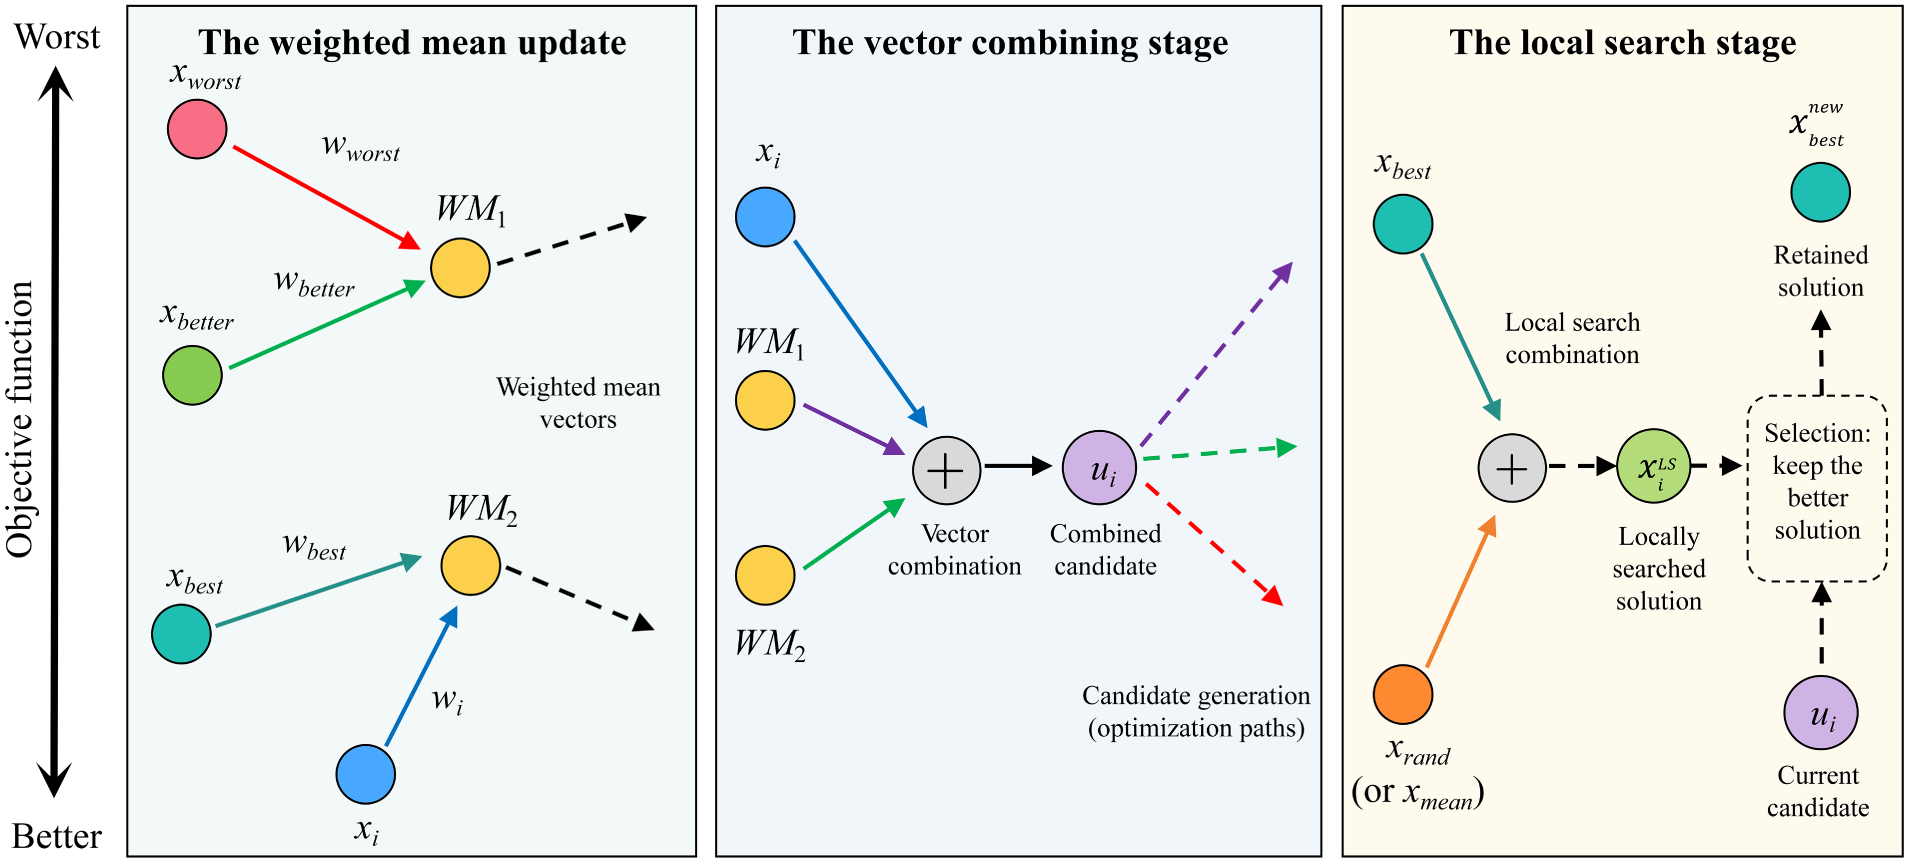
Figure 2: Principle of the INFO algorithm.
The weighted mean rule constitutes the core of INFO. Assuming that the population contains N candidate solutions, where xi denotes the i-th candidate solution and wi represents its corresponding weight, the weighted mean vector can be expressed as:
where WM denotes the weighted mean vector constructed from different candidate solutions.
During the position updating process, INFO typically constructs weighted mean directions using the best, better, and worst individuals in the current population and generates new candidate solutions by incorporating random perturbation terms. The corresponding update scheme can be summarized as:
where
2.2 Extreme Gradient Boosting (XGBoost)
XGBoost is a gradient-boosting ensemble method that uses decision trees as base learners. In each boosting iteration, the algorithm adds a regression tree to reduce the residuals between the current predictions and the target values. The new tree is then incorporated into the ensemble with a learning-rate-controlled contribution. By iteratively optimizing to minimize the loss function, the model progressively approaches the optimal solution of the objective function [51]. XGBoost minimizes a regularized objective that combines the empirical loss on the training data with a model-complexity penalty:
where
In XGBoost, each boosting round introduces a new tree by locally approximating the objective around the current predictions with second-order information. The update is guided by both the first-order gradient and the second-order curvature, so the newly added tree acts as an incremental correction to the accumulated model output. During split selection, the algorithm aggregates the gradients and Hessians of samples in the left and right child nodes to compute the gain associated with a candidate partition and uses this quantity to decide whether further splitting is beneficial. If the gain falls below the threshold, the node is not expanded and pruning is applied to limit complexity and improve generalization.
In this study, the predictive performance of the regression models was evaluated using six complementary metrics: the coefficient of determination (R2), root mean square error (RMSE), mean absolute error (MAE), median absolute error (MedAE), explained variance (EV), and relative root mean square error (RRMSE) [52–54]. Their definitions, theoretical ranges, and optimal values are summarized in Table 1. The R2 and EV values quantify the agreement between the predicted PZD values and the simulated PZD values [55]. Values closer to 1 indicate better predictive performance. RMSE gives greater weight to large prediction errors, whereas MAE measures the average magnitude of the absolute errors [56–58]. MedAE is less sensitive to extreme errors and therefore provides a robust measure of the typical prediction error. RRMSE expresses RMSE relative to the mean simulated PZD value and facilitates interpretation of the error magnitude on a percentage basis. To quantify the uncertainty of the test-set results, 95% confidence intervals were calculated using 2000 bootstrap resamples. Pairwise differences in the absolute prediction errors were further examined using a two-sided Wilcoxon signed-rank test. The resulting p-values were adjusted using the Holm procedure to account for multiple comparisons. A significance level of 0.05 was adopted.
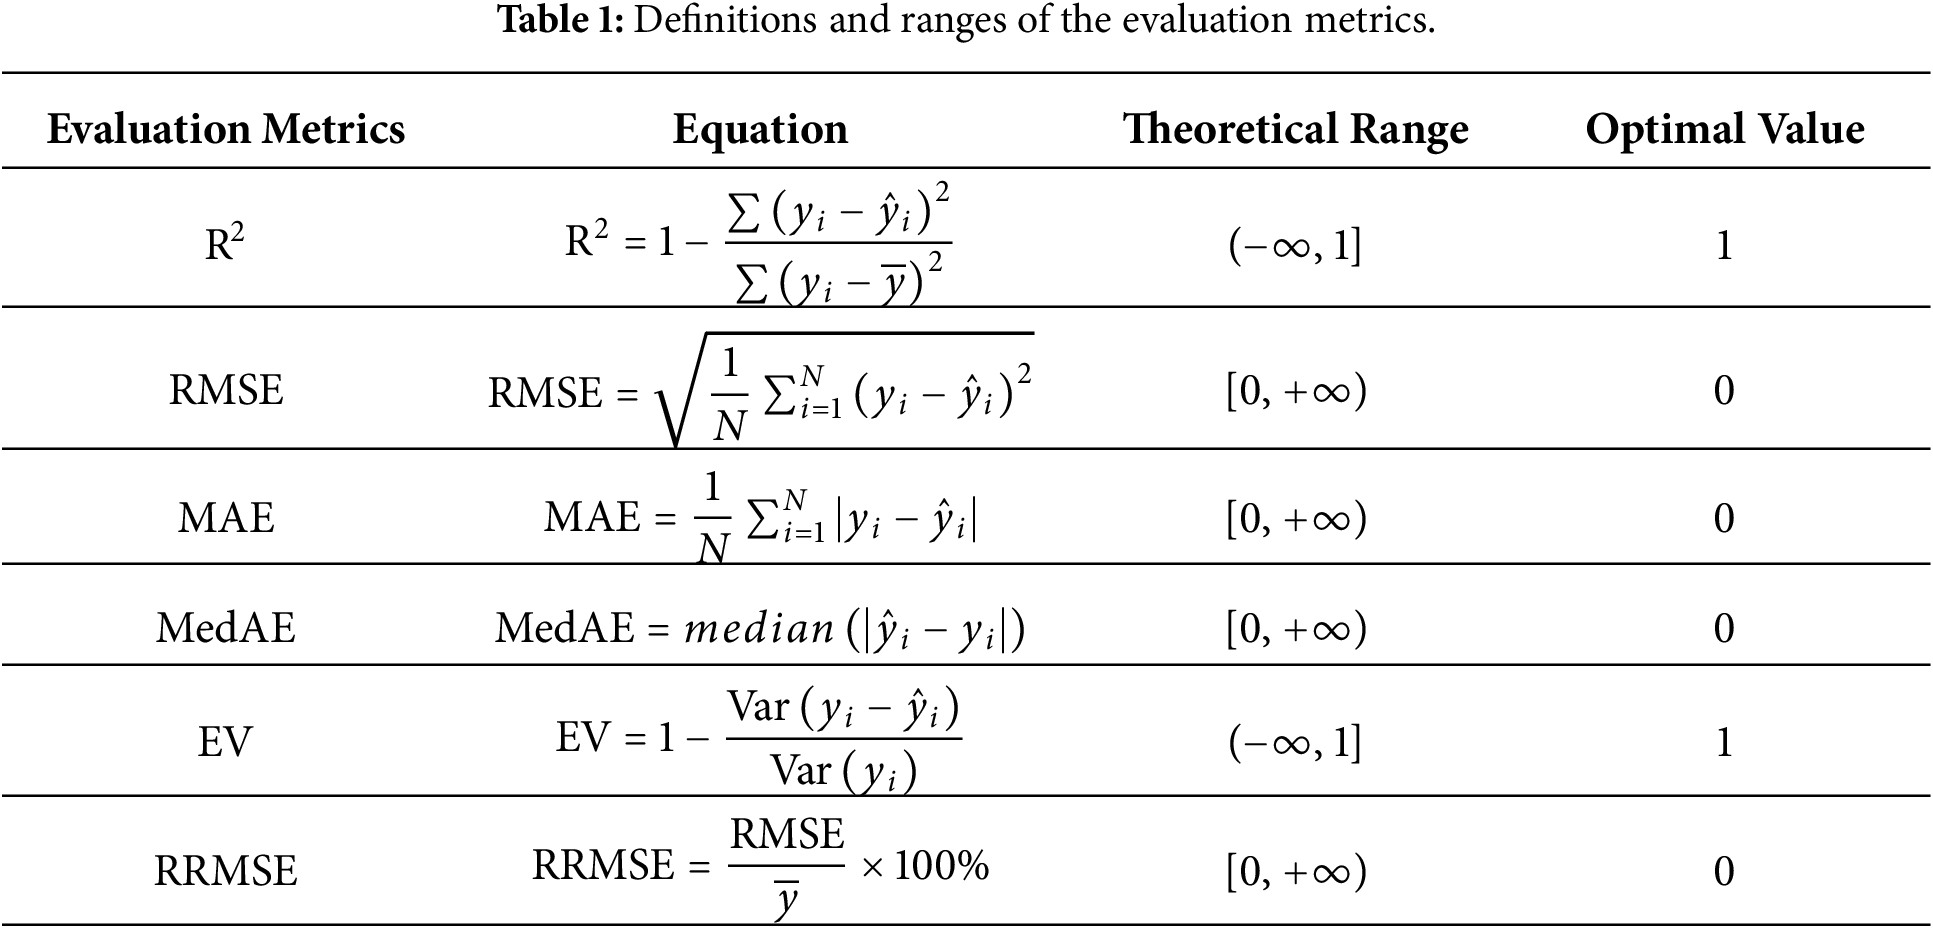
In the following equations,
The PZD database used in this study was obtained from the numerical investigation of underground cavern plastic zones conducted by Rezaei and Rajabi [2]. The database records the PZD at the key point of the main powerhouse cavern. The database consists of results generated through two-dimensional finite-element simulations rather than field monitoring or laboratory testing. Accordingly, the PZD values adopted herein are reference values derived from finite-element analyses, and the developed machine learning model serves as a surrogate for the specific numerical modeling framework represented by the database. Its purpose is to rapidly characterize the nonlinear relationships among rock mass mechanical properties, in situ stress conditions, cavern geometrical parameters, and the PZD at the key point within the parameter ranges covered by the database. The cavern configuration and database composition are illustrated in Fig. 3.
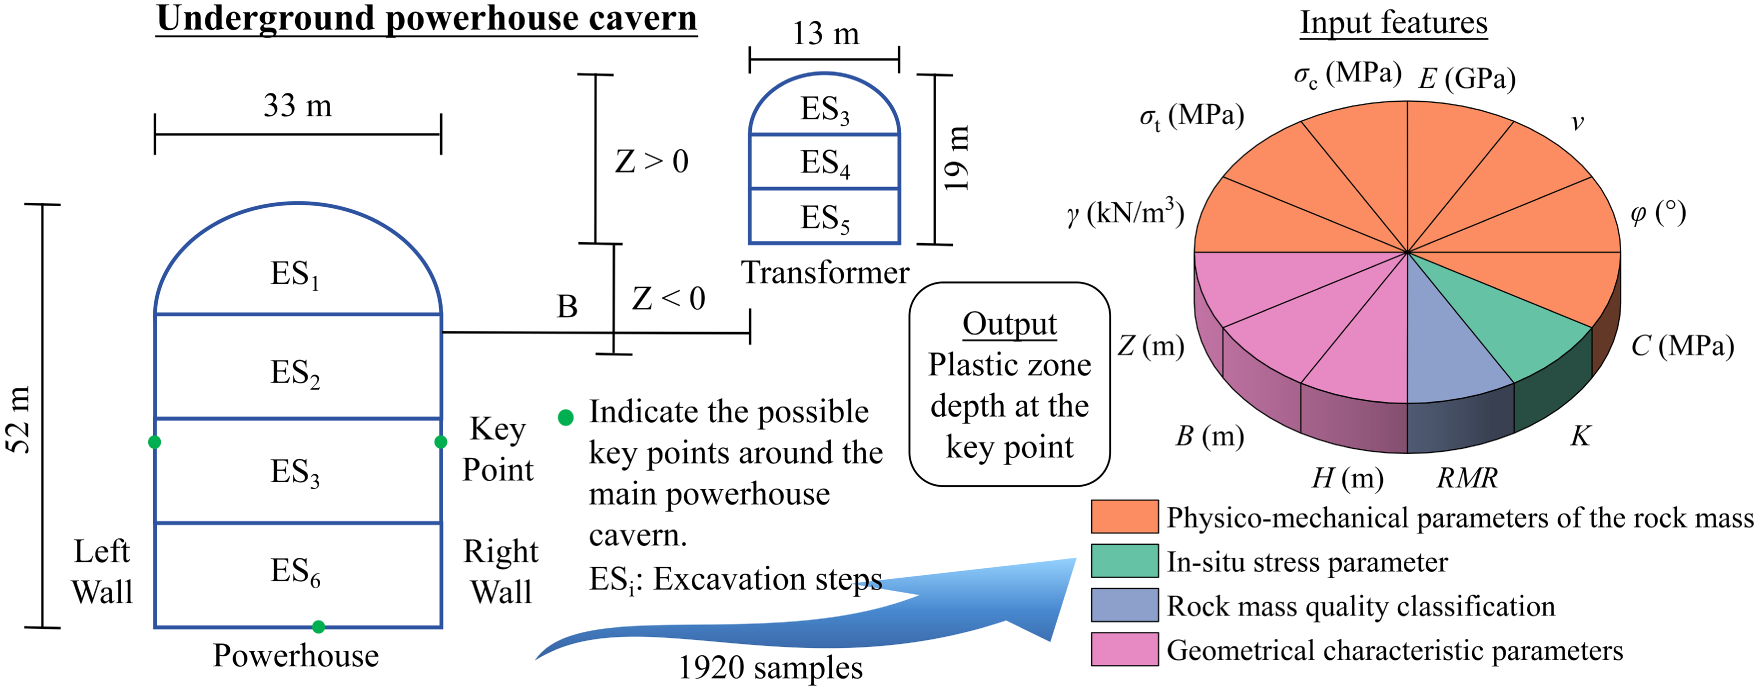
Figure 3: Schematic illustration of the underground powerhouse cavern layout and database composition.
The numerical model comprises a main powerhouse cavern and an adjacent transformer cavern. The main powerhouse cavern has a horseshoe-shaped cross-section with a width of 33 m and a height of 52 m, whereas the transformer cavern has a width of 13 m and a height of 19 m. A two-dimensional plane-strain assumption was adopted, and the surrounding rock mass was treated as an isotropic, homogeneous, quasi-continuous elastoplastic medium. Its failure behavior was described using the Mohr-Coulomb criterion. The external boundaries of the model were located at a distance of approximately five times the cavern width from the caverns and were subjected to the corresponding displacement constraints. Graded mesh refinement was applied around the cavern boundaries, and both the main powerhouse cavern and the transformer cavern were simulated using staged excavation. The pillar width B represents the clear horizontal distance between the two caverns, whereas the crown elevation difference Z denotes the vertical difference between their crowns. A positive Z indicates that the crown of the transformer cavern is higher than that of the main powerhouse cavern, whereas a negative Z indicates that it is lower.
The maximum PZD corresponding to the most pronounced plastic-zone extension around the main powerhouse cavern was selected as the prediction target and is herein denoted as PZD. The location of this key point is not fixed and may occur on the left sidewall, right sidewall, or floor, depending on the rock mass conditions, in situ stress state, and cavern configuration. The extent of the plastic zone was identified according to the Mohr-Coulomb plastic failure state, from which the PZD at the key point was subsequently extracted. Owing to the limitations imposed by the cavern geometry, numerical assumptions, and parameter ranges represented in the database, the proposed surrogate model is intended primarily for rapid PZD prediction and preliminary screening of cavern layout parameters within the corresponding ranges. It should not be regarded as a substitute for project-specific detailed numerical analyses or field-based stability assessments.
The database contains 1920 samples, each comprising 12 input variables and one output variable. The input variables can be classified into four categories. The physico-mechanical parameters of the rock mass include the rock mass unit weight γ, tensile strength σt, Poisson’s ratio ν, uniaxial compressive strength σc, rock mass deformation modulus E, internal friction angle φ, and cohesion C. The in situ stress parameter is the coefficient of lateral stress K. The rock mass quality parameter is the Rock Mass Rating (RMR). The cavern geometrical and overburden parameters include the overburden depth H, pillar width B, and crown elevation difference Z. The output variable is the PZD at the key point of the main powerhouse cavern.
Fig. 4 presents the Pearson correlation coefficients among the 12 original input variables. Strong correlations are observed between RMR and several rock mass mechanical parameters, including E, C, σc, and σt, mainly because these parameters were assigned in groups according to different RMR classes. Given that XGBoost is generally insensitive to feature scaling and multicollinearity, and to preserve the physical meaning of the variables, all 12 original variables were directly used for model development. Before model training, the dataset was randomly divided at a ratio of 4:1, resulting in 1536 samples for the training set and 384 samples for the test set. The test set was not used for model fitting and was reserved for the final evaluation of predictive performance on previously unseen samples. As shown in Fig. 5, the two subsets exhibit generally consistent ranges, central tendencies, and dispersion characteristics for all 12 input variables, without any evident systematic distributional shift. Fig. 6 shows that the PZD values range from 0 to 40 m and exhibit a certain degree of zero-value clustering and right-skewness. The PZD distributions of the training and test sets are generally similar, indicating that the data partitioning adequately preserves the overall distributional characteristics of the output variable.
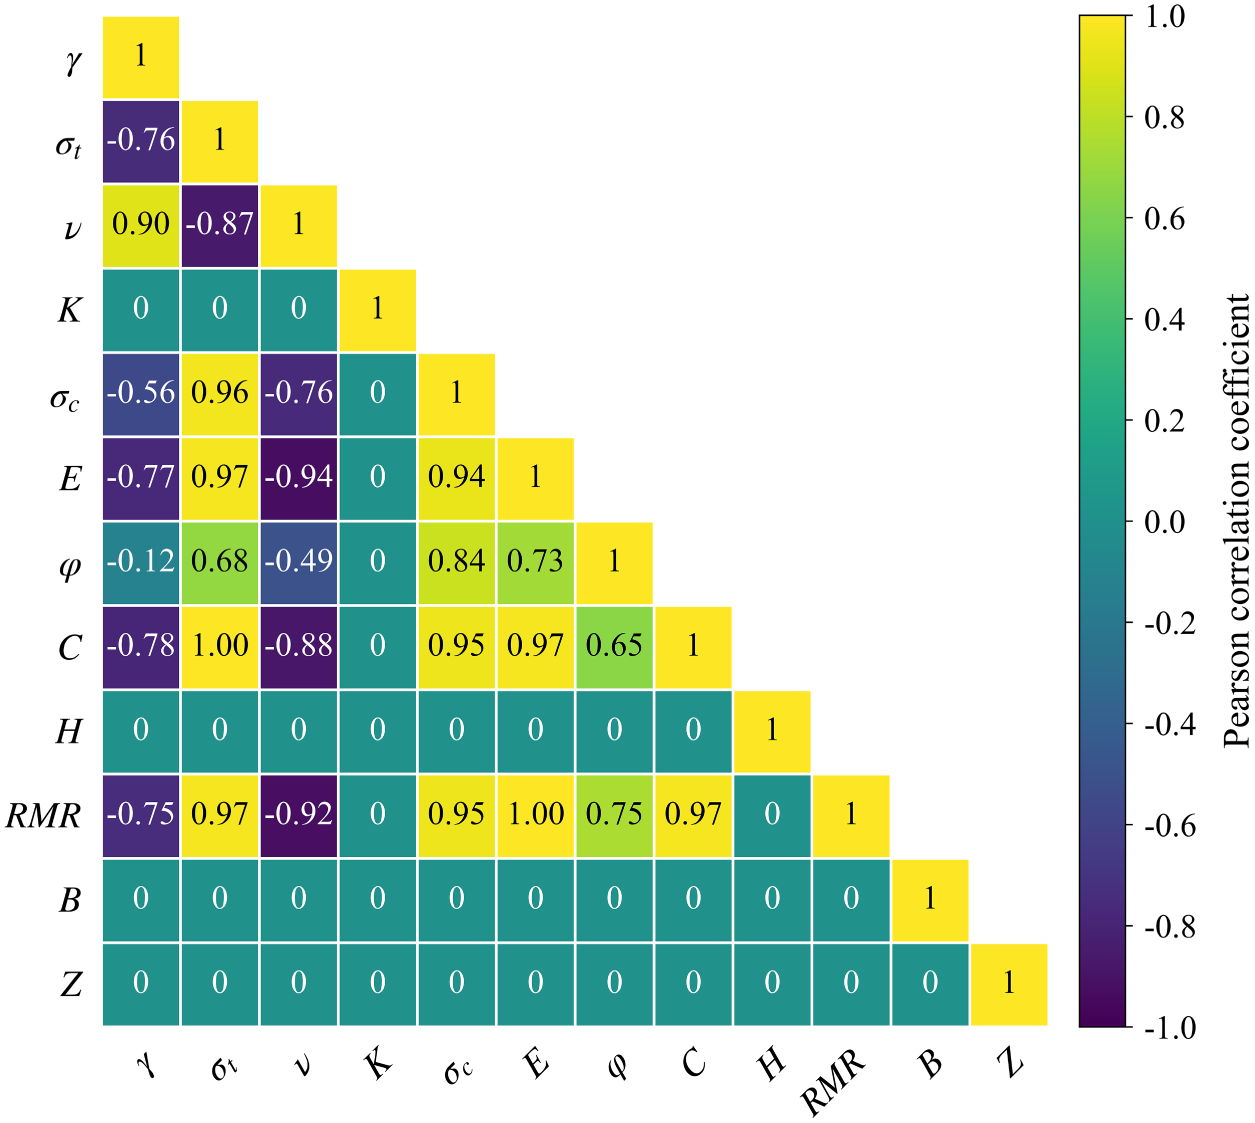
Figure 4: Pearson correlation matrix of the input variables.
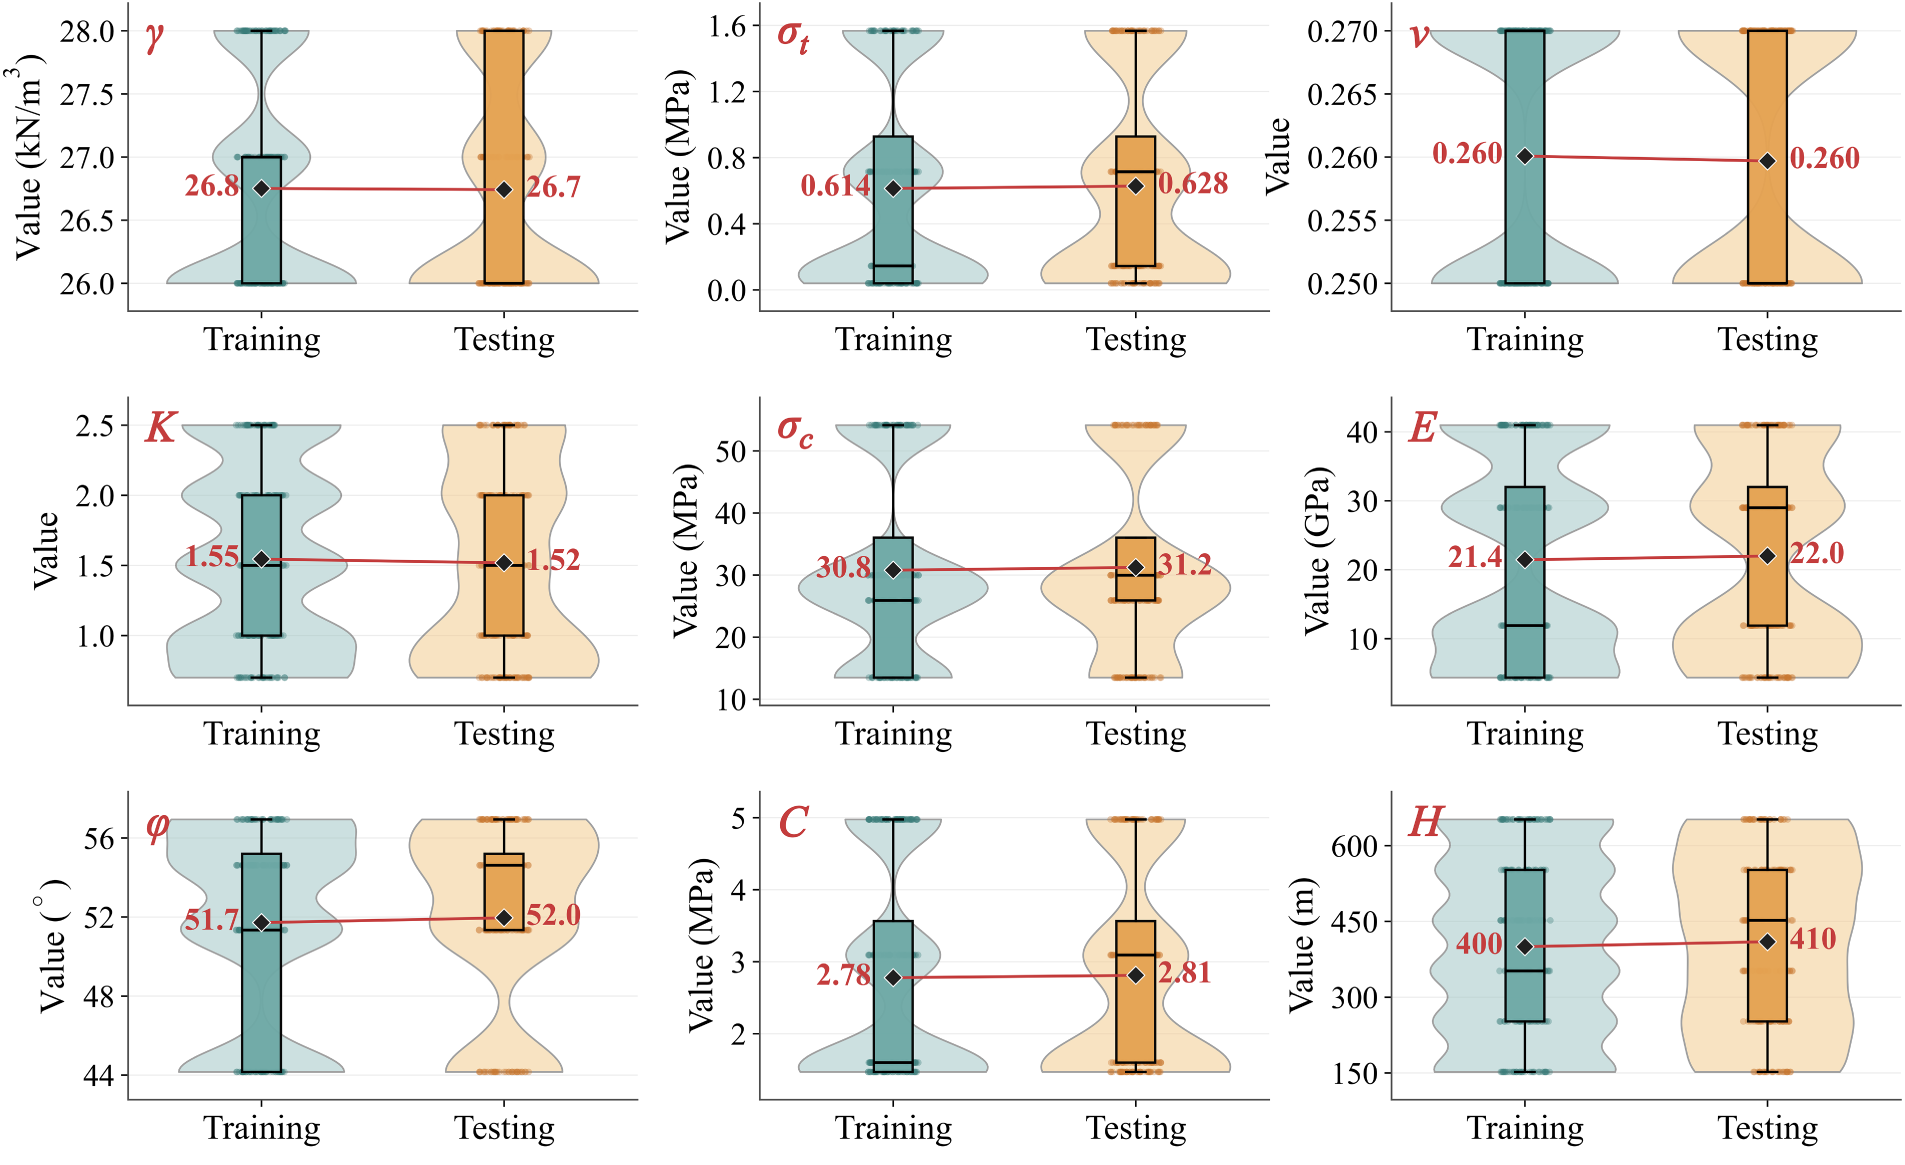

Figure 5: Comparison of the distributions of the 12 input variables between the training and testing datasets.
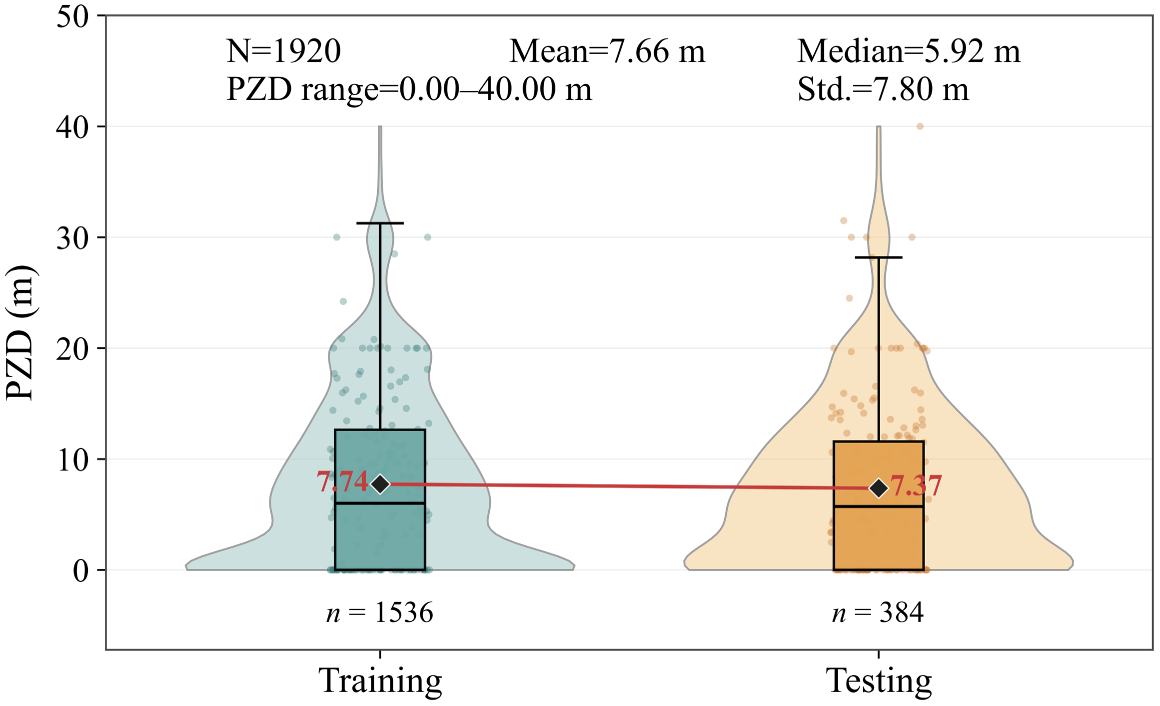
Figure 6: PZD distributions in the training and testing datasets.
4.1 Hyperparameter Optimization and Model Selection
Developing a prediction model with high accuracy and strong generalization capability is essential for the rapid prediction of PZD and the subsequent inverse assessment of design parameters. In this study, XGBoost was adopted as the core prediction model, and two metaheuristic algorithms, RUN and INFO, were employed to optimize its key hyperparameters in order to improve prediction accuracy and generalization performance. The overall modeling framework is illustrated in Fig. 7. The complete database was first randomly divided into a training set and a test set at a ratio of 4:1, resulting in 1536 training samples and 384 test samples. The 12 original physical variables were directly used as the model inputs. The test set remained independent throughout model development and was used only for the final evaluation of predictive performance. Within the training dataset, RUN and INFO were used to optimize seven XGBoost hyperparameters, including n_estimators, max_depth, learning_rate, subsample, colsample_bytree, gamma, and min_child_weight. The corresponding search ranges are listed in Table 2. These ranges were defined as study-specific practical bounds within the valid parameter domains of XGBoost, considering the size of the training dataset, model complexity, regularization strength, and computational feasibility. The same search space was adopted for RUN and INFO to ensure a fair comparison.
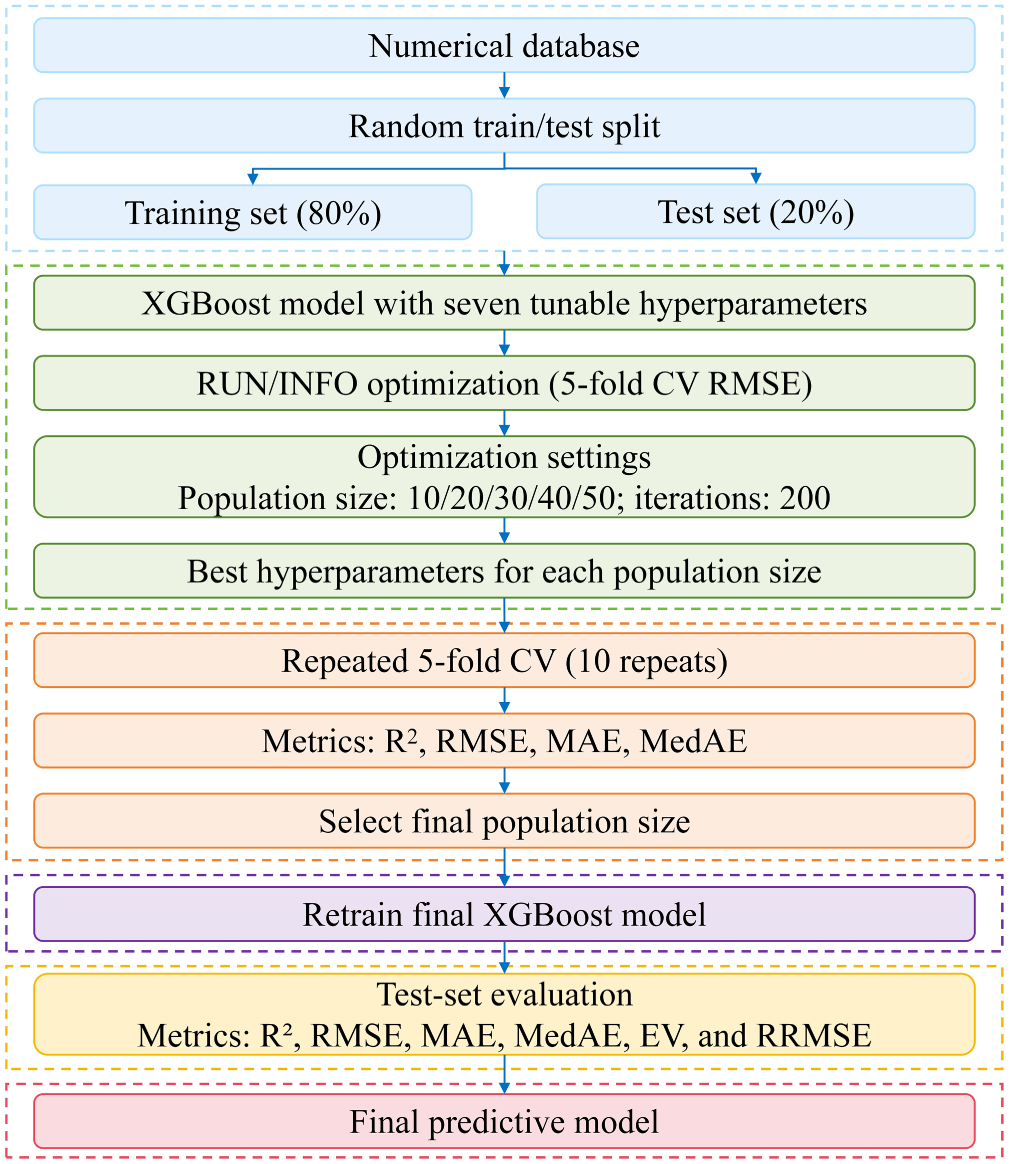
Figure 7: Model construction workflow.
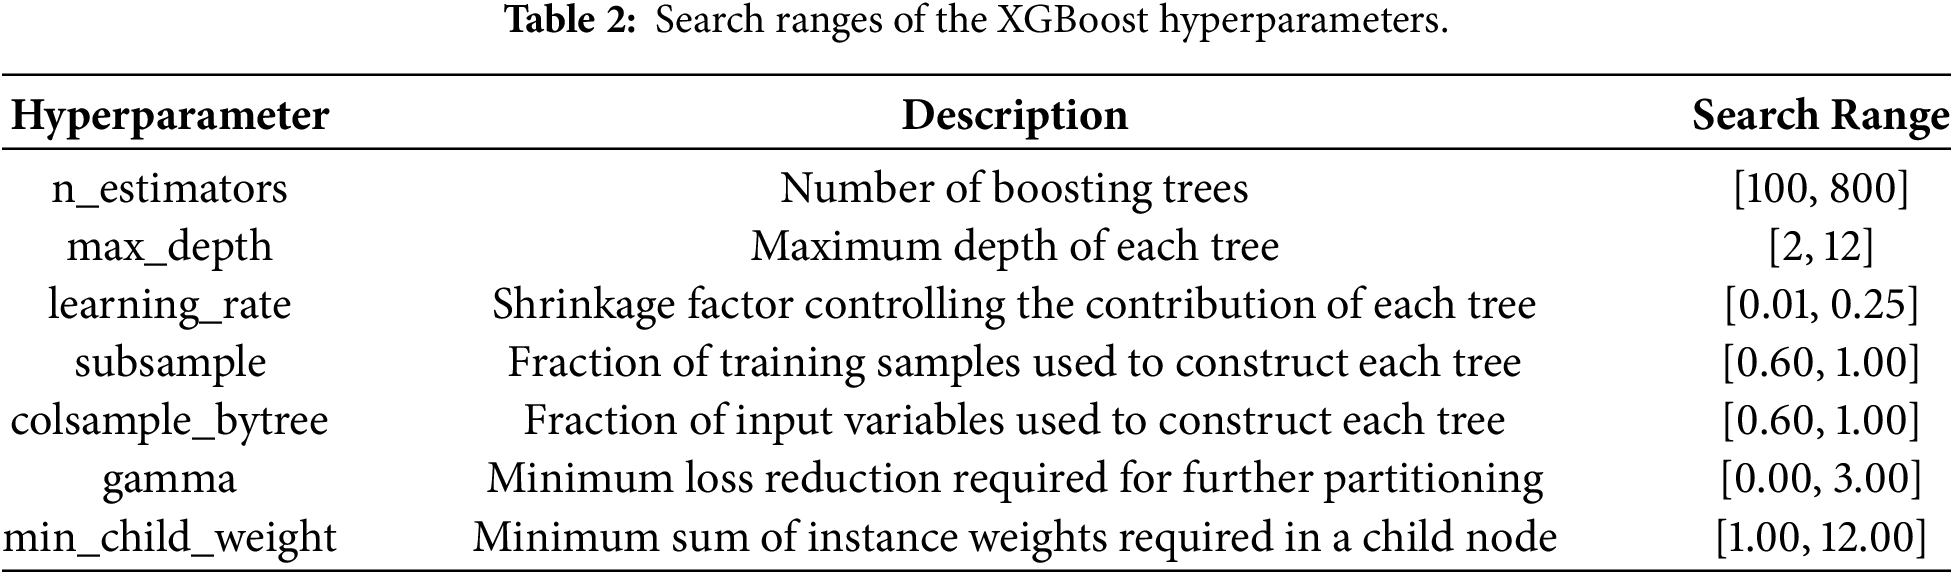
During hyperparameter optimization, the mean RMSE obtained from a fixed five-fold cross-validation scheme was adopted as the fitness function. The same cross-validation partitions were used for all candidate solutions to ensure that different optimization configurations were evaluated under consistent conditions. For both RUN and INFO, five population sizes—10, 20, 30, 40, and 50—were evaluated, with the maximum number of iterations fixed at 200. The model-and-optimizer seed was fixed at 42 to ensure reproducibility. All optimization runs continued until the prescribed maximum number of iterations. A tolerance of 10−6 and a patience of 30 iterations were used only for the post hoc identification of convergence stabilization and did not trigger early termination. All computations were conducted using Python 3.10.20 under a 64-bit Windows 11 operating system. After the best hyperparameter combination had been obtained for each population size, the corresponding candidate model was further evaluated using repeated five-fold cross-validation with ten repetitions. This procedure generated 50 validation results for each candidate configuration, thereby reducing the dependence of the model evaluation on a particular fold partition. No additional hyperparameter optimization was performed during this stage. The mean RMSE, MAE, MedAE, and R2 obtained from repeated cross-validation, together with their standard deviations, were used as the evaluation criteria for determining the final population size. After the final configurations had been selected, the RUN-XGBoost and INFO-XGBoost models were retrained using the complete training dataset and subsequently evaluated using the independent test set. The selected representative surrogate model was further used for SHAP-based interpretation and target-oriented screening of the B–Z parameter combinations.
Fig. 8 presents the convergence histories of the five-fold cross-validation RMSE under different population sizes. For both RUN and INFO, the fitness value decreased rapidly during the early iterations and then gradually approached a stable level as the number of iterations increased. This convergence behavior indicates that the candidate solutions progressively moved toward favorable regions within the prescribed hyperparameter space. However, the final fitness did not improve monotonically with increasing population size. For RUN, the configuration with a population size of 40 did not outperform those with population sizes of 20 and 50. Similarly, for INFO, increasing the population size from 30 to 50 did not result in a lower final fitness. These findings indicate that the optimization result depended on the search trajectory and the hyperparameter combination identified by the optimizer rather than on population size alone. Among the RUN configurations, a population size of 50 produced the lowest fixed five-fold cross-validation fitness, with a best RMSE of 1.88196 m obtained at iteration 174. For INFO, a population size of 30 yielded the lowest fitness, with a best RMSE of 1.89625 m obtained at iteration 175.
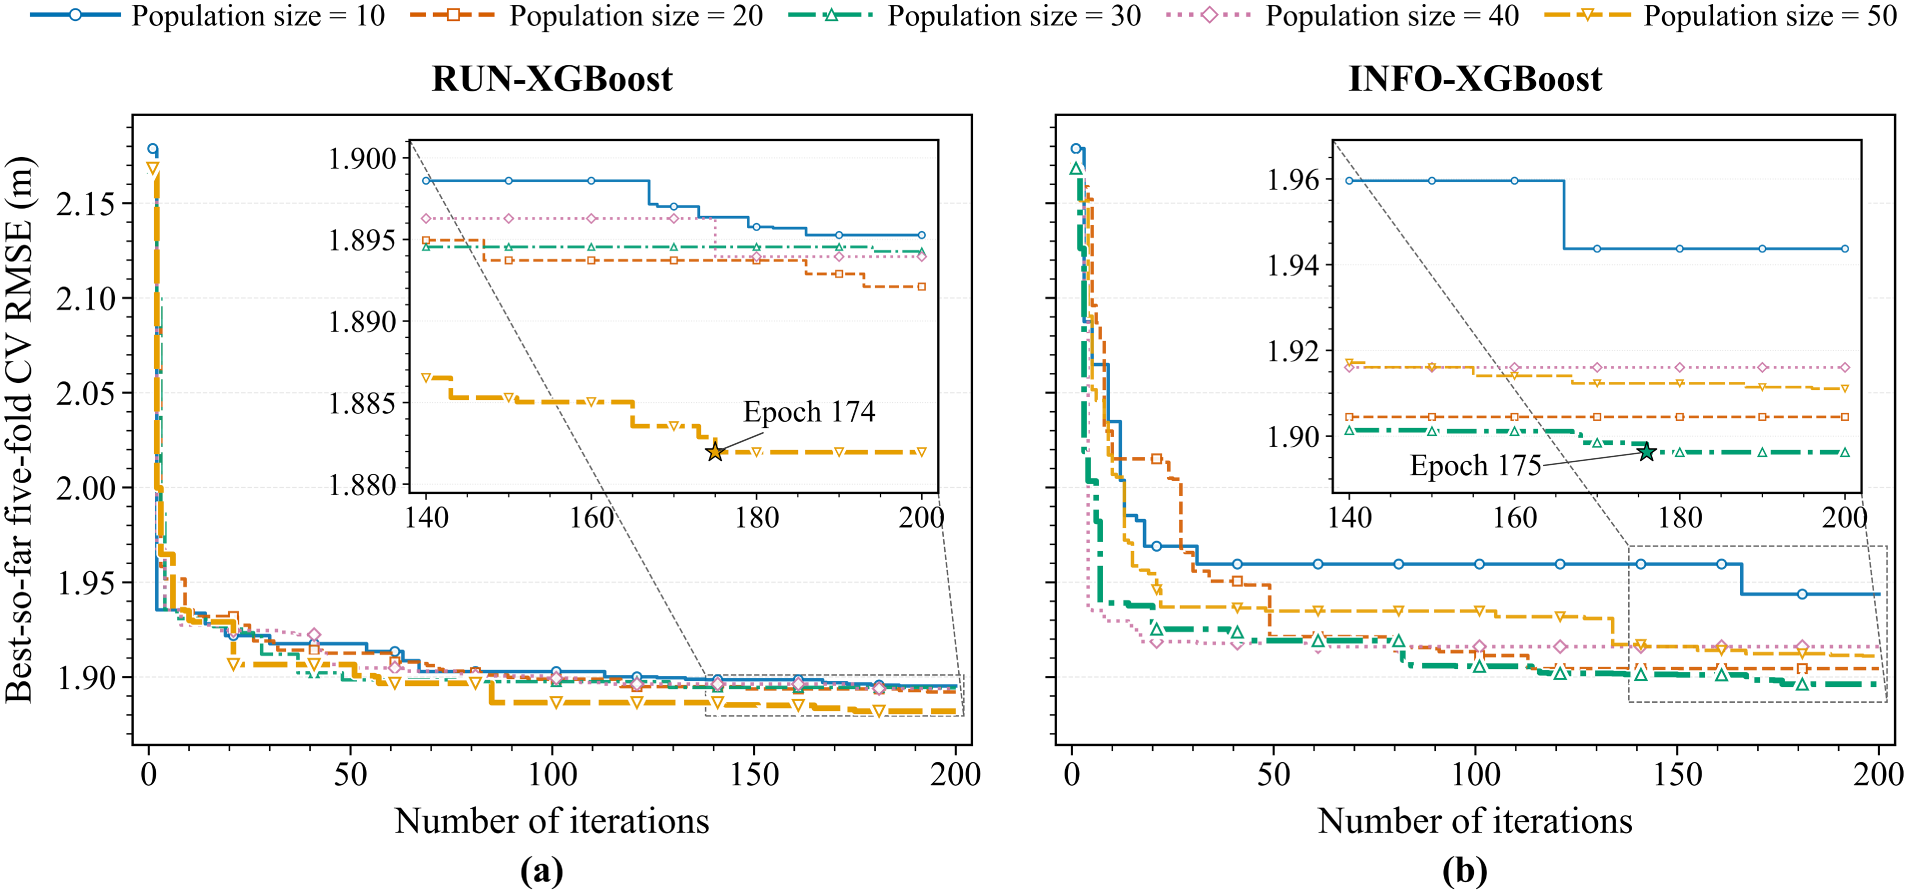
Figure 8: Convergence trends of fitness values during optimization under different population sizes: (a) RUN-XGBoost; (b) INFO-XGBoost.
The repeated five-fold cross-validation results under different population sizes are presented in Table 3. To provide a more intuitive comparison of the relative performance of different population sizes across multiple validation metrics, the repeated-cross-validation results were further visualized using chord diagrams, as shown in Fig. 9. For each optimizer, the five population sizes were ranked according to the mean values of R2, RMSE, MAE, and MedAE obtained from repeated five-fold cross-validation. A larger R2 indicates better performance, whereas smaller RMSE, MAE, and MedAE values indicate better performance. For each metric, the best, second-best, third, fourth, and fifth population configurations were assigned scores of 5, 4, 3, 2, and 1, respectively. The total score for each population size was then obtained by summing its scores across the four metrics. In the chord diagrams, the connecting bands represent the contributions of the individual metrics to the total score of each population configuration, thereby providing an intuitive summary of their relative overall performance. Table 3 and Fig. 9 jointly show that population size had a certain influence on model performance, but this influence did not vary monotonically with increasing population size. For RUN-XGBoost, the population size of 50 achieved the highest mean R2 and the lowest mean RMSE. Although the population size of 10 yielded slightly lower MAE and MedAE values, the chord-diagram summary, which integrates the relative rankings of R2, RMSE, MAE, and MedAE, indicated that the population size of 50 exhibited the most favorable overall performance. For INFO-XGBoost, the population size of 30 achieved the highest mean R2, the lowest mean RMSE and MAE, and a relatively low MedAE, and therefore obtained the highest overall score in the chord diagram. The standard deviations of the selected configurations were generally comparable to those of the other population settings, indicating relatively stable predictive performance under different data partitions. Therefore, the final population sizes of RUN-XGBoost and INFO-XGBoost were determined as 50 and 30, respectively.
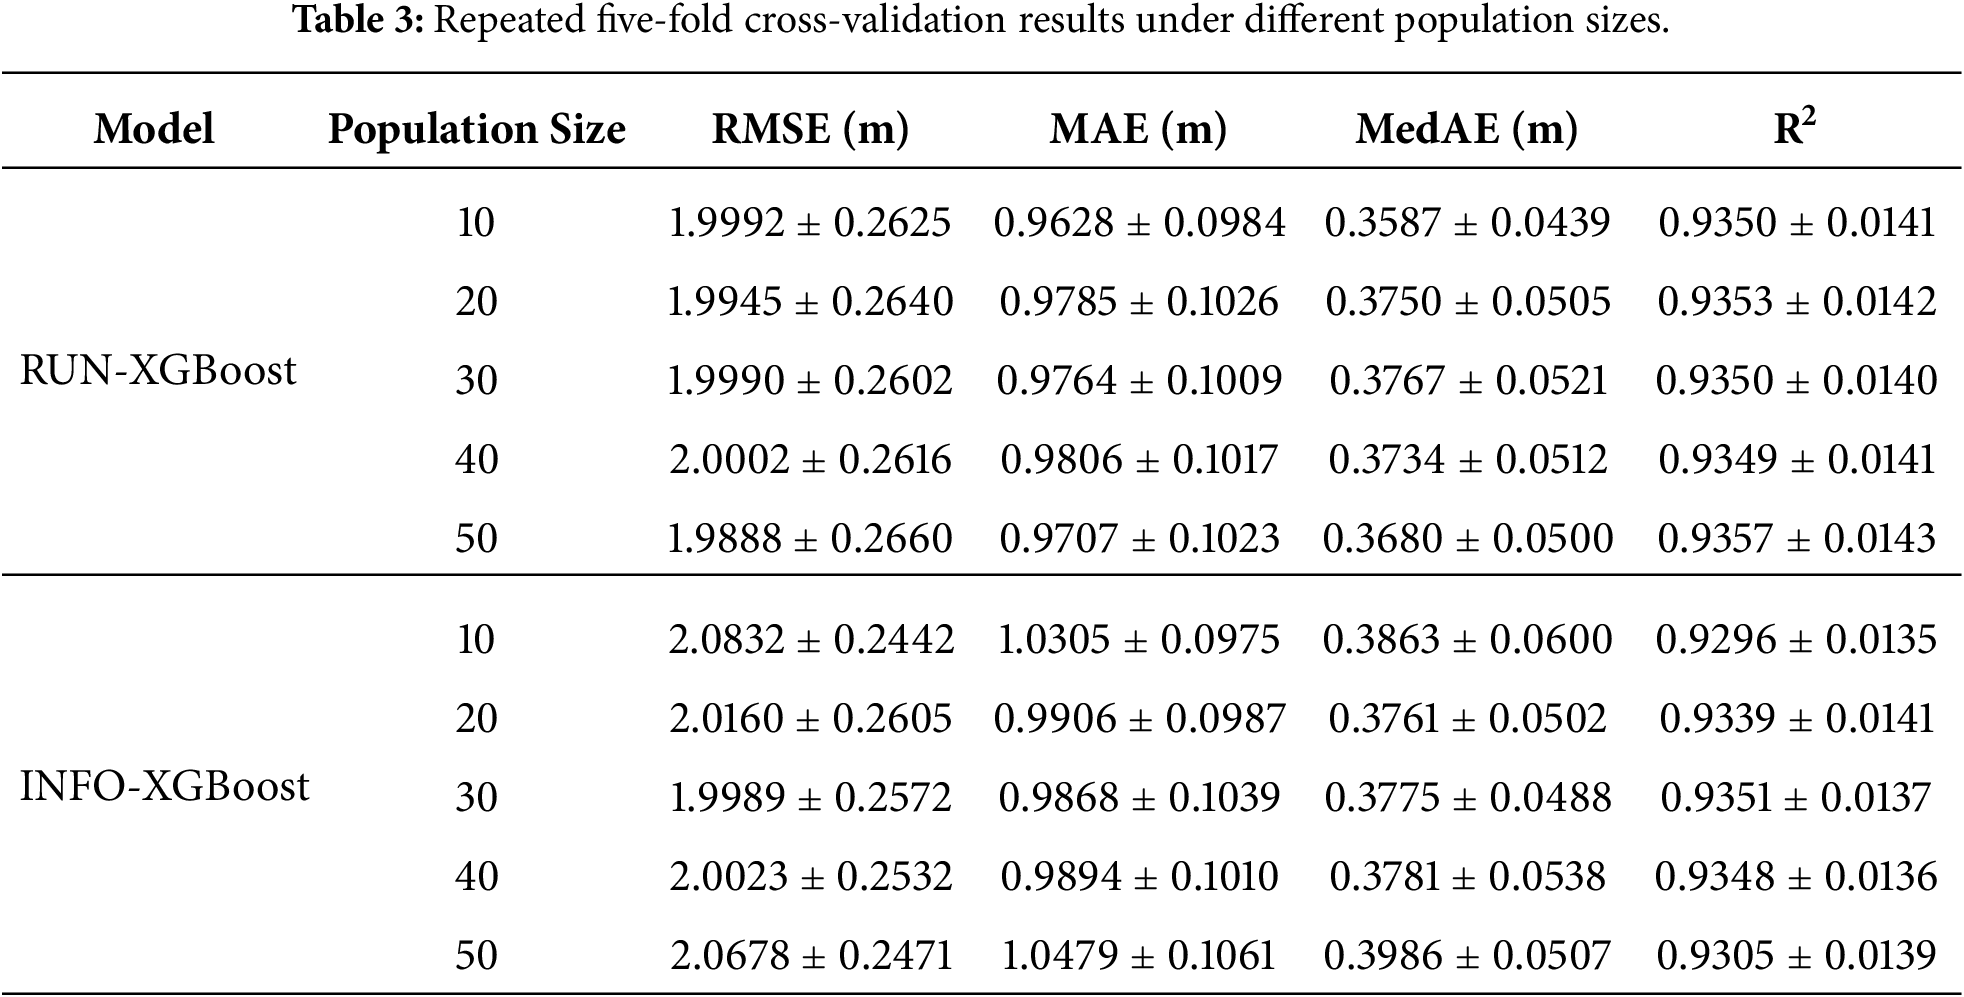
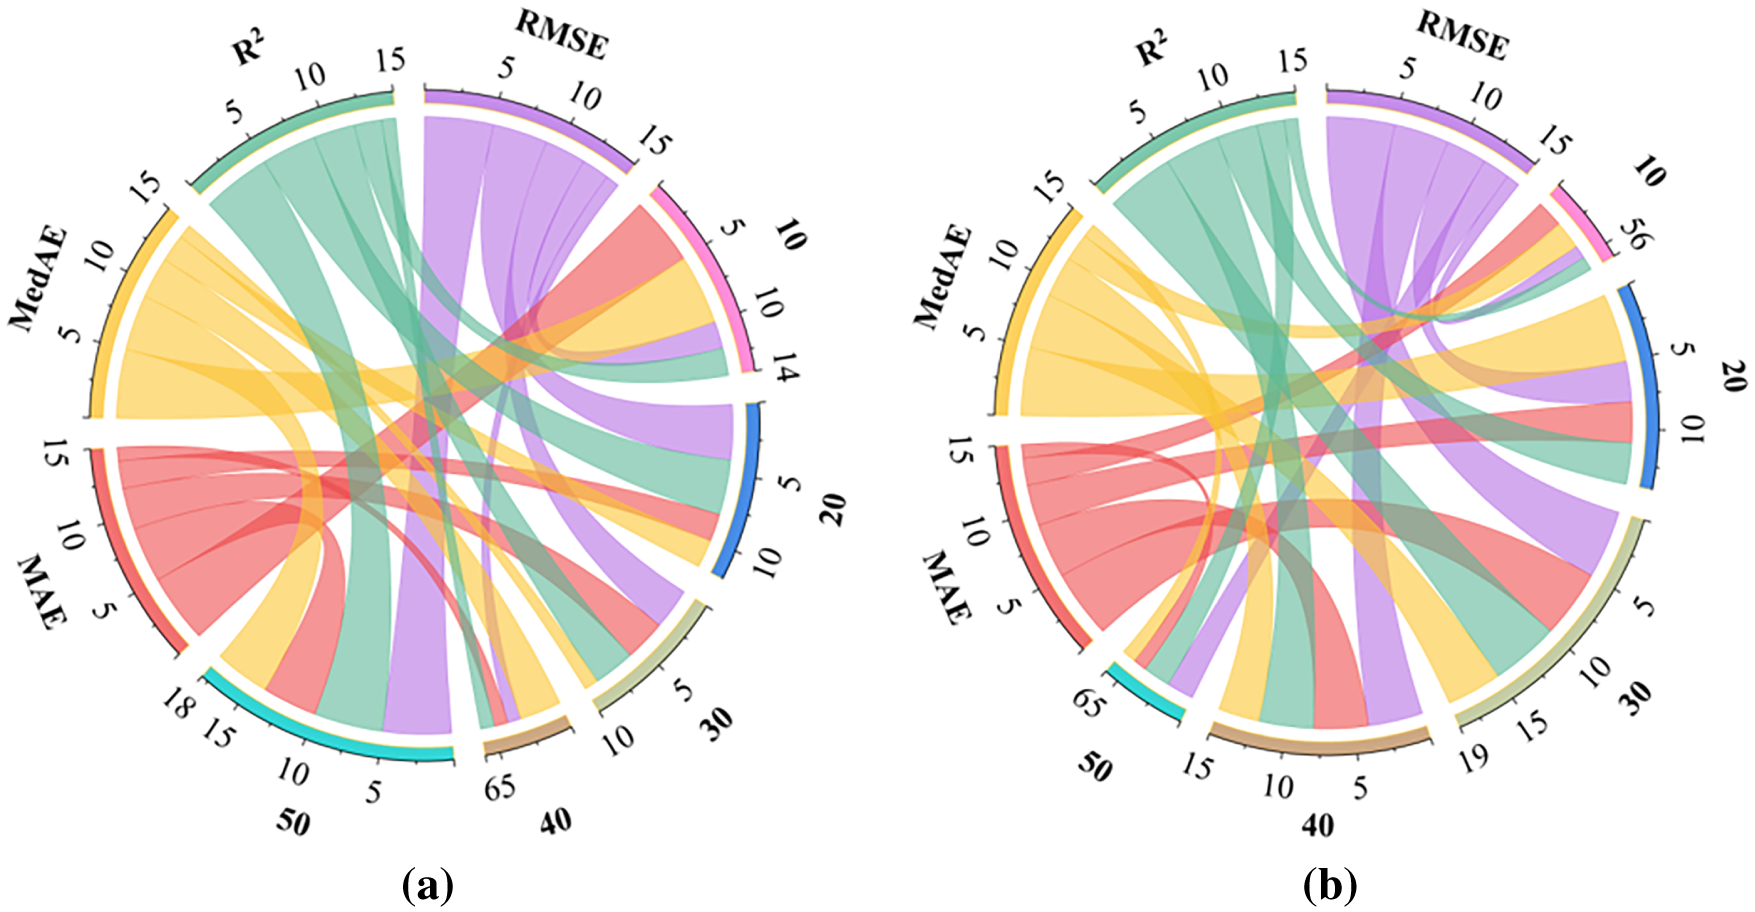
Figure 9: Comprehensive performance scores of models under different population sizes: (a) RUN-XGBoost; (b) INFO-XGBoost.
4.2 Performance Evaluation and Comparison of Optimized Models
To evaluate the predictive performance of the final RUN-XGBoost and INFO-XGBoost models on samples not used for model training, Fig. 10 compares the predicted PZD values with the simulated PZD values in the test set. The red dashed line represents the 1:1 reference line, whereas the blue solid line denotes the regression trend. The shaded region indicates the 95% confidence band obtained from 2000 bootstrap resamples. The colors of the scatter points represent the absolute residuals between the predicted and simulated PZD values. Points closer to yellow correspond to larger prediction errors. The inset plots further show the kernel density distributions of the residuals. For both models, the regression trend is generally close to the 1:1 reference line. The 95% confidence bands are relatively narrow in the low-to-moderate PZD range, indicating stable predictions in this interval. As PZD increases, the confidence bands become wider, and several high-PZD samples deviate from the 1:1 line. This indicates greater prediction uncertainty and larger errors in the high-PZD range.
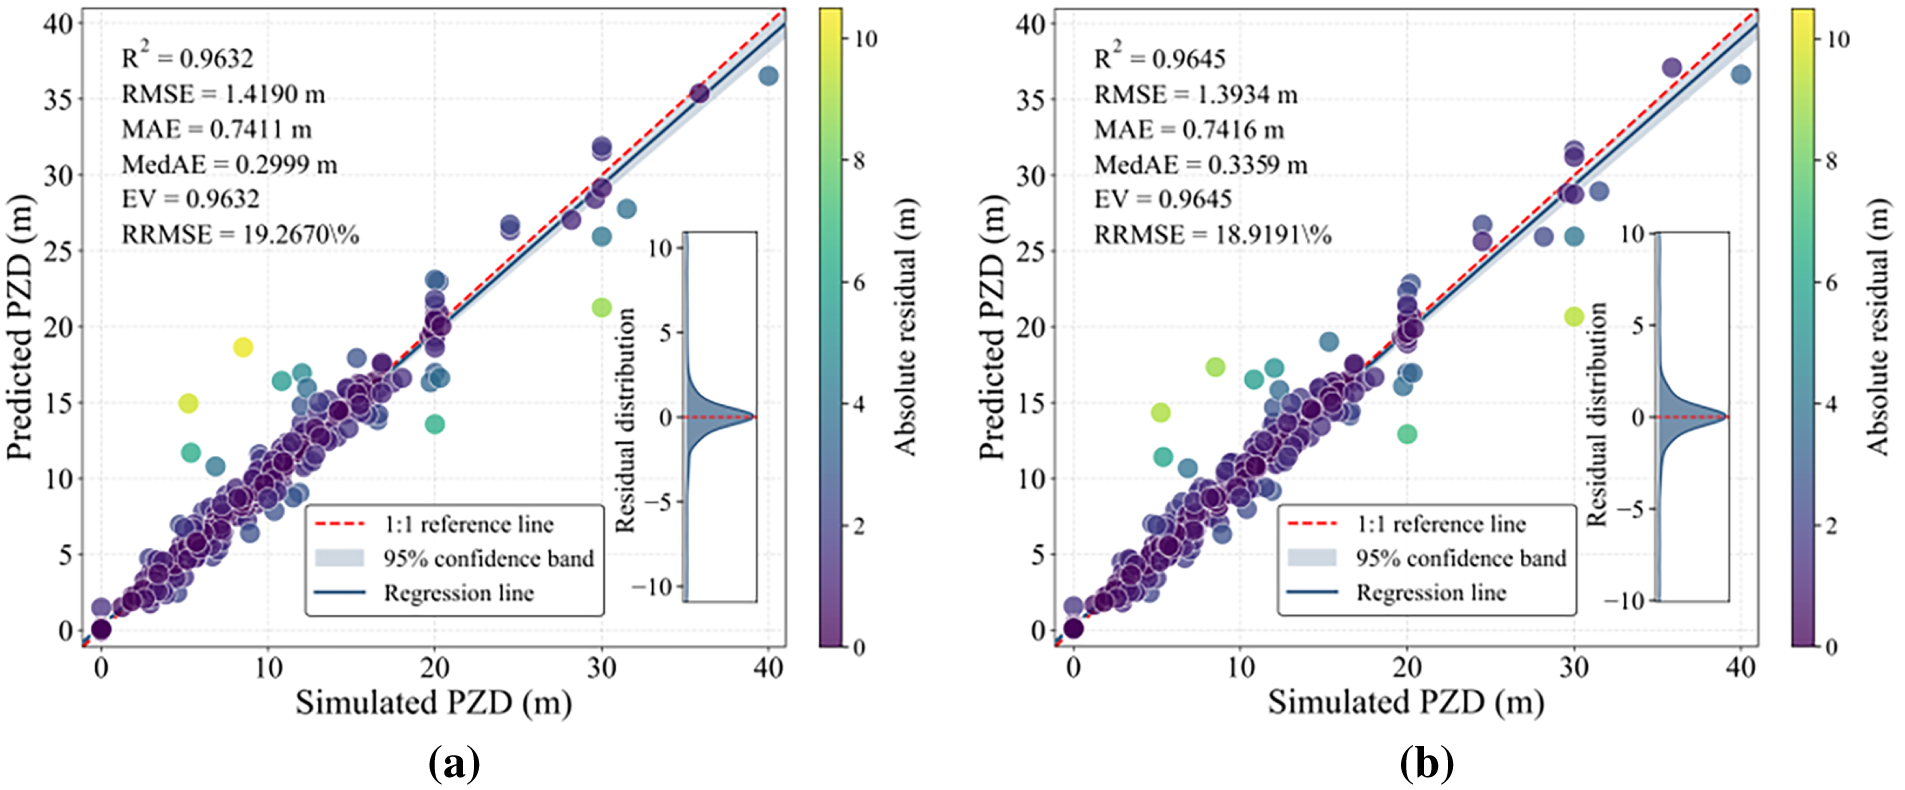
Figure 10: Performance evaluation of models on the test set: (a) RUN-XGBoost; (b) INFO-XGBoost.
To further assess the improvement achieved by RUN- and INFO-based hyperparameter optimization, an unoptimized XGBoost model was constructed as a reference baseline. The same training–test split and input variables were used for all three models. Their detailed performance metrics and the corresponding 95% confidence intervals obtained from 2000 bootstrap resamples are presented in Table 4. The normalized overall performance comparison is shown in Fig. 11. For normalization, R2 and EV were treated as positive indicators, whereas RMSE, MAE, MedAE, and relative RMSE were treated as negative indicators. A normalized score closer to 1 indicates better relative performance. Compared with the unoptimized XGBoost model, RUN-XGBoost reduced RMSE, MAE, MedAE, and relative RMSE by 27.63%, 35.16%, 47.65%, and 27.63%, respectively. Its R2 and EV both increased by 3.60%. INFO-XGBoost reduced the corresponding error metrics by 28.94%, 35.12%, 41.37%, and 28.94%, respectively. Its R2 and EV both increased by approximately 3.74%. As shown in Table 4 and Fig. 11, the unoptimized XGBoost model performed worse than both optimized models for all six metrics. INFO-XGBoost was slightly better in terms of R2, RMSE, EV, and relative RMSE, whereas RUN-XGBoost achieved lower MAE and MedAE values. The 95% confidence intervals of the two optimized models overlapped substantially, and their normalized scores were both close to 1. This indicates that the two models achieved comparable overall predictive performance and that both clearly outperformed the unoptimized XGBoost model.
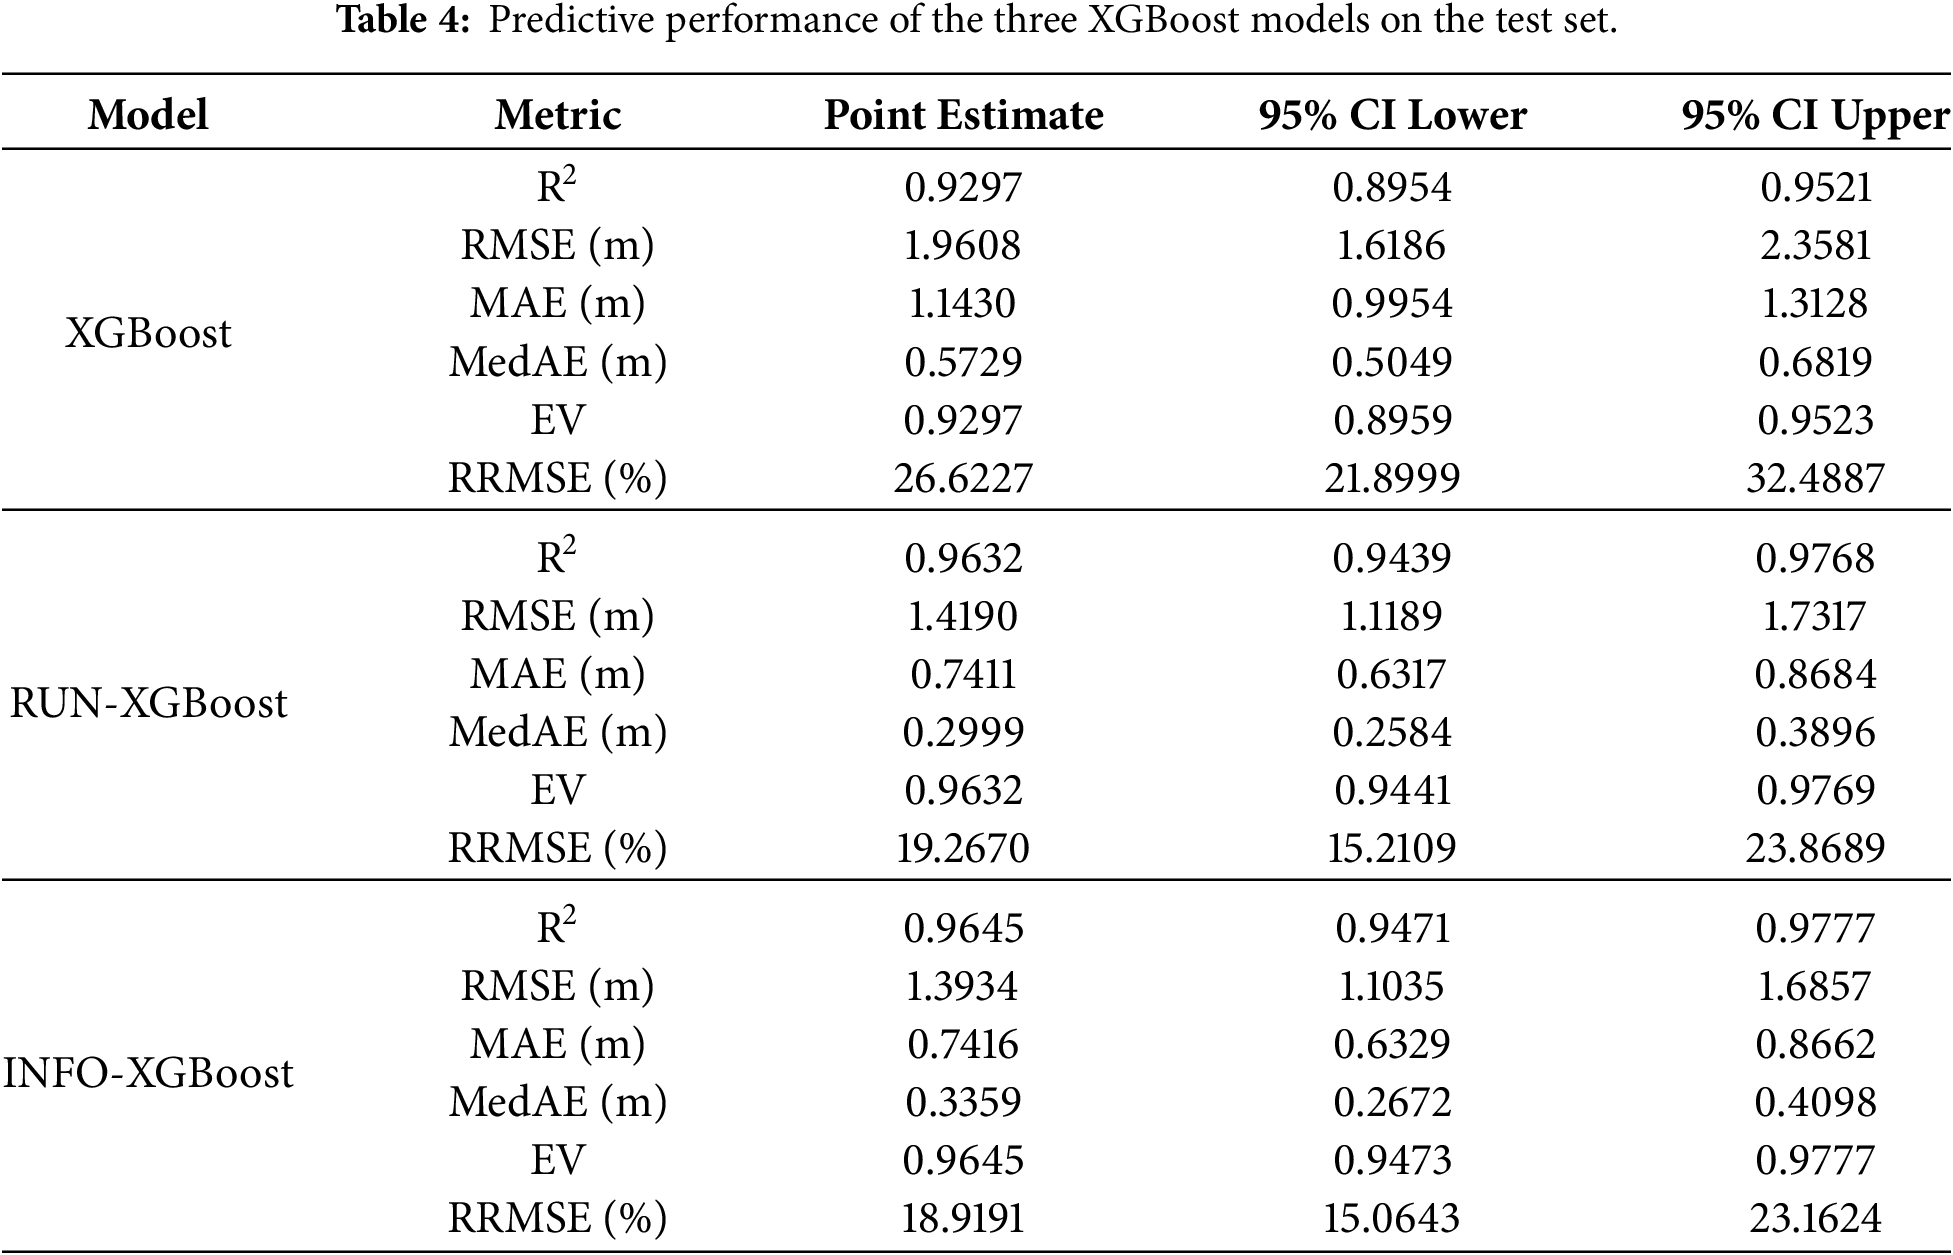
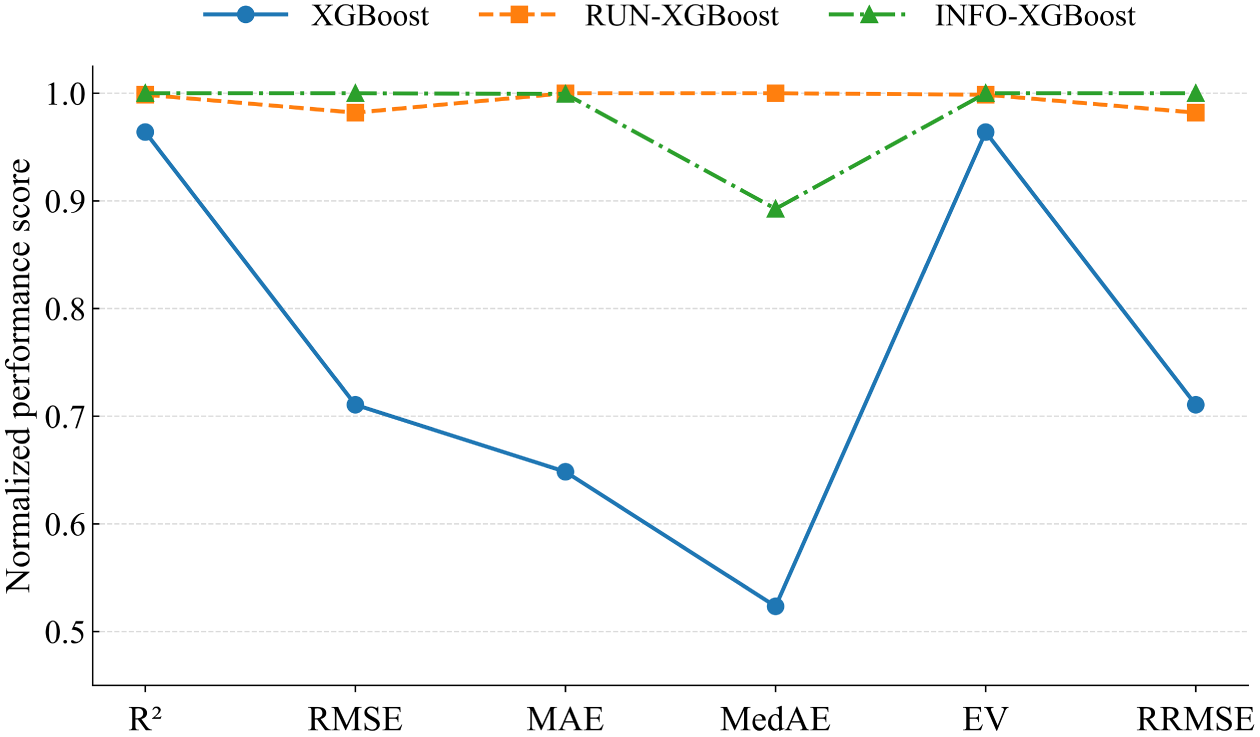
Figure 11: Normalized comprehensive performance comparison of unoptimized XGBoost, RUN-XGBoost, and INFO-XGBoost on the test set.
Fig. 12 further presents the residual histograms and normal Q–Q plots of RUN-XGBoost and INFO-XGBoost on the test set. The residual was defined as the difference between the predicted PZD and the simulated PZD. For both models, the residuals were concentrated near zero. The mean residuals of RUN-XGBoost and INFO-XGBoost were 0.0397 and 0.0480 m, respectively. These small values indicate that neither model exhibited a clear overall tendency toward systematic overprediction or underprediction. The residual standard deviations of RUN-XGBoost and INFO-XGBoost were 1.4203 and 1.3944 m, respectively. The slightly lower residual dispersion of INFO-XGBoost is consistent with its lower test-set RMSE. In the Q–Q plots, most central points were close to the reference line, whereas the points at both tails deviated noticeably. This indicates that the residual distributions had heavy tails and that a small number of test samples still exhibited relatively large prediction errors.
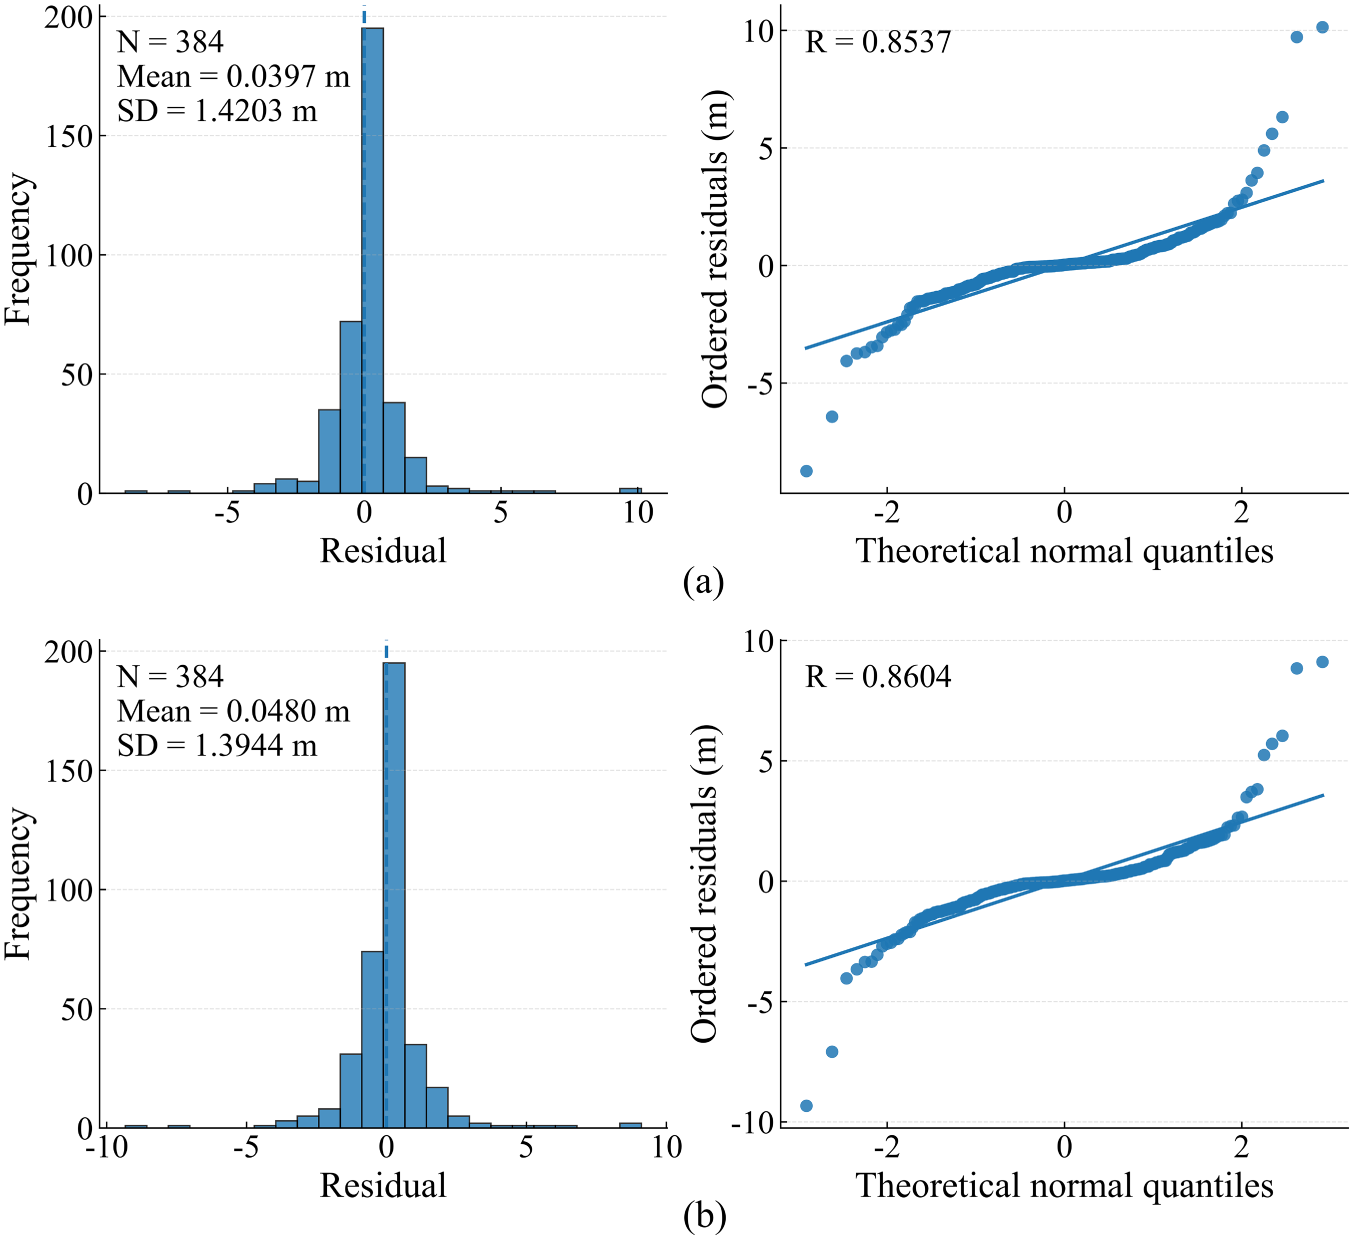
Figure 12: Residual distributions and normal Q–Q plots of the models on the test set: (a) RUN-XGBoost; (b) INFO-XGBoost.
Because the residual distributions showed heavy-tailed behavior, a small number of large errors could affect mean-based evaluation metrics. A two-sided Wilcoxon signed-rank test was therefore used to compare the absolute errors of the models on the same test samples. The p-values from the three pairwise comparisons were adjusted using the Holm procedure, as shown in Table 5. The Holm-adjusted p-value for the comparison between RUN-XGBoost and INFO-XGBoost was 0.0655, which exceeded the significance level of 0.05. Therefore, the available evidence was insufficient to demonstrate a statistically significant difference between the absolute error distributions of the two optimized models. In contrast, the Holm-adjusted p-values for RUN-XGBoost vs. unoptimized XGBoost and INFO-XGBoost vs. unoptimized XGBoost were 4.21 × 10⁻¹⁸ and 7.94 × 10⁻¹⁸, respectively. Both values were far below 0.05. This confirms that the reductions in absolute prediction error achieved by the two hyperparameter optimization methods were statistically significant relative to the unoptimized XGBoost model.

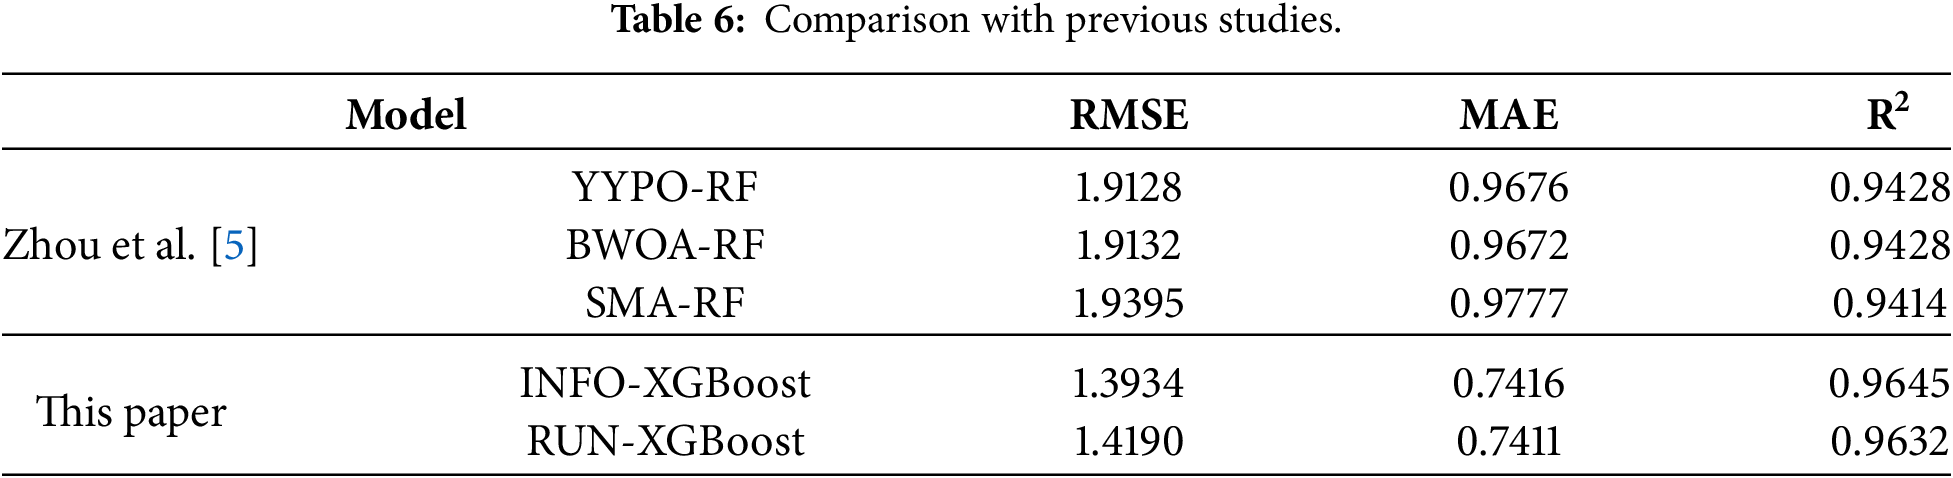
To further evaluate the performance of the proposed models against existing PZD prediction methods, RUN-XGBoost and INFO-XGBoost were compared with the models reported by Zhou et al. [5], as summarized in Table 6. Zhou et al. [5] used 1920 numerical samples from the same data source and the same 12 input variables. They applied YYPO, BWOA, and SMA to optimize two hyperparameters of a random forest model and reported the test-set results for PZD at the key point. As shown in Table 6, the R2 values of the two optimized XGBoost models ranged from 0.9632 to 0.9645. Their RMSE and MAE values ranged from 1.3934 to 1.4190 m and from 0.7411 to 0.7416 m, respectively. These results were generally better than those reported for the three optimized random-forest models by Zhou et al. [5]. In addition to expanding the hyperparameter search space of XGBoost, the present study employed repeated cross-validation, bootstrap confidence intervals, Wilcoxon tests, residual diagnostics, and SHAP-based interpretability analysis.
Overall, both RUN-XGBoost and INFO-XGBoost significantly outperformed the unoptimized XGBoost baseline. However, the difference in absolute prediction errors between the two optimized models was not statistically significant, indicating that their overall predictive performance was comparable. INFO-XGBoost was slightly better in terms of R2, RMSE, EV, and RRMSE, whereas RUN-XGBoost achieved lower MAE and MedAE values. As reported in Section 4.1, the mean R2, RMSE, and MAE obtained by RUN-XGBoost in repeated cross-validation were 0.9357, 1.9888, and 0.9707 m, respectively. The corresponding values for INFO-XGBoost were 0.9351, 1.9989, and 0.9868 m. RUN-XGBoost therefore showed slightly better error control across different training–validation splits. It also achieved slightly lower MAE and MedAE values on the test set. Accordingly, RUN-XGBoost was selected as the representative PZD surrogate model for the subsequent SHAP interpretation and B–Z parameter screening. This selection was based on the predefined model-selection criterion and the overall comparison. It does not imply that RUN-XGBoost was statistically superior to INFO-XGBoost.
SHAP analysis aims to evaluate the importance of each input variable to the model predictions by quantifying both the magnitude and direction of its influence. This analysis has been used in many civil and mining studies [59–61]. To interpret the predictive behavior of the final RUN-XGBoost model, Global SHAP analysis was performed using all 384 held-out test samples, and one representative sample was selected for local interpretation. SHAP values quantify the contribution of each input variable to the model prediction rather than establishing strict physical causality. In addition, several variables, including the RMR, rock mass deformation modulus E, cohesion C, uniaxial compressive strength σc, and tensile strength σt, are strongly correlated in the database. Their individual SHAP importance may therefore be affected by overlapping information. Consequently, the importance ranking should not be interpreted as the independent physical influence of each variable.
Fig. 13 presents the global SHAP interpretation of the final RUN-XGBoost model. The left panel ranks the input variables according to their mean absolute SHAP values and presents their relative contribution shares, whereas the right panel shows the distribution of sample-level SHAP values for the test samples. In the right panel, the horizontal axis represents the SHAP contribution to the predicted PZD, with positive and negative values indicating increases and decreases in the model prediction, respectively. The color gradient represents the original feature value, ranging from relatively low to high values. The coefficient of lateral stress K has the highest importance, accounting for 28.8% of the total importance. It is followed by the overburden depth H and rock mass unit weight γ, which account for 23.0% and 22.6%, respectively. The tensile strength σt, pillar width B, and crown elevation difference Z account for 13.7%, 5.8%, and 5.1%, respectively. The remaining six variables together contribute approximately 0.9%. These results indicate that, within the current numerical database and parameter ranges, the model mainly relies on the in situ stress state, overburden loading, tensile resistance of the rock mass, and cavern geometry to predict PZD. The SHAP-value distributions further show that higher values of K, H, and γ are generally associated with positive contributions to the model predictions, indicating a tendency toward higher predicted PZD values within the parameter ranges represented in the database. From a rock-mechanics perspective, a higher K may be associated with stronger stress concentration around the cavern boundary and within the inter-cavern rock pillar. Increases in H and γ may correspond to higher initial stress and self-weight loading, thereby intensifying excavation-induced stress redistribution. In contrast, higher values of σt, B, and Z are generally associated with negative SHAP contributions. The negative contribution of σt is broadly consistent with the greater resistance of stronger rock masses to plastic-zone extension. Similarly, the model-based patterns observed for B and Z may reflect changes in the interaction between the excavation-induced disturbance zones of the adjacent caverns. These interpretations should be regarded as possible mechanical explanations of the associations learned by the model rather than as direct evidence of independent physical causality.
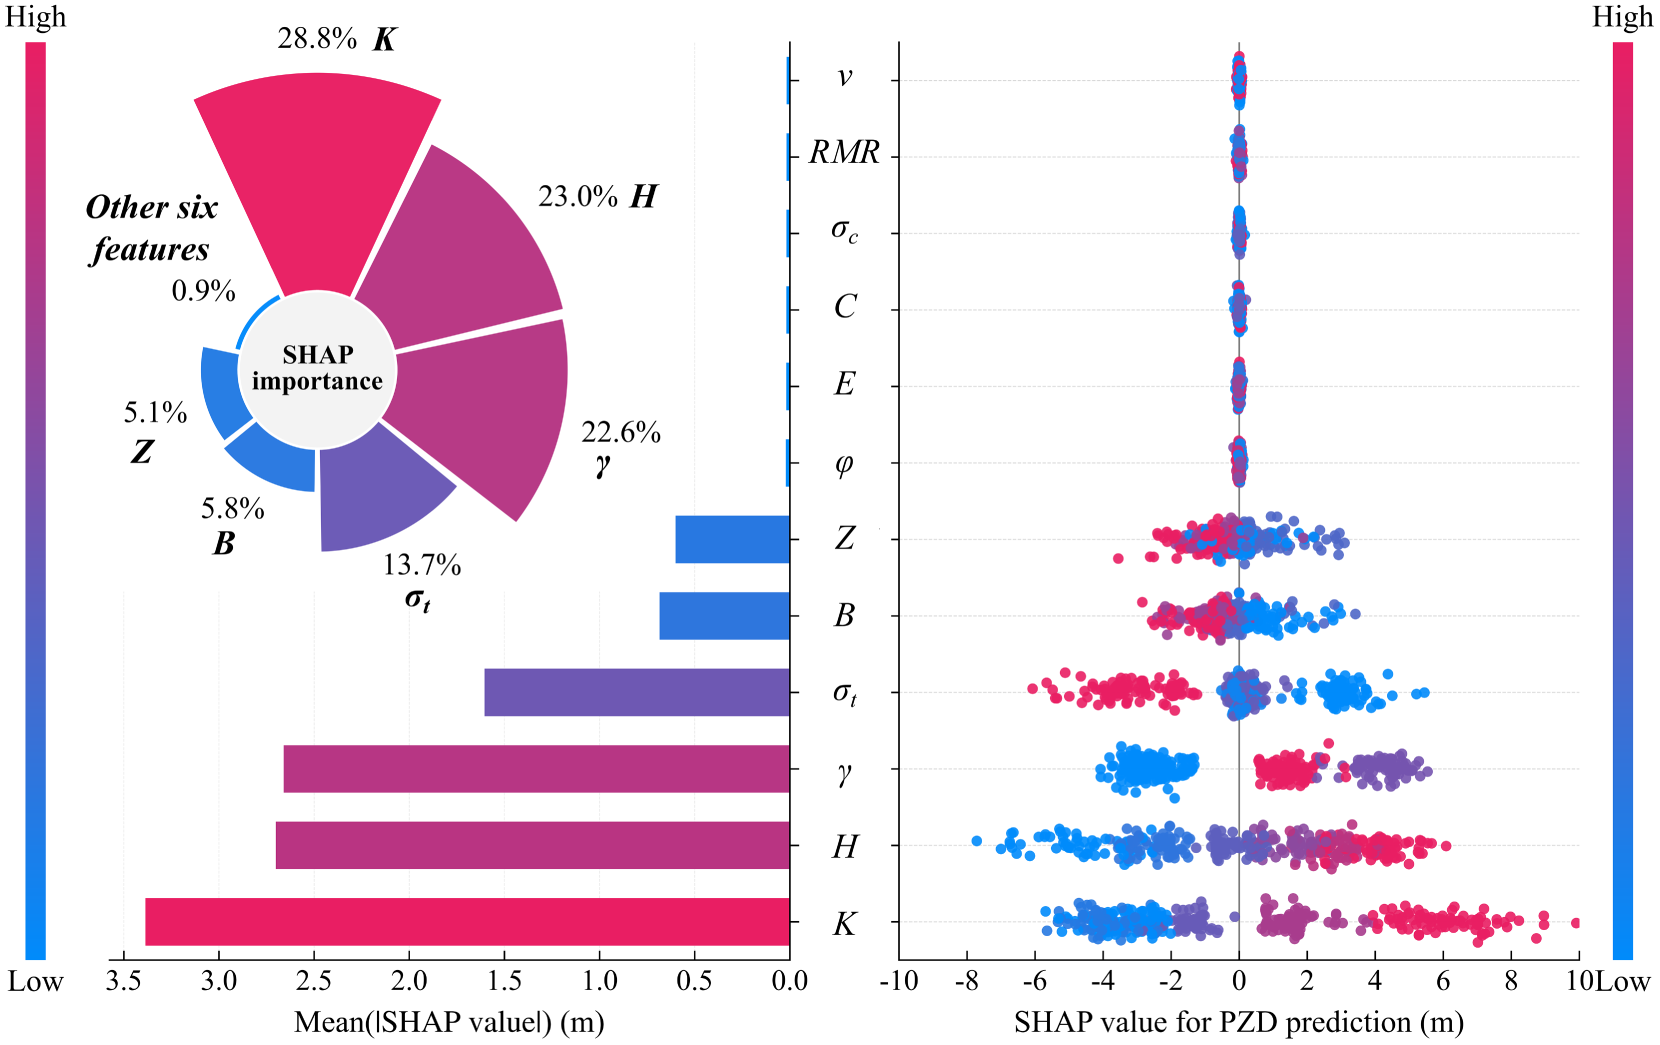
Figure 13: Global SHAP interpretation.
Fig. 14 presents the local SHAP interpretation of a representative test sample. In the waterfall plot, E[f(X)] represents the baseline prediction of the model, whereas f(x) represents the final prediction for the selected sample. Features with positive SHAP values increase the predicted PZD, whereas those with negative SHAP values decrease it. The value shown beside each feature denotes its input value for the selected sample. The simulated PZD of this sample is 8.460 m, while the model prediction is 8.467 m. The SHAP baseline value, E[f(X)], is 7.691 m. For this sample, an overburden depth of H = 152 m produces the largest negative contribution, with a SHAP value of −5.89 m. A rock mass unit weight of γ = 27 kN/m3, a tensile strength of σt = 0.04 MPa, and a coefficient of lateral stress of K = 2 produce positive contributions of +3.49, +2.45, and +2.19 m, respectively. A crown elevation difference of Z = 20 m and a pillar width of B = 40 m contribute −0.74 and −0.71 m, respectively. The final prediction is obtained by combining the positive and negative contributions of all input variables.
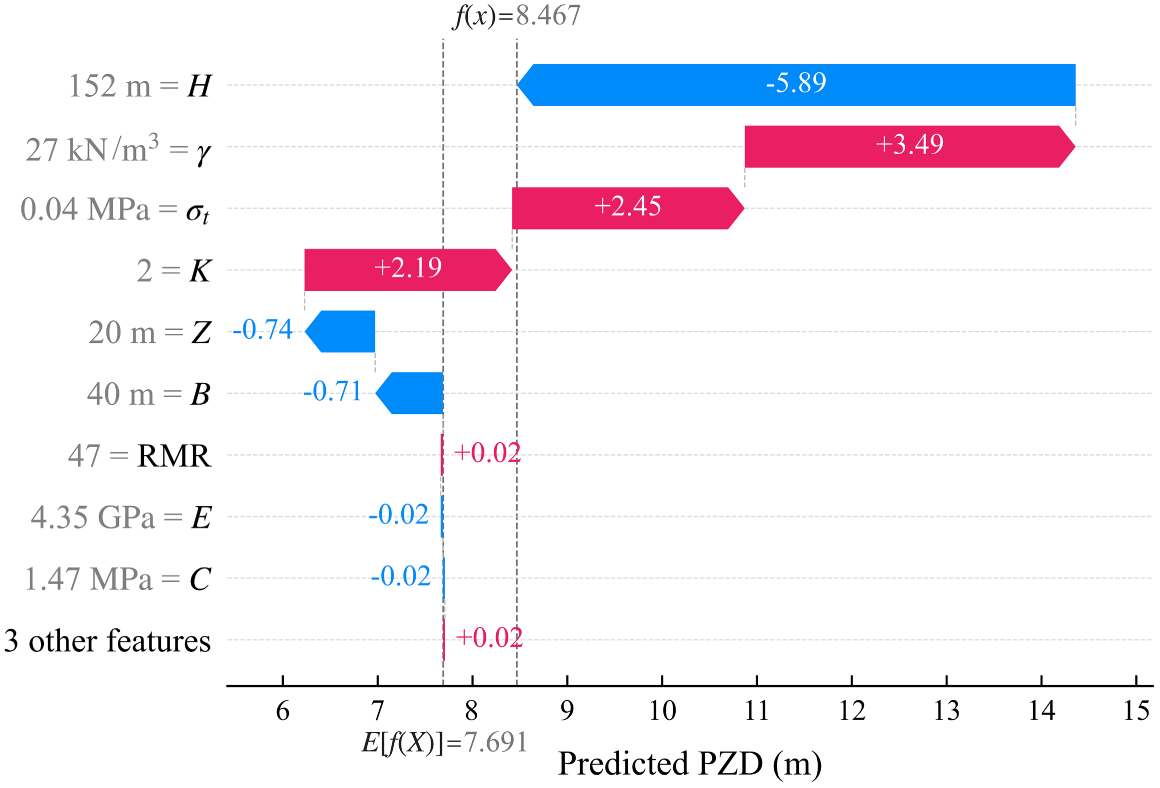
Figure 14: SHAP waterfall plot for the local interpretation of a representative test sample.
Overall, the global and local SHAP results consistently identify K, H, γ, σt, B, and Z as the principal variables governing the model prediction of PZD. Their response patterns are broadly consistent with the effects of the initial stress state, excavation-induced unloading, rock mass strength, and cavern interaction. However, these results explain only the predictive behavior of the model within the present two-dimensional finite-element database and its parameter ranges. They should not be regarded as universally applicable physical causal relationships.
4.4 Target-Oriented Screening of B–Z Parameters for PZD Control
To demonstrate the application of the developed surrogate model to the rapid screening of underground powerhouse layout parameters, the pillar width B and the crown elevation difference Z were selected as adjustable variables, while the other ten input parameters were held constant. Predictions were then performed for the 16 discrete B–Z combinations represented in the database. A test sample was selected as the representative case, with the original parameters B = 20 m and Z = 0 m and a corresponding predicted PZD of 20.12 m. A 20% reduction relative to the original predicted value was adopted as a representative control scenario, resulting in a target threshold of 16.10 m. This target was introduced solely to illustrate the parameter-screening procedure of the surrogate model and should not be interpreted as a universal safety criterion applicable to all engineering conditions. The prediction results for the different discrete combinations are shown in Fig. 15. Among the 16 combinations, all combinations except B = 20 m, Z = 0 m and B = 20 m, Z = −10 m satisfied the prescribed control target, indicating that the parameter combinations meeting the target were not unique. Among the combinations satisfying the control target, priority was given to those requiring a smaller adjustment relative to the original case. When multiple combinations involved the same adjustment magnitude, the combination with the lower predicted PZD was further selected. Accordingly, B = 20 m and Z = 10 m were identified as the representative candidate combination. Its predicted PZD was 11.18 m, corresponding to a reduction of approximately 44.4% relative to the original case. To further examine the screening result, the RUN-XGBoost predictions were compared with the corresponding finite element method (FEM)-based PZD values contained in the original numerical database, while the other ten input parameters were kept unchanged. The comparison results are summarized in Table 7. For the original case, the FEM-based PZD was 20.000 m, compared with the RUN-XGBoost prediction of 20.121 m, corresponding to a relative deviation of 0.61%. For the selected candidate, the FEM-based PZD was 11.487 m, whereas the RUN-XGBoost prediction was 11.177 m, giving a relative deviation of 2.70%. Relative to the original case, the FEM-based PZD decreased by approximately 42.6%, which was close to the model-predicted reduction of 44.4%. Both the FEM-based and model-predicted results therefore consistently indicated that the selected candidate satisfied the prescribed 20% PZD-reduction target.
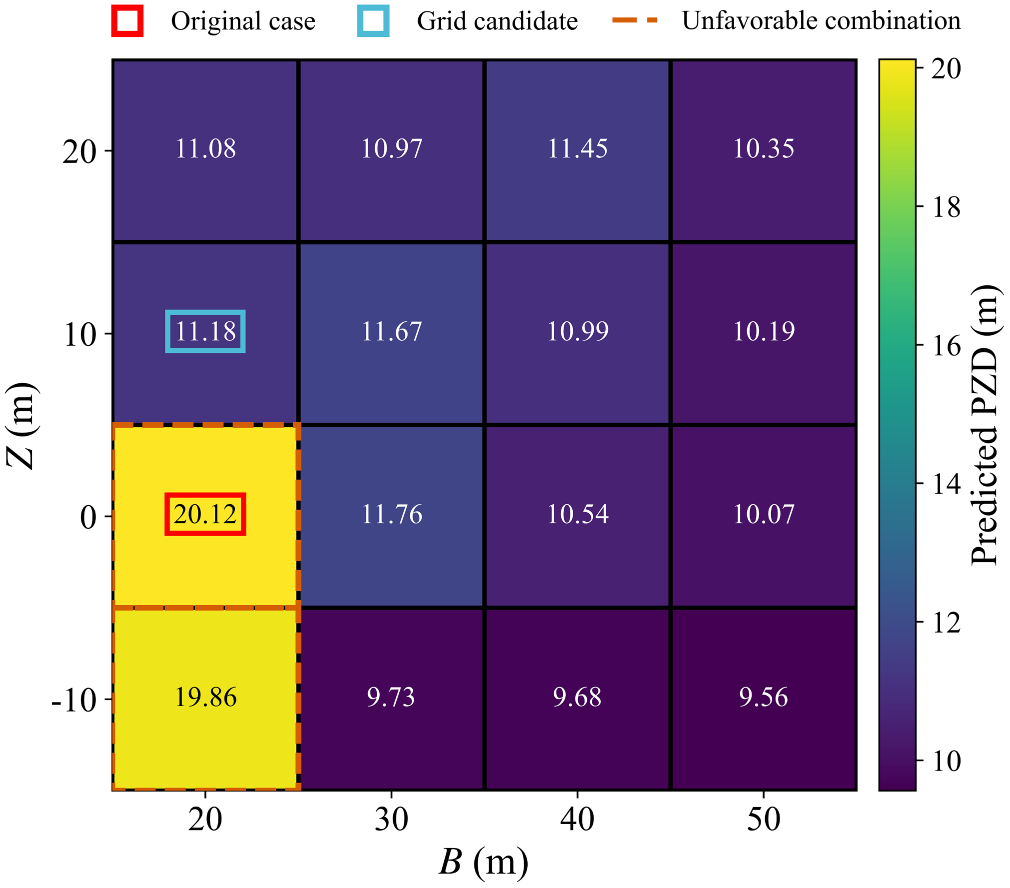
Figure 15: Target-oriented screening results for the B–Z combinations under the 20% PZD-reduction target.

It should be emphasized that this candidate combination does not correspond to the minimum PZD among all combinations, nor does it represent a unique optimal design. Rather, it is a representative screening result obtained by jointly considering satisfaction of the control target and the magnitude of parameter adjustment. In addition, PZD reflects only the local extent of the plastic zone around the underground powerhouse. Therefore, the screening result is intended primarily for preliminary scheme evaluation and should not replace detailed numerical analysis, support design, or field stability assessment for a specific engineering project. Because the FEM-based PZD values used in the above comparison were retrieved from the same original numerical database used for model development, this comparison should be regarded as an additional database-level consistency check rather than as an independent external validation.
4.5 Graphical User Interface Development
To facilitate model operation and result visualization, a graphical user interface (GUI) was developed using Python and PyQt5, as shown in Fig. 16. The interface embeds the final RUN-XGBoost model with a population size of 50 and integrates model reconstruction, single-sample PZD prediction, local SHAP interpretation, discrete B–Z parameter screening, result visualization, and data export. Fig. 16a presents the forward-prediction and local-SHAP module. Users can input the 12 original physical variables to obtain the predicted PZD at the key point. The predicted value is displayed together with a schematic indication of the key point on the powerhouse–transformer cavern layout. The visualization area can also be switched to a SHAP waterfall plot to show the positive and negative contributions of individual variables. Fig. 16b presents the target-oriented B–Z screening module. With the remaining ten parameters fixed, the module evaluates the 16 discrete B–Z combinations contained in the database under a specified PZD-reduction target. The original case, selected candidate, and unfavorable combinations are displayed in a discrete heatmap, while the corresponding B, Z, predicted PZD, reduction ratio, and assessment result are listed in a table.
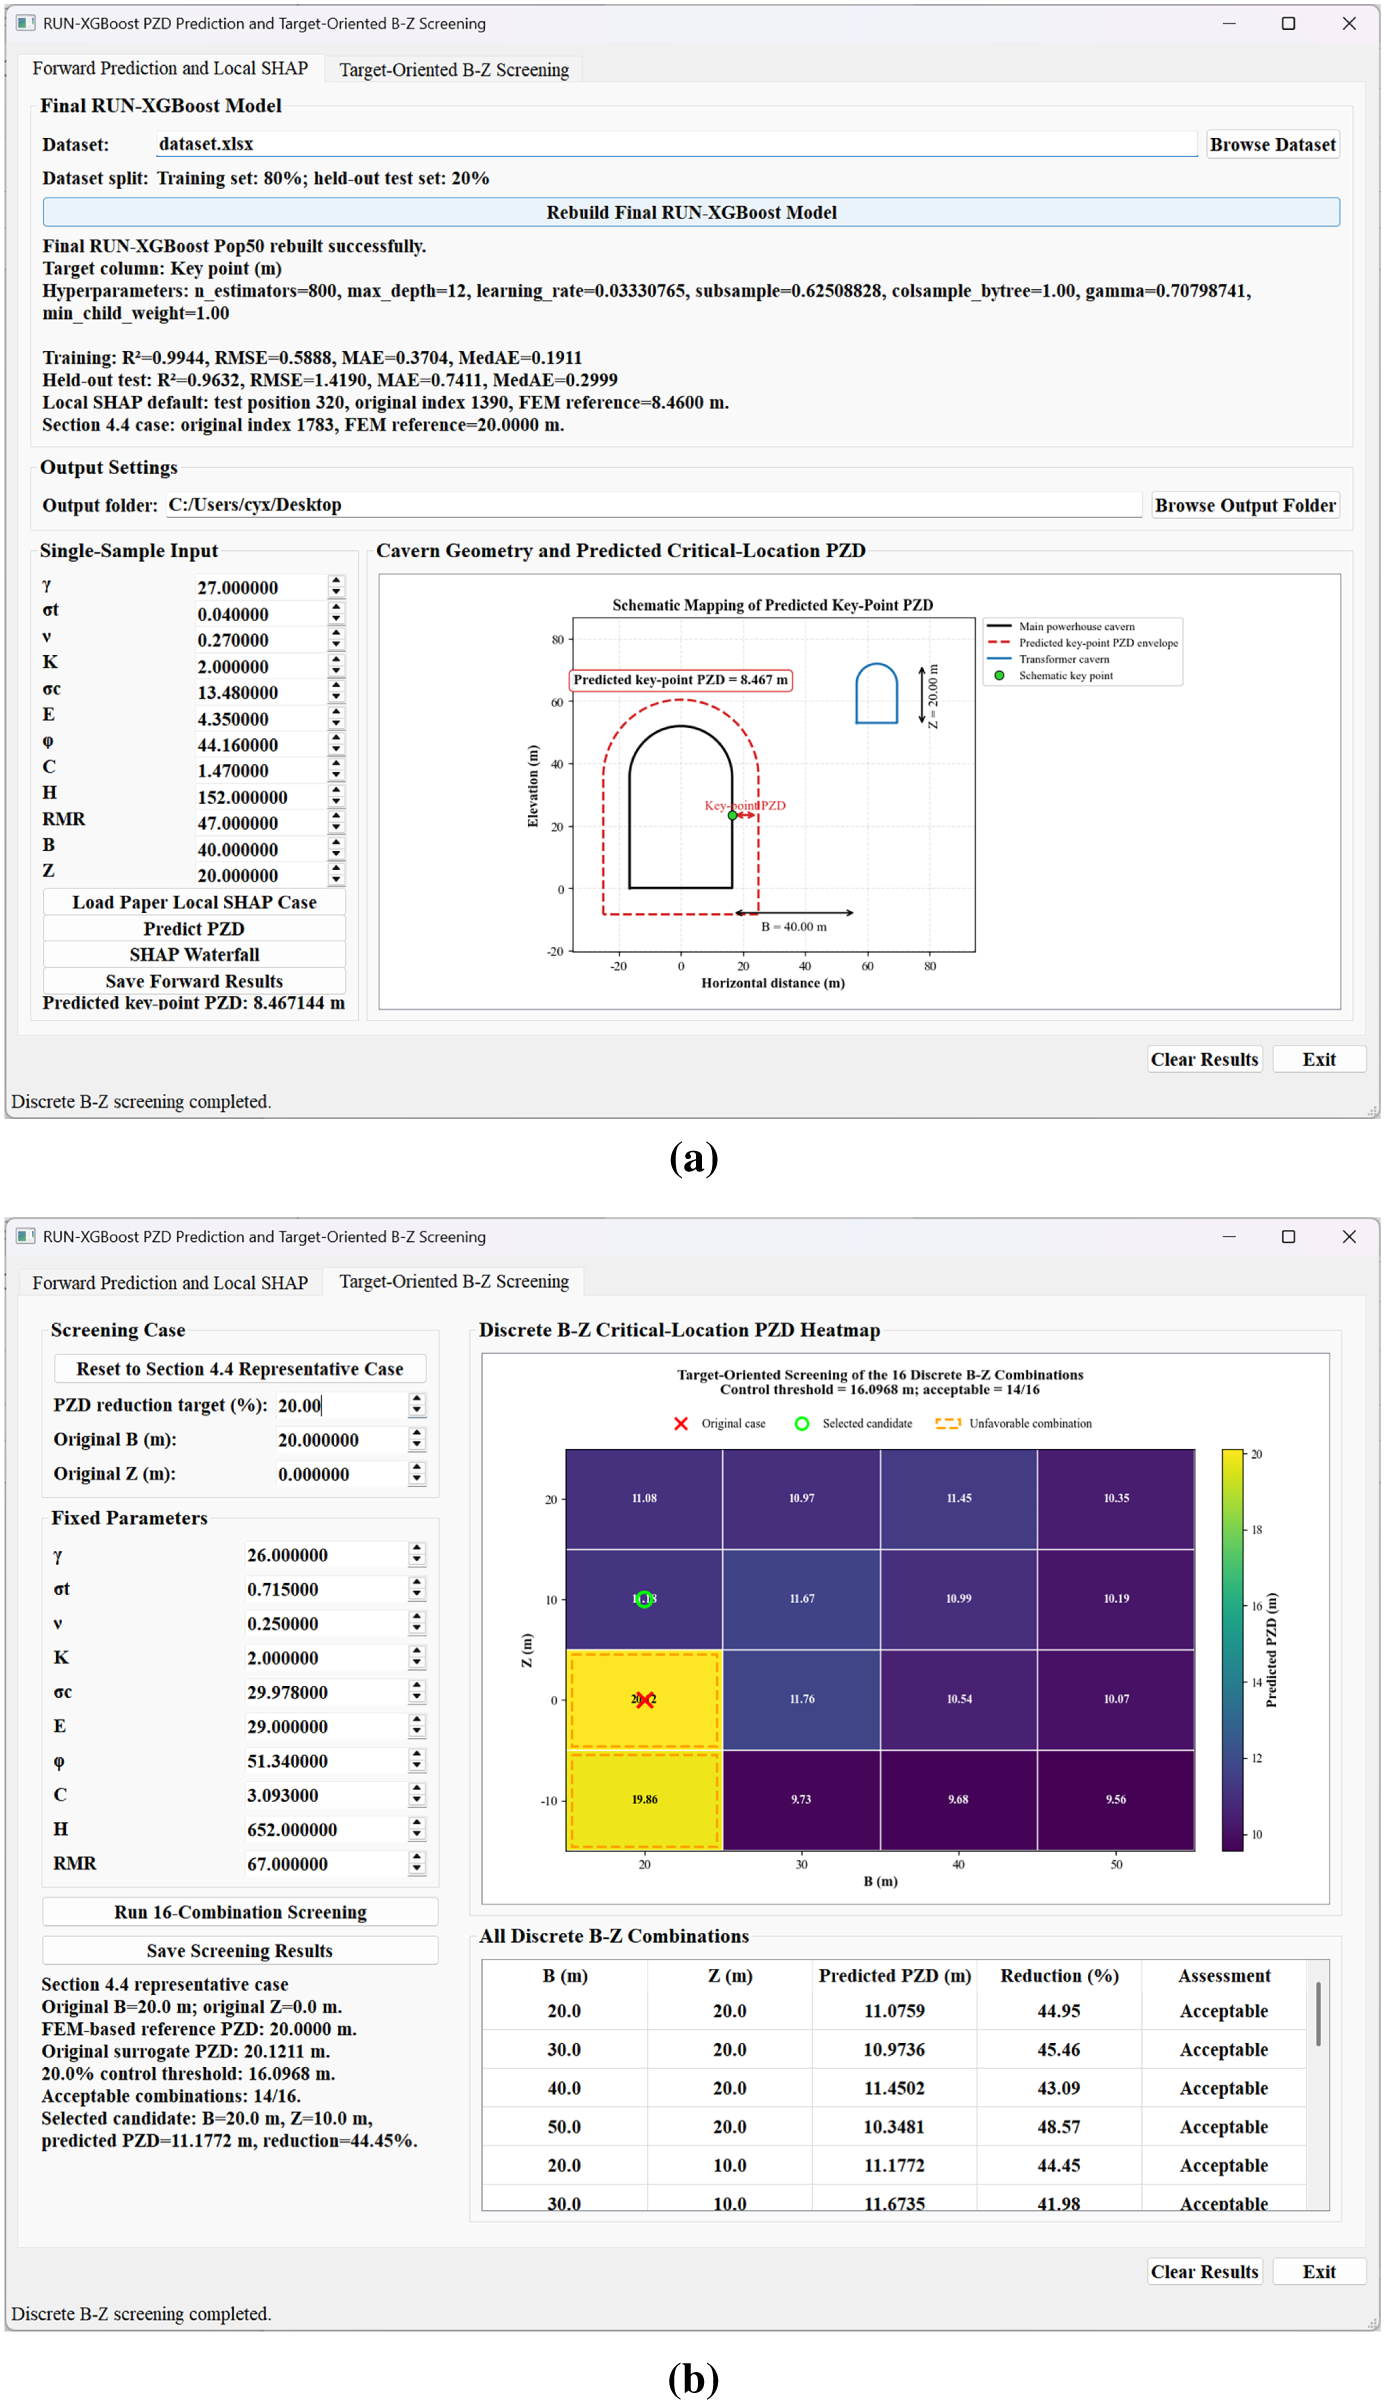
Figure 16: GUI based on the final RUN-XGBoost model: (a) forward prediction and local SHAP interpretation of PZD at the key point; (b) target-oriented screening of the 16 discrete B–Z combinations.
Overall, the GUI provides a convenient prototype interface for rapid surrogate-model prediction, interpretation, and preliminary parameter screening within the numerical domain represented by the database. It does not constitute independent field validation or a comprehensive stability assessment, and the screened candidates still require project-specific numerical and engineering verification before practical application.
Although the optimized XGBoost framework developed in this study demonstrated good PZD prediction performance within the current numerical database and provided a feasible approach for model interpretation and rapid screening of underground powerhouse cavern layout parameters, the results should be interpreted within the scope of the evidence supported by the existing database and its underlying numerical modeling conditions.
First, all 1920 samples used in this study were obtained from an existing two-dimensional finite-element database rather than from field monitoring or experimental data. The original model adopted a plane-strain assumption and represented the surrounding rock mass as an isotropic, homogeneous, quasi-continuous elastoplastic medium governed by the Mohr-Coulomb criterion. Consequently, three-dimensional effects, heterogeneity, groundwater, time-dependent behavior, and support–rock interaction were not fully considered. The current test set, cross-validation, and statistical analyses only demonstrate that the model has satisfactory predictive capability within the existing numerical domain and do not establish its direct applicability to actual engineering projects. Model reliability may decrease when the input parameters fall outside the ranges represented by the current samples or when actual engineering conditions differ substantially from the assumptions of the original numerical model. Future studies should therefore employ independent numerical cases with fully documented modeling conditions and PZD extraction procedures, together with field-monitoring or engineering back-analysis data, to externally validate and update the model. Second, the SHAP results reflect the associations learned by the surrogate model from the current database and cannot be regarded as direct evidence of physical causality. Strong correlations exist among RMR, E, C, σc, and σt, which may redistribute SHAP contributions among correlated variables and affect the importance ranking of individual features. Although the identified response patterns are generally consistent with rock-mechanics knowledge, they should still be interpreted as model-based explanations within the scope of the current numerical database. Future research may combine controlled parametric studies, correlation-aware grouped interpretation methods, and mechanism-based numerical analyses to further verify these relationships. The introduction of physical constraints or the development of hybrid models integrating physical information with data-driven methods may also improve the extrapolative reliability and mechanical consistency of the model. Third, the current parameter analysis evaluates only the 16 discrete B–Z combinations contained in the database while holding the other ten variables constant. The 20% PZD reduction adopted in this study is used solely to demonstrate the screening procedure and does not represent a universal engineering safety criterion. Because multiple combinations may satisfy the same target, the selected result is only a representative candidate rather than a unique inverse solution or a globally optimal design. Moreover, PZD reflects only the maximum local extent of the plastic zone around the main powerhouse cavern, and its reduction does not necessarily imply improved overall stability of the cavern complex. Therefore, the screened candidate combination should not be interpreted as a unique inverse solution, a globally optimal layout, or a directly implementable engineering design. Future studies should establish appropriate PZD control targets according to project-specific conditions and conduct comprehensive assessments under multiple objectives and constraints. Candidate layouts should also be further verified through detailed project-specific numerical analyses and available field observations. On this basis, the model’s external validation, applicability-domain identification, and engineering assessment functions should be progressively improved so that the current surrogate-model framework, which is limited to a specific numerical domain, can be developed into a more reliable decision-support tool. It should nevertheless be emphasized that the framework is intended primarily for rapid prediction and preliminary scheme screening and cannot replace detailed numerical analysis, field monitoring, or engineering judgment in practical cavern design.
This study developed a metaheuristic-optimized XGBoost framework for rapid prediction of the PZD at key points in the rock mass around underground powerhouse caverns, model interpretation, and cavern-layout parameter screening. The main conclusions are as follows:
1. Both RUN and INFO optimization effectively improved the predictive performance of XGBoost within the current numerical database. Compared with the unoptimized XGBoost model, RUN-XGBoost reduced RMSE, MAE, MedAE, and RRMSE on the test set by 27.63%, 35.16%, 47.65%, and 27.63%, respectively, whereas INFO-XGBoost reduced these metrics by 28.94%, 35.12%, 41.37%, and 28.94%, respectively. The R2 and EV values of RUN-XGBoost increased by approximately 3.60%, while those of INFO-XGBoost increased by approximately 3.74%. Statistical testing further showed that both optimized models achieved significant reductions in absolute prediction errors relative to the unoptimized XGBoost model, whereas the difference between RUN-XGBoost and INFO-XGBoost was not statistically significant.
2. The SHAP analysis indicated that, within the current database and parameter ranges, the model predictions were mainly influenced by the coefficient of lateral stress, overburden depth, rock mass unit weight, tensile strength, and cavern-layout parameters. The global and local interpretations revealed the direction, magnitude, and sample-specific variation of the contributions of different variables to the predicted results. Because relatively strong correlations exist among some rock mass parameters, these findings should be interpreted as associations learned by the model rather than as independent physical causal relationships.
3. By incorporating the trained RUN-XGBoost model into a target-oriented parameter-screening framework, cavern-layout parameter combinations satisfying a prescribed PZD-control target can be rapidly identified, thereby reducing the need for repeated numerical simulations during preliminary scheme comparison and providing auxiliary support for cavern-layout parameter assessment and candidate-scheme selection.
4. The developed GUI integrates PZD prediction, local SHAP interpretation, parameter screening, result visualization, and data export, and serves as a prototype interface for model application within the investigated numerical domain. The proposed framework is primarily applicable to the cavern configuration, numerical assumptions, and parameter ranges represented by the current database. It may assist rapid preliminary scheme comparison but cannot replace project-specific numerical analysis, field monitoring, or comprehensive stability assessment.
Acknowledgement: Not applicable.
Funding Statement: This research was funded by the National Natural Science Foundation of China (52474121), the Natural Science Foundation of Hunan Province (2026JJ20004), the Scientific Research Foundation of Hunan Provincial Education Department (25A0011), and the Postgraduate Independent Exploration and Innovation Project of Central South University (502260021).
Author Contributions: The authors confirm contribution to the paper as follows: study conception and design: Yuxin Chen, Jian Zhou; methodology: Yuxin Chen, Jian Zhou, Danial Jahed Armaghani; data curation and analysis: Yuxin Chen, Mohammad Rezaei; software development and visualization: Yuxin Chen; analysis and interpretation of results: Yuxin Chen, Jian Zhou, Su Wang, Mohammad Rezaei; draft manuscript preparation: Yuxin Chen; review and editing: Jian Zhou, Su Wang, Mohammad Rezaei, Danial Jahed Armaghani; supervision: Jian Zhou, Su Wang, Danial Jahed Armaghani. All authors reviewed and approved the final version of the manuscript.
Availability of Data and Materials: The data that support the findings of this study are available from the Corresponding Author upon reasonable request.
Ethics Approval: Not applicable.
Conflicts of Interest: The authors declare no conflicts of interest.
References
1. Rezaei M, Rajabi M. Vertical displacement estimation in roof and floor of an underground powerhouse cavern. Eng Fail Anal. 2018;90(1):290–309. doi:10.1016/j.engfailanal.2018.03.010. [Google Scholar] [CrossRef]
2. Rezaei M, Rajabi M. Assessment of plastic zones surrounding the power station cavern using numerical, fuzzy and statistical models. Eng Comput. 2021;37(2):1499–518. doi:10.1007/s00366-019-00900-3. [Google Scholar] [CrossRef]
3. Yang B, He M, Zhang Z, Zhu J, Chen Y. A new criterion of strain rockburst in consideration of the plastic zone of tunnel surrounding rock. Rock Mech Rock Eng. 2022;55(3):1777–89. doi:10.1007/s00603-021-02725-3. [Google Scholar] [CrossRef]
4. Qiao Y, Xiao Y, Ding W, He M. Effect of rock nonlinear mechanical behavior on plastic zone around deeply buried tunnel: a numerical investigation. Comput Geotech. 2023;161(6):105532. doi:10.1016/j.compgeo.2023.105532. [Google Scholar] [CrossRef]
5. Zhou J, Chen Y, Yong W. Performance evaluation of hybrid YYPO-RF, BWOA-RF and SMA-RF models to predict plastic zones around underground powerhouse Caverns. Geomech Geophys Geo Energy Geo Resour. 2022;8(6):179. doi:10.1007/s40948-022-00496-x. [Google Scholar] [CrossRef]
6. Martin CD, Kaiser PK, McCreath DR. Hoek-Brown parameters for predicting the depth of brittle failure around tunnels. Can Geotech J. 1999;36(1):136–51. doi:10.1139/t98-072. [Google Scholar] [CrossRef]
7. Zareifard MR, Fahimifar A. Analytical solutions for the stresses and deformations of deep tunnels in an elastic-brittle-plastic rock mass considering the damaged zone. Tunn Undergr Space Technol. 2016;58(4):186–96. doi:10.1016/j.tust.2016.05.007. [Google Scholar] [CrossRef]
8. Carranza-Torres C, Fairhurst C. The elasto-plastic response of underground excavations in rock masses that satisfy the Hoek-Brown failure criterion. Int J Rock Mech Min Sci. 1999;36(6):777–809. doi:10.1016/S0148-9062(99)00047-9. [Google Scholar] [CrossRef]
9. Zhao H, Deng B, Huang G, Zhang D, Song Z. Influence of principal stress orientation on stress distribution and plastic zone evolution of rock surrounding tunnels. Phys Fluids. 2024;36(2):027123. doi:10.1063/5.0187253. [Google Scholar] [CrossRef]
10. Duan SQ, Jiang Q, Liu GF, Xiong JC, Gao P, Xu DP, et al. An insight into the excavation-induced stress paths on mechanical response of weak interlayer zone in underground cavern under high geostress. Rock Mech Rock Eng. 2021;54(3):1331–54. doi:10.1007/s00603-020-02312-y. [Google Scholar] [CrossRef]
11. Hong JM, Chen YF, Liu MM, Zhou CB. Inverse modelling of groundwater flow around a large-scale underground cavern system considering the excavation-induced hydraulic conductivity variation. Comput Geotech. 2017;81(8):346–59. doi:10.1016/j.compgeo.2016.09.008. [Google Scholar] [CrossRef]
12. Zhao C, Zhang Z, Lei Q. Role of hydro-mechanical coupling in excavation-induced damage propagation, fracture deformation and microseismicity evolution in naturally fractured rocks. Eng Geol. 2021;289:106169. doi:10.1016/j.enggeo.2021.106169. [Google Scholar] [CrossRef]
13. Zheng Z, Deng B, Li S, Zheng H. Disturbance mechanical behaviors and anisotropic fracturing mechanisms of rock under novel three-stage true triaxial static-dynamic coupling loading. Rock Mech Rock Eng. 2024;57(4):2445–68. doi:10.1007/s00603-023-03696-3. [Google Scholar] [CrossRef]
14. Xu DP, Zhou YY, Qiu SL, Jiang Q, Wang B. Elastic modulus deterioration index to identify the loosened zone around underground openings. Tunn Undergr Space Technol. 2018;82(4):20–9. doi:10.1016/j.tust.2018.07.032. [Google Scholar] [CrossRef]
15. Feng W, Huang R, Li T. Deformation analysis of a soft-hard rock contact zone surrounding a tunnel. Tunn Undergr Space Technol. 2012;32(4):190–7. doi:10.1016/j.tust.2012.06.011. [Google Scholar] [CrossRef]
16. Hao YH, Azzam R. The plastic zones and displacements around underground openings in rock masses containing a fault. Tunn Undergr Space Technol. 2005;20(1):49–61. doi:10.1016/j.tust.2004.05.003. [Google Scholar] [CrossRef]
17. Li C, Xu J, Pan J, Ma C. Plastic zone distribution laws and its types of surrounding rock in large-span roadway. Int J Min Sci Technol. 2012;22(1):23–8. doi:10.1016/j.ijmst.2011.06.002. [Google Scholar] [CrossRef]
18. Xiang Y, Feng S. Theoretical prediction of the potential plastic zone of shallow tunneling in vicinity of pile foundation in soils. Tunn Undergr Space Technol. 2013;38(3):115–21. doi:10.1016/j.tust.2013.05.006. [Google Scholar] [CrossRef]
19. Li HB, Liu MC, Xing WB, Shao S, Zhou JW. Failure mechanisms and evolution assessment of the excavation damaged zones in a large-scale and deeply buried underground powerhouse. Rock Mech Rock Eng. 2017;50(7):1883–900. doi:10.1007/s00603-017-1208-0. [Google Scholar] [CrossRef]
20. Jiang Q, Su G, Feng XT, Chen G, Zhang MZ, Liu C. Excavation optimization and stability analysis for large underground Caverns under high geostress: a case study of the Chinese laxiwa project. Rock Mech Rock Eng. 2019;52(3):895–915. doi:10.1007/s00603-018-1605-z. [Google Scholar] [CrossRef]
21. Chen YF, Zheng HK, Wang M, Hong JM, Zhou CB. Excavation-induced relaxation effects and hydraulic conductivity variations in the surrounding rocks of a large-scale underground powerhouse cavern system. Tunn Undergr Space Technol. 2015;49(3):253–67. doi:10.1016/j.tust.2015.05.007. [Google Scholar] [CrossRef]
22. Guo X, Zhao Z, Gao X, Wu X, Ma N. Analytical solutions for characteristic radii of circular roadway surrounding rock plastic zone and their application. Int J Min Sci Technol. 2019;29(2):263–72. doi:10.1016/j.ijmst.2018.10.002. [Google Scholar] [CrossRef]
23. Xu MF, Wu SC, Gao YT, Ma J, Wu QL. Analytical elastic stress solution and plastic zone estimation for a pressure-relief circular tunnel using complex variable methods. Tunn Undergr Space Technol. 2019;84(4):381–98. doi:10.1016/j.tust.2018.11.036. [Google Scholar] [CrossRef]
24. Ju Y, Xing D, Wang S, Ren Z, Wan C. Visualizing the full-field stress and plastic zones in arch tunnel surrounding rocks embedded with roadway-scale discontinuities using 3D printed transparent models and stress freezing techniques. Tunn Undergr Space Technol. 2025;163:106772. doi:10.1016/j.tust.2025.106772. [Google Scholar] [CrossRef]
25. Zhu WS, Sui B, Li XJ, Li SC, Wang WT. A methodology for studying the high wall displacement of large scale underground cavern complexes and it’s applications. Tunn Undergr Space Technol. 2008;23(6):651–64. doi:10.1016/j.tust.2007.12.009. [Google Scholar] [CrossRef]
26. Zhu WS, Li XJ, Zhang QB, Zheng WH, Xin XL, Sun AH, et al. A study on sidewall displacement prediction and stability evaluations for large underground power station Caverns. Int J Rock Mech Min Sci. 2010;47(7):1055–62. doi:10.1016/j.ijrmms.2010.07.008. [Google Scholar] [CrossRef]
27. Zhang W, Goh ATC. Multivariate adaptive regression splines model for reliability assessment of serviceability limit state of twin Caverns. Geomech Eng. 2014;7(4):431–58. doi:10.12989/gae.2014.7.4.431. [Google Scholar] [CrossRef]
28. Rajabi M, Rahmannejad R, Rezaei M. Studying the deformation and stability of rock mass surrounding the power station Caverns using NA and GEP models. Struct Eng Mech. 2021;79(1):35–50. doi:10.12989/sem.2021.79.1.035. [Google Scholar] [CrossRef]
29. Asteris PG, Karoglou M, Skentou AD, Vasconcelos G, He M, Bakolas A, et al. Predicting uniaxial compressive strength of rocks using ANN models: incorporating porosity, compressional wave velocity, and Schmidt hammer data. Ultrasonics. 2024;141:107347. doi:10.1016/j.ultras.2024.107347. [Google Scholar] [CrossRef]
30. Miah MI, Ahmed S, Zendehboudi S, Butt S. Machine learning approach to model rock strength: prediction and variable selection with aid of log data. Rock Mech Rock Eng. 2020;53(10):4691–715. doi:10.1007/s00603-020-02184-2. [Google Scholar] [CrossRef]
31. Wu Z, Wu Y, Weng L, Li M, Wang Z, Chu Z. Machine learning approach to predicting the macro-mechanical properties of rock from the meso-mechanical parameters. Comput Geotech. 2024;166:105933. doi:10.1016/j.compgeo.2023.105933. [Google Scholar] [CrossRef]
32. Chen Y, Kadkhodaei MH, Zhou J. Development of the Optuna-NGBoost-SHAP model for estimating ground settlement during tunnel excavation. Undergr Space. 2025;24(5):60–78. doi:10.1016/j.undsp.2025.03.006. [Google Scholar] [CrossRef]
33. Zhou J, Chen Y, Li C, Qiu Y, Huang S, Tao M. Machine learning models to predict the tunnel wall convergence. Transp Geotech. 2023;41(3):101022. doi:10.1016/j.trgeo.2023.101022. [Google Scholar] [CrossRef]
34. Golabchi Y, Perras MA, Khan UT. Comparison of different classification and regression machine learning algorithms for the prediction of excavation damage zone depths. Rock Mech Rock Eng. 2025;58(9):10439–61. doi:10.1007/s00603-025-04639-w. [Google Scholar] [CrossRef]
35. Zhang W, Li Y, Wu C, Li H, Goh A, Liu H. Prediction of lining response for twin tunnels constructed in anisotropic clay using machine learning techniques. Undergr Space. 2022;7(1):122–33. doi:10.1016/j.undsp.2020.02.007. [Google Scholar] [CrossRef]
36. Xue X, Xiao M. Deformation evaluation on surrounding rocks of underground Caverns based on PSO-LSSVM. Tunn Undergr Space Technol. 2017;69(5):171–81. doi:10.1016/j.tust.2017.06.019. [Google Scholar] [CrossRef]
37. Rajabi M, Rahmannejad R, Rezaei M, Ganjalipour K. Evaluation of the maximum horizontal displacement around the power station Caverns using artificial neural network. Tunn Undergr Space Technol. 2017;64(12):51–60. doi:10.1016/j.tust.2017.01.010. [Google Scholar] [CrossRef]
38. Mahmoodzadeh A, Mohammadi M, Hashim Ibrahim H, Gharrib Noori KM, Nariman Abdulhamid S, Farid Hama Ali H. Forecasting sidewall displacement of underground Caverns using machine learning techniques. Autom Constr. 2021;123:103530. doi:10.1016/j.autcon.2020.103530. [Google Scholar] [CrossRef]
39. Gu J, Zhou J, Li C. Metaheuristic-optimized least squares boosting model for longitudinal settlement prediction in EPB shield construction. Tunn Undergr Space Technol. 2026;169(4):107326. doi:10.1016/j.tust.2025.107326. [Google Scholar] [CrossRef]
40. Meng S, Shi Z, Gutierrez M. Interpretable CEEMDAN-SMA-LSSVM hybrid model for predicting shield tunnel-induced settlement. J Rock Mech Geotech Eng. 2025;17(10):6179–94. doi:10.1016/j.jrmge.2024.11.062. [Google Scholar] [CrossRef]
41. Morgenroth J, Perras MA, Khan UT. On the interpretability of machine learning using input variable selection: forecasting tunnel liner yield. Rock Mech Rock Eng. 2022;55(11):6779–804. doi:10.1007/s00603-022-02987-5. [Google Scholar] [CrossRef]
42. Zhang J, Ma X, Zhang J, Sun D, Zhou X, Mi C, et al. Insights into geospatial heterogeneity of landslide susceptibility based on the SHAP-XGBoost model. J Environ Manag. 2023;332(2):117357. doi:10.1016/j.jenvman.2023.117357. [Google Scholar] [CrossRef]
43. Kumar A, Chauhan VB. Advanced finite element limit analysis and machine learning for assessing the stability of square tunnels in rock slope. Transp Infrastruct Geotechnol. 2024;11(4):1928–62. doi:10.1007/s40515-023-00338-7. [Google Scholar] [CrossRef]
44. Kumar A, Chauhan VB. Evaluating the impact of eccentric loading on strip footing above horseshoe tunnels in rock mass using adaptive finite element limit analysis and machine learning. Earth Sci Inform. 2024;17(5):4441–71. doi:10.1007/s12145-024-01380-w. [Google Scholar] [CrossRef]
45. Cui J, Wu S, Cheng H, Kui G, Zhang H, Hu M, et al. Composite interpretability optimization ensemble learning inversion surrounding rock mechanical parameters and support optimization in soft rock tunnels. Comput Geotech. 2024;165:105877. doi:10.1016/j.compgeo.2023.105877. [Google Scholar] [CrossRef]
46. Liu W, Chen Y, Liu T, Liu W, Li J, Chen Y. Shield tunneling efficiency and stability enhancement based on interpretable machine learning and multi-objective optimization. Undergr Space. 2025;22(2):320–36. doi:10.1016/j.undsp.2025.01.001. [Google Scholar] [CrossRef]
47. Wang GG, Zhao X, Li K. Metaheuristic algorithms. Boca Raton, FL, USA: CRC Press; 2024. doi:10.1201/9781003422426. [Google Scholar] [CrossRef]
48. Ahmadianfar I, Heidari AA, Gandomi AH, Chu X, Chen H. RUN beyond the metaphor: an efficient optimization algorithm based on Runge Kutta method. Expert Syst Appl. 2021;181(21):115079. doi:10.1016/j.eswa.2021.115079. [Google Scholar] [CrossRef]
49. Abu Khurma R. The runge–kutta optimization algorithm: a comprehensive survey of methodology, variants, applications, and performance evaluation. Arch Comput Meth Eng. 2025;32(8):5075–122. doi:10.1007/s11831-025-10293-w. [Google Scholar] [CrossRef]
50. Ahmadianfar I, Heidari AA, Noshadian S, Chen H, Gandomi AH. INFO: an efficient optimization algorithm based on weighted mean of vectors. Expert Syst Appl. 2022;195(12):116516. doi:10.1016/j.eswa.2022.116516. [Google Scholar] [CrossRef]
51. Chen T, Guestrin C. XGBoost: a scalable tree boosting system. In: Proceedings of the 22nd ACM SIGKDD International Conference on Knowledge Discovery and Data Mining; 2016 Aug 13–17; San Francisco, CA, USA. p. 785–94. doi:10.1145/2939672.2939785. [Google Scholar] [CrossRef]
52. Hyndman RJ, Koehler AB. Another look at measures of forecast accuracy. Int J Forecast. 2006;22(4):679–88. doi:10.1016/j.ijforecast.2006.03.001. [Google Scholar] [CrossRef]
53. Huang S, Yong W, Wang L, Zhou J. From measurement while drilling data to rock strength: a robust LMWOA-XGBoost model for predicting uniaxial compressive strength with SHAP interpretability. Expert Syst Appl. 2026;325:132535. doi:10.1016/j.eswa.2026.132535. [Google Scholar] [CrossRef]
54. Bendriss F, Harichane Z, Skentou AD, Rebouh R, Ghrici AA, Asteris PG. Advanced machine learning models for estimating seismic bearing capacity of shallow strip footings considering P- and S-wave effects. Soil Dyn Earthq Eng. 2026;200(1):109853. doi:10.1016/j.soildyn.2025.109853. [Google Scholar] [CrossRef]
55. Chicco D, Warrens MJ, Jurman G. The coefficient of determination R-squared is more informative than SMAPE, MAE, MAPE, MSE and RMSE in regression analysis evaluation. PeerJ Comput Sci. 2021;7(3):e623. doi:10.7717/peerj-cs.623. [Google Scholar] [CrossRef]
56. Willmott CJ, Matsuura K. Advantages of the mean absolute error (MAE) over the root mean square error (RMSE) in assessing average model performance. Clim Res. 2005;30:79–82. doi:10.3354/cr030079. [Google Scholar] [CrossRef]
57. Chen Y, Khandelwal M, Onifade M, Zhou J, Ismail Lawal A, Oluwaseyi Bada S, et al. Predicting the hardgrove grindability index using interpretable decision tree-based machine learning models. Fuel. 2025;384(2):133953. doi:10.1016/j.fuel.2024.133953. [Google Scholar] [CrossRef]
58. Zhang R, Zhou J. Predicting the minimum horizontal principal stress using genetic expression programming and borehole breakout data. J Rock Mech Geotech Eng. 2025;17(7):4227–40. doi:10.1016/j.jrmge.2024.09.002. [Google Scholar] [CrossRef]
59. Zhang YL, Qiu YG, Armaghani DJ, Monjezi M, Zhou J. Enhancing rock fragmentation prediction in mining operations: a Hybrid GWO-RF model with SHAP interpretability. J Cent South Univ. 2024;31(8):2916–29. doi:10.1007/s11771-024-5699-z. [Google Scholar] [CrossRef]
60. Chen C, Seo H. Prediction of rock mass class ahead of TBM excavation face by ML and DL algorithms with Bayesian TPE optimization and SHAP feature analysis. Acta Geotech. 2023;18(7):3825–48. doi:10.1007/s11440-022-01779-z. [Google Scholar] [CrossRef]
61. Yari M, He B, He X, Abbasi P, Fattahi H, Armaghani DJ, et al. A hybrid LightGB M-WOA model for accurate prediction of back-break in mine blasting operations: a case study. Shock Vibr. 2026;2026(1):4973137. doi:10.1155/vib/4973137. [Google Scholar] [CrossRef]
Cite This Article
 Copyright © 2026 The Author(s). Published by Tech Science Press.
This work is licensed under a Creative Commons Attribution 4.0 International License , which permits unrestricted use, distribution, and reproduction in any medium, provided the original work is properly cited.
 Downloads
 Citation Tools
