
 Login
Login Register
 Submit a Paper
 Propose a Special lssue
 Open Access
ARTICLE
Machine Learning Based Optimization of EPB-TBM Control Parameters
School of Mining and Metallurgical Engineering, National Technical University of Athens, Athens, Greece
* Corresponding Author: Konstantinos N. Sioutas. Email:
(This article belongs to the Special Issue: Advances in Artificial Intelligence for Geotechnical Engineering)
Computer Modeling in Engineering & Sciences 2026, 148(3), 20 https://doi.org/10.32604/cmes.2026.087755
Received 22 June 2026; Accepted 25 August 2026; Issue published 28 September 2026
 View Full Text
 Download PDF
Abstract
Tunnel operations performed with Tunnel Boring Machines (TBMs) require the selection of feasible setpoints under changing ground and site constraints. In this study, an inverse Machine Learning (ML) setup was constructed to infer operating parameters from geotechnical context and target performance thresholds for Penetration Rate (PR) and the utilization (UTIL) of the machine. Inputs included geological and geotechnical descriptors, relative depth, a categorical geological profile, harmonic time features, and the two targets (PR and UTIL). Outputs comprised Cutterhead Rotation and Torque, Total Thrust, Screw-conveyor Rotation and Working Pressure, Excavating Rate, and Earth Pressure on the face of the tunnel. A Feed-Forward Artificial Neural network (OPT_ANN) trained with Adam, batch normalization, dropout, and early stopping achieved test Root Mean Squared Error (RMSE) ≈ 0.75 and Mean Absolute Error (MAE) ≈ 0.53 aggregated across outputs. Indicative maps using thresholds yielded coherent operating ranges that reflect coupled controls such as torque, thrust and screw-conveyor pressure, throughput. The approach converts prediction into decision support by summarizing feasible scenarios for field operations.Keywords
Tunnel Boring Machines (TBMs) have become indispensable in urban underground construction, where space constraints, safety requirements, and environmental impacts demand reliable and efficient excavation methods. Their performance directly affects project timelines, cutter wear, energy use, and overall costs. Improving the way TBMs are controlled and operated can significantly enhance advance rates, reduce wear, and mitigate risks in challenging ground conditions (e.g., selecting optimal cutter spacing and penetration to maximize efficiency and minimize cutter consumption under variable rock and saturation conditions [1]). Furthermore, digital twins and real-time performance monitoring using Machine Learning (ML) show promise as tools for improving operational decision-making and reducing schedule and cost overruns [2]. Forward prediction of Penetration Rate (PR) is useful at the design stage, but field operation requires selecting setpoints that achieve specified performance under local constraints.
Previous research has shown that optimization techniques can substantially improve predictive and decision-making frameworks. For example, Chen and Guestrin [3] introduced Extreme Gradient Boosting (XGBoost), a powerful ensemble algorithm whose accuracy on TBM datasets benefits from hyperparameter tuning via Bayesian Optimization (BO). Zhou et al. [4] further demonstrated the value of hybrid optimization methods by combining particle swarm optimization (PSO) with the imperialist competitive algorithm (ICA) to predict TBM advance rates under varying granite conditions. More recently, Garcia et al. [5] proposed an intelligent decision support system for utility TBMs that uses an optimality score combining advance rate and working-pressure safety, demonstrating that ML surrogates can go beyond prediction to provide actionable guidance for operators. Liu et al. [6] developed a multi-objective intelligent decision method for TBM primary control parameters, balancing excavation efficiency and cost through a Pareto-optimal framework. Zhang et al. [7] addressed TBM big-data preprocessing challenges, showing that structured feature extraction from raw tunnelling cycles significantly improves downstream model performance. These studies underscore both the importance and the limitations of optimization approaches, and they motivate the use of surrogate modelling to enable efficient, accurate solutions for TBM operating-point selection.
In this study, the goal is to predict TBM operational parameters, including cutting wheel rotation and torque, thrust force, screw conveyor pressures, excavation rate, and face pressure, based on geological and geotechnical conditions. The developed Artificial Neural Network (ANN) model forms the core of this framework, as it predicts coupled TBM control parameters, which are then filtered through predefined thresholds to generate feasible operating-point suggestions corresponding to target Penetration Rate (PR) and Utilization (UTIL). In essence, the workflow bridges predictive modelling and practical control guidance, enabling data-driven adjustment of TBM setpoints. The model was trained and tested on operational data from ELLINIKO METRO S.A. [8] for the Athens Metro Line 2 (Hellinikon extension). Results show that the ANN model successfully captured the nonlinear relationships between input geological features and TBM behaviour. The threshold-based approach effectively provided parameter sets consistent with observed operational ranges, thereby achieving the project’s objective of deriving predictive and actionable guidance for TBM operation under varying ground conditions.
2.1 Traditional Approaches: Physical and Statistical Models
The prediction of TBM performance has long been rooted in physically based, empirical, and statistical reasoning. Foundational approaches such as the NTNU/SINTEF method [9] and the Colorado School of Mines model (CSM) [10] described the relationship between rock strength, cutter thrust, and penetration rate (PR) through theoretical and semi-empirical equations, offering valuable mechanistic insight into cutter–rock interaction that remains useful for design-stage estimation. As project datasets expanded, statistical learning offered a more flexible alternative to these closed-form relationships: multiple and nonlinear regression models related excavation rate, torque, and thrust to rock strength indices, brittleness, and joint characteristics [11], while Delisio and Zhao [12] developed a Field Penetration Index for blocky rock conditions (FPI_blocky), estimated via multivariate regression on joint count and intact rock strength, to predict TBM performance in blocky ground; later extensions incorporated probabilistic modelling to quantify prediction uncertainty [13].
Together, these traditional approaches share a common trade-off. Their principal strength is interpretability: physical models express cutter–rock mechanics directly, while statistical models expose the relative influence of explicit variables. However, both rely on simplified or fixed functional forms and assumptions of homogeneous ground and near-linear response, and both remain sensitive to data noise and outliers. As a result, their adaptability is limited when applied to the complex, non-stationary geological transitions and coupled operational conditions typical of modern tunnelling projects, motivating the shift toward more flexible, data-driven learning approaches described next.
2.2 Learning from Operations: The Rise of Machine Learning
With the increasing availability of high-frequency TBM operational data, machine learning introduced a shift from formula-based modelling toward data-driven learning from actual tunnelling records. Algorithms such as Random Forests, Support Vector Machines, Gradient Boosting methods, Extreme Learning Machines, and Artificial Neural Networks have been widely applied to predict penetration rate, advance rate, thrust, torque, and other TBM performance indicators under variable geological conditions. Comparative benchmarking studies have further clarified the relative strengths of these algorithm families: Armaghani et al. [14] systematically evaluated seven tree-based ensemble methods, including Random Forest, XGBoost, LightGBM, and CatBoost, for predicting penetration rate from rock mass and material properties such as Rock Mass Rating and Brazilian Tensile Strength, reporting CatBoost and XGBoost as the most accurate. Like the majority of the studies reviewed in this section, this work addresses the forward prediction problem of estimating performance from geological and material inputs, which the present study inverts by recovering control parameters from geology and target performance. Hybrid optimization strategies have further improved model calibration; for example, Zeng et al. [15] proposed several PSO-based Extreme Learning Machine approaches for TBM performance prediction, while earlier ANN applications demonstrated the ability of neural models to capture nonlinear relationships between geological, mechanical, and operational variables [16]. More recent deep-learning studies confirmed that deeper architectures can improve performance prediction when sufficient geomechanical and operational data are available [17] while comparative Artificial Intelligence (AI) studies highlighted the need for adaptive model selection across different weathering zones and ground conditions [18].
Beyond hard-rock penetration prediction, ML applications have also expanded into Earth Pressure Balance and soft-ground tunnelling problems, where machine behavior is strongly coupled with ground response and face-support conditions. Mooney et al. [19] examined actual and predicted EPB TBM-induced ground deformation in stiff clays and dense sands, showing the importance of comparing field measurements with empirical and numerical predictions in order to understand tunnelling-induced soil movements. In the EPB domain, Glab et al. [20] developed machine-learning models for main drive torque estimation using geotechnical and operational parameters, confirming that data-driven methods can capture the interaction between cutterhead loading, machine response, and ground resistance. More recently, Mooney et al. [21] proposed a hybrid approach for slurry shield cutterhead torque characterization, combining mechanics-based modelling with machine learning. This direction is particularly important because the inclusion of physical constraints can improve model stability, reduce non-physical predictions, and preserve engineering consistency under changing ground conditions.
2.3 Toward Intelligent, Inverse, and Co-Occurrence-Based Control
Recent research moves beyond forward prediction toward intelligent control and operational guidance, embedding data-driven models in structured frameworks that not only forecast TBM behaviour but also suggest optimal operating ranges in real time. Li et al. [22] proposed a just-in-time (JIT) operational control strategy that couples a LightGBM-based rock–machine mapping model with a particle swarm optimization (PSO) search, enabling real-time adjustment of tunnelling parameters as new geological and operational data arrive. Vibration-based ground classification using supervised learning [23] provides a complementary, sensor-driven route to real-time geological awareness that could feed directly into such adaptive control strategies.
Across these frameworks, effective control ultimately reduces to solving an inverse problem: given a geological context and a desired performance level, what machine settings should be selected? This inverse framing has been addressed in adjacent engineering domains through surrogate-based optimization, where a fast-to-evaluate metamodel replaces an expensive simulation or experiment inside an optimization loop; Ninić and Meschke [24], for instance, coupled a finite-element model with a meta-model to determine optimal EPB-TBM face pressure and advance speed while keeping ground settlements within acceptable limits, demonstrating that a trained surrogate can replace costly 3D simulations for real-time steering. In the TBM control domain specifically, two broad strategies have emerged for solving this inverse problem. The first embeds a forward surrogate inside an explicit optimization loop, such as the particle-swarm-based search described above, to search for control parameters that optimize one or more objectives. The second, adopted in this study, conditions the surrogate directly on both the geological inputs and the desired performance outputs, learning the co-occurrence pattern between geological context, performance level, and machine state; the model output is then filtered against engineering thresholds to yield feasible operating ranges.
This co-occurrence conditioning approach has the practical advantage of requiring only a single forward pass through the trained network, rather than an iterative optimization loop, and it naturally produces a family of feasible solutions rather than a single optimum. Its limitation is that the resulting recommendations describe parameter states historically associated with the target performance, rather than solutions guaranteed by a causal-mechanistic model. In this sense, the present work contributes to the transition from predictive analytics to prescriptive intelligence—a shift toward real-time, data-guided operation that leverages historical experience and adaptive learning to improve tunnelling performance and decision-making.
The study covers the Athens Metro Line 2 extension towards Elliniko. More particularly the examined section is in the interchange between Agios Dimitrios and Elliniko metro station. It examines three consecutive excavation intervals: Interval 4 (Leontos intershaft–Alimos station; Ch. 12+750 to Ch. 12+320; length 430 m), Interval 5 (Hymettus intershaft to Leontos shaft; Ch. 13+335.6 to Ch. 12+750.3; length 585.3 m) and Interval 6 (Argiroupoli station–Hymettus intershaft; Ch. 13+944 to Ch. 13+336; length 608). The combined length of this examined section is about 1624 m. (Fig. 1).
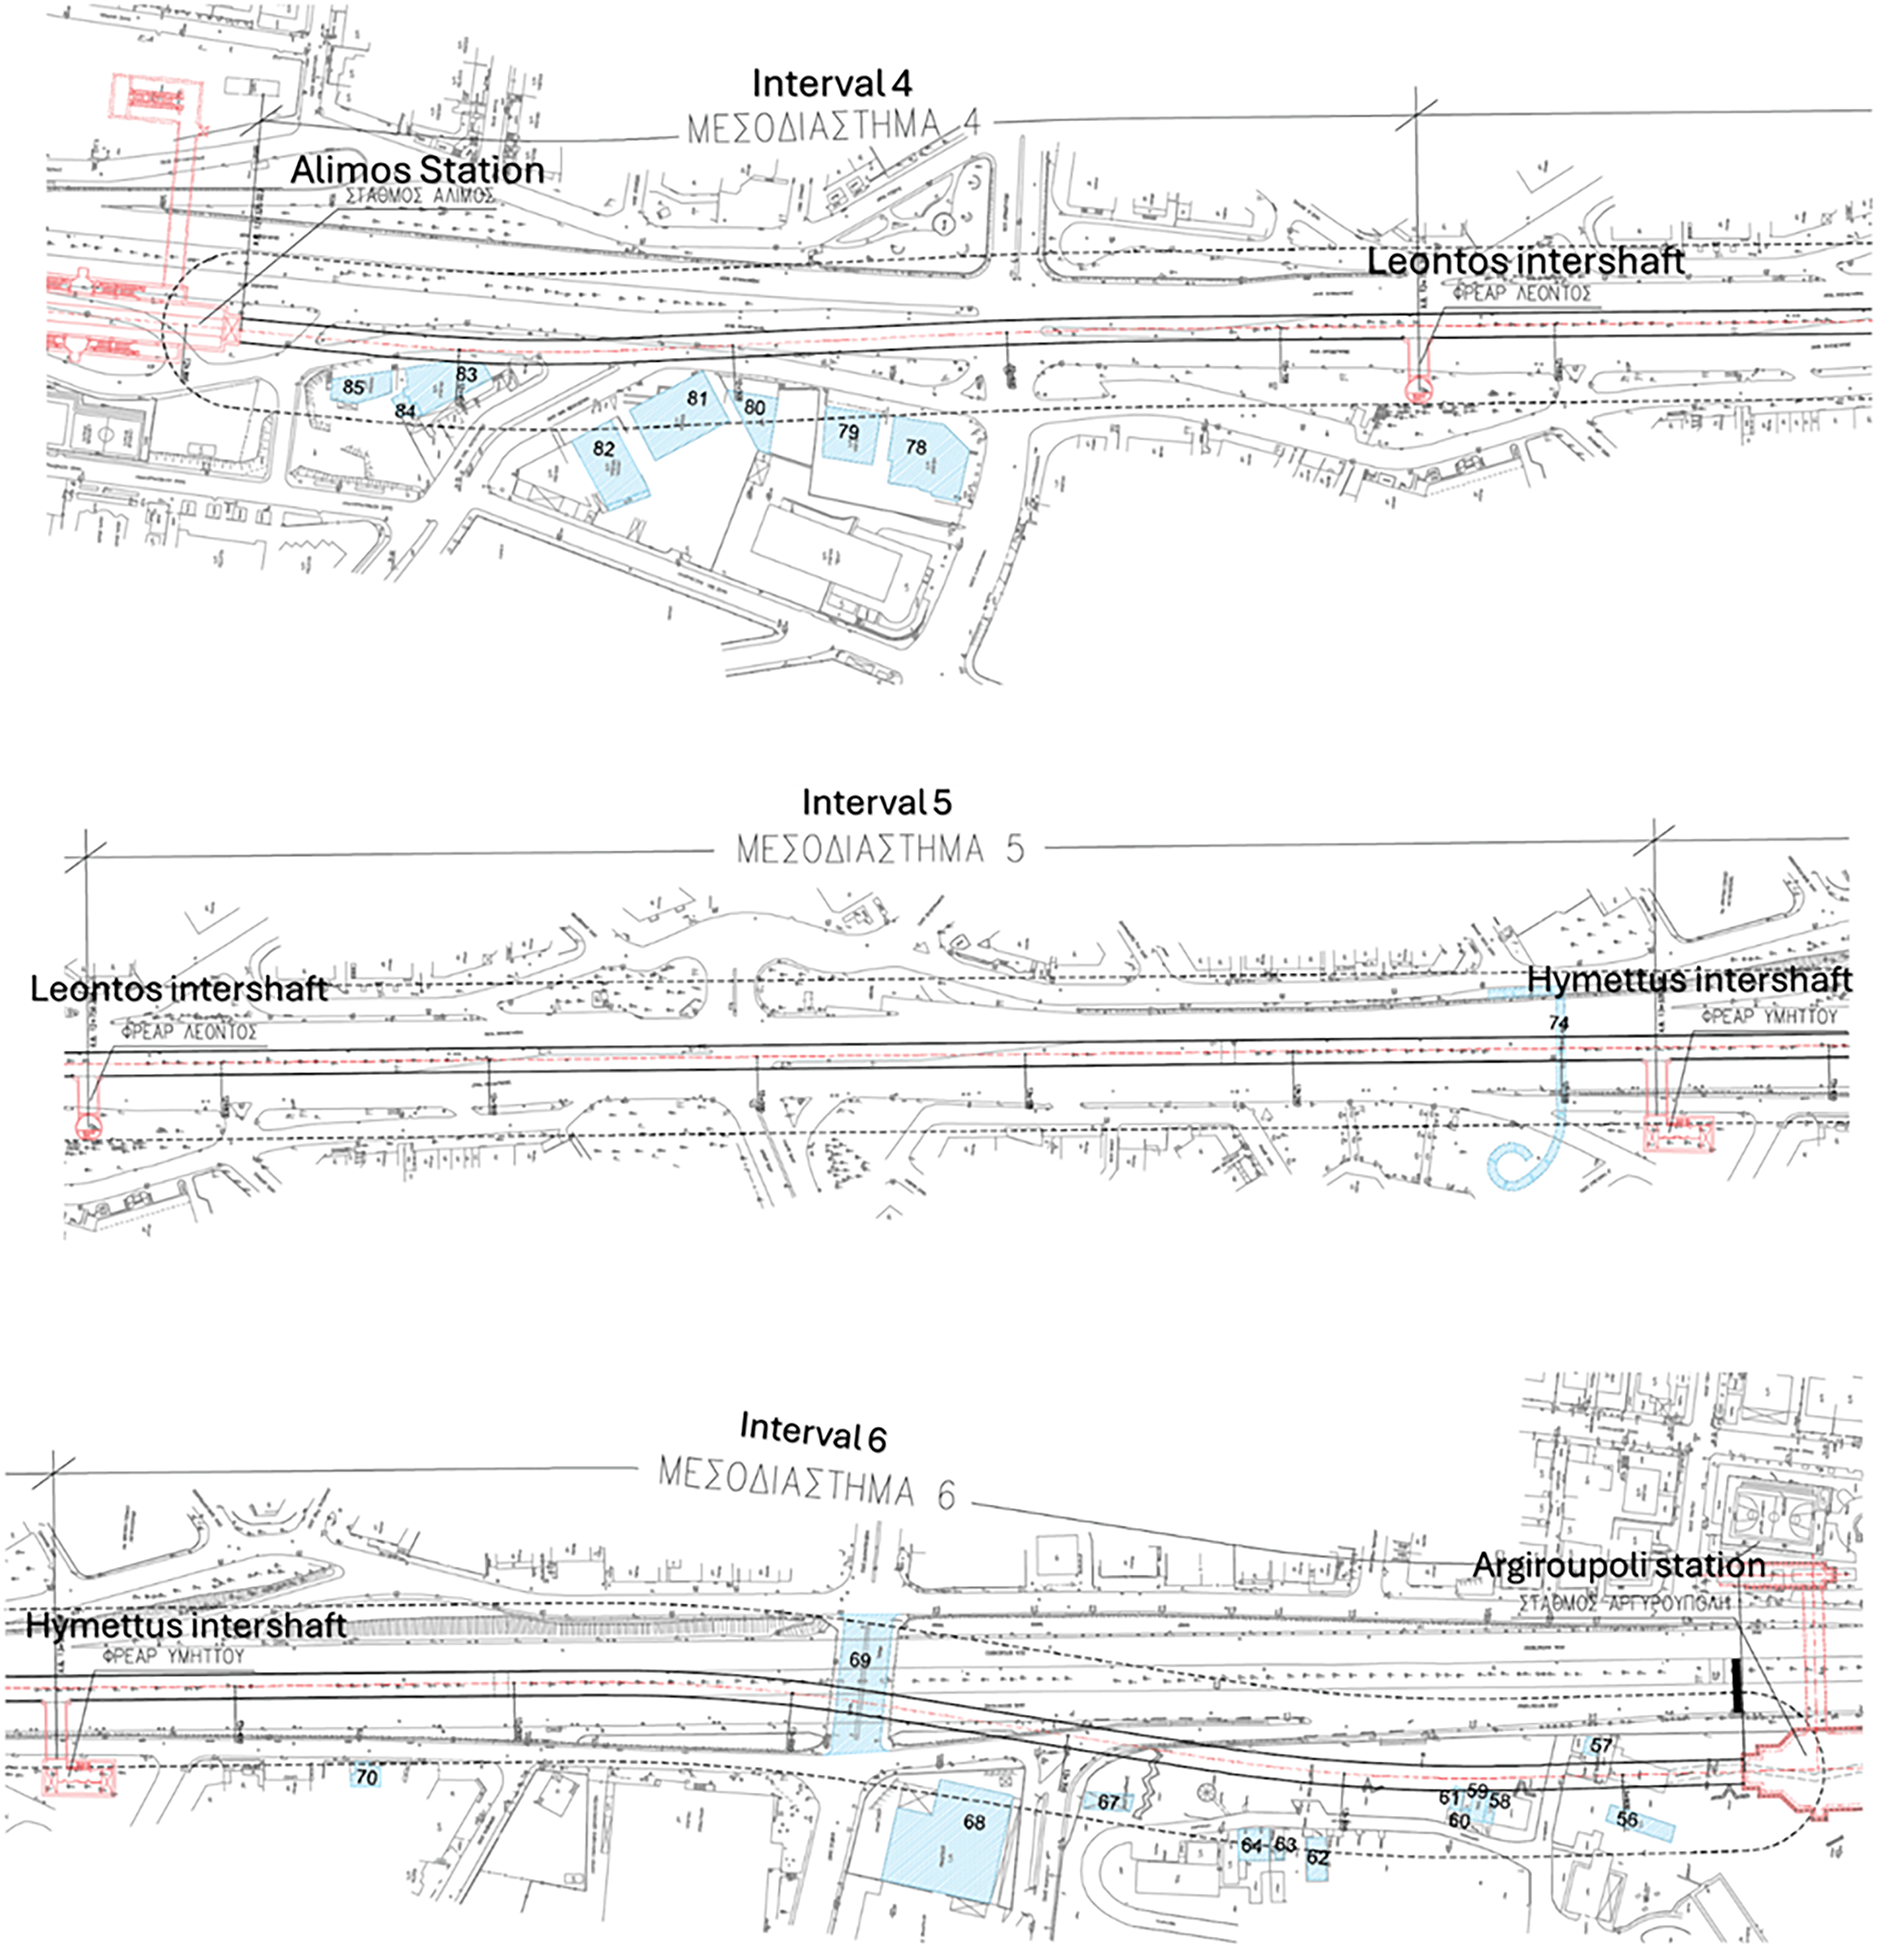
Figure 1: The horizontal alignment of the TBM tunnel from Hymettus intershaft to Leontos intershaft. Interval 5: Existing structures within the tunnel influence zone (ELLINIKO METRO S.A.).
Excavation of the single, double-track tunnel used a Herrenknecht EPB with diameter 9.49 m. Manufacturer data report maximum thrust of 24,000 kN and instantaneous penetration rate 60 mm/min. In sections with high plasticity and low internal friction angle, the machine operated in closed mode with foam additives. Foam volume ratio was 15%–30% per cubic meter of excavated material, and foam expansion coefficient 10:1–15:1 [25].
According to investigations conducted by ELLINIKO METRO, the subsurface of the study area is characterized by a complex sequence of geological formations, dominated by cohesive calcareous materials, primarily limestones, which locally exhibit significant variability in consistency, ranging from soft to hard (Fig. 2). These formations often present as cemented granular deposits of weak to moderate strength, interbedded with zones of silty clay, sand, gravels of low or negligible plasticity, and localized occurrences of soft cohesive soils. Distinct geotechnical behaviours are observed within the alpine basement formations, where marly limestones and calcareous sandstones (Formation 9.2), as well as metasandstones and metasiltstones (Formation 10.2), appear in three characteristic modes: rock-like, behaving as intact or weakly jointed rock masses; fragmented rock with mixed soil–rock characteristics; and soil-like deposits, where disintegration and weathering impart soil-dominant responses. This lithological heterogeneity suggests complex excavation conditions, requiring careful differentiation between rock-like, mixed, and soil-like behaviour in design and construction.
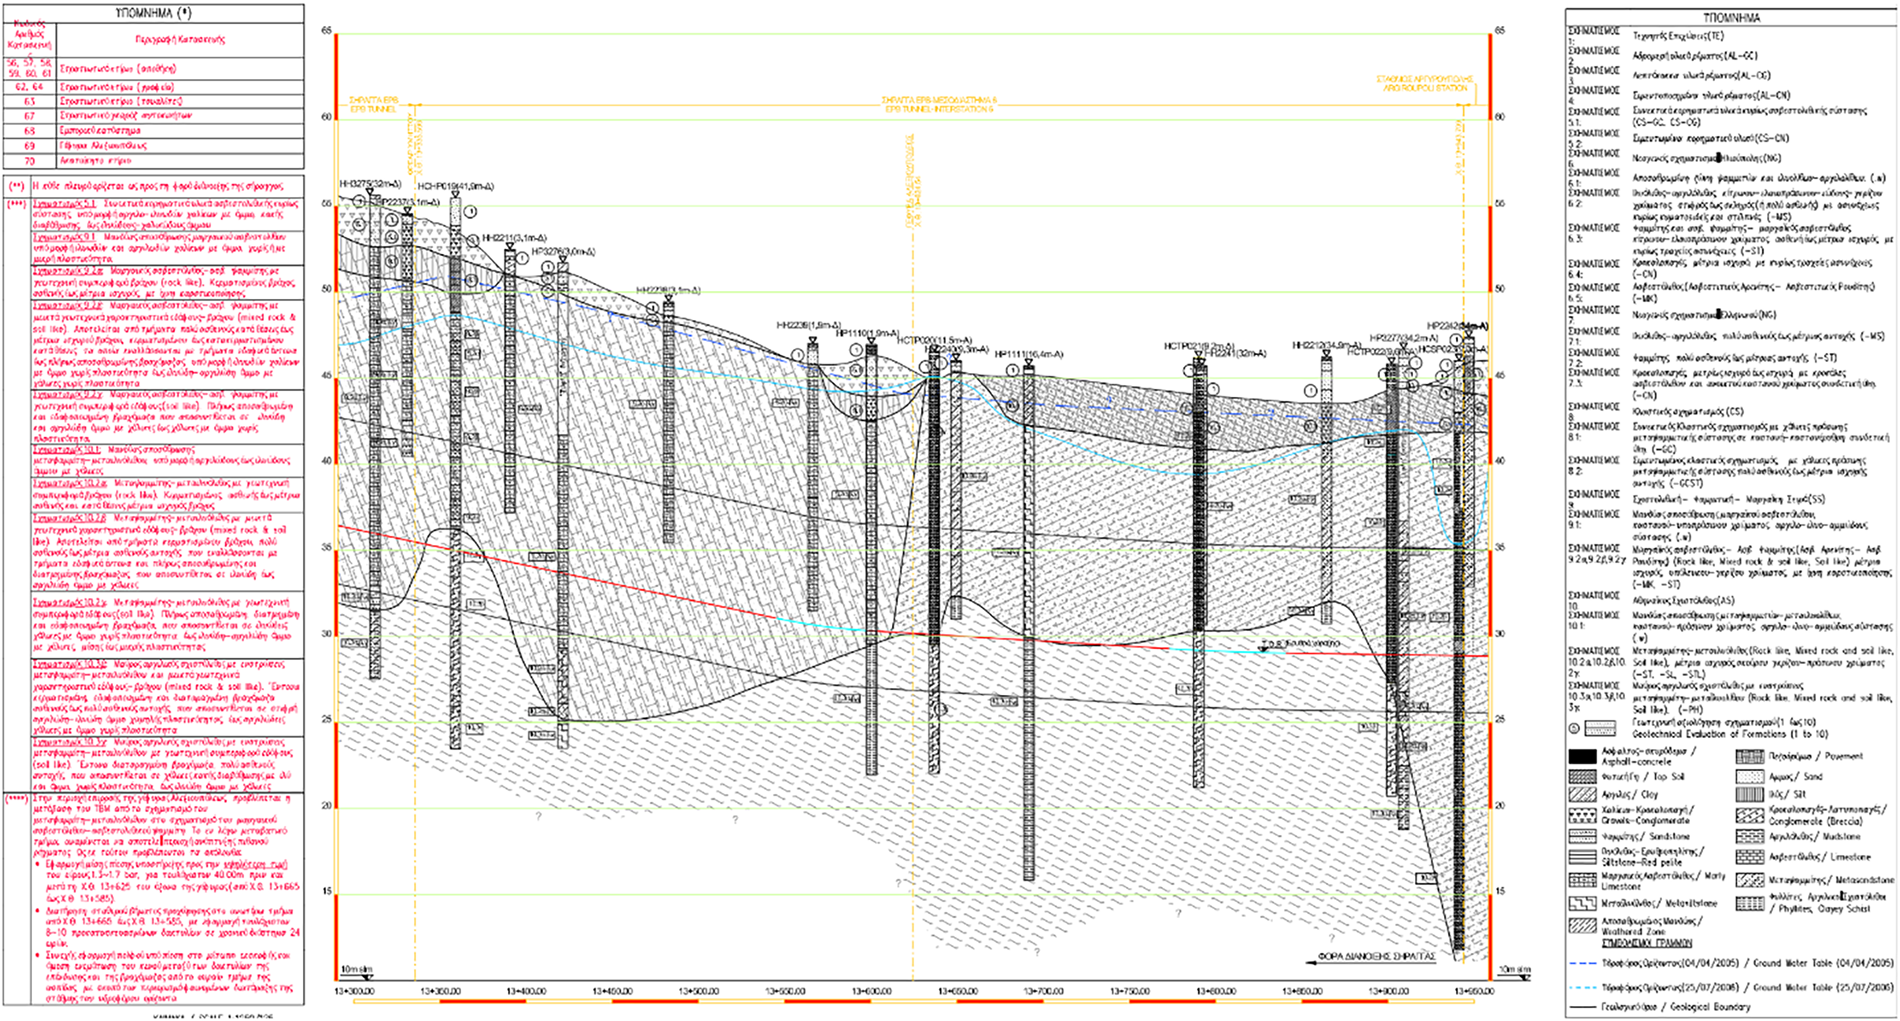
Figure 2: Example of geological cross-section (Intervals 6).
3.4 Data Analysis and Preparation
After the initial processing of the available data, it became necessary to organize the information into a structured format that could be reliably interpreted and used by the models under development. To support the required ML workflows, a unified database was created to consolidate all analysed information from the Metro area into a single input data pool. This centralized structure also facilitated the application of data preprocessing techniques, including handling missing values, performing data transformations, and conducting exploratory data analysis (EDA). All variables were compiled from ELLINIKO METRO reports, like the one given as a typical example in Fig. 3. The unified database comprises approximately 1100 ring-level records spanning the three excavation intervals, with each record containing synchronized geological, geotechnical, and operational parameters.
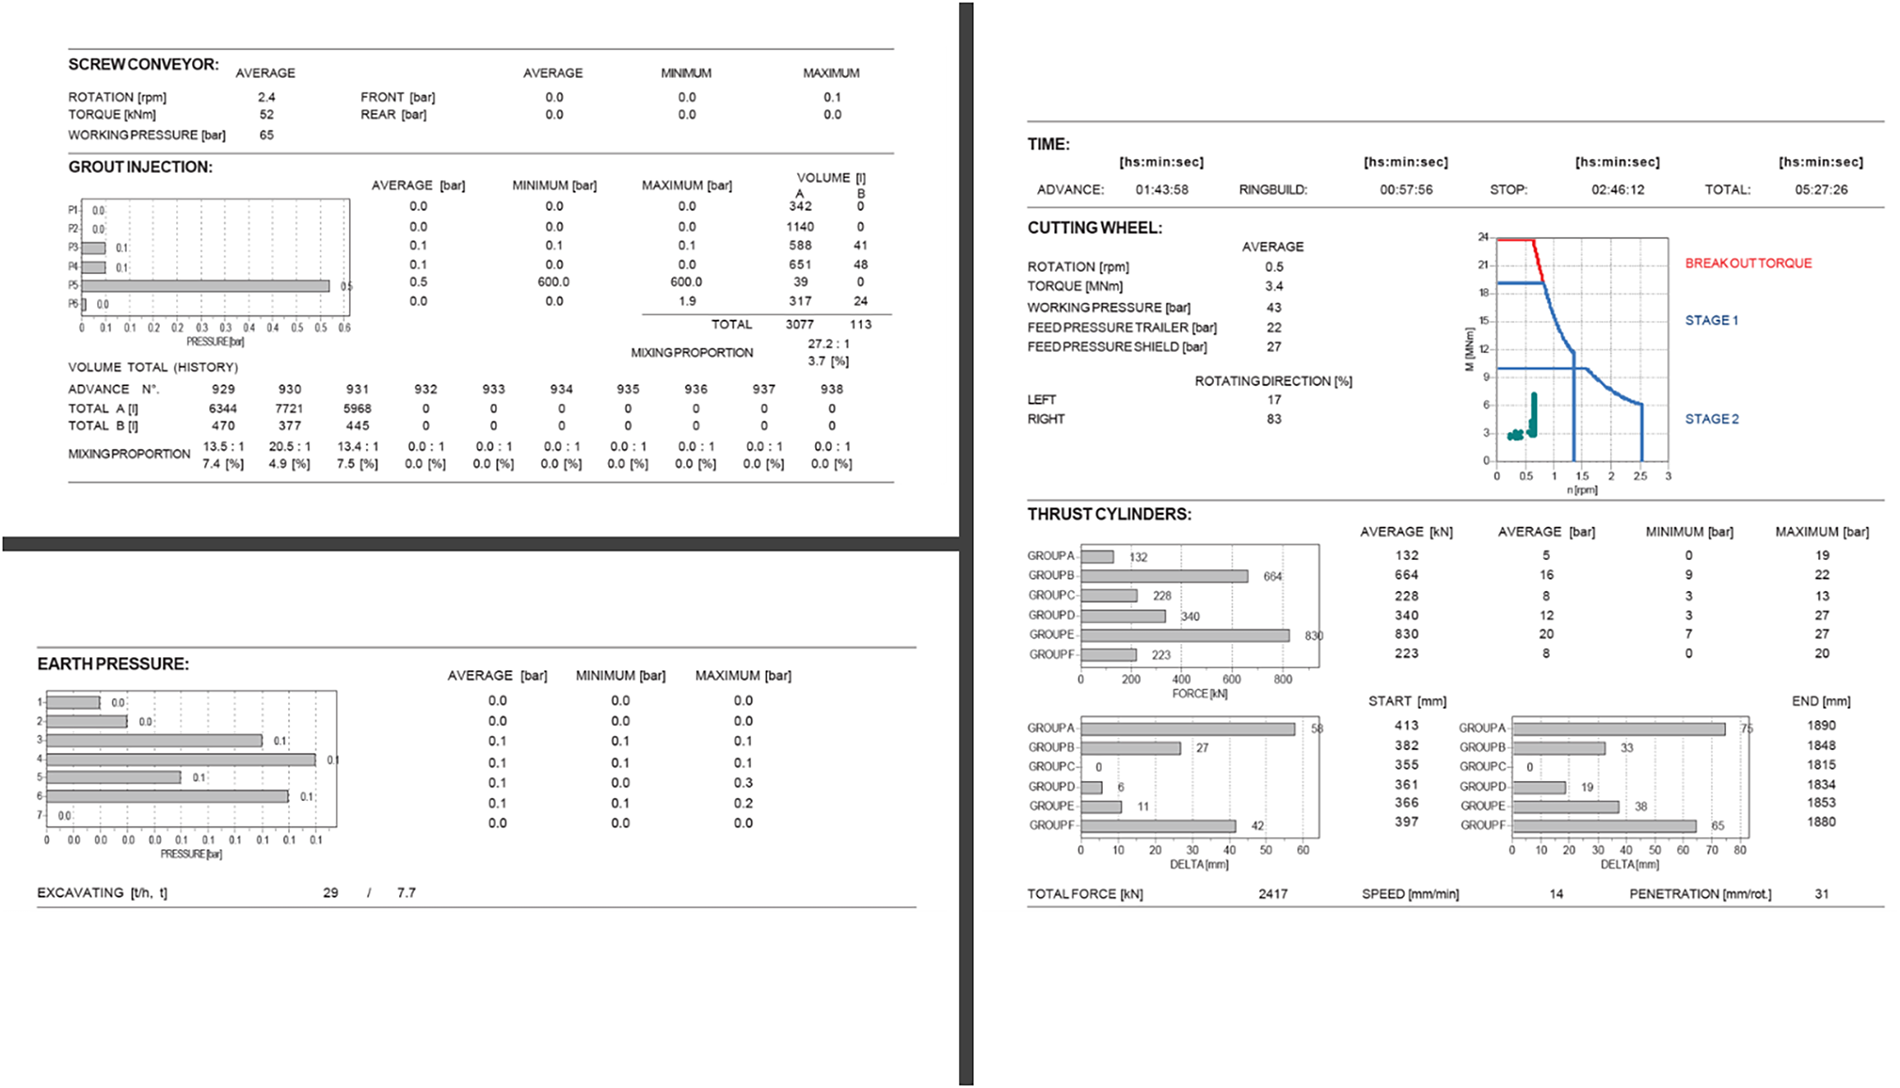
Figure 3: Typical report sheet as taken from ELLINIKO METRO [8].
For the easier handling of the data and the application of various data preparation methods, the unified database was split into two dataframes:
∎ TBM Parameter database (tbm_features), containing operational and machine-related variables, and
∎ Geological–Geotechnical database (geo_features), encompassing ground conditions and material properties.
An indicative summary of the unified database contents is shown in Table 1. This separation allows for more targeted preprocessing strategies, given the distinct nature of machine and geological data.
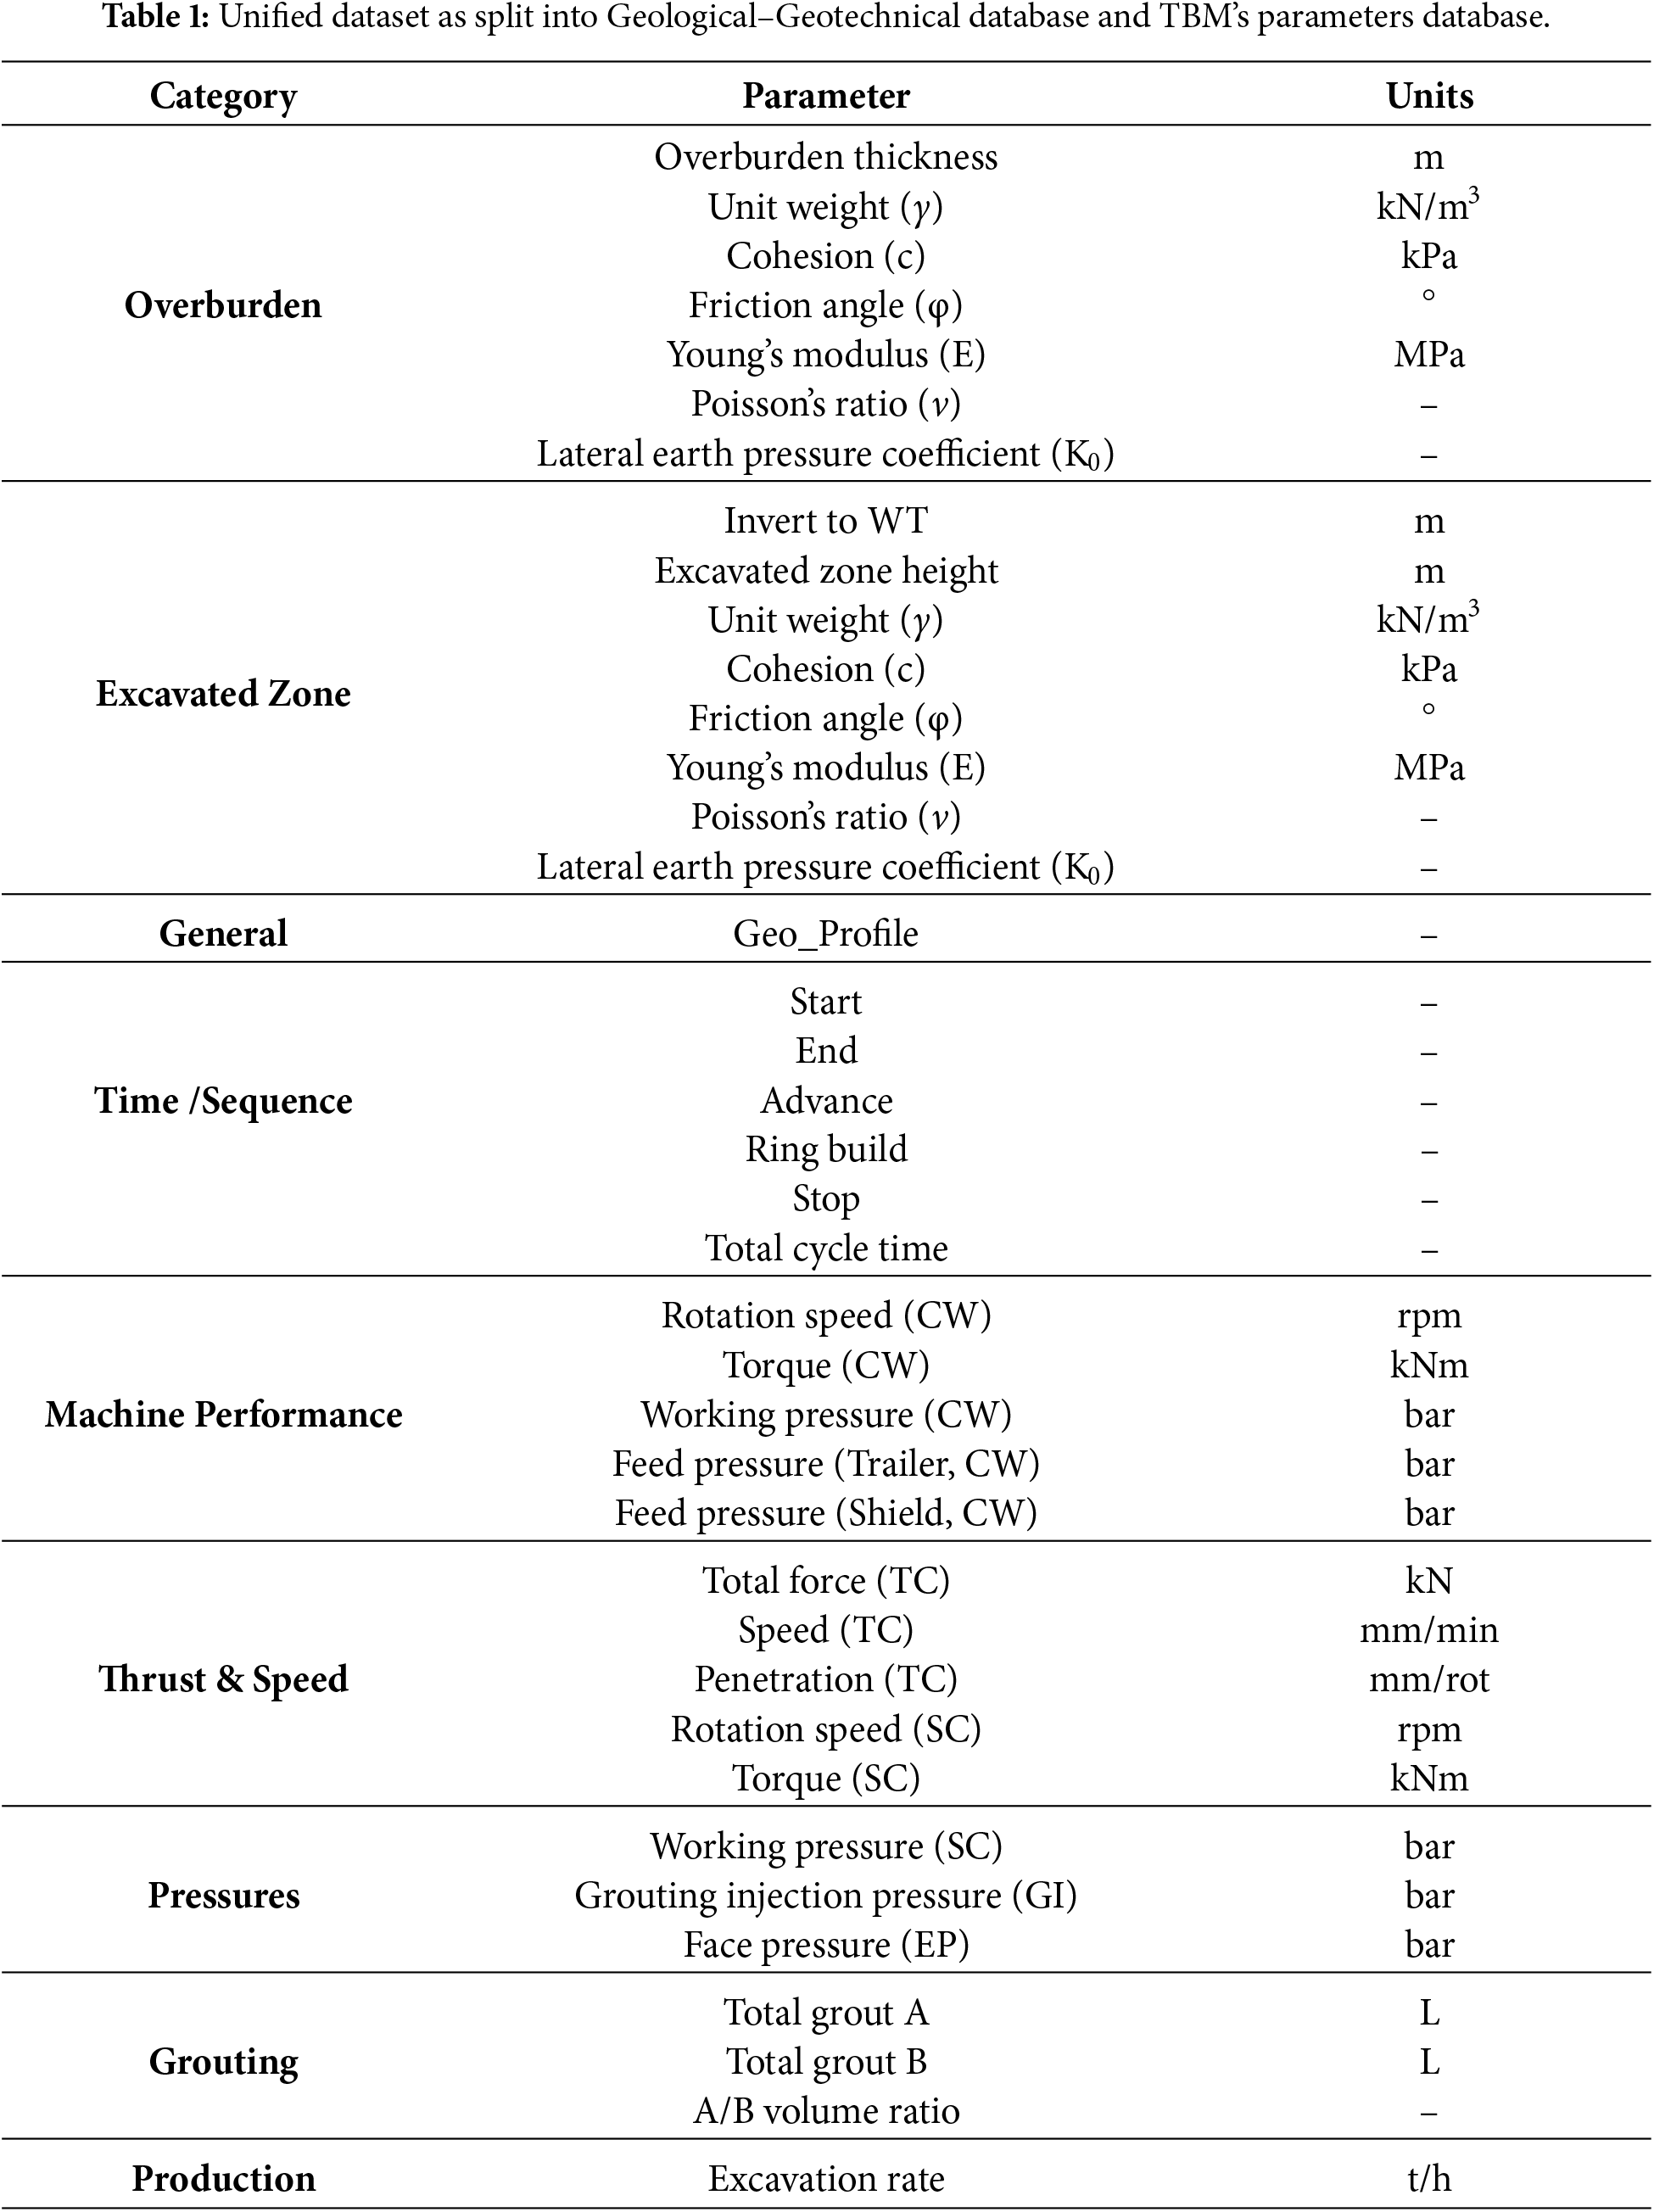
With this tabular format completed the next step was to perform a thorough Exploratory Data Analysis (EDA). This helps in understanding the structure of the dataset, detect patterns, and identify anomalies before applying modelling techniques.
∎ Handling Missing Data: Missing data is a common issue in real-world datasets, especially when integrating heterogeneous sources such as operational and geological records. Proper handling is crucial to avoid biased results or loss of valuable information. The choice of method was guided by the importance of each feature and the potential impact on downstream analysis.
∎ Feature Engineering: Feature engineering plays a vital role in enhancing model performance by creating more informative variables from existing data. In this context, new features were derived by combining related TBM parameters (e.g., ratios or interaction terms), transforming raw geological descriptions into numerical or categorical indicators and aggregating measurements over time or spatial segments to capture trends. These features were:
- Utilization (UTIL): This metric expresses the percentage of TBM usage within a shift. It is calculated as the ratio of the TBM’s net advance time to the total shift duration, thereby providing an indication of operational efficiency (Eq. (1))
Eq. (1) Utilization parameter calculation.
- Relative Depth (Relative_Depth): A newly derived parameter, it quantifies the excavation depth relative to the overburden (Eq. (2))
Eq. (2) Relative depth parameter calculation.
- Profile: The categorical feature Geo_Profile, representing geological formations from ELLINIKO METRO geotechnical reports, was encoded using One-Hot Encoding. This method transforms each unique category into a binary variable, enabling numerical representation without introducing artificial ordinal relationships. The number of generated features corresponds to the number of distinct geological profiles, allowing the model to better capture geological variability while ensuring data consistency.
- Datetime: Datetime variables were transformed into cyclical features to preserve temporal continuity. Specifically, sine and cosine transformations (Day Sin, Day Cos) which convert cyclical time units, like hours or days of the week, into two periodic coordinates (sine and cosine) were derived from the provided ELLINIKO METRO timestamps, enabling the model to capture periodic patterns without introducing artificial discontinuities. The cyclical time features capture diurnal patterns in TBM operation that are associated with crew-shift transitions and varying operator strategies. This representation improves the learning of temporal dependencies and enhances predictive performance. Because these features primarily reflect operator and crew-shift behaviour rather than mechanical necessity, their implications for the resulting parameter recommendations are discussed further in Section 5.1.
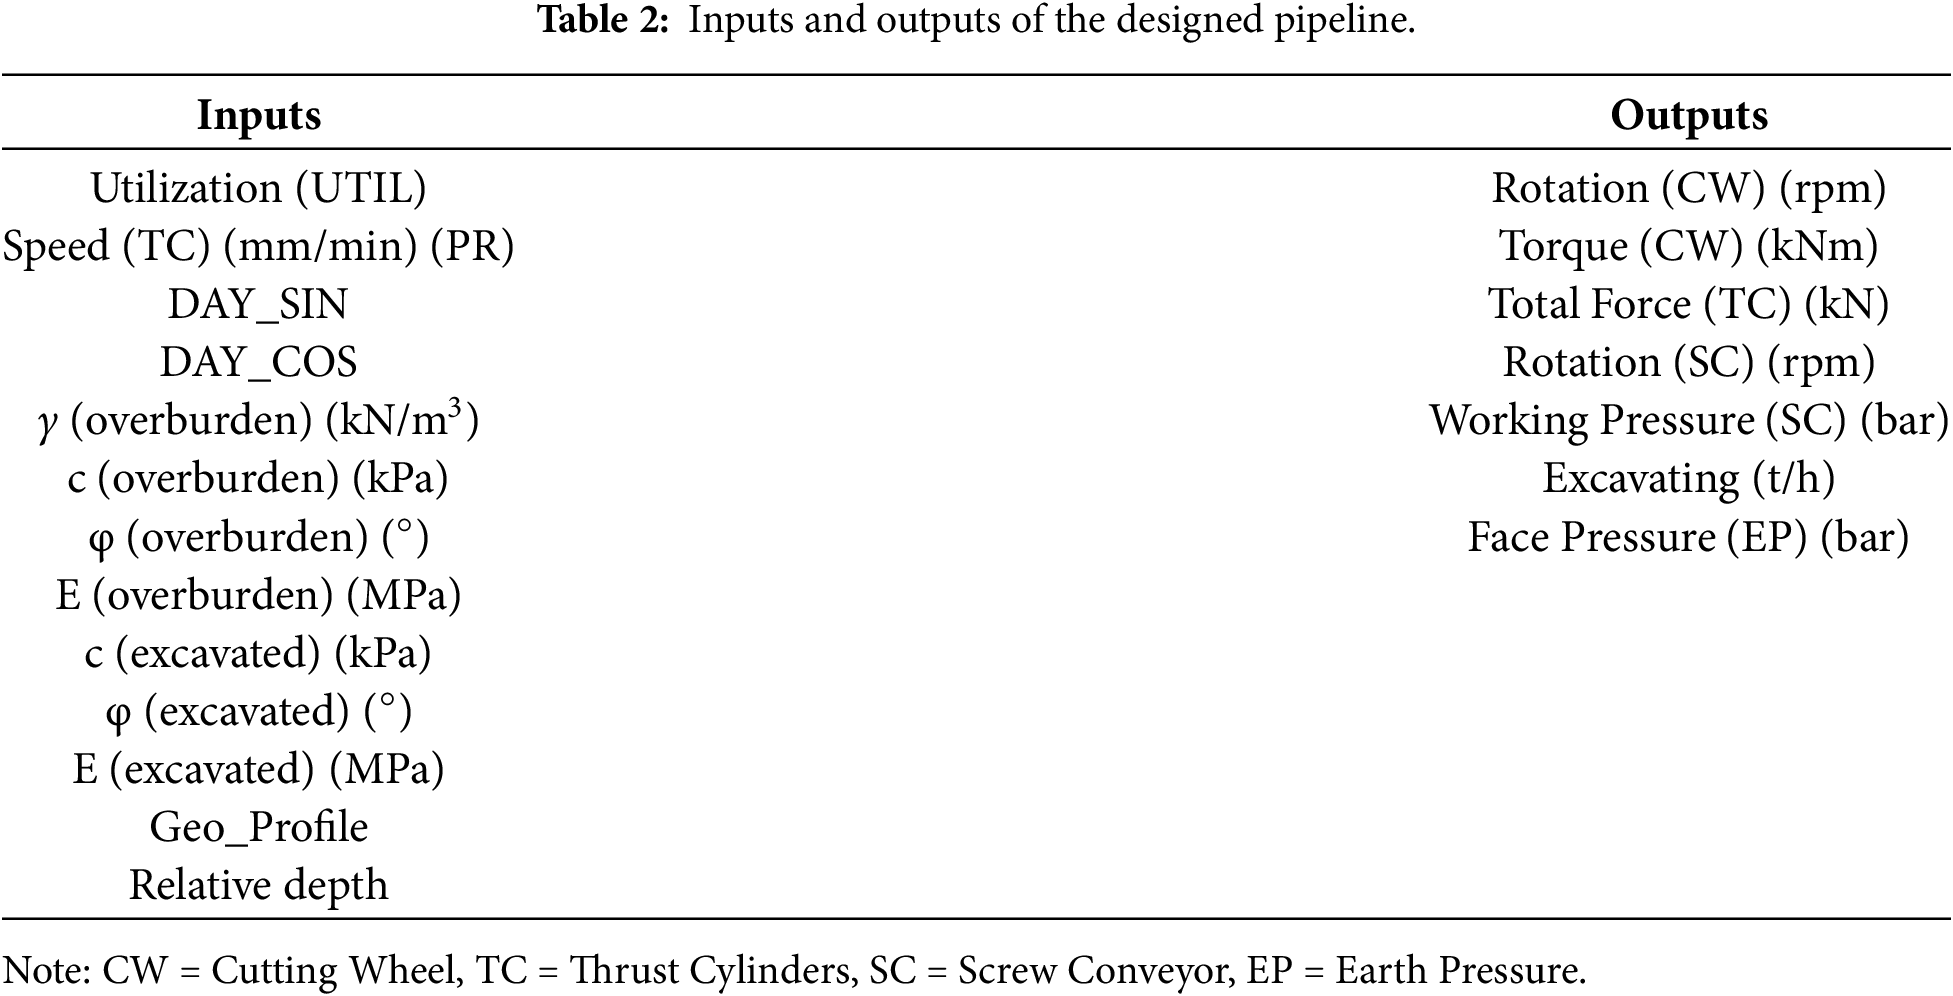
∎ Feature Importance: Evaluated to identify the most influential variables, improving interpretability and supporting dimensionality reduction. Methods included correlation analysis. Candidate input features were screened using Pearson correlation analysis among the geotechnical variables (Fig. 4) together with domain-based reasoning, rather than model-based importance ranking. Several variables were excluded prior to model training. Poisson’s ratio (ν) and the coefficient of lateral earth pressure (K0), for both the overburden and excavated zones, were removed because they showed near-constant values across the dataset and therefore carried negligible discriminative information. The deformation modulus Eo was excluded for both zones due to its near-perfect correlation with the elastic modulus E (r = 1.00 in both the overburden and excavated blocks), making the two variables redundant. The unit weight of the excavated zone, γ(excavated), was excluded due to redundancy with other retained or derived variables: it correlates with overburden depth (r = 0.66), a relationship already captured by the derived Relative Depth parameter (Excavated Zone Height/Overburden), and it is also strongly correlated with E(excavated) (r = 0.89) and φ(excavated) (r = 0.82), both of which were retained as direct inputs. Excavated zone height itself was likewise not retained as an independent input for the same reason. The remaining variables were retained as the final input set (Table 2).
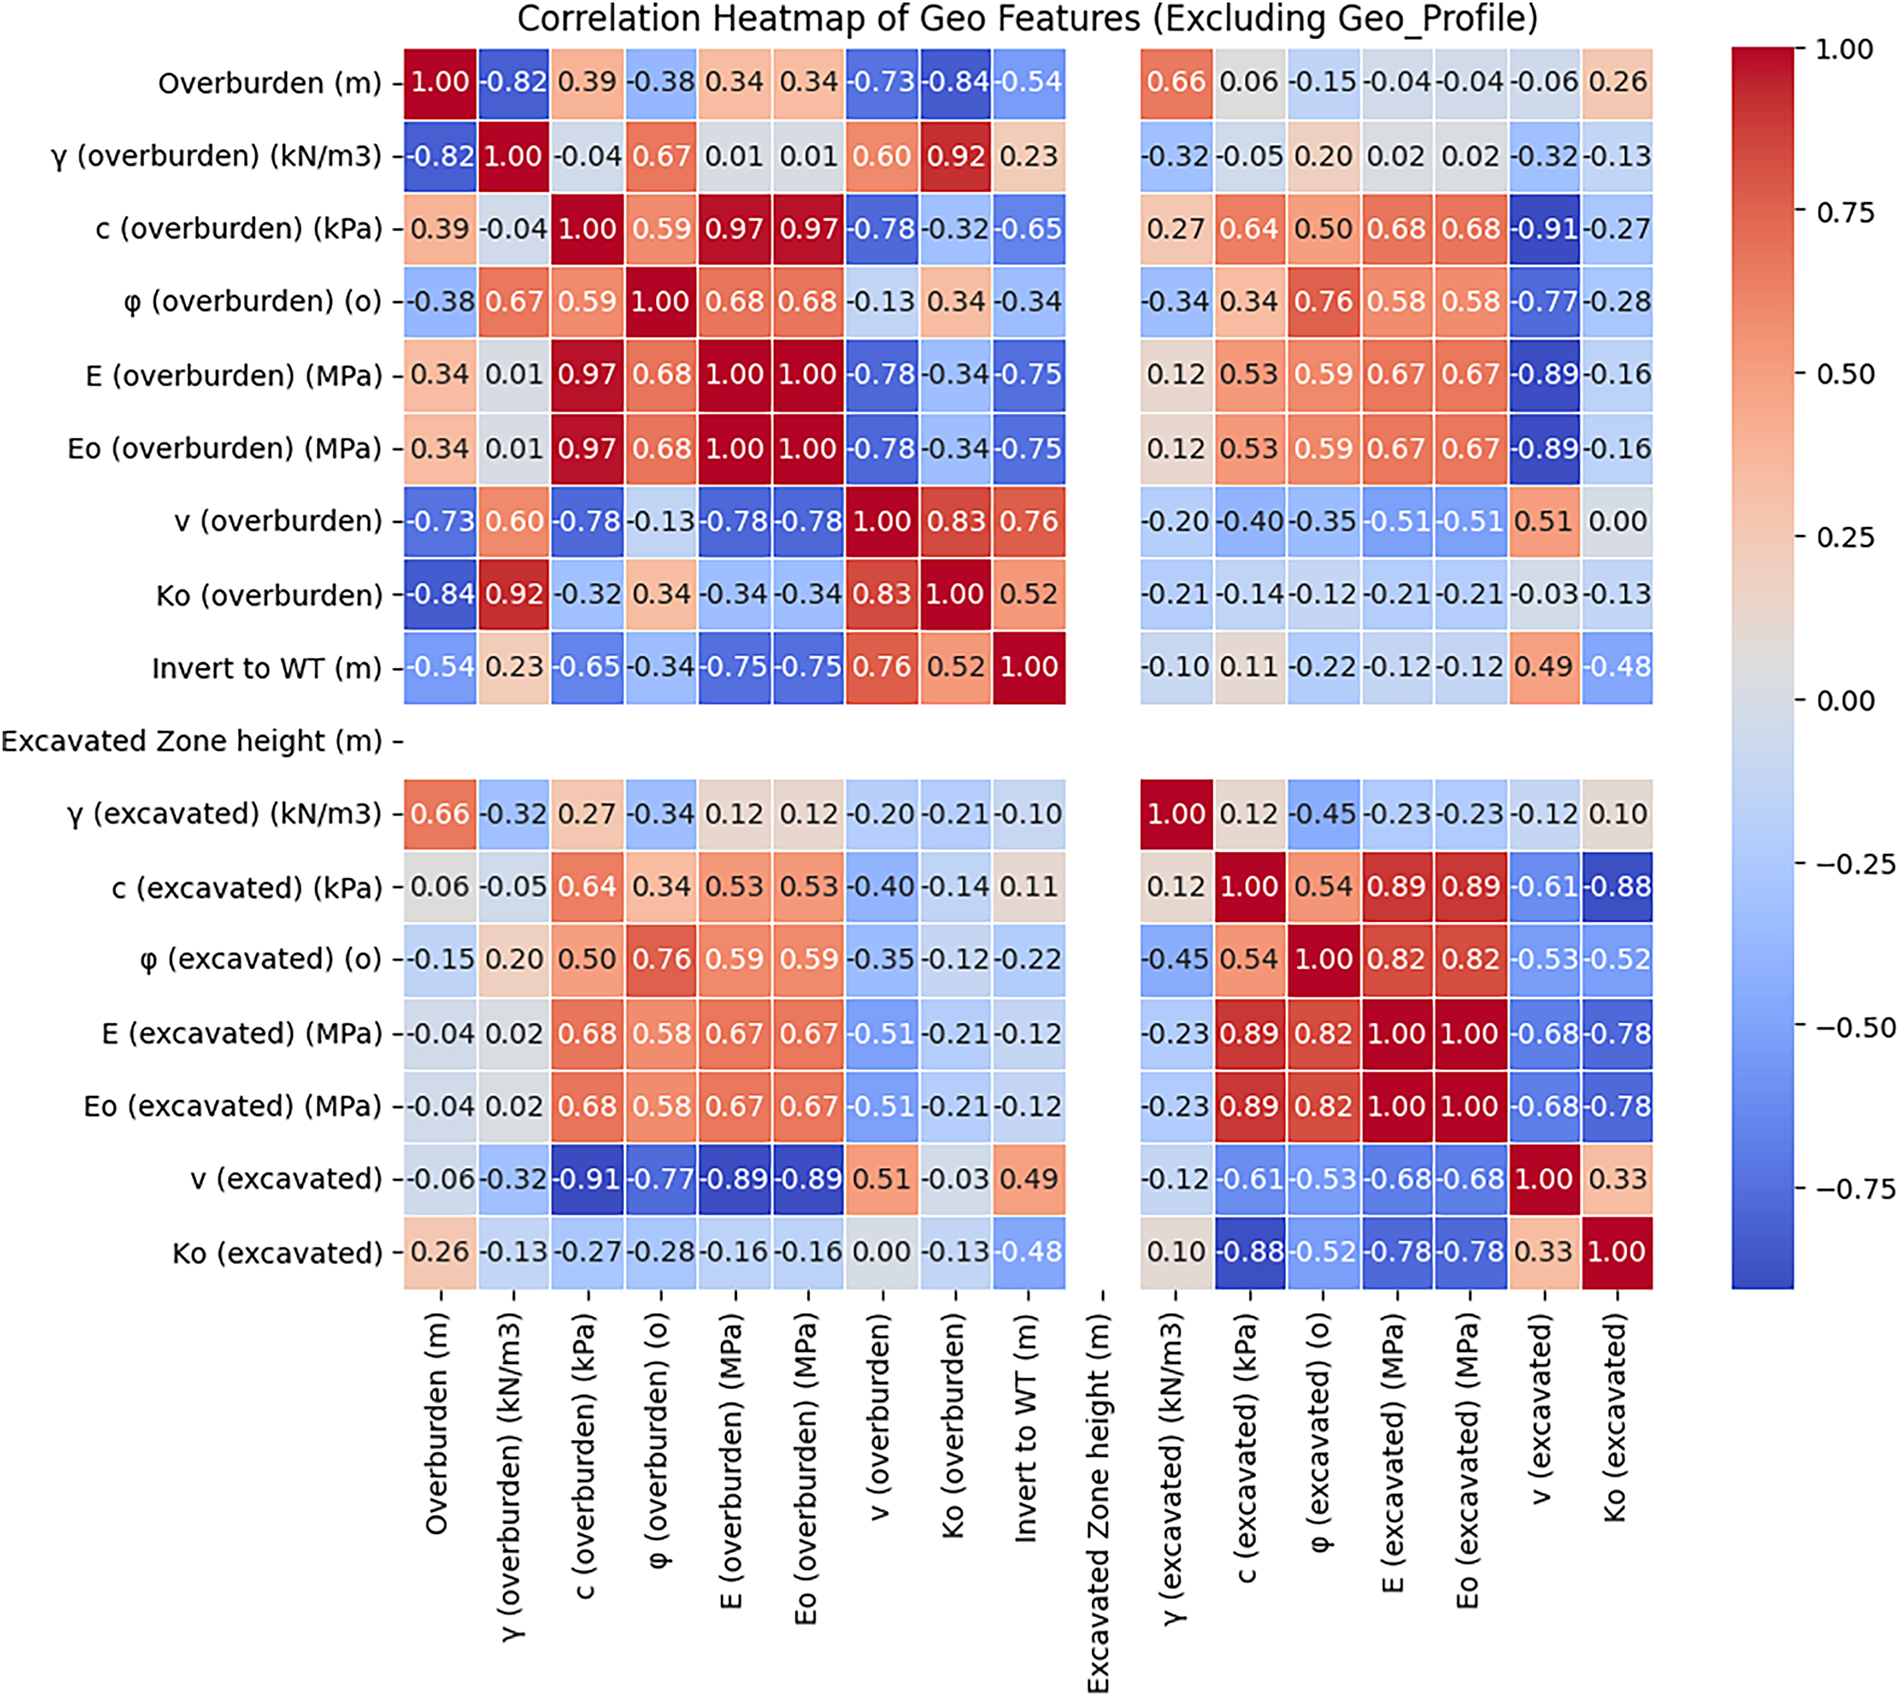
Figure 4: Pearson correlation heatmap of geotechnical and operational features (Geo_profile excluded), used to screen redundant inputs prior to model training.
∎ Outlier Detection: Boxplot (interquartile range (IQR)-based) screening, together with Z-score checks and scatter-plot inspection, was applied per feature to flag anomalous values. Rather than a blanket statistical trim, flagged points were cross-checked against the operational log before removal, so that values traceable to sensor or logging errors were discarded, while extreme-but-plausible values associated with abrupt geological transitions were retained, since these are geotechnically meaningful and the model is intended to learn from them. Screening operated at the level of complete shift/ring records rather than individual feature values: flagged records, primarily short episodes traceable to equipment stoppages or sensor/logging faults, were excluded via listwise deletion rather than imputed. As this affected only a small fraction of the ~1100-record dataset, the remaining data retained sufficient coverage across geological conditions and operating regimes without requiring a compensating imputation step; this differs from the handling of missing data described above, which addressed genuinely incomplete records arising from the heterogeneous-source merge. We acknowledge that boxplot-based screening cannot guarantee complete removal of all extreme values, and that some residual influence of rare, geologically driven extremes on the fitted feature statistics is possible; this is discussed further below.
∎ Feature Distribution Analysis: Conducted to examine data behaviour, including skewness, kurtosis, and categorical frequency distributions, informing preprocessing decisions.
∎ Feature Scaling & Transformation: Standardization (Z-score scaling) was applied to the continuous numerical features, namely the geotechnical descriptors, relative depth, and the cyclical time features, to ensure consistent feature scaling and improve model convergence. The one-hot encoded geological profile indicators were left unscaled, preserving their native binary (0/1) structure rather than distorting their sparsity through standardization, consistent with standard practice for categorical dummy variables. Z-score scaling was preferred over median/IQR-based alternatives such as the Robust Scaler for three reasons: (i) the preceding outlier-screening step already removed values traceable to sensor or logging errors, leaving a moderate-sized dataset (~1100 ring-level records) in which the retained extremes reflect genuine geological variability that we did not want to systematically down-weight relative to the bulk of the distribution; (ii) the network’s batch-normalization layers re-normalize activations internally during training, providing a further, learned layer of robustness to residual scale differences; and (iii) Z-score statistics are numerically stable at this sample size, whereas median/IQR estimates can become comparatively less stable when computed on smaller per-feature or per-profile subsets. We nonetheless agree that a systematic comparison against Robust Scaler and other outlier-resistant scaling schemes is a valuable direction, which we flag explicitly as future work in Section 5.
From this unified database, predictor inputs comprised unit weight, cohesion, friction angle, and Young’s modulus for the overburden and excavated zones, relative depth, a categorical geological profile, and daily harmonic terms encoding the diurnal cycle. PR and UTIL served as conditioning variables apart from inputs. Outputs were cutterhead rotation and torque, total force, screw-conveyor rotation and working pressure, excavating (excavation rate), and face pressure. Table 2 presents a summary of the inputs and outputs used in the pipeline.
A feed-forward neural network (OPT_ANN) with architecture 124–62–16–8–7 was developed using ReLU activations, batch normalization, 20% dropout, and L1/L2 (Elastic Net) kernel regularization (λ1 = λ2 = 0.001, applied to each hidden layer) to enhance generalization and stability. The final output layer contains seven neurons, one for each predicted TBM operational parameter, enabling simultaneous multi-output regression. The model was trained with the Adam optimizer (initial learning rate = 0.001) and mean squared error (MSE) loss, using a maximum of 300 epochs, batch size 32, and an internal validation split of 20%. A standard MSE loss was adopted rather than a physics-informed formulation, since no single closed-form mechanistic model adequately captures the coupled geology-parameter-response relationship at this site (Section 2.1); this design choice and its implications for physical feasibility are discussed in Section 5.1. Two callbacks were used to mitigate overfitting: ReduceLROnPlateau (monitoring validation loss, reduction factor = 0.1, patience = 5 epochs, minimum learning rate = 1 × 10⁻⁵) and EarlyStopping (monitoring validation loss, patience = 10 epochs). In the reported run, training halted at epoch 192 of the 300-epoch budget under the early-stopping criterion, with the learning rate having been reduced twice (to 1 × 10⁻⁴ and then to the floor of 1 × 10⁻⁵) as validation loss plateaued, confirming that both callbacks were actively engaged rather than the model exhausting a fixed epoch budget. Dropout was active only during training, as a stochastic regularizer, and was deactivated during inference following standard practice; all reported metrics and recommended parameter set therefore correspond to deterministic point predictions from the trained network rather than Monte Carlo samples. The final architecture (Table 3) resulted from an iterative trial-and-error process, where different hyperparameter combinations were evaluated. A stratified train/test split (80/20) based on geological profile was implemented to ensure representative sampling of all ground conditions. This stratification prevents bias from underrepresented geological formations, although spatial autocorrelation between adjacent rings remains a concern. Standard random k-fold cross-validation was deliberately not used for this reason: adjacent tunnel rings are geotechnically and operationally similar, since ground conditions and excavation parameters change gradually along the alignment, so a random k-fold split would place highly similar, spatially adjacent rings in both the training and validation folds. This leaks information across the split and yields an optimistic estimate of generalization rather than a genuine test of the model’s ability to generalize to unseen ground conditions; the single stratified split adopted here is subject to the same limitation in a milder form, and the reported test metrics should be interpreted as an upper bound on generalization performance rather than a guarantee of transferability to new projects, TBM types, or geological settings. Addressing this rigorously will require chainage-blocked or leave-one-interval-out cross-validation, which holds out entire contiguous tunnel intervals rather than randomly sampled rings, providing a more conservative and spatially honest estimate of generalization; this is identified as a priority direction for future work (Section 5.1).

3.6 Conditioning Approach and Reverse Engineering Procedure
The term “reverse engineering” or “inverse modelling” as used in this study refers to a co-occurrence conditioning approach rather than classical mathematical inversion. In conventional forward modelling, operational parameters (rotation, torque, thrust, etc.) are inputs and performance metrics (PR, UTIL) are outputs. Here, the relationship is reversed: PR and UTIL are placed on the input side alongside geological descriptors, and the network learns to predict the machine states that are historically co-occurring with those performance levels under the given ground conditions. This conditioning strategy has a key practical advantage: it requires only a single forward pass through the network to generate candidate parameter sets for any target PR/UTIL combination, avoiding the computational cost of iterative optimization. Its limitation is that the resulting predictions describe co-occurrence patterns rather than causal prescriptions; the recommended settings are those that the machine was typically operating at when the target performance was observed in similar ground, not settings that are guaranteed to produce that performance. The overall methodological flowchart is given in Fig. 5.
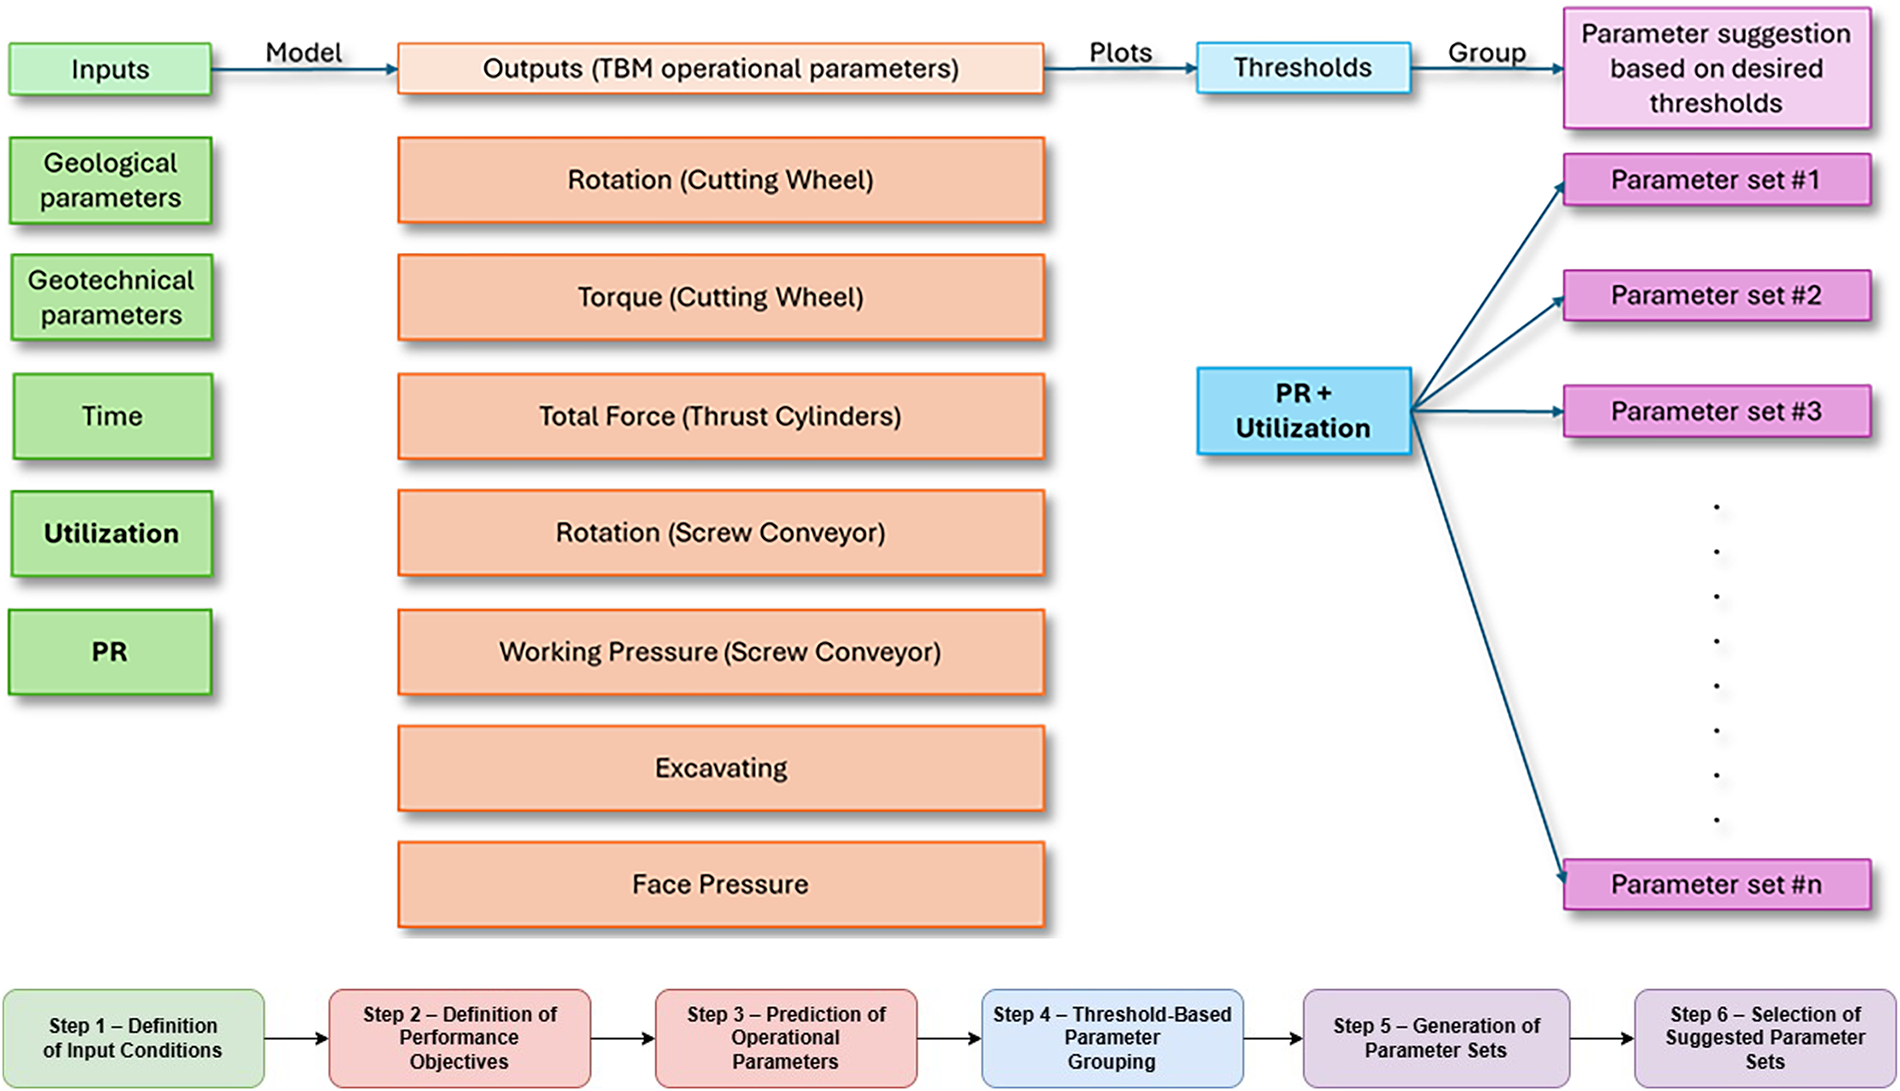
Figure 5: Overview of the proposed methodology.
The reverse engineering procedure comprises a structured sequence of steps:
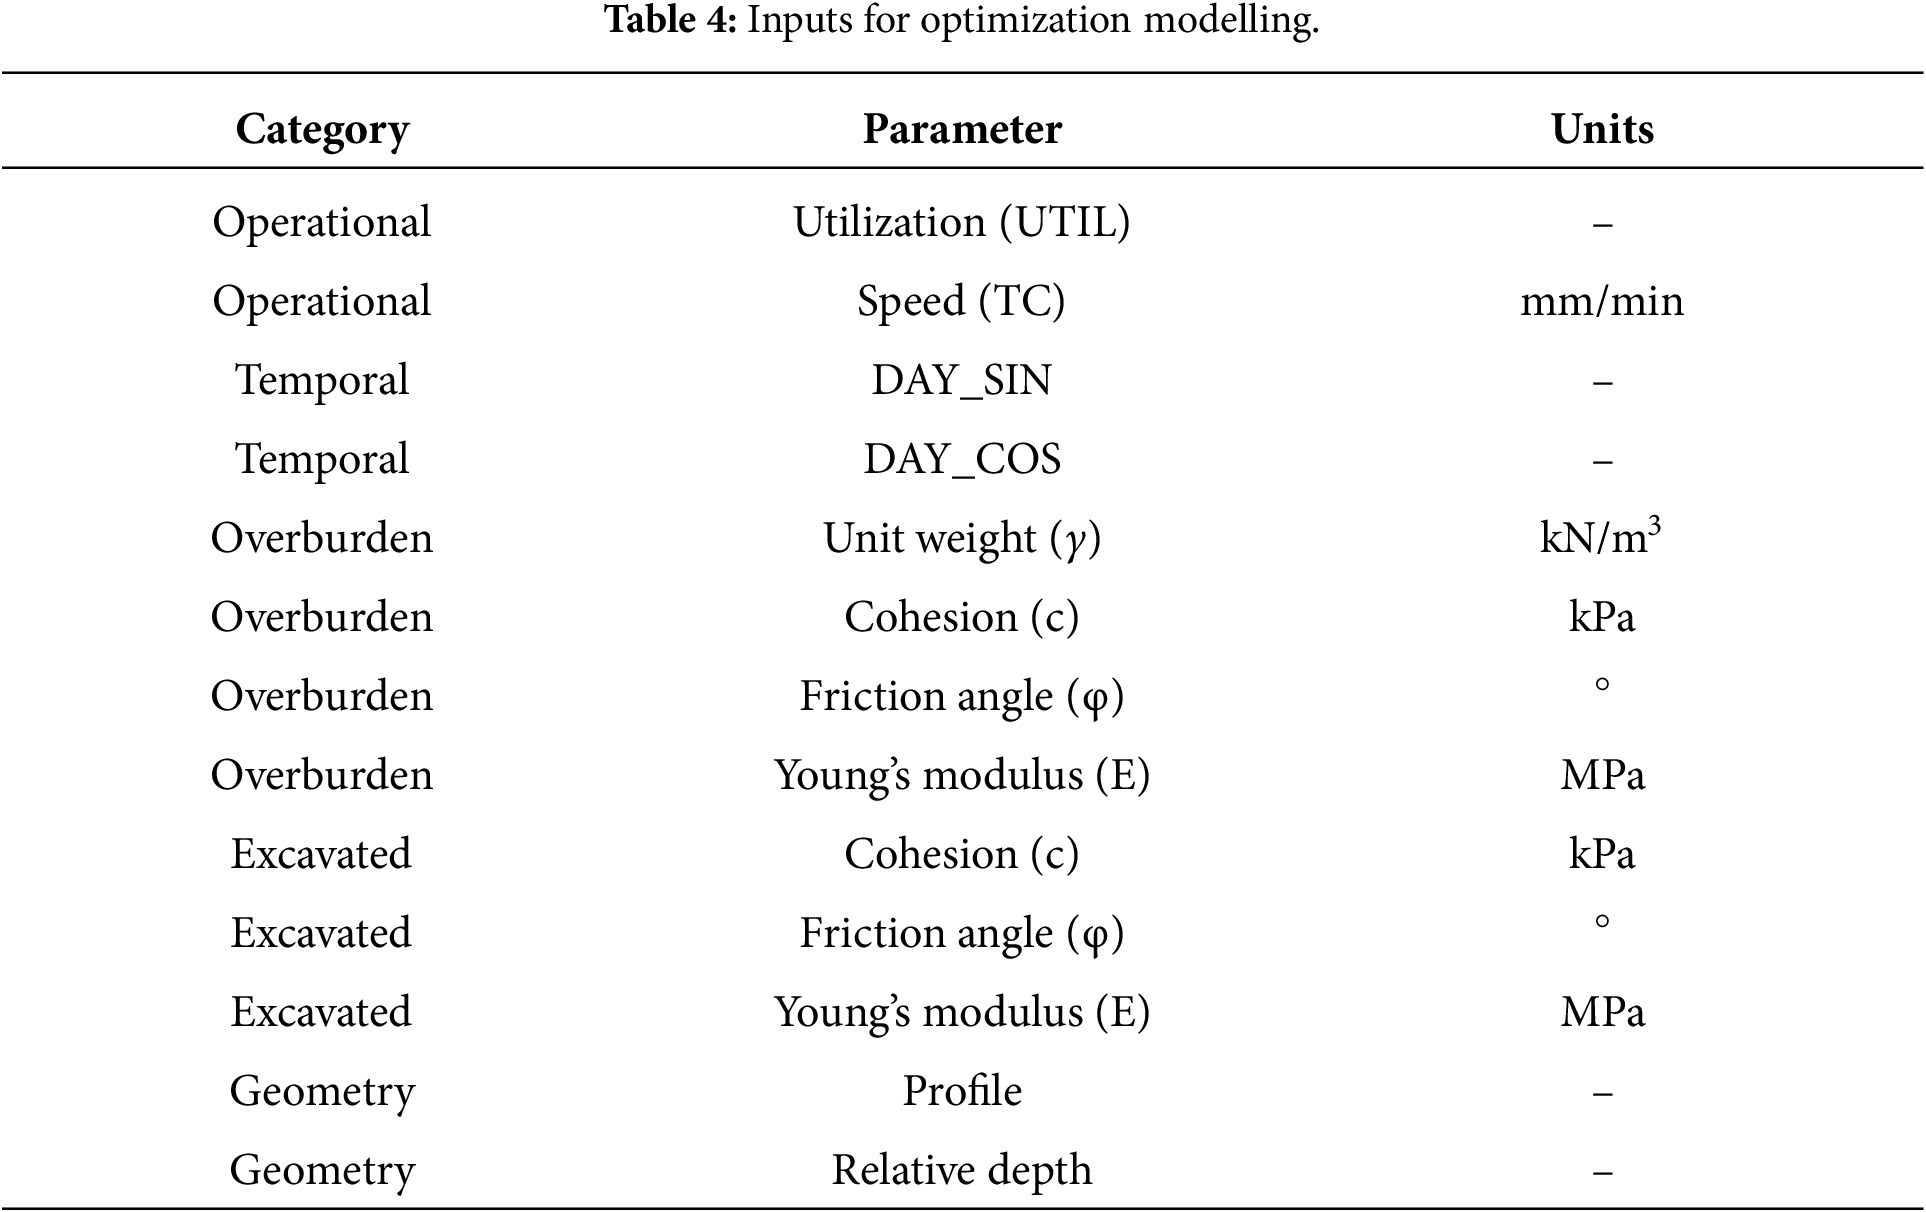
Step 1—Definition of Input Conditions. The geological and geotechnical conditions for the tunnel section under consideration are defined. These parameters characterize the ground mass encountered by the TBM and serve as the primary input to the modelling framework (Table 4).
Step 2—Definition of Performance Objectives. Performance objectives are defined as threshold ranges for both PR and utilization. These ranges represent practical performance classes that enable evaluation of alternative operational parameter combinations.
Step 3—Prediction of Operational Parameters. The model predicts the values of key TBM parameters, including cutterhead rotation speed, torque, thrust force, screw conveyor rotation, working pressure, excavation rate, and face pressure (Table 5).

Step 4—Threshold-Based Parameter Grouping. The predicted operational parameters are organized into ranges using predefined thresholds. This step addresses: given specific ground conditions and predefined performance criteria (e.g., PR > 17 and UTIL > 0.35, the basis for which is discussed in Section 4), what ranges of TBM operational parameters are most suitable? This threshold formulation identifies high-penetration, high-utilization operating regimes where the machine achieves rapid excavation (PR > 17 mm/min) with sustained productive time (UTIL > 0.35, where UTIL is the ratio of advance time to total time, with higher values indicating greater operational efficiency). The threshold-based grouping reduces sensitivity to minor prediction variability and transforms raw model outputs into practical operational ranges. Reporting ranges rather than a single point prediction also partly mitigates the risk that a mean-regression model blends genuinely distinct, individually valid parameter combinations into an unrepresentative or infeasible point; this is discussed further in Section 5.1.
Step 5—Generation of Parameter Sets. Operational parameters grouped into ranges are combined to form parameter sets, each representing a feasible combination of TBM operating conditions.
Step 6—Selection of Suggested Parameter Sets. Parameter sets satisfying the performance thresholds are retained as suggested operating conditions. The graphical representation of the described steps is presented in Fig. 5.
The training and validation loss curves (Fig. 6), indicate a stable learning process. Both losses decrease rapidly in early epochs and more gradually thereafter, suggesting effective initial learning followed by refinement. The close alignment between training and validation loss indicates good generalization with no evident overfitting.
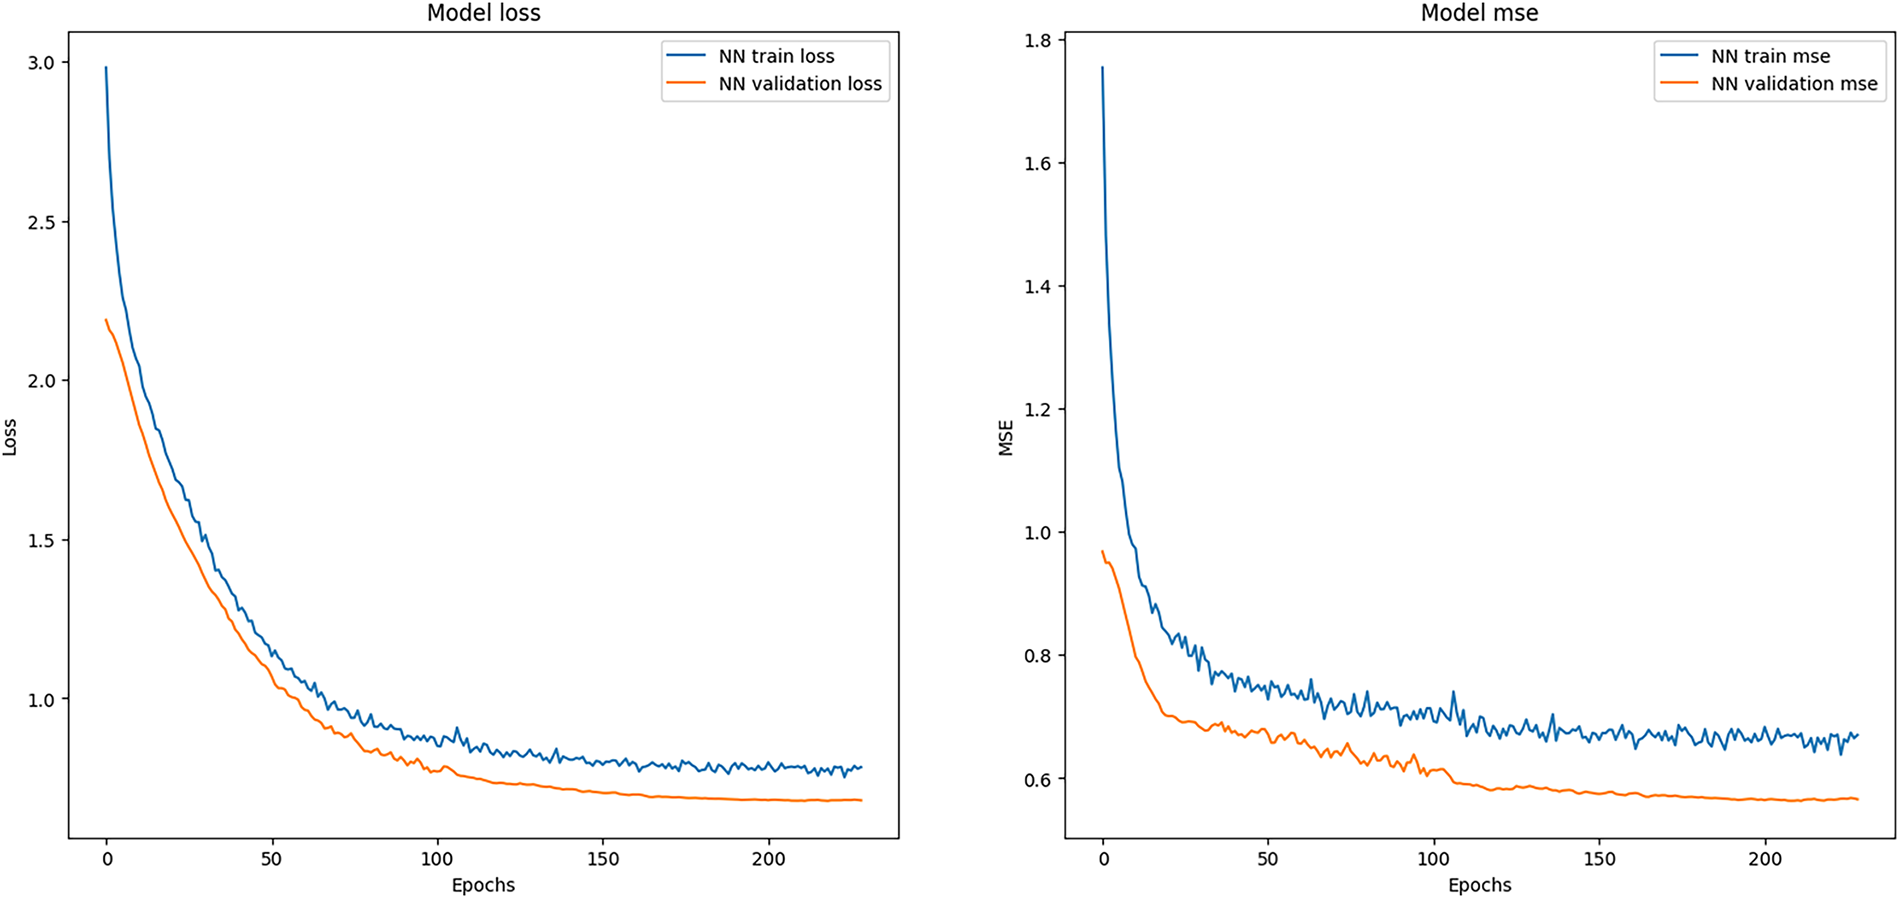
Figure 6: Training and testing diagrams of the “OPT_ANN” model per epoch.
As OPT_ANN predicts seven TBM operational parameters simultaneously, evaluation metrics were computed per output and averaged to provide overall performance. MAE, MSE, and RMSE were calculated in the normalized space, while Relative Root Mean Squared Error (RRMSE) was derived after inverse transformation to original units. Additionally, the Wasserstein Distance (W.D.) was used to assess distributional similarity. Results (Table 6) show consistent performance across training and test sets, with nearly identical MSE (0.55 vs. 0.56) and RMSE (0.74 vs. 0.75), indicating good generalization and no significant overfitting. The aggregated MAE values are 0.54 (train) and 0.53 (test), confirming stable pointwise accuracy. RRMSE (11.9% training, 11.0% test) suggests good predictive accuracy for a complex engineering system. Low and similar W.D. values (0.36–0.37) further indicate that the model effectively preserves the statistical distribution of the target variables.

Regarding the comparison between actual and predicted values, the model’s predictions are evaluated against the observed TBM operational parameters, particularly for data points above the defined thresholds. Per-output performance varies across the seven predicted parameters. Cutterhead rotation (ROTATION_CW) and screw-conveyor rotation (ROTATION_SC) are predicted with the lowest RMSE, reflecting their relatively constrained operational range. Face pressure (FACE_PRESSURE_EP) and total force (TOTAL_FORCE_TC) exhibit higher individual RMSE due to their wider dynamic range and stronger sensitivity to geological transitions. These per-output differences should be considered when interpreting the recommended operating ranges: parameters with lower prediction error yield tighter, more reliable recommendations, while those with higher error produce broader operating envelopes that should be treated with greater caution.
Fig. 7 present the predicted vs. actual values for each parameter together with the corresponding error metrics (MAE, MSE, RMSE), highlighting the overall prediction accuracy and indicating which parameters are estimated more reliably.
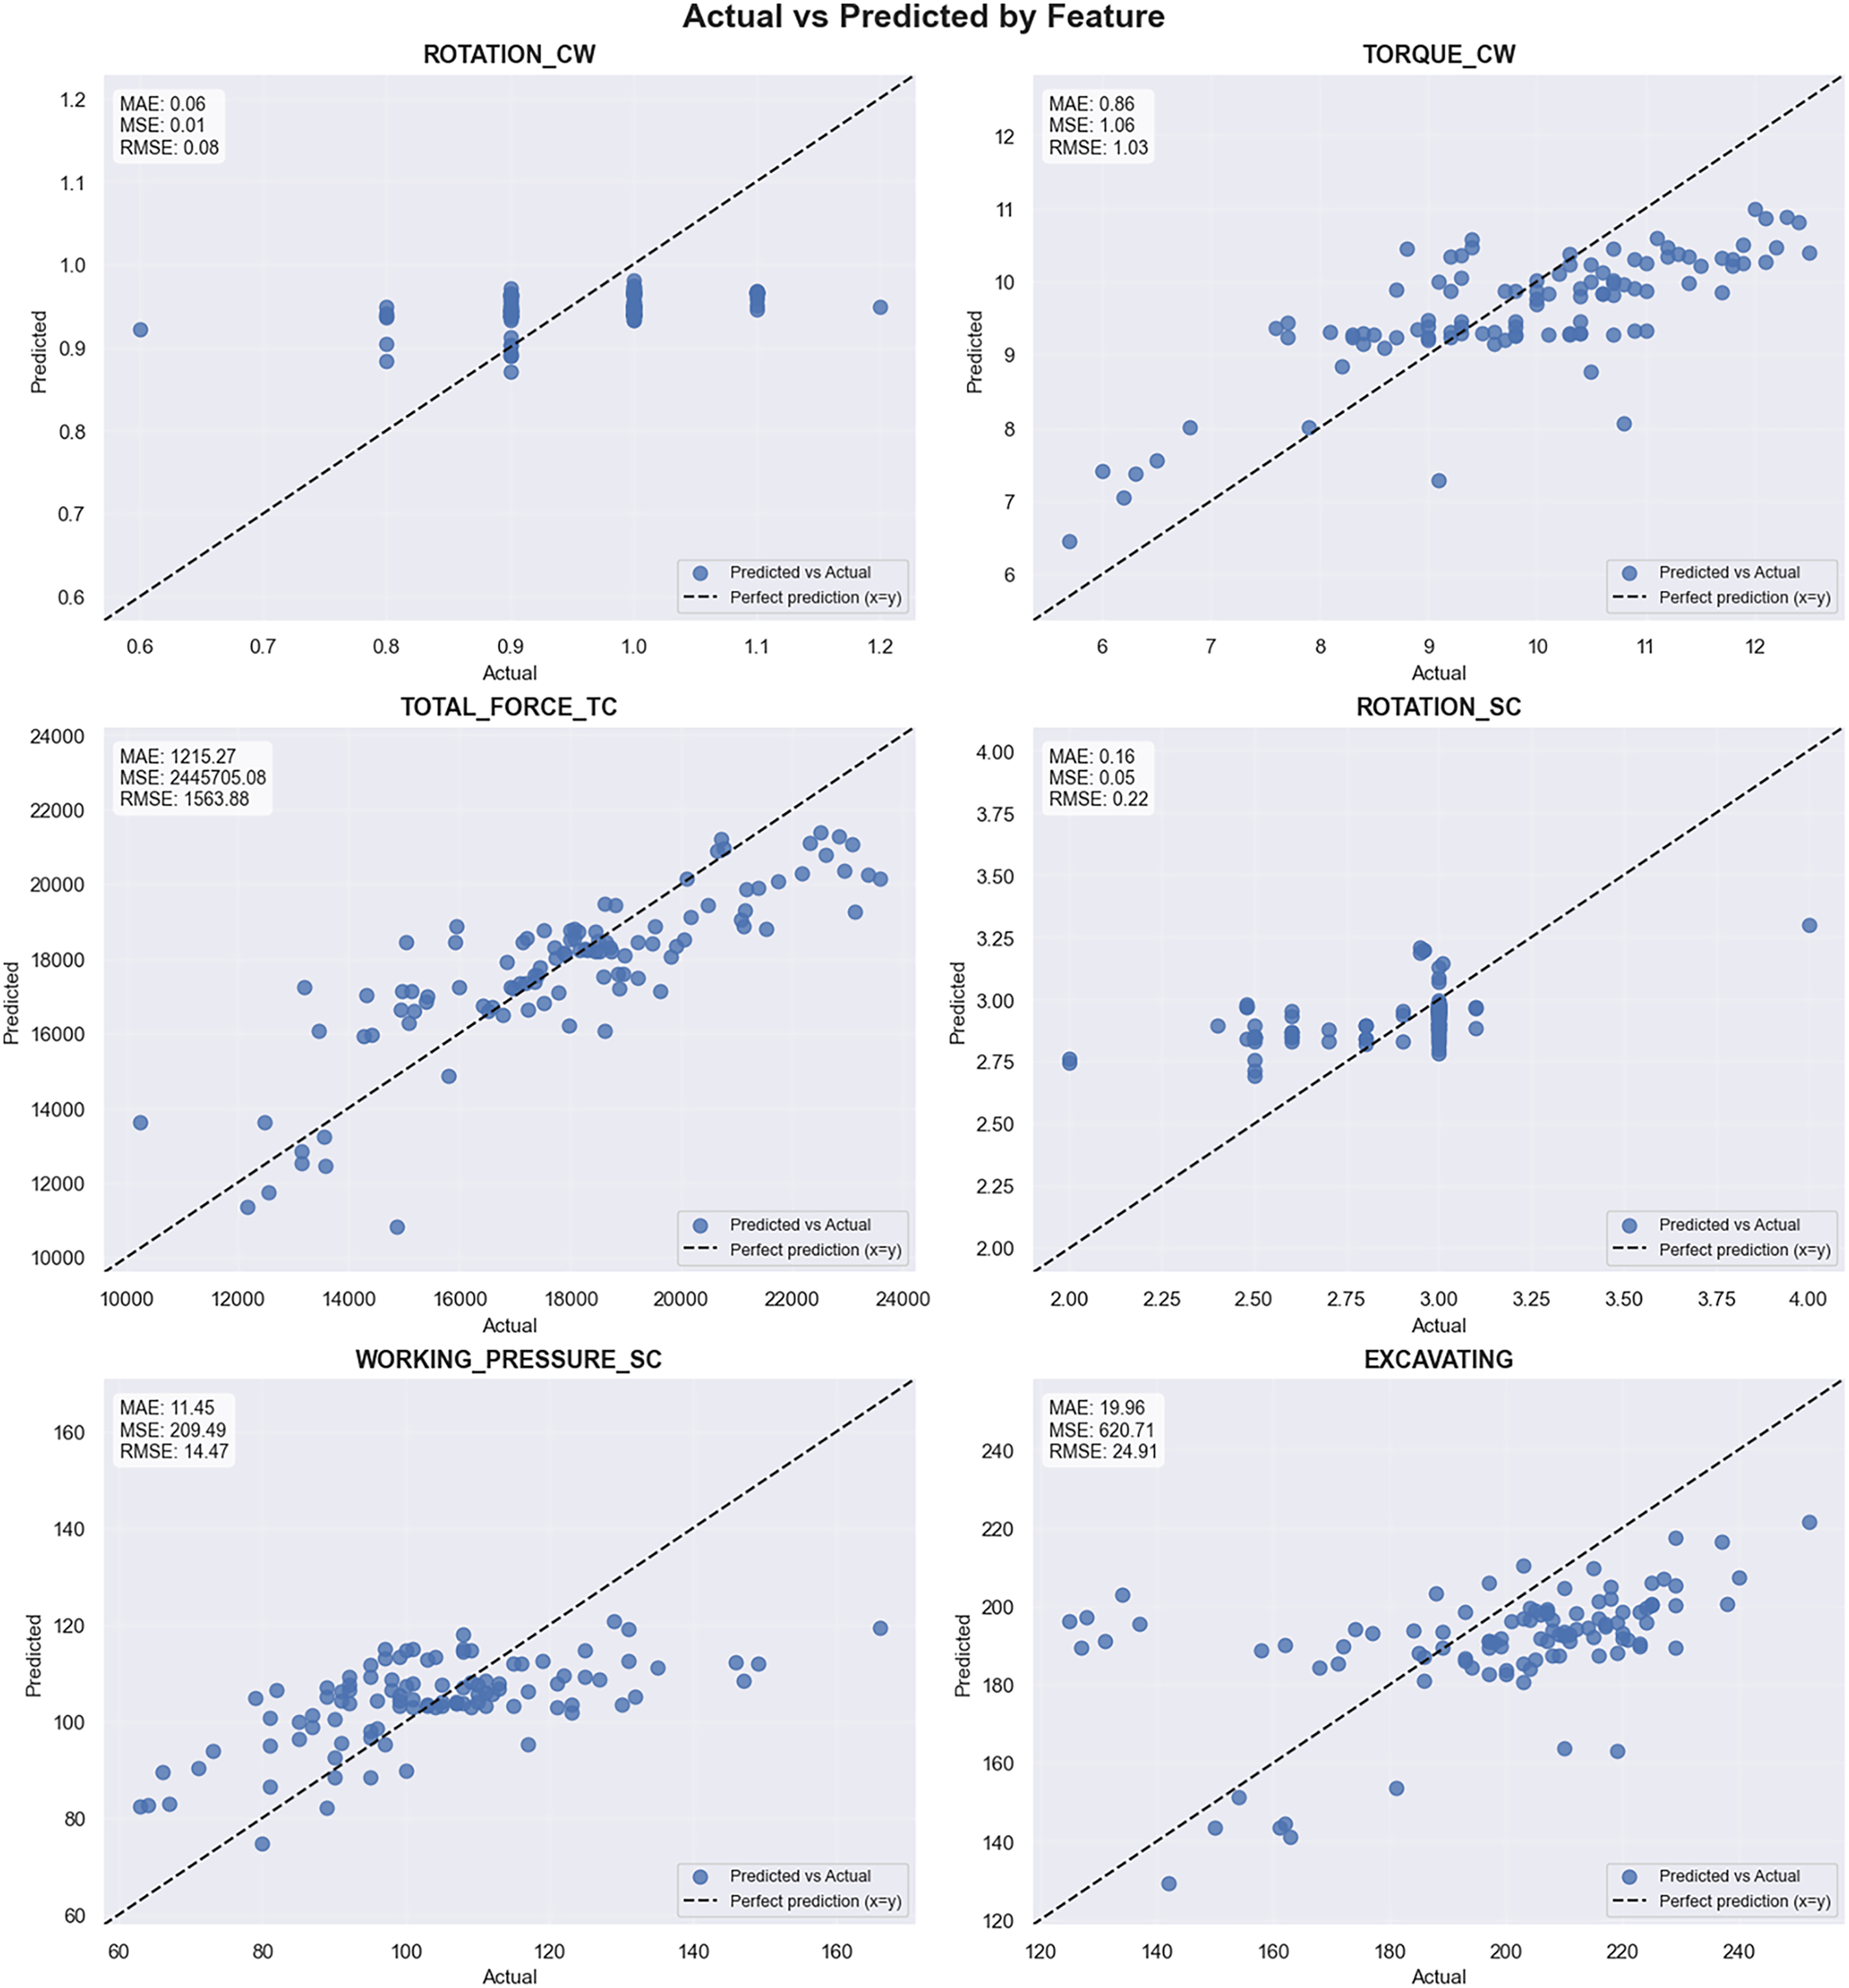
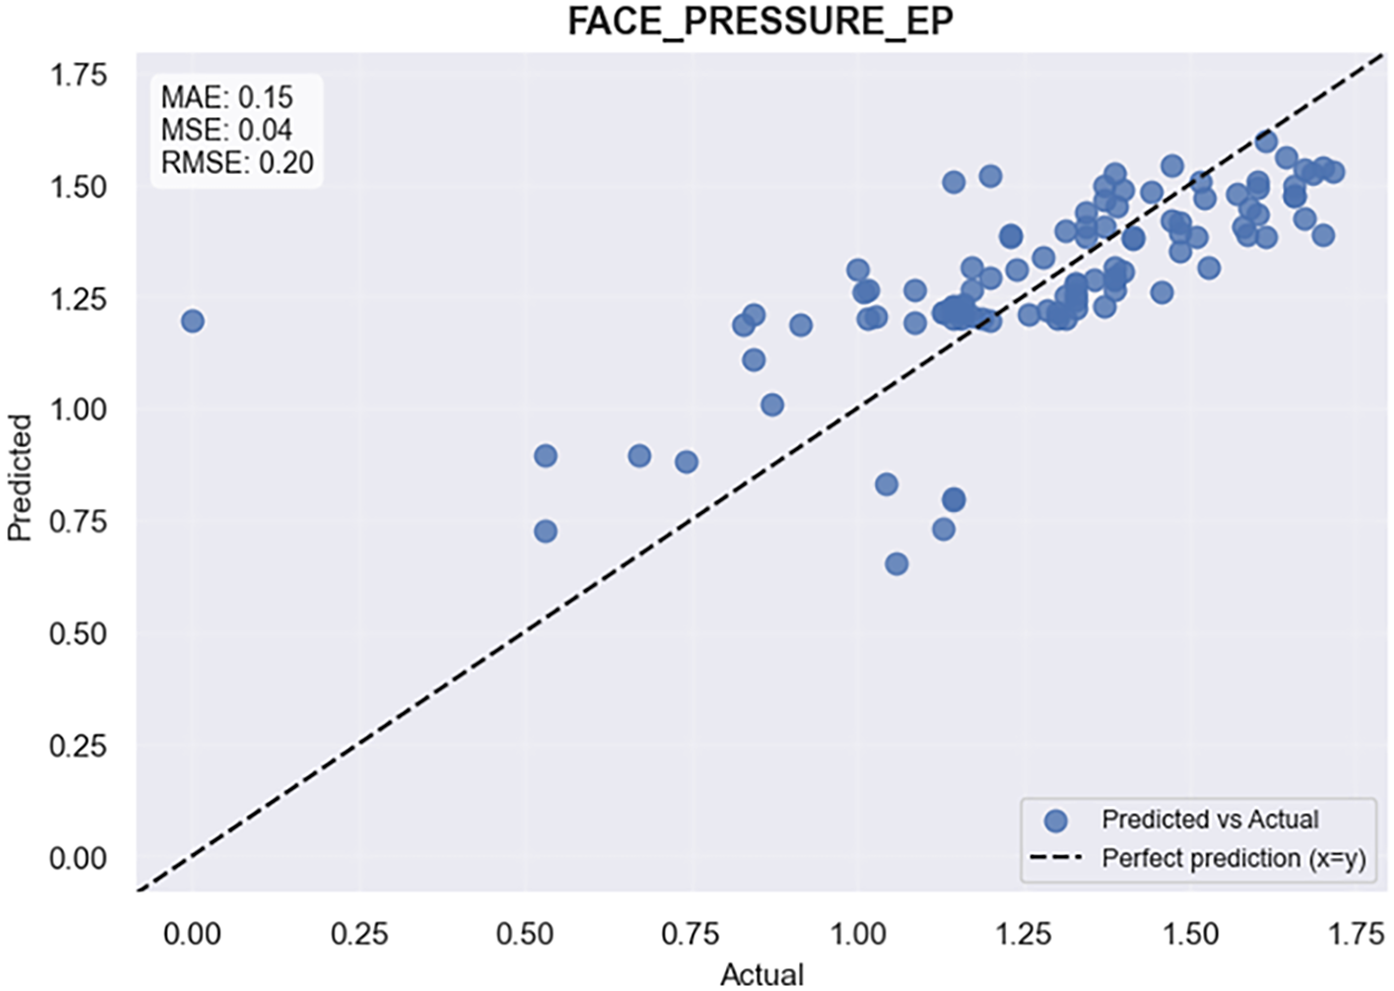
Figure 7: Comparison between actual and predicted values for selected TBM operational parameters. The dashed line represents the ideal prediction (x = y). Error metrics (MAE, MSE, RMSE) are reported for each parameter.
The next step in this workflow is to define thresholds for the two key parameters: Utilization (UTIL) and Penetration Rate (PR or SPEED_TC). To illustrate a working example, thresholds are set as: SPEED_TC > 17 and UTIL > 0.35 (Fig. 8). This combination isolates operating instances where the TBM achieved both rapid penetration and sustained productive utilization. Both values were set on two converging grounds. Empirically, they correspond to the upper portion of the observed distributions in the present dataset, where SPEED_TC and UTIL values above these levels consistently coincide with the most productive excavation segments. In addition, both values fall within the penetration-rate and utilization ranges reported as representative of efficient TBM operation in the wider tunnelling literature (e.g., Farrokh et al. [26]). These thresholds are therefore illustrative rather than fixed engineering limits: they can be adjusted by the practitioner to reflect project-specific targets, and the workflow accommodates any user-defined threshold combination.
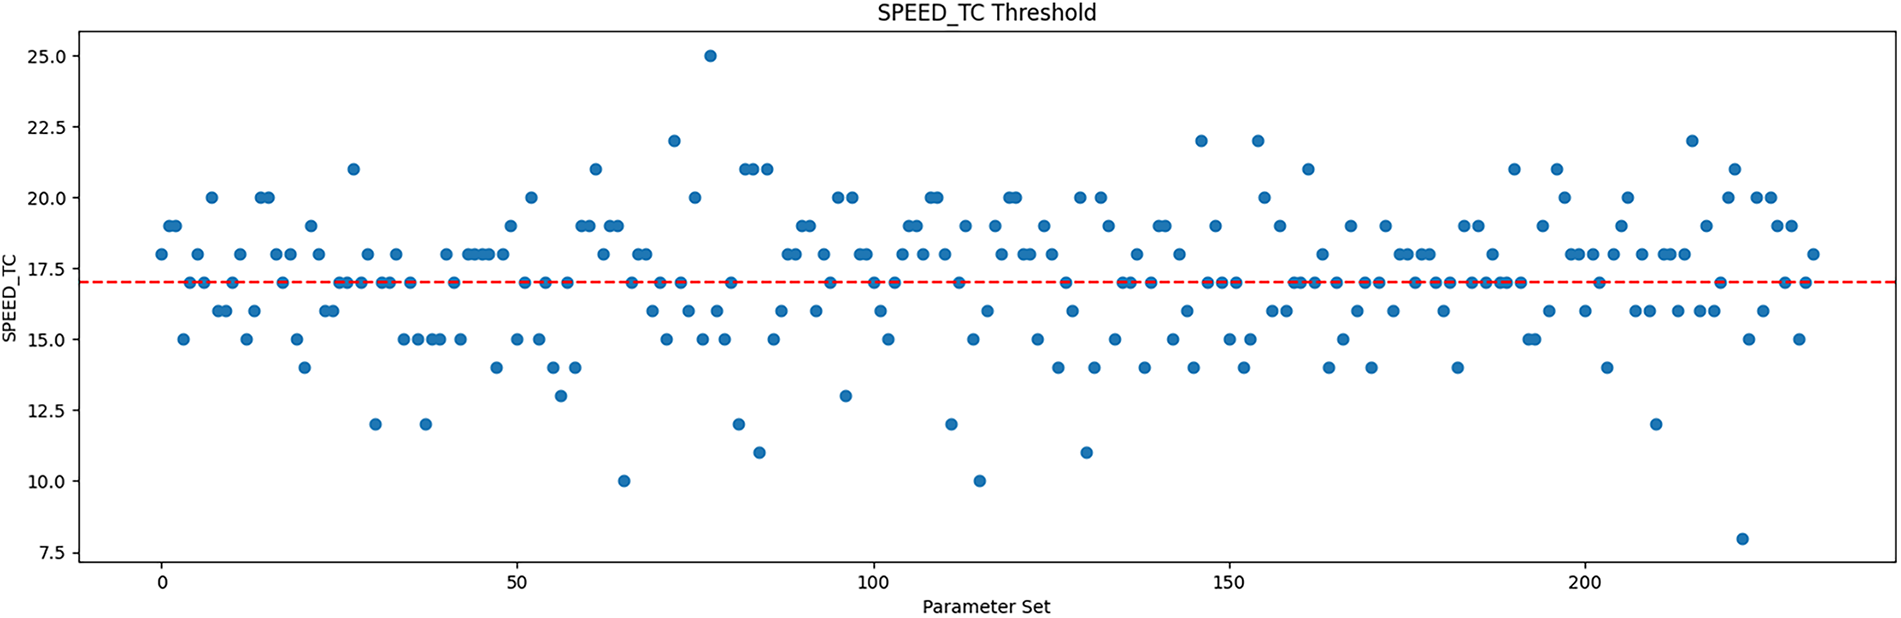
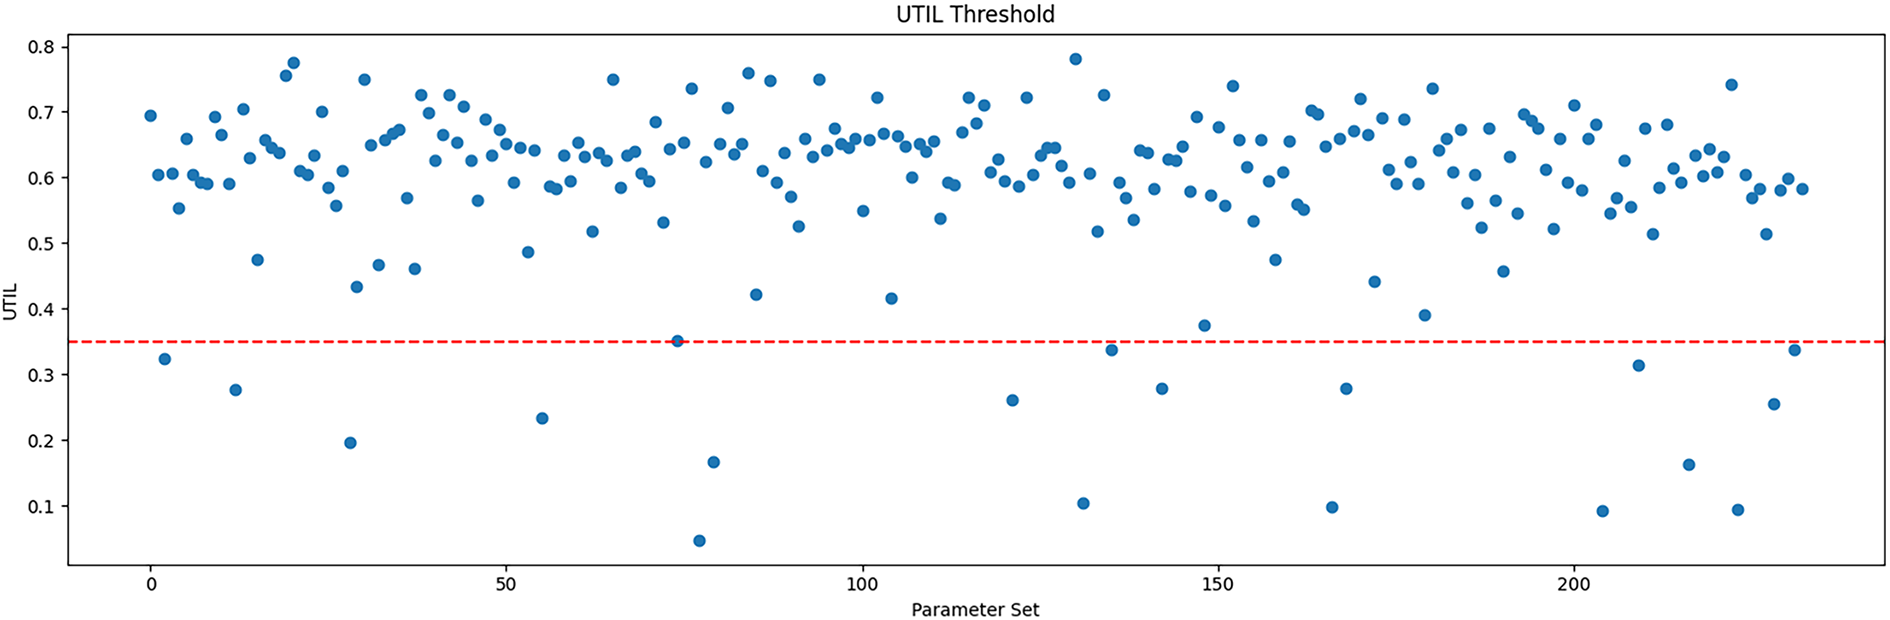
Figure 8: UTIL and SPEED_TC example thresholds.
A Pearson correlation analysis was conducted to examine relationships among both predicted and measured TBM parameters. The resulting heatmap (Fig. 9) highlights strong linear dependencies. Notably, TORQUE (CW) and TOTAL FORCE (TC) exhibit a very strong positive correlation (r ≈ 0.93), reflecting their mechanical linkage, while Working Pressure (SC) and Excavating Rate show a strong correlation (r ≈ 0.92), indicating pressure-driven performance. These correlations were computed on both the model predictions and the corresponding measured values; the close agreement between the two correlation matrices confirms that the model preserves the physical coupling structure of the TBM system rather than introducing artificial dependencies. A strong negative correlation between ROTATION (SC) and TORQUE (CW) (r ≈ −0.70) reflects the typical operational response of the cutterhead under increasing mechanical resistance.
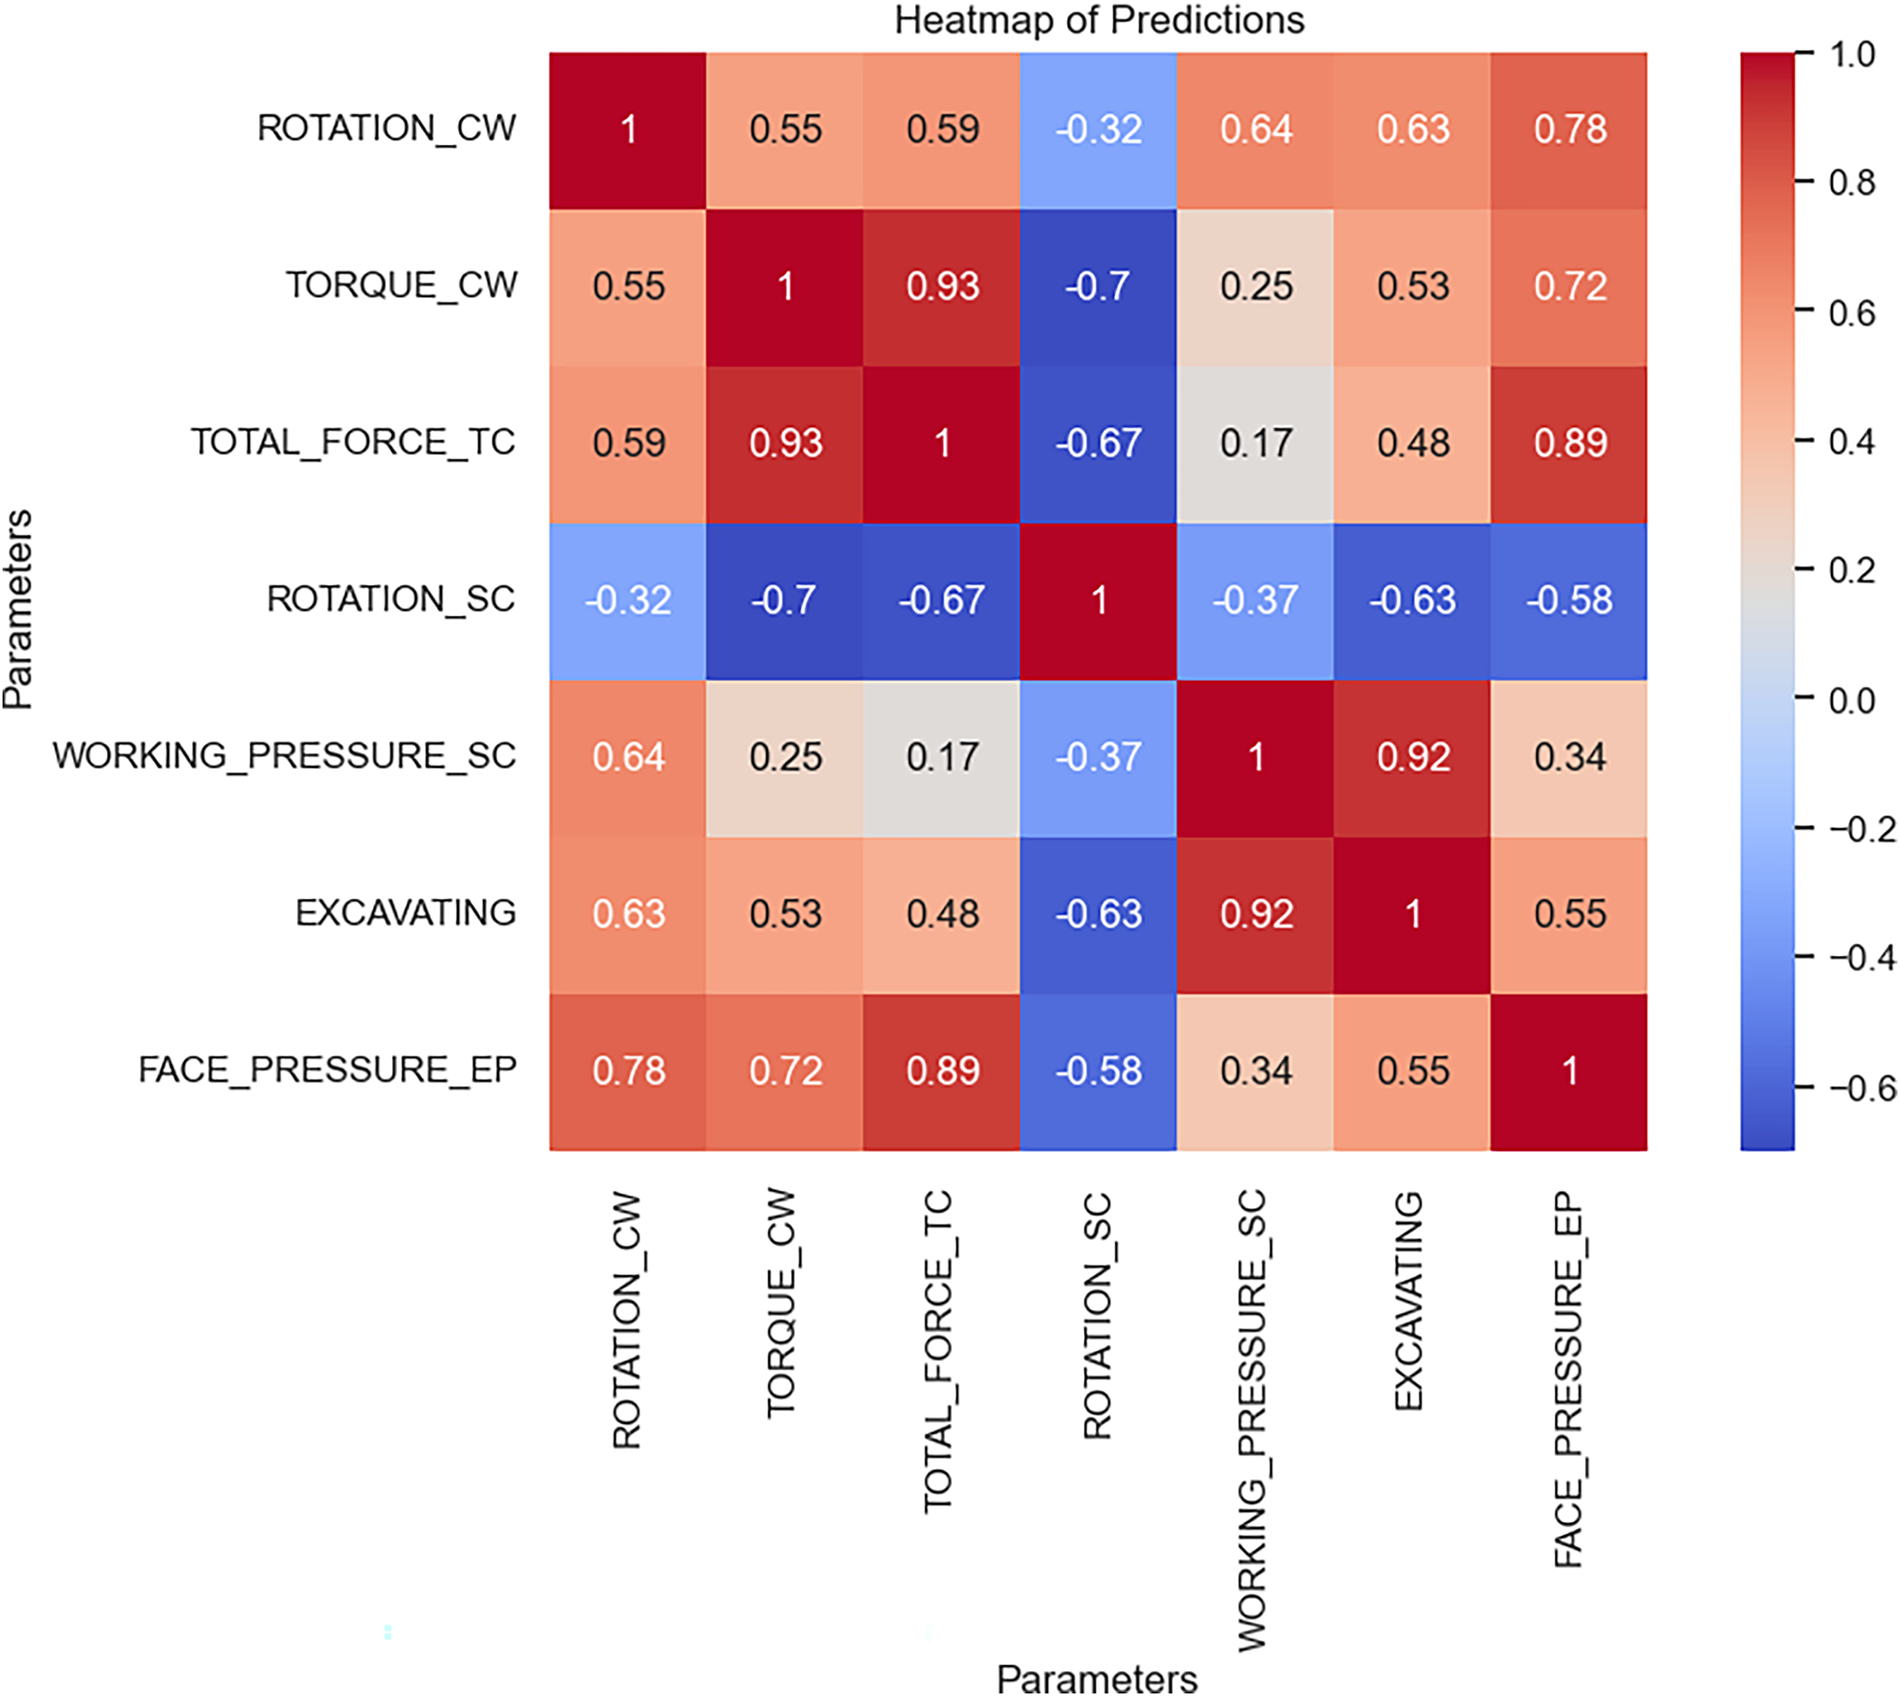
Figure 9: Correlation matrix for the TBM operational parameters.
High correlations indicate parameters that respond to similar operational conditions, making them useful for defining coherent parameter groups during the optimization process. To further highlight the most relevant relationships, Table 7 summarizes the strongest correlations identified in the heatmap.
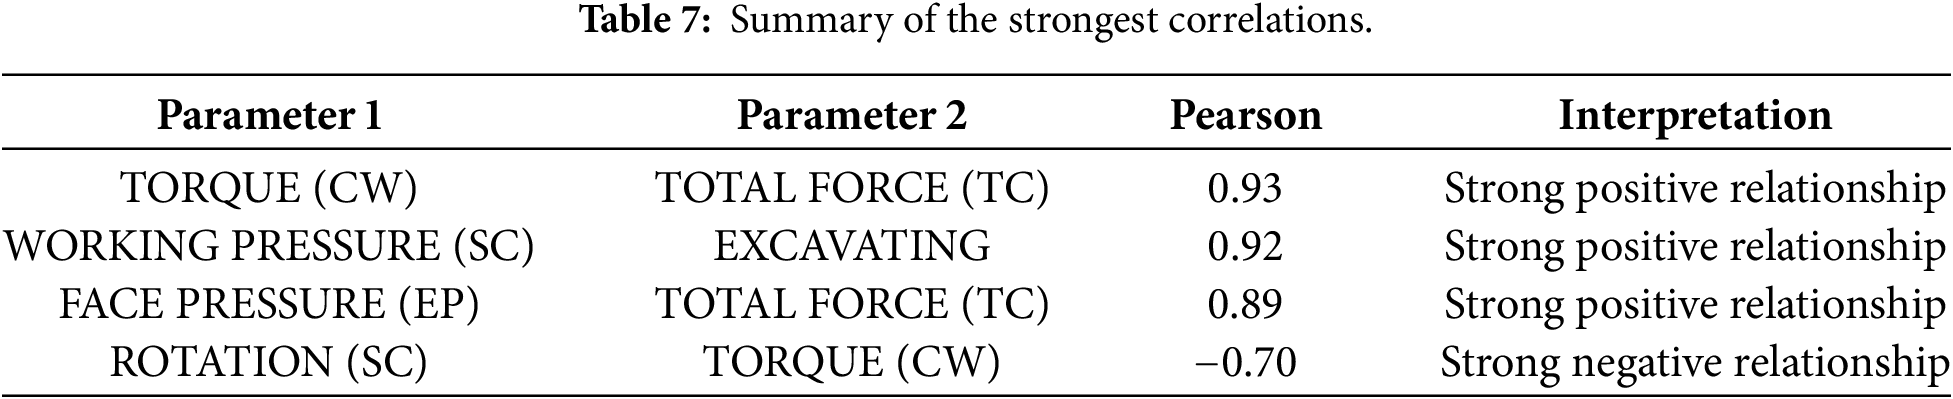
These strong correlations arise among the model’s output variables rather than among its input predictors, so they do not pose the classical multicollinearity risk associated with correlated regressors in linear models: OPT_ANN produces all seven outputs jointly from a shared representation in a single forward pass, and correlated targets of this kind typically aid rather than destabilize multi-output training, since the network can exploit their shared structure. More importantly for the parameter-regulation method itself, the recommended operating sets are not built by independently combining separately filtered per-parameter ranges; each candidate set is the full joint output vector produced by a single forward pass for a given geological and performance context, so the correlation structure among torque, thrust, and pressure is automatically preserved in every suggestion. As a result, high correlations cannot generate physically inconsistent recommendations, such as a high-torque, low-thrust combination that never co-occurs in the data; if anything, they reduce the effective number of independent control variables an operator must adjust, reinforcing the coherence of the suggested operating envelopes discussed in Section 5.
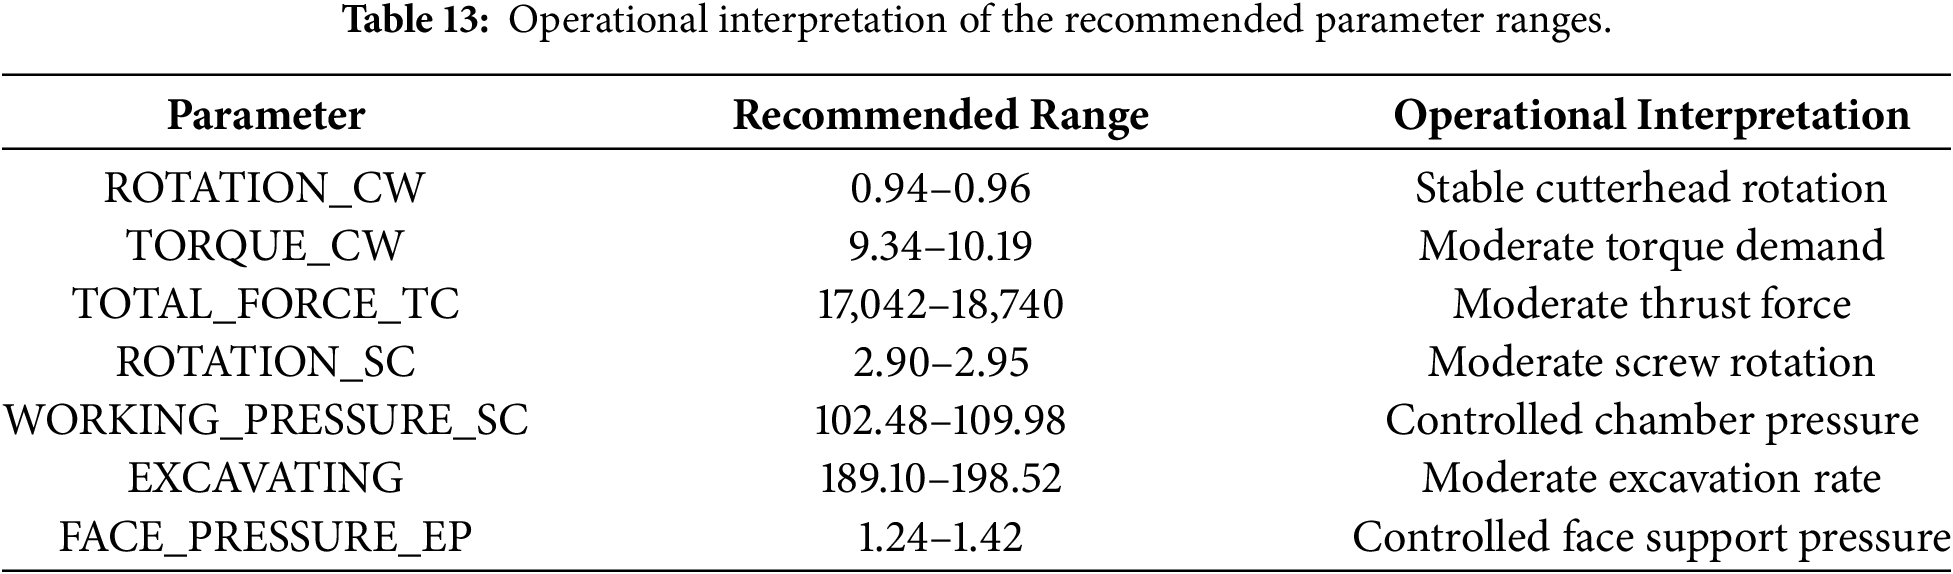
Recommended operational ranges were derived by filtering the predicted parameters using performance thresholds (SPEED_TC > 17 and UTIL > 0.35), isolating high-performance TBM conditions. Parameter distributions within this subset were analysed, and ranges were defined using the interquartile interval (25th–75th percentile) to ensure robustness against outliers (Fig. 10). The filtered subset comprises 104 records, providing a statistically meaningful sample for IQR-based range estimation. As geological and geotechnical variables were included as model inputs, the resulting ranges inherently reflect ground conditions. Therefore, these recommendations should be interpreted as context-dependent guidelines rather than universal TBM operating values.
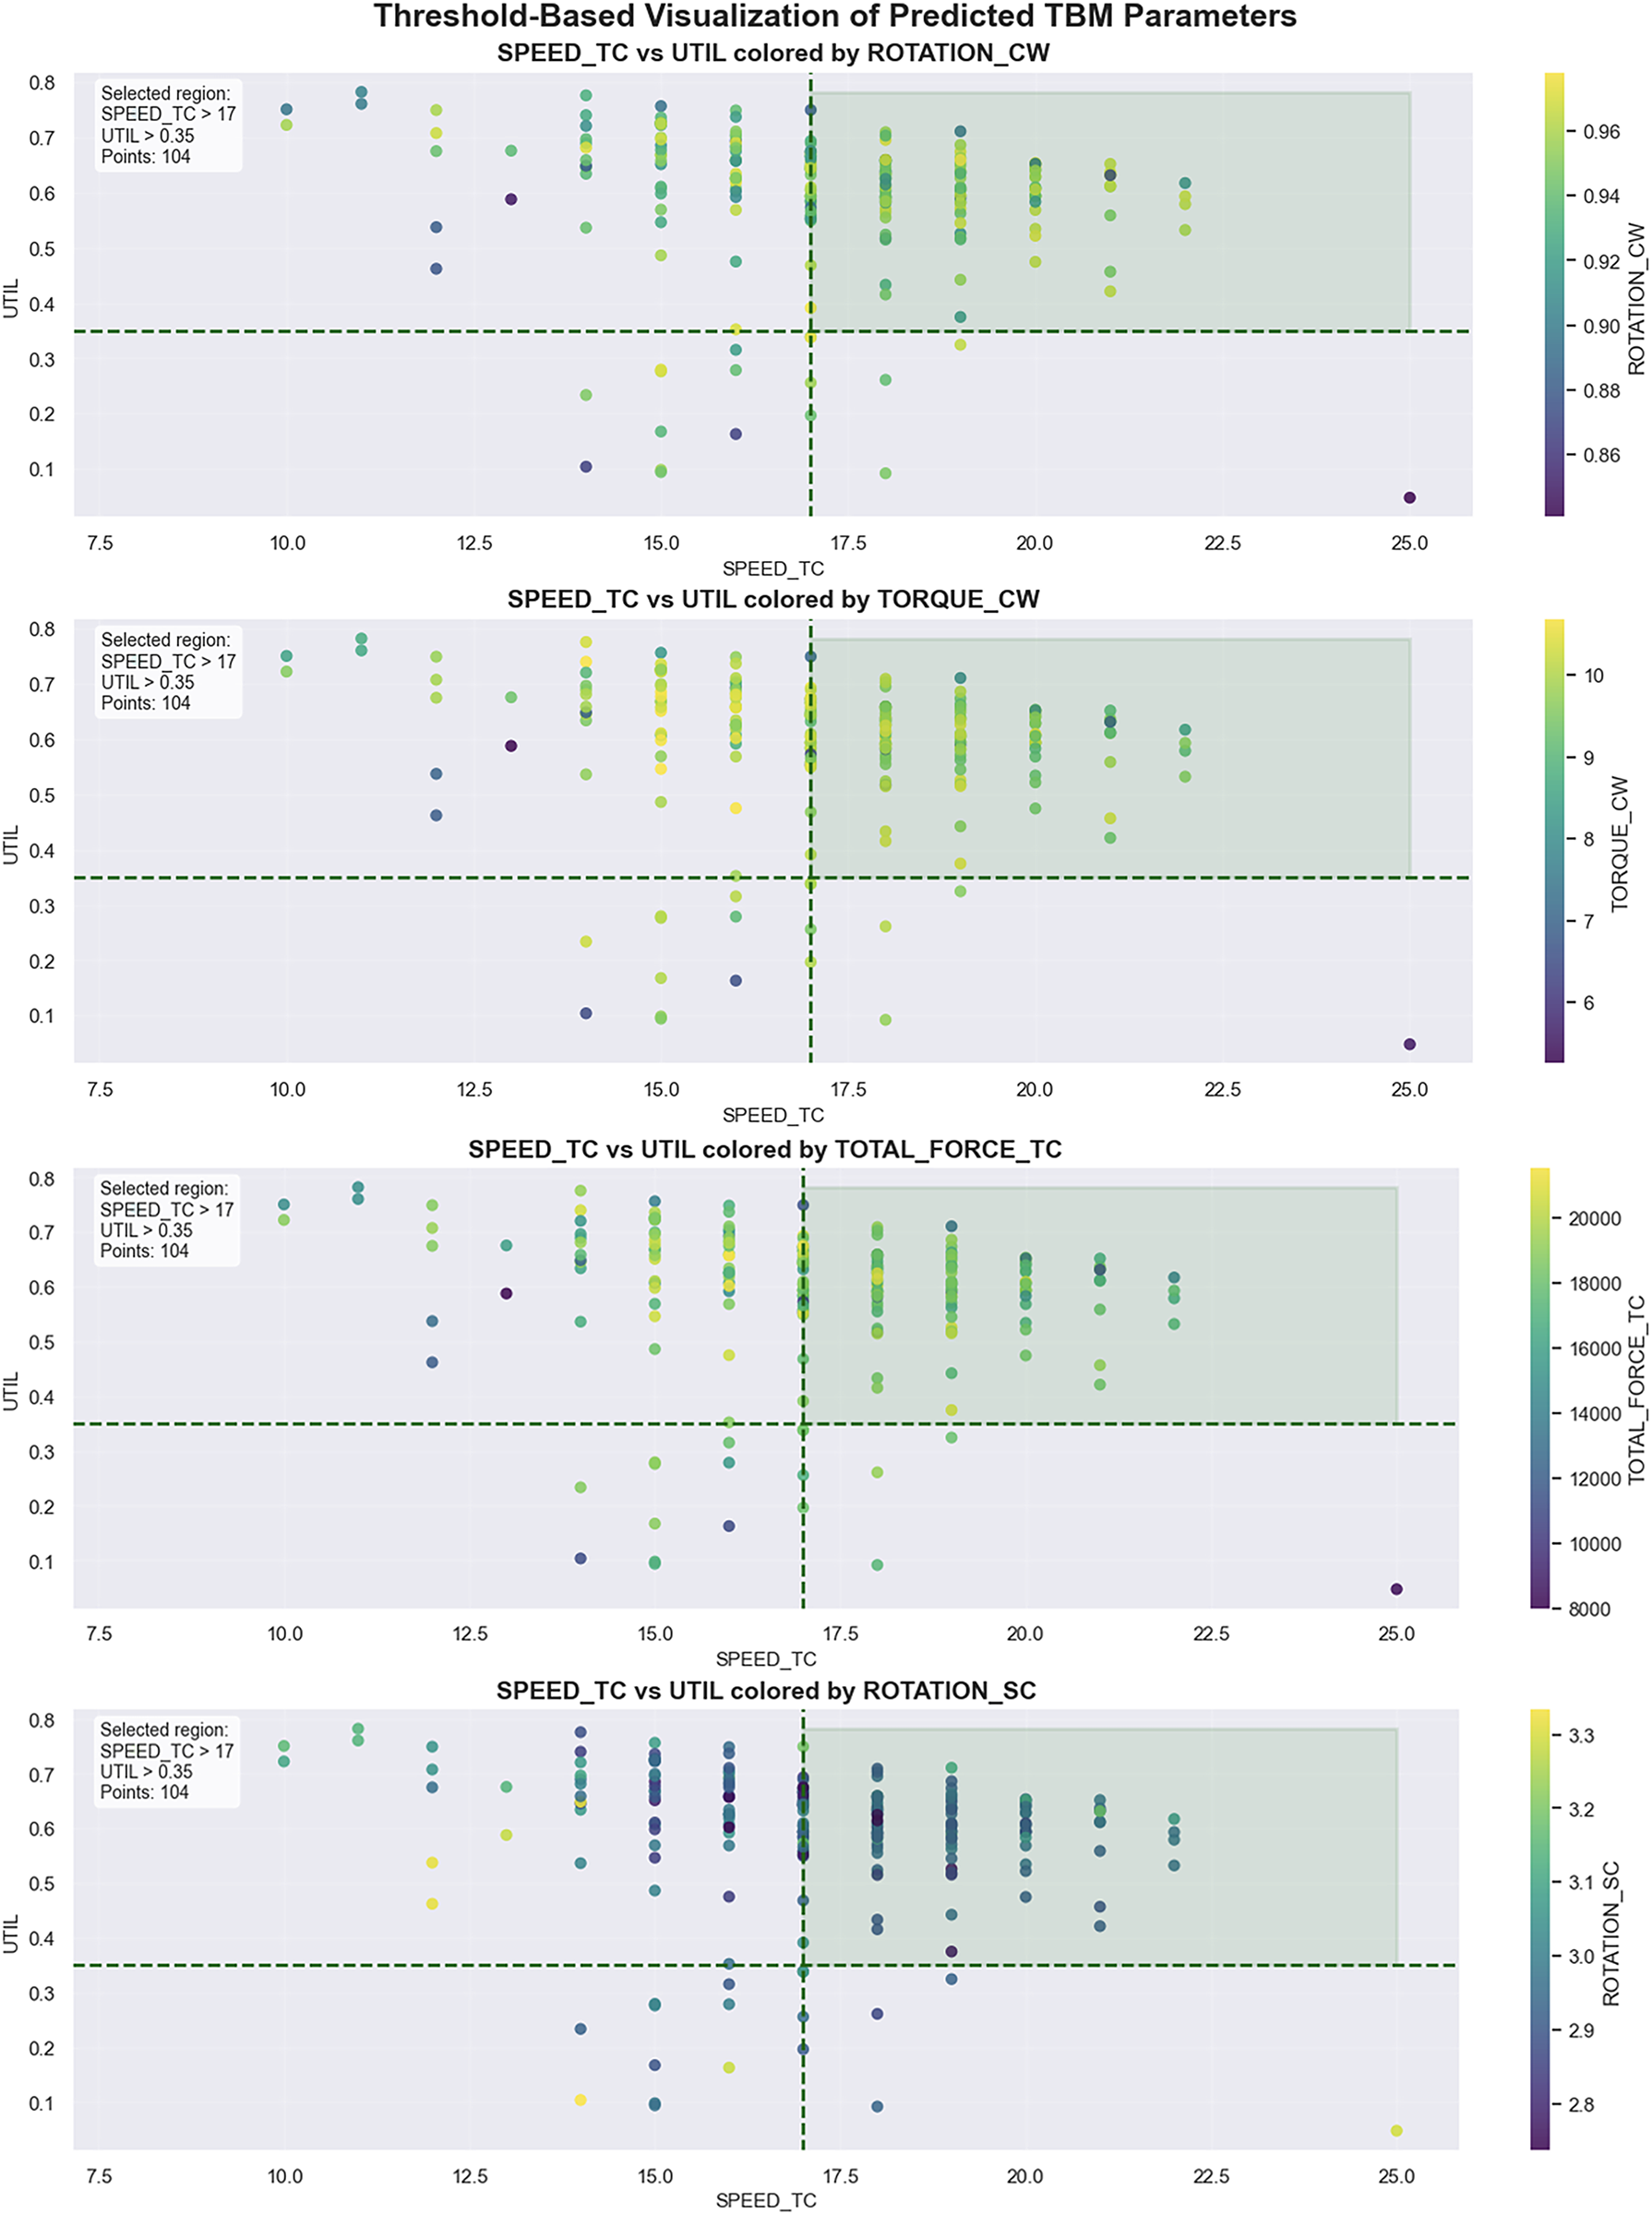
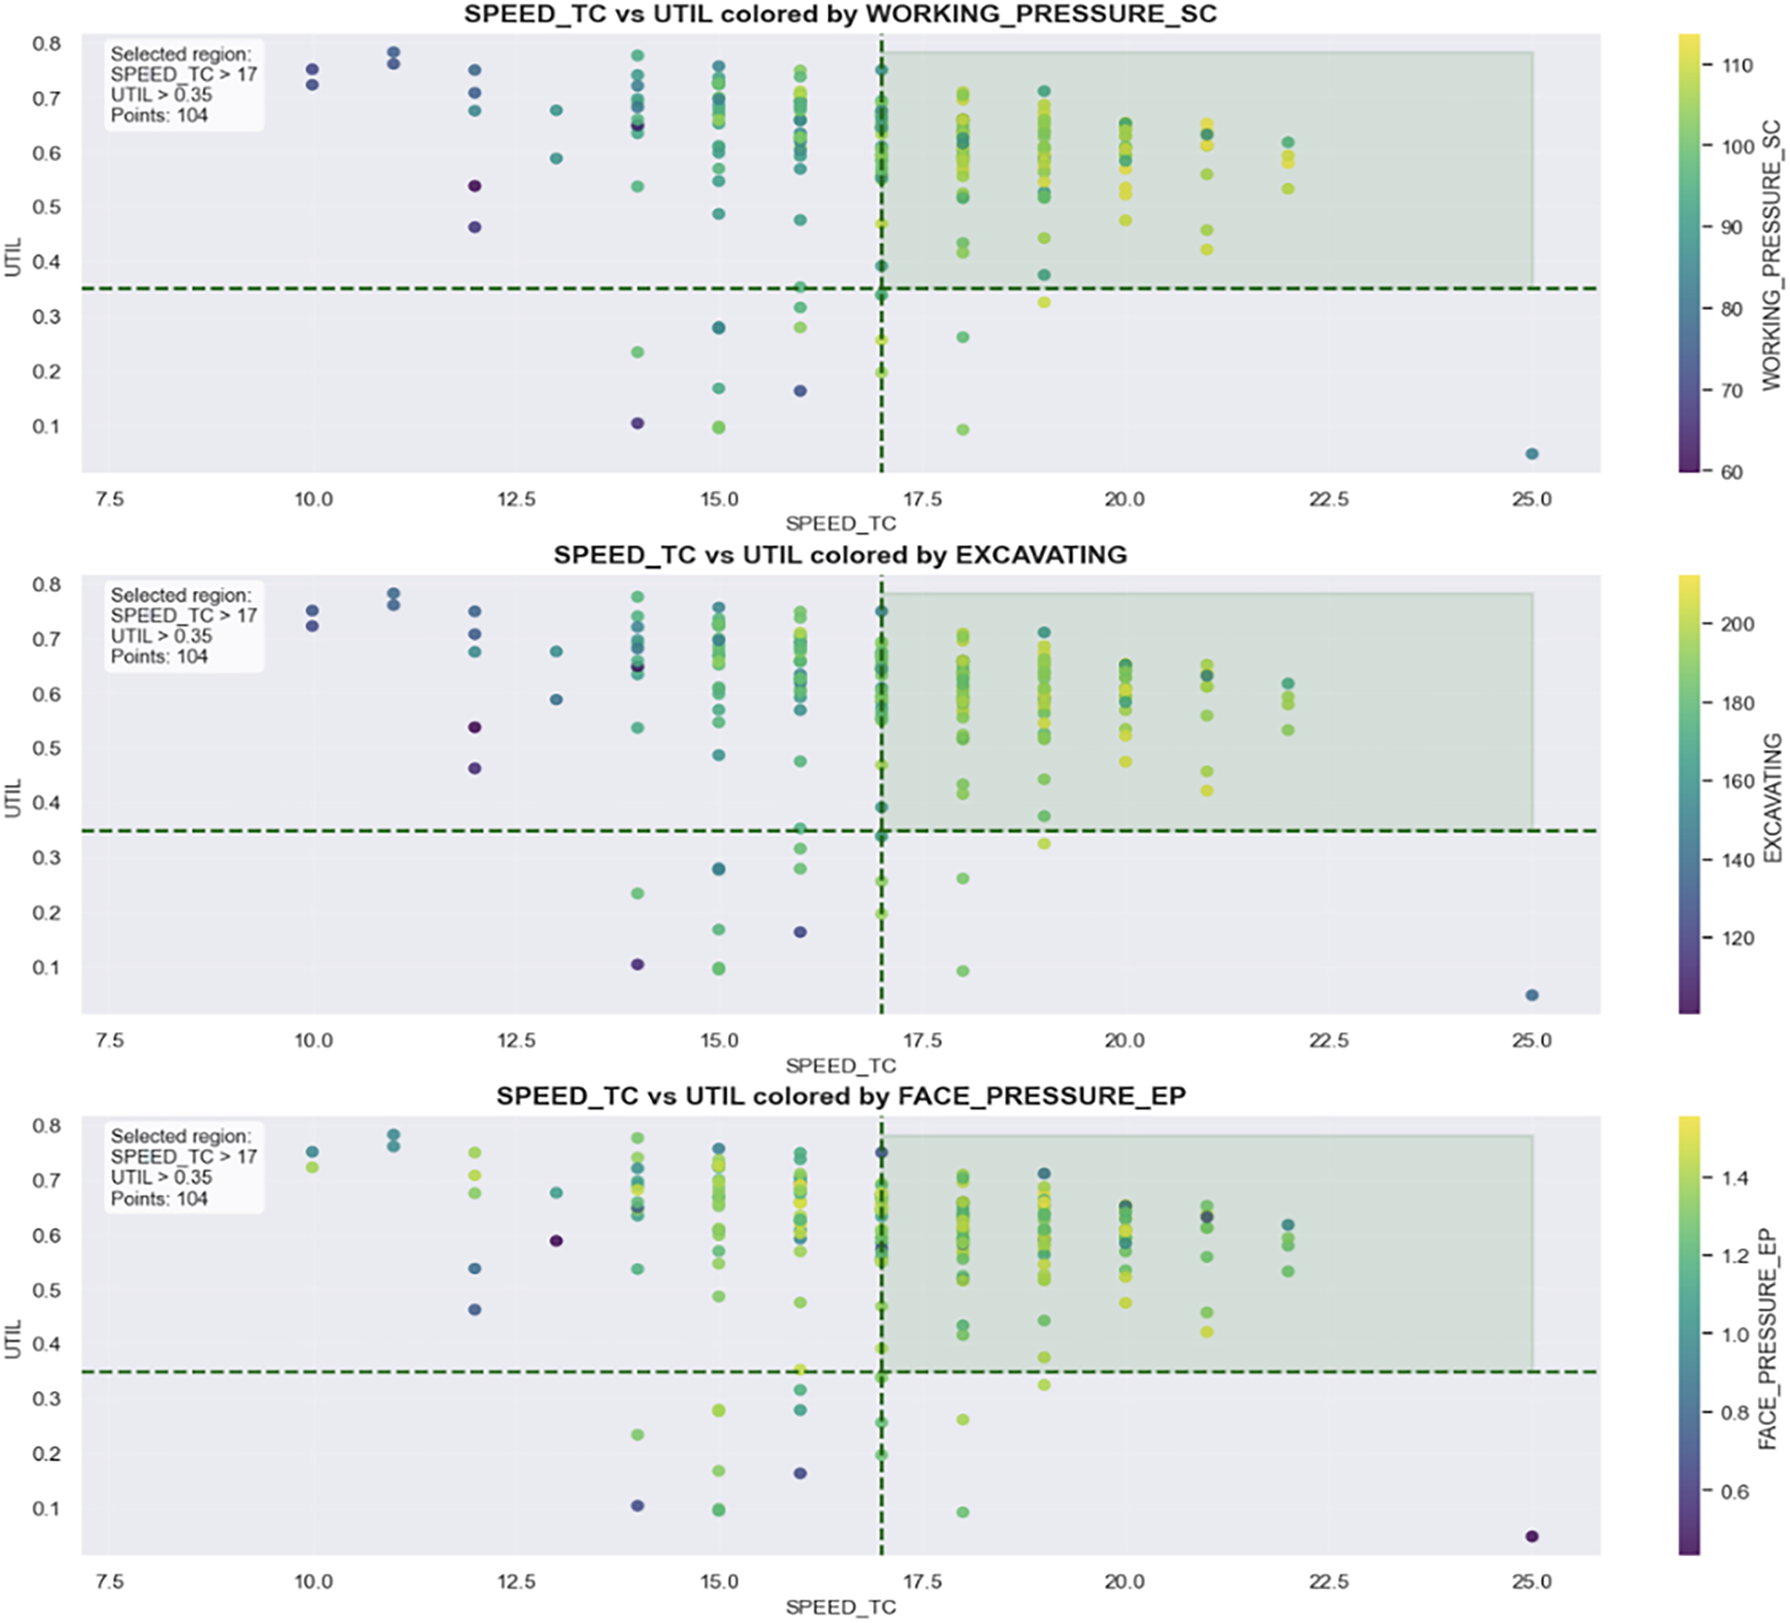
Figure 10: Threshold-based visualization of predicted TBM parameters with SPEED_TC and UTIL as performance indicators. Colors represent the magnitude of each operational parameter. The dashed lines denote the selected performance thresholds (SPEED_TC > 17 and UTIL > 0.35), while the shaded region marks the operating domain used to derive the recommended parameter ranges.
The statistical bounds (Table 8) and recommended operational ranges were derived from this filtered operating region by the performance thresholds (SPEED_TC > 17 and UTIL > 0.35). Descriptive statistics (minimum, quartiles, maximum, mean, and standard deviation) were computed for the predicted parameters within this high-performance regime. The interquartile range (25th–75th percentile) was used to define representative operational ranges, providing robust estimates while minimizing the influence of outliers.
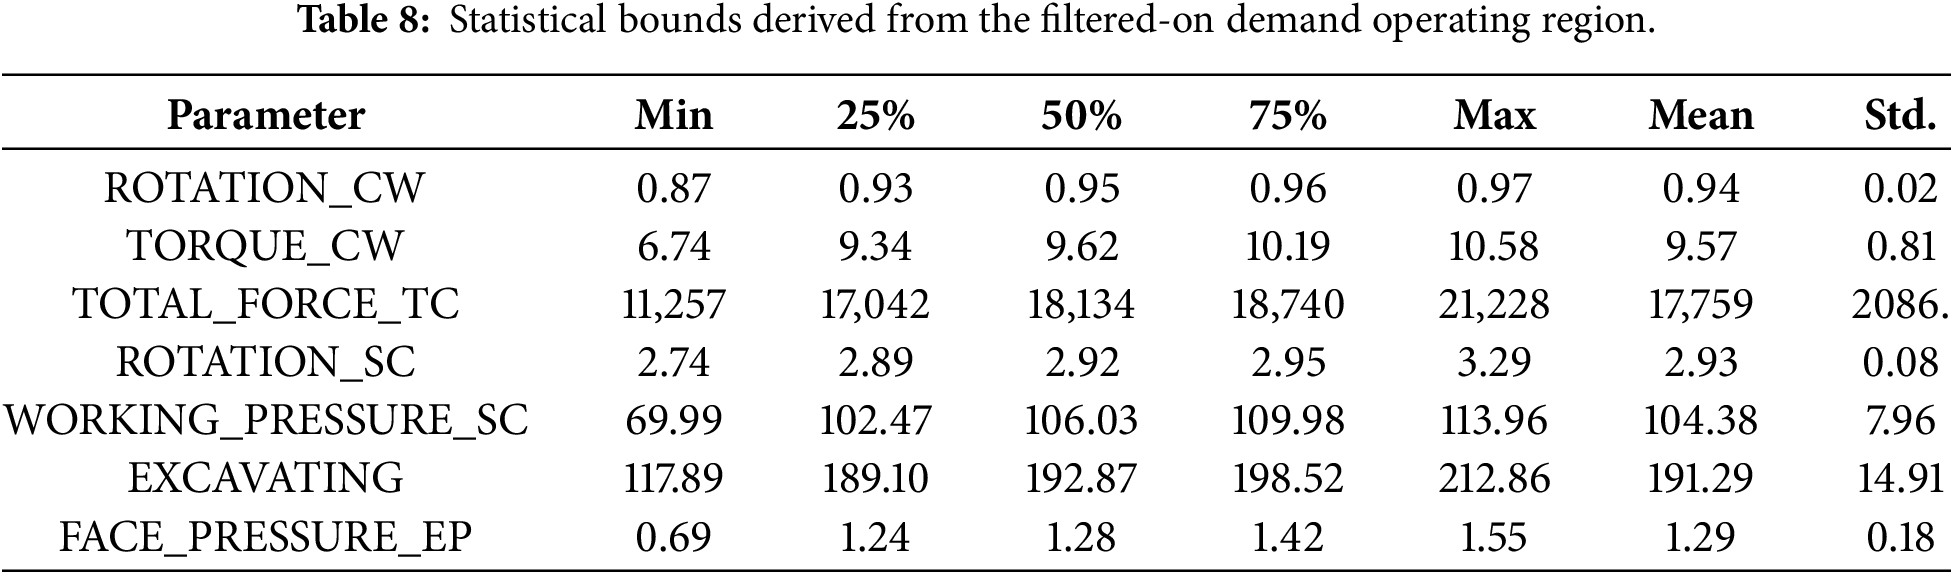
Based on these statistical bounds, recommended operational ranges were defined using the interquartile interval for each parameter (Table 9). This approach captures the most representative operating conditions within the selected performance region, avoiding the influence of outliers. The resulting ranges reflect parameter combinations commonly associated with TBM performance in the analysed dataset.

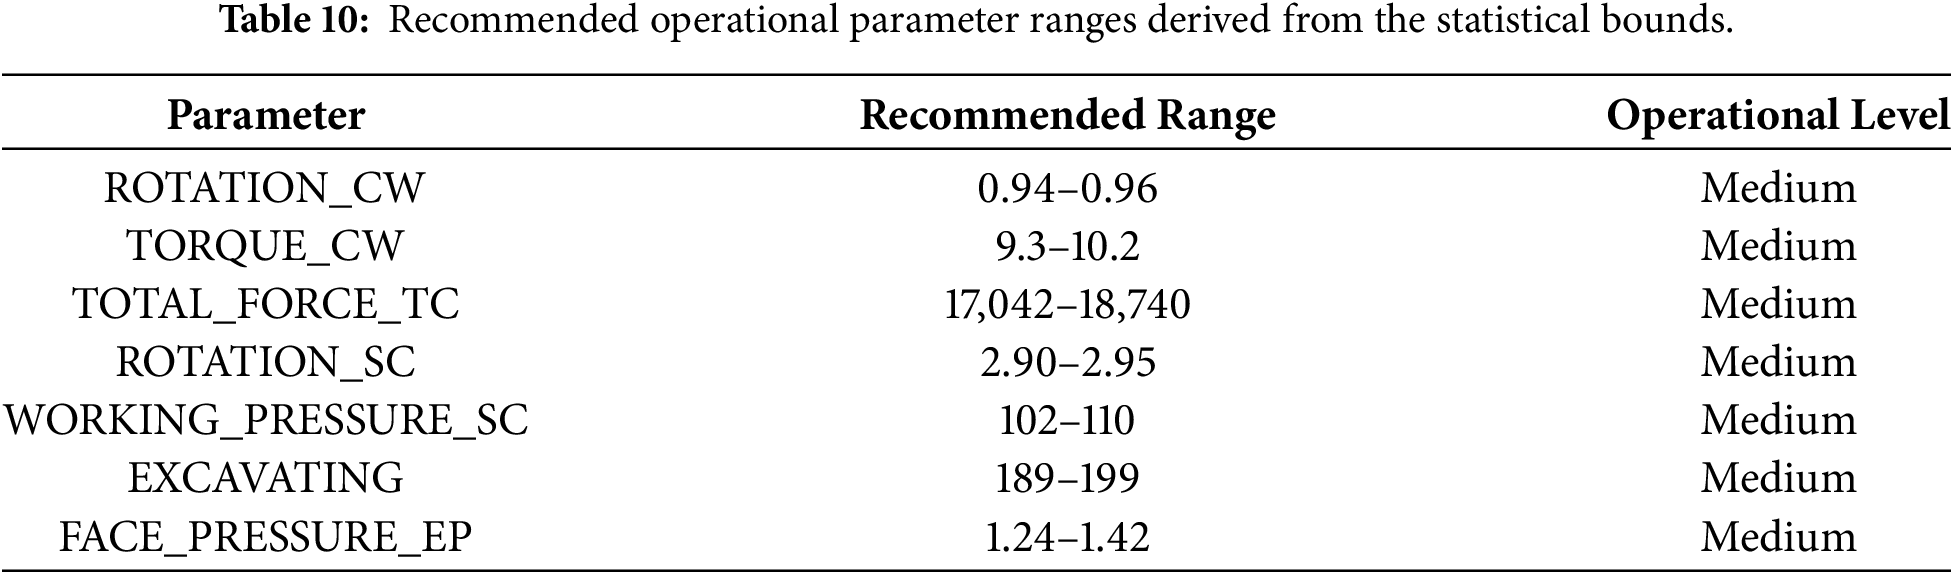
To enhance interpretability, the recommended ranges were mapped to qualitative levels (low, medium, high) based on their distribution within the dataset. Every parameter in Table 10 is classified as Medium; this is an expected consequence of the classification rule rather than a coincidental result. Because the recommended ranges are themselves derived as the interquartile interval (25th–75th percentile) of the filtered high-performance subset, and this same interval defines the Medium band in Table 9, any range constructed this way necessarily falls within the Medium classification by definition. This also carries a meaningful engineering interpretation: achieving the target performance thresholds is associated with balanced, moderate control settings across all seven parameters, rather than requiring any parameter to be pushed to a statistical extreme.
Following this process, the operational interpretation column was introduced to further contextualize the recommended parameter ranges by describing the expected machine behaviour associated with each parameter level. After establishing the general physical meaning of the TBM operational parameters (Table 11) it becomes possible to translate the statistically derived ranges into realistic operational scenarios. These interpretations (Table 12) provide a physical explanation of the parameter ranges and enable the formulation of rule-based descriptions that can be incorporated automatically into the workflow.
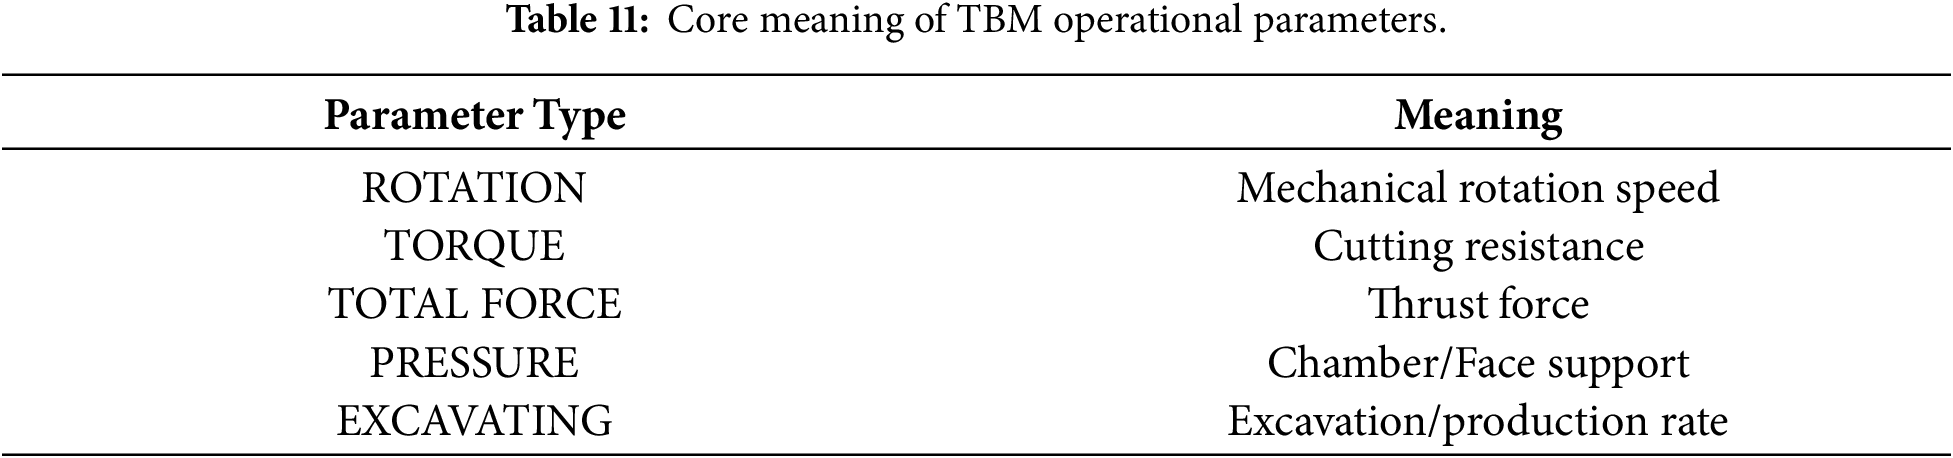
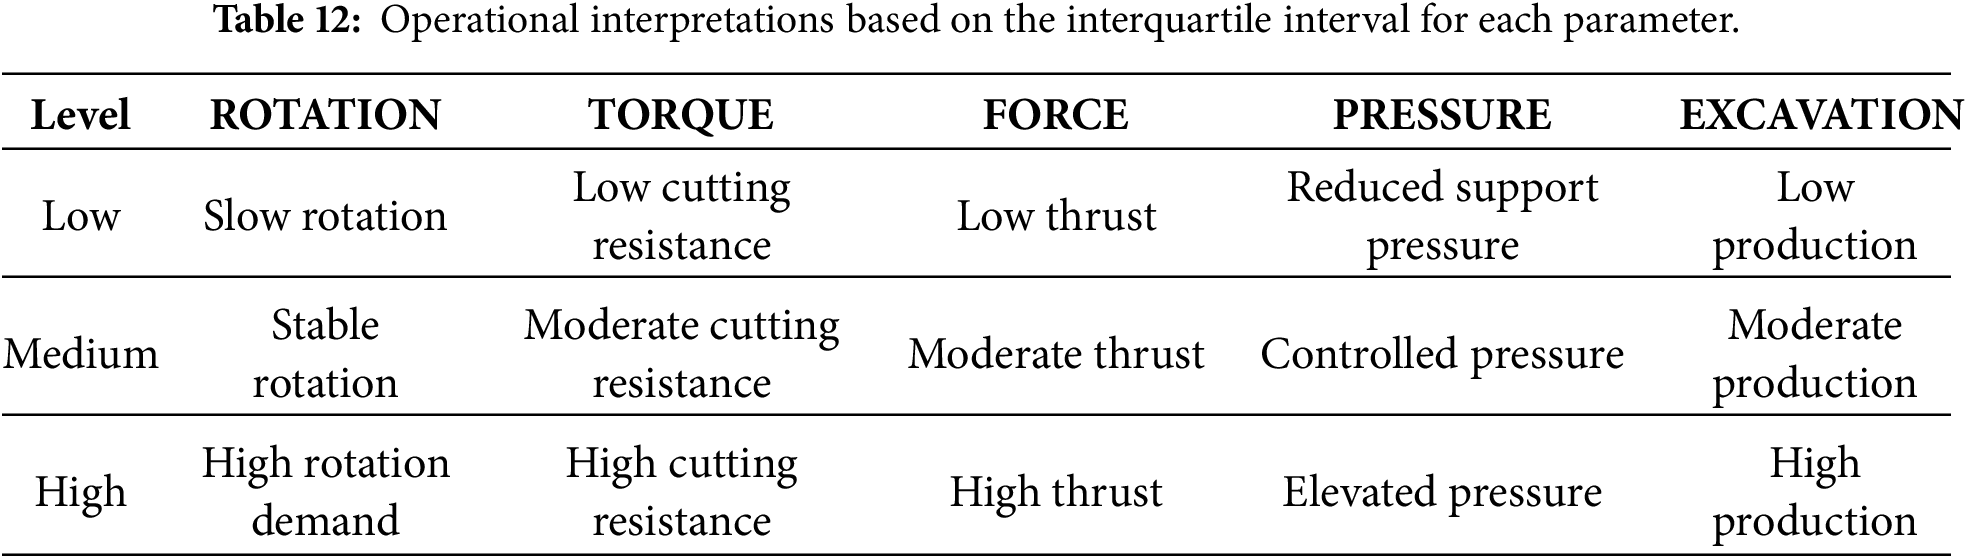
For example, high torque and thrust values reflect strong cutting engagement and material resistance, whereas moderate rotation speeds suggest stable mechanical loading of the cutterhead. Similarly, elevated working pressures and controlled face pressures indicate balanced ground support conditions necessary for maintaining tunnel face stability during excavation.
Taken together, the statistical bounds and their operational interpretations are incorporated into the workflow as rule-based elements, resulting in an engineering-oriented table that translates the model predictions into actionable TBM operating guidelines for the thresholds set in this working example of the workflow (Table 13).
This work treats optimization as prediction-guided selection rather than a separate numerical routine. The adopted approach belongs to a family of co-occurrence surrogate methods in which the performance targets (PR, UTIL) are embedded as conditioning inputs rather than treated as optimization objectives in a separate loop. Because the model learns statistical association rather than causal structure (Section 5.1), the resulting configurations should be read as historically associated with the target performance, not as settings guaranteed to reproduce it. This design choice reflects the practical reality of TBM operation: operators do not seek a single mathematical optimum but rather a portfolio of feasible configurations from which they select according to local priorities, machine constraints, and ground-condition confidence. The conditioning approach generates this portfolio in a single forward pass, making it computationally lightweight and a promising candidate for near-real-time use, pending the additional validation and uncertainty quantification discussed in Section 5.1.
Operating goals are expressed as thresholds on performance variables; the trained models generate candidate settings, which are then filtered and grouped against those thresholds and basic constraints. A correlation analysis helps minimize redundant controls, and 3-D response maps, placing PR and UTIL on the axes and each operating parameter as the third dimension, make the trade-offs explicit, revealing regimes (e.g., high-UTIL/low-PR, high-PR/balanced, conservative) from which engineers can select according to project priorities. This approach yields a shortlist of candidate settings tied to clear objectives, intended to support engineering judgment rather than to prescribe deployment-ready configurations, keeps intent transparent (thresholds and plots show why a set is suggested), and is lightweight enough to be attractive for near-real-time use once the validation steps outlined in Section 5.1 (broader datasets, uncertainty quantification, mechanical-bound checks) are carried out.
Because predictions are conditioned on the full geotechnical context, the recommendations are inherently site specific (Athens Metro Line 2 extension towards Elliniko), and, having been calibrated on a single project (Section 5.1), their transfer to other geological settings or TBM types remains untested. The procedure also surfaces engineering trade-offs: sustained high utilization can depress penetration; a moderate-UTIL, high-PR band often marks the practical productivity “sweet spot”; conservative settings remain available when wear reduction or challenging strata dominate.
5.1 Limitations and Future Directions
Several limitations should be noted. First, the conditioning approach learns statistical co-occurrence patterns rather than causal relationships; recommended parameters are those historically associated with the target performance, not settings guaranteed to reproduce it in new ground. Second, the model is calibrated on a single project (∼1624 m of EPB tunnelling in the Athens geological context); generalization to other geological settings, TBM types, or operating cultures has not been tested. Third, the cyclical time features (DAY_SIN, DAY_COS) capture real crew-shift and operator-behaviour variance, which improves accuracy but also means recommendations are not purely geomechanically determined and can vary with time of day; pooling predictions into ranges (Table 9) partly offsets this, but a dedicated recommendation mode that marginalizes over the diurnal cycle would remove it entirely. Fourth, since dropout is deactivated at inference, uncertainty quantification is limited to distributional similarity (Wasserstein distance) between deterministic point predictions; formal intervals via ensembles or Monte Carlo dropout would strengthen decision support. Fifth, threshold-based filtering is discrete and does not guarantee global optimality; Pareto-front or preference-curve filtering, would better capture multi-objective trade-offs. Sixth, spatial autocorrelation between adjacent rings means the train/test split may give optimistic generalization estimates; chainage-blocked or leave-one-interval-out cross-validation would be more conservative. Seventh, boxplot-based outlier screening cannot guarantee removal of all extreme values; a systematic comparison against robust scaling methods (e.g., Robust Scaler) would help quantify their effect on training. Eighth, because the inverse mapping may not be single-valued, an MSE-trained network could in principle blend genuinely distinct, individually valid parameter combinations into an unrepresentative point; rich conditioning and the strong inter-output correlation observed (Section 4) constrain this risk, and reported ranges (Table 9) partly reflect it, but explicit multi-modal modelling (e.g., mixture density networks, quantile regression) would address it more rigorously. Ninth, the unconstrained MSE loss does not embed known mechanical bounds (torque, thrust, face-pressure limits); no single validated mechanistic model exists for this coupled system (Section 2.1), so feasibility is currently checked post hoc against the manufacturer’s operating envelope rather than during training. Augmenting the loss with soft penalty terms for these bounds is a tractable next step, particularly given the framework’s role as a decision-support tool for engineer review rather than an autonomous controller. Tenth, as with any supervised model, OPT_ANN cannot reliably extrapolate to geological anomalies (e.g., karst features, boulders, unmapped faults) absent from the ∼1100-ring training set, and has no built-in mechanism to flag such out-of-distribution inputs; explicit novelty detection (e.g., input-space distance, ensemble disagreement, conformal prediction) is identified as future work. Finally, recommended ranges should be validated against the EPB manufacturer’s operating envelope (torque limits, maximum thrust, allowable face pressure) to ensure that they fall within safe mechanical bounds before field deployment.
This study contributes to the development of an integrated data-driven framework for TBM performance prediction, interpretation, and operational assessment. Although ML has already been applied in tunnelling, this work combines predictive modelling, interpretability, and operational evaluation within a consistent workflow.
Rather than predicting a single performance indicator, the OPT_ANN model maps geological context and target performance (PR, UTIL) jointly to seven coupled operational control parameters in a single forward pass, directly supporting the inverse, co-occurrence-based conditioning approach described in Section 3.6. Interpretability is supported through Pearson correlation analysis among the predicted parameters (Section 4), which clarifies how the outputs co-vary, and through permutation-based feature importance (Section 3.4), which identifies the geological and operational drivers of the model’s predictions.
The framework further extends beyond conventional point prediction by translating performance targets directly into practical operating guidance: threshold-based filtering (Section 3.6, Steps 4–6) converts raw model outputs into recommended operational parameter ranges for high-performance regimes. In this way, the study moves beyond conventional prediction and provides a reproducible route toward data-driven TBM operation optimization and decision-support applications.
Future research should focus on expanding the dataset across different tunnelling projects, geological conditions, TBM types, and operational strategies to better assess model generalization. Further work should also incorporate uncertainty in geological interpretation, sensor measurements, data synchronization, and model predictions, allowing results to be expressed through confidence intervals or risk-based indicators.
Additional improvements may include hybrid ML, physics-based modelling, more advanced temporal architectures, and real-time model updating. With further validation, the proposed workflow could be connected to live TBM monitoring data to support continuous prediction, anomaly detection, and operational decision-making during excavation.
Across three consecutive excavation intervals, the models delivered consistent, geology-conditioned parameter recommendations for penetration rate (PR) and utilization (UTIL) targets, showing that ML can support decisions under variable ground and operating conditions. ANNs captured the nonlinear relationships driving TBM performance and behaved reliably in field data.
PR/SPEED_TC and UTIL are used as conditioning inputs—target thresholds that define the desired performance regime—rather than as outputs predicted by the model. In operation, the trained models function as surrogate predictors that, combined with threshold-based filtering, yield actionable parameter sets for TBM controls (rotation, torque, thrust, screw-conveyor settings, face pressure) conditioned on geology and on PR/UTIL targets. With live data feeds, the pipeline could in principle be extended toward near-real-time monitoring, assisting operators in screening candidate operating regimes—subject to the validation and safeguards discussed in Section 5.1.
There is still room for refinement: broader cross-project datasets are needed to test generalization; online updating and uncertainty quantification (ensembles, prediction intervals) would harden deployment; and moving from fixed thresholds to Pareto-based selection would better capture multi-objective trade-offs.
In summary, this ML pipeline provides a reliable, interpretable decision-support tool for TBM performance analysis, rather than a deployment-ready or autonomous control system. It is best understood as a framework for generating and screening candidate operating configurations against PR/UTIL targets, with potential to evolve toward near-real-time decision support as the limitations noted in Section 5.1 are addressed. With continued validation and system integration, these methods can assist the way tunnelling projects are analysed, managed, and executed.
Acknowledgement: The authors would like to thank ELLINIKO METRO S.A. for the provision of all the necessary data in order to perform the analysis of this study.
Funding Statement: The authors received no specific funding for this study.
Author Contributions: Conceptualization, Andreas Benardos; methodology, Konstantinos N. Sioutas; software, Konstantinos N. Sioutas; validation, Konstantinos N. Sioutas; writing—original draft preparation, Konstantinos N. Sioutas; writing—review & editing, Andreas Benardos; supervision, Andreas Benardos; project administration, Andreas Benardos. All authors reviewed and approved the final version of the manuscript.
Availability of Data and Materials: Primary data are restricted due to an NDA between ELLINIKO METRO S.A. and the authors. Derived tables and figures are available upon request, subject to approval.
Ethics Approval: Not applicable. This study did not involve human participants, personal data, or animal subjects.
Conflicts of Interest: The authors declare no conflicts of interest.
References
1. Wang W, Yan C, Guo J, Zhao H, Li G, Yao W, et al. Improving tunnel boring machine tunneling performance by investigating the particle size distribution of rock chips and cutter consumption. Buildings. 2024;14(4):1124. doi:10.3390/buildings14041124. [Google Scholar] [CrossRef]
2. Latif K, Sharafat A, Seo J. Digital twin-driven framework for TBM performance prediction, visualization, and monitoring through machine learning. Appl Sci. 2023;13(20):11435. doi:10.3390/app132011435. [Google Scholar] [CrossRef]
3. Chen T, Guestrin C. Xgboost: a scalable tree boosting system. In: Proceedings of the 22nd ACM SIGKDD International Conference on Knowledge Discovery and Data Mining; 2016 Aug 13–17; San Francisco, CA, USA. p. 785–94. doi:10.1145/2939672.2939785. [Google Scholar] [CrossRef]
4. Zhou J, Qiu Y, Armaghani DJ, Zhang W, Li C, Zhu S, et al. Predicting TBM penetration rate in hard rock condition: a comparative study among six XGB-based metaheuristic techniques. Geosci Front. 2021;12(3):101091. doi:10.1016/j.gsf.2020.09.020. [Google Scholar] [CrossRef]
5. Garcia GR, Michau G, Einstein HH, Fink O. Decision support system for an intelligent operator of utility tunnel boring machines. Autom Constr. 2021;131:103880. doi:10.1016/j.autcon.2021.103880. [Google Scholar] [CrossRef]
6. Liu B, Wang Y, Zhao G, Yang B, Wang R, Huang D, et al. Intelligent decision method for main control parameters of tunnel boring machine based on multi-objective optimization of excavation efficiency and cost. arXiv:2104.14975. 2021. [Google Scholar]
7. Zhang X, Zhang X, Liu Q, Xie W, Tang S, Wang Z. TBM big data preprocessing method in machine learning and its application to tunneling. J Rock Mech Geotech Eng. 2025;17(8):4762–83. doi:10.1016/j.jrmge.2024.11.011. [Google Scholar] [CrossRef]
8. Line 2—EΛΛHNIKO METPO A.E.—ELLINIKO METRO S.A. [Internet]. [cited 2026 Aug 20]. Available from: https://www.emetro.gr/?page_id=4179&lang=en. [Google Scholar]
9. Bruland A. Hard rock tunnel boring [dissertation]. Trondheim, Norway: Norwegian University of Science and Technology (NTNU); 2000. [Google Scholar]
10. Jamal R. Development of a force estimation model for rock fragmentation with disc cutters through theoretical modeling and physical measurement of crushed zone pressure [Internet]. [cited 2026 Aug 20]. Available from: https://repository.mines.edu/entities/publication/139ea21b-d9e0-4c87-ab35-7f312216fde9. [Google Scholar]
11. Yagiz S, Gokceoglu C, Sezer E, Iplikci S. Application of two non-linear prediction tools to the estimation of tunnel boring machine performance. Eng Appl Artif Intell. 2009;22(4–5):808–14. doi:10.1016/j.engappai.2009.03.007. [Google Scholar] [CrossRef]
12. Delisio A, Zhao J. A new model for TBM performance prediction in blocky rock conditions. Tunn Undergr Space Technol. 2014;43:440–52. doi:10.1016/j.tust.2014.06.004. [Google Scholar] [CrossRef]
13. Li G, Xue Y, Su M, Qiu D, Wang P, Liu Q, et al. Probabilistic evaluation of tunnel boring machine penetration rate based on case analysis. KSCE J Civ Eng. 2022;26(11):4840–50. doi:10.1007/s12205-022-0128-z. [Google Scholar] [CrossRef]
14. Armaghani DJ, Liu Z, Khabbaz H, Fattahi H, Li D, Afrazi M. Tree-based solution frameworks for predicting tunnel boring machine performance using rock mass and material properties. Comput Model Eng Sci. 2024;141(3):2421–51. doi:10.32604/cmes.2024.052210. [Google Scholar] [CrossRef]
15. Zeng J, Roy B, Kumar D, Mohammed AS, Armaghani DJ, Zhou J, et al. Proposing several hybrid PSO-extreme learning machine techniques to predict TBM performance. Eng Comput. 2022;38(5):3811–27. doi:10.1007/s00366-020-01225-2. [Google Scholar] [CrossRef]
16. Benardos AG, Kaliampakos DC. Modelling TBM performance with artificial neural networks. Tunn Undergr Space Technol. 2004;19(6):597–605. doi:10.1016/j.tust.2004.02.128. [Google Scholar] [CrossRef]
17. Koopialipoor M, Tootoonchi H, Jahed Armaghani D, Tonnizam Mohamad E, Hedayat A. Application of deep neural networks in predicting the penetration rate of tunnel boring machines. Bull Eng Geol Environ. 2019;78(8):6347–60. doi:10.1007/s10064-019-01538-7. [Google Scholar] [CrossRef]
18. Jahed Armaghani D, Azizi A. A comparative study of artificial intelligence techniques to estimate TBM performance in various weathering zones. In: Applications of artificial intelligence in tunnelling and underground space technology. Singapore, Singapore: Springer; 2021. p. 55–70. doi:10.1007/978-981-16-1034-9_4. [Google Scholar] [CrossRef]
19. Mooney MA, Zheng H, Rizzi B. Actual and predicted earth pressure balance tunnel boring machine-induced ground deformation in Washington, DC: Stiff Clays and Dense Sands. In: Proceedings of the Geo-Congress 2023; 2023 Mar 26–29; Los Angeles, CA, USA. doi:10.1061/9780784484708.023. [Google Scholar] [CrossRef]
20. Glab K, Wehrmeyer G, Thewes M, Broere W. Predictive machine learning in earth pressure balanced tunnelling for main drive torque estimation of tunnel boring machines. Tunn Undergr Space Technol. 2024;146(3):105642. doi:10.1016/j.tust.2024.105642. [Google Scholar] [CrossRef]
21. Mooney M, Proshchenko V, Yu H, Shetty R, Cimiotti C, Kendall M, et al. Slurry shield cutterhead torque characterization using AI machine learning and mechanics-based modeling. Min Eng. 2024;76(12):14. [Google Scholar]
22. Li X, Zhao S, Shen Y, Li G, Zhu H. Integrated parameter optimization approach: just-in-time (JIT) operational control strategy for TBM tunnelling. Tunn Undergr Space Technol. 2023;135:105040. doi:10.1016/j.tust.2023.105040. [Google Scholar] [CrossRef]
23. Zhang C, Geng Z, Mooney MA, Cheng H, Chen R. Earth pressure balance tunnel boring machine vibration-based classification charts for real-time ground type and composition detection. Géotechnique. 2025;75(12):1580–93. doi:10.1680/jgeot.24.01356. [Google Scholar] [CrossRef]
24. Ninić J, Meschke G. Model update and real-time steering of tunnel boring machines using simulation-based meta models. Tunn Undergr Space Technol. 2015;45(2):138–52. doi:10.1016/j.tust.2014.09.013. [Google Scholar] [CrossRef]
25. TexnikesDianoiksisShraggwn 2018 [Internet]. [cited 2026 Aug 20]. Available from: https://www.scribd.com/document/990557674/TexnikesDianoiksisShraggwn-2018. [Google Scholar]
26. Farrokh E, Rostami J, Laughton C. Study of various models for estimation of penetration rate of hard rock TBMs. Tunn Undergr Space Technol. 2012;30(1):110–23. doi:10.1016/j.tust.2012.02.012. [Google Scholar] [CrossRef]
Cite This Article
 Copyright © 2026 The Author(s). Published by Tech Science Press.
This work is licensed under a Creative Commons Attribution 4.0 International License , which permits unrestricted use, distribution, and reproduction in any medium, provided the original work is properly cited.
 Downloads
 Citation Tools
