
 Submit a Paper
 Propose a Special lssue
 Open Access
ARTICLE

Peer Pressure and Harmful Use of Alcohol in Thailand: A Spatial Autoregressive Model Application
Department of Economics, National Dong Hwa University, Hualien, 974301, Taiwan
* Corresponding Author: Suchuan Yu. Email:
International Journal of Mental Health Promotion 2023, 25(5), 613-626. https://doi.org/10.32604/ijmhp.2023.025648
Received 24 July 2022; Accepted 12 December 2022; Issue published 28 April 2023
 View Full Text
 Download PDF
Abstract
Due to peer pressure playing a crucial role in the decision to drink, people who have a more fragile temperament might be expected to be at higher risk. Moreover, many studies have investigated the influence of peer pressure on alcohol consumption, but few have examined the relationship between heavy drinking and peer pressure via a spatial autoregressive model (SAR) in low/middle-income countries, such as Thailand. This paper investigated the connection between heavy drinkers over the age of 15 years who drink more than or equal to 60 grams of unmixed alcohol at least once per month based on the Thai Survey of Cigarette Smoking and Alcoholic Drinking Behavior, 2014. Further, the drinkers were assumed to socialize with two peer groups: immediate family and close friends. Our paper considered a SAR model because SAR can overcome the reflection problem encountered using a linear-in-means model and the correlated effect problem found with hierarchical models. The main finding was the discovery of a significant and positive peer effect on alcohol consumption among heavy drinkers. In addition, there was evidence of education having an effect, but no evidence of income affecting on alcohol consumption. Specifically, a higher level of education was linked with lower levels of alcohol consumption. The results not only help us to understand the peer effect and alcohol consumption behavior, but policymakers can also apply peer effect-based strategies to formulate effective policies to decrease the alcohol consumption rate in Thailand.Keywords
As stated by the World Health Statistics 2022, around 2.3 billion people of the world’s total population consumed alcohol which is deeply embedded in the culture of many countries [1]. Several essential variables affect alcohol consumption levels and patterns in communities. Historical trends in alcohol consumption, alcohol availability, culture, income level, and alcohol control policies also affect alcohol drinking. Furthermore, Individual alcohol intake is influenced by gender, age, biological and socioeconomic vulnerability, and policy. Social norms that promote drinking and unclear information about the risks and benefits of drinking increase alcohol consumption. Alcohol use is also linked to mental and behavioral disorders, major noncommunicable illnesses such as liver cirrhosis, several malignancies, cardiovascular disease, violence, and traffic accident injuries [2]. Thai drinkers over the age of 15 consumed 8.5 liters of unmixed alcohol per capita in 2019, compared to 5.8 liters for the average level of global alcohol consumption, with men consuming more alcohol than women [3].
The third National Health Examination Survey showed evidence of premature death attributable to alcohol in 2004, linked to National Death Registry data of 2004–2019. A follow-up period of 507,771.7 person-years resulted in 10,704 deaths. The initial sample’s crude mortality rate was 868.6 per 1,000 persons, and alcohol-related deaths accounted for 18.6 deaths per 100,000 people. Unknown liver illnesses were the number one cause of alcohol-related mortality in both men and women. 49.5 years, on average, were lost in total years of life (YLL) at baseline, with men losing substantially more years than women. Ages 30–44 had the most significant mortality rate and predicted YLL, followed by 15–29 [4].
The purpose of this study is to evaluate the relationship between heavy drinkers over the age of 15 who consume more than or equal to 60 grams of pure alcohol at least once per month. In addition, we focus on excessive drinking because the alcohol consumption level on a single occasion is crucial for many severe outcomes of alcohol drinking [5]. Furthermore, drinking occasions characterized by heavy consumption (also known as binge drinking) have been considered in terms of their role in the statistical increase in alcohol consumption in Thailand, but there has not been a clear investigation of whether these outcomes are related to peer pressure or not. Our paper uses a Spatial Autoregressive (SAR) model to solve the conceptual problem and estimate the peer effect more precisely using 2014 data from the National Statistical Office of Thailand on cigarette smoking and drinking. This information is input to a proposed SAR model, which has the potential to solve the conceptual problem and provide a more precise estimation of peer effect. We have endeavored to examine the relationship between excessive alcohol consumption and peer pressure by using the SAR model because this model can resolve the reflection problem and the correlated effect problem.
This paper is organized as follows. Section 2 provides a brief overview of the previous research. We further discuss peer pressure or the social interaction estimation issue in Section 3. Data and results are presented in Section 4. Our conclusion is provided in Section 5.
Several researchers have considered peer pressure in economic terms. This thread of investigation began with Leibenstein [6] who investigated social effects such as bandwagon, Veblen, and snob effect in relation to demand theory. This was followed by Becker [7] who studied social interaction and consumer demand. Becker [8] also found a connection between behavior, addiction, and tradition and showed that the association between past and present might explain parents’ effect on children’s preferences and future decision making. Becker et al. [9] studied addiction and social economics, explaining that consumption of addictive goods was unsteady, and past consumption significantly impacted current addiction. In 2009, these same authors published a book called “Social Economics: Market Behavior in a Social Environment,” which explained the social capital mechanism in more detail [10]. Lindbeck et al. [11] found evidence of the role of the social norm on economic inducement in the context of household behavior. Rice et al. [12] found a connection between household membership and drinking behavior. They showed that alcohol consumption levels depended on the households’ characteristics. However, they could not separate between endogenous and exogenous effects.
Many economists have been interested in Western countries’ peer effects and substance use. Clasen et al. [13] defined peer pressure as “the pressure to think or to behave along certain peer-prescribed guidelines” in a paper that showed peer pressure as a multidimensional force. Moreover, they also pointed to the significant role of peer pressure in alcohol use among teenagers. Subsequently, several researchers found links between peer pressure and alcohol use [14–16]. However, other papers, like the one by Kremer et al. [17] reported finding no connection between peer effect and alcohol consumption among university students. Most of research in this area has examined the relationship between peer pressure and alcohol use from the standpoint of misbehavior. Some of these studies have shown a positive relationship between peer effects and alcohol [18,19]. Case et al. [20] published an early study in the economics research style that investigated the relationship between the peer groups of youths, such as their family members and neighbors, on a number of the youths’ behaviors, such as drug use, drinking alcohol, engaging in illegal activities, premarital sex, schooling, and participation in religious activities. They found peer pressure was powerfully connected to youth engaging in similar habits and behaviors. Other researchers have applied different methods to examine peer pressure in the context of juvenile substance use. For example, Kremer et al. [17] applied data from a random system used to match students with roommates to point to the role of peer pressure in alcohol drinking among university students, including tobacco prices and policy, to investigate the effect on cigarette smoking. Studer et al. [21] inspected the link between peer pressure and alcohol consumption level and explored the intervention of drinking motivation. All the previous papers have focused on western countries, and among these, only a few have considered the volume of alcohol consumption and treated research subjects’ immediate family members as the subjects’ peers.
In Thailand, many researchers have studied alcohol consumption, but few have focused on the role of peers in alcohol consumption. Instead, they have tended to study the phenomenon from other standpoints such as analyzing alcohol consumption trends in the country [22–25]. In 2001, European Addiction Research data showed that Thais consumed an average of 2 liters of unmixed alcohol per capita in 1995. In 2004, Thai people showed a high alcohol consumption trend. In terms of prevalence, more males (56 percent) consumed alcohol than females (10 percent). However, the number of Thai females and adults of both genders who drank alcohol increased significantly from 1991 to 2004 [26]. Some researchers have tried to figure out the link between alcohol consumption and disease. For example, Rattanawibool [27] showed that drinking alcohol at a rate of 12 grams per hour was associated with subjects having a blood alcohol concentration (BAC) of less than 0.05 percent, and BAC was also low when an alcoholic beverage was consumed immediately following a meal. They concluded that a rate of 12 grams of alcohol per hour was a safe drinking level for Thai people and recommended that drinkers would be better off indulging in alcohol immediately after a big meal. Wakabayashi et al. [5] reported on the connection between non-communicable diseases and alcohol drinking for an open university in Thailand. They found that drinking four or more glasses of alcohol per unit of time was connected with a higher risk of developing non-communicable diseases, especially liver disease, hypertension, and high cholesterol. In addition, some papers have examined the link between individuals’ initiation to drinking and tax policy. For instance, Rehm et al. [28] found an association between individuals’ initiation to drinking and alcohol taxation changes in a study of teenagers in Thailand. The study reported that, proportionately, higher taxation could reduce alcohol consumption. A few papers have studied the role of peer effect on alcohol consumption in Thailand. For example, Newman et al. [29] studied the relation between alcohol consumption and Buddhism in Thailand. They analyzed four expectancies and found that teenagers who adhered to Buddhism drank less than non-practicing Buddhists. Pensuksan et al. [30] examined peer-drinking group motivational intervention (PD-GMI) among Thai male undergraduates. They divided subjects into two groups and conducted two research phases: baseline and post-intervention. They found that Thai male students who received the intervention could reduce their alcohol consumption rate.
Miller et al. [31] investigated the link between the neighborhood construct and substance use and illegal behavior in Bangkok. They showed that teenager substance use and illegal behavior were connected with neighborhood disorganization, union, and control through peer deviant behavior. Wongtongkam et al. [32] examined risk factors for alcohol and drug use in Thai teenagers, focusing on individual, peer, and school domains. They presented findings suggesting that students with low levels of commitment to schooling tended to use illicit drugs at higher rates than their more highly committed peers. Seen another way, subjects having peers who engaged in delinquent behavior and using drugs was connected with subjects’ own substance use. On the other hand, students who participated in religious activities were less likely to consume alcohol. None of the literature above has treated immediate family members as subjects’ peers. Moreover, these studies have all focused on adolescents, a limited sample that cannot be said to represent all of Thailand’s population. Therefore, to fill this gap, our paper utilizes SAR to analyze drinking behavior, as this approach is more suitable for dealing with data of the type we are considering. We will explain our proposed model in the next section.
3 The Empirical Approach and the Peer Pressure Estimation Issue
Social interaction, or peer effect, is how people reciprocally influence each other’s behavior. Peers may include family, friends, neighbors, college classmates, and so on. Several papers published on studies concerning peer effect showed that peer effect influences on the education sector [33–35]. Conley et al. [36] and Bandiera et al. [37] also demonstrated peer effect in new technology adoption. Many researchers have tried to explain the peer effect in economic terms. Investigations of the peer effect equation have been increasingly focused on econometric issues. Below, we explain why we chose the SAR model to estimate the peer effect.
We begin with Manski [38]. His linear model could be divided into three types of effects: endogenous effects, exogenous (contextual) effects, and correlated effects. Manski explained these effects by using an example of students’ accomplishments. If students achieve their goals because of their peers, this effect is called an endogenous effect. In contrast, an exogenous effect would be where students received high scores because of their socioeconomic attributes. Furthermore, if students reached the same level of achievement because they had the same instructor or background, this would be called a correlated effect. We can consider the peer effect as an endogenous effect because it hinges on social effects. If we can apply strategies informed by the results to the majority of students in a cohort, doing so could also enhance the results of the other students in the same peer group.
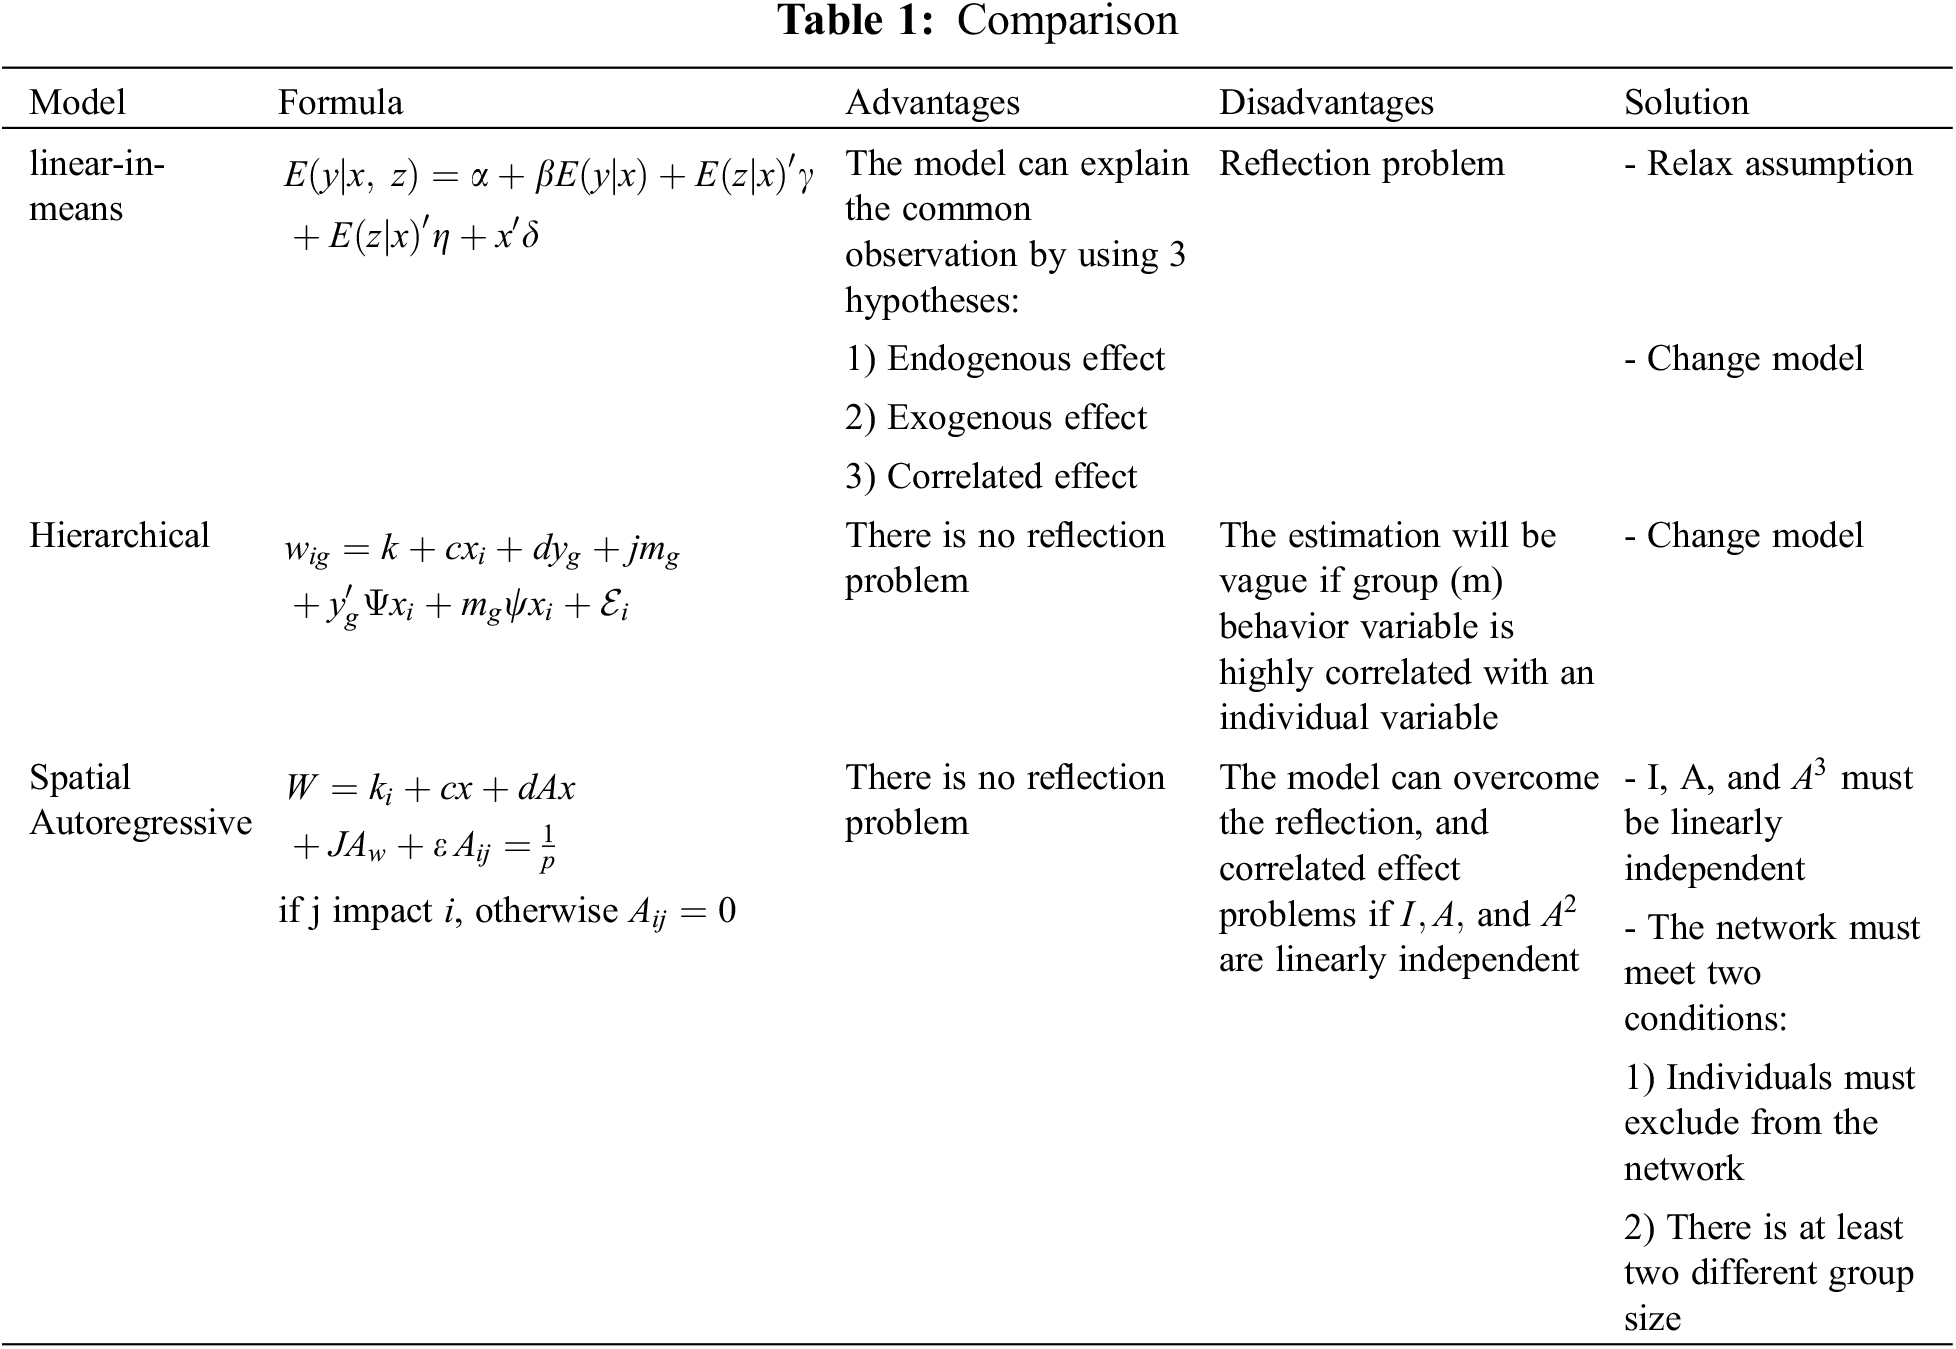
The most serious issue for this model is the reflection problem because we could not separate the endogenous effects and exogenous effects. For example, people in the same group may exhibit the same behavior when drinking alcohol because they have the same socioeconomic background or face similar of circumstances. The reflection problem has often reared its head when researchers have tried to define the outcome of attitude or action peer groups on personal behavior. Manski et al. [38–41] have discussed the problem in the context of estimation and identification of peer pressure by way of the linear-in-means model, as shown below:
where y is the drinking result for each person in a group, and x is a personal characteristic. z and u are the direct effect variables such as education and income.
We suppose that everyone understands everything in the model. So, the behavior expectation in the group should be:
From Eq. (2), if we consider
If we set
when we plug Eq. (4) into Eq. (2) we obtain a reduced form as shown below:
We can see that we cannot identify all the variables if
The next question is how we can solve the reflection problem. Although several researchers have attempted to do so, they have been unable to find a complete solution. Most of them keep far away from it by relaxing their assumptions, such that they have only looked at one effect, endogenous or exogenous. Some papers have ignored the bias problem. For example, if we consider the only endogenous effect, by setting
Manski (1993) stated that non-social or associated factors contaminate social results [38]. Eq. (6) is more realistic than Eq. (1), because Eq. (1) estimates social impacts that may be misleading due to omitted variable bias. In addition, some researchers tried to relax the linearity assumption of
To solve the puzzle of the reflection problem, we explore other social interaction models. We begin with the hierarchical model. This model is a choice concept of the peer pressure effect. We followed Blume et al. [44], who say that a classic hierarchical model is indicated as:
where W is the individual’s decision regarding a specific behavior, k is the population’s average behavior, and X is the personal variable influencing the outcome.
If we consider personal and group definition elements, we get:
and
where a matrix is shown as
We suppose self-consistency and
There is no reflection problem because there is no linear dependence between
Next, we explore spatial models of social interaction [33]. We have information about the neighborhood, such as nearness matrix A, which is shown as:
A model in matrix terms could be shown as:
where
If A and
Condition1: Personnel from their network must not be included.
Condition2: There are at least two different group sizes.
In terms of correlated effect, the model also provides a solution. If
The SAR model is suitable for studying data on drinking behavior from Thailand because the model meets the conditions below:
Condition1: The SAR model can solve the reflection problem and the correlated effect problem.
Condition2: Individual data had been excluded from their peer group.
Condition3: Personnel data had more than one group with different sizes.
Table 1 is our model summary table, which compares the three models and demonstrates that the SAR model is the most suitable for our data.
Since the 2014 Thai survey of alcoholic drinking behavior did not provide peer group characteristic information, we modified the model to make it suitable for the data.
where
In Eq. (13), variable x reflects socioeconomic status, such as education and income. Moreover, the J variable represents a peer estimation, and the c variable captures the direct effect of socio-economic status. Hence, A is the weighting matrix.
We explored the cigarette smoking and drinking behavior data from the National Statistical Office of Thailand, which were reported from a survey conducted in 2014. The survey collected information from Thais regarding their drinking behavior, detailed personal descriptions, and family characteristics. We analyzed the drinking behavior reports. Since all the data were from Thais, we controlled only their race and the subjects’ personal backgrounds, combined with socioeconomic status variables such as education and income.
A total of 25,758 Thais were requested to respond to a questionnaire. People 15 years old and over answered cigarette smoking and drinking alcohol questions. Based on the responses, 42 percent of the sample were rejected from the present analyses because respondents did not complete questions about drinking alcohol, their peers, and/or socioeconomic status. Inconsistent answers were checked and identified by conducting an answer consistency analysis. We corrected data by comparing frequencies and cross-tabulated to parse out associated data. The definite samples numbered 10,787. However, for this analysis, we considered only heavy drinkers who consumed at least 60 grams of unmixed alcohol at least once per month because this high alcohol consumption increases the risk of creating health problems. This meant that the number of individuals in our sample was 4,218. Table 2 shows the final sample which was used to measure the alcohol use among Thais in 2014.
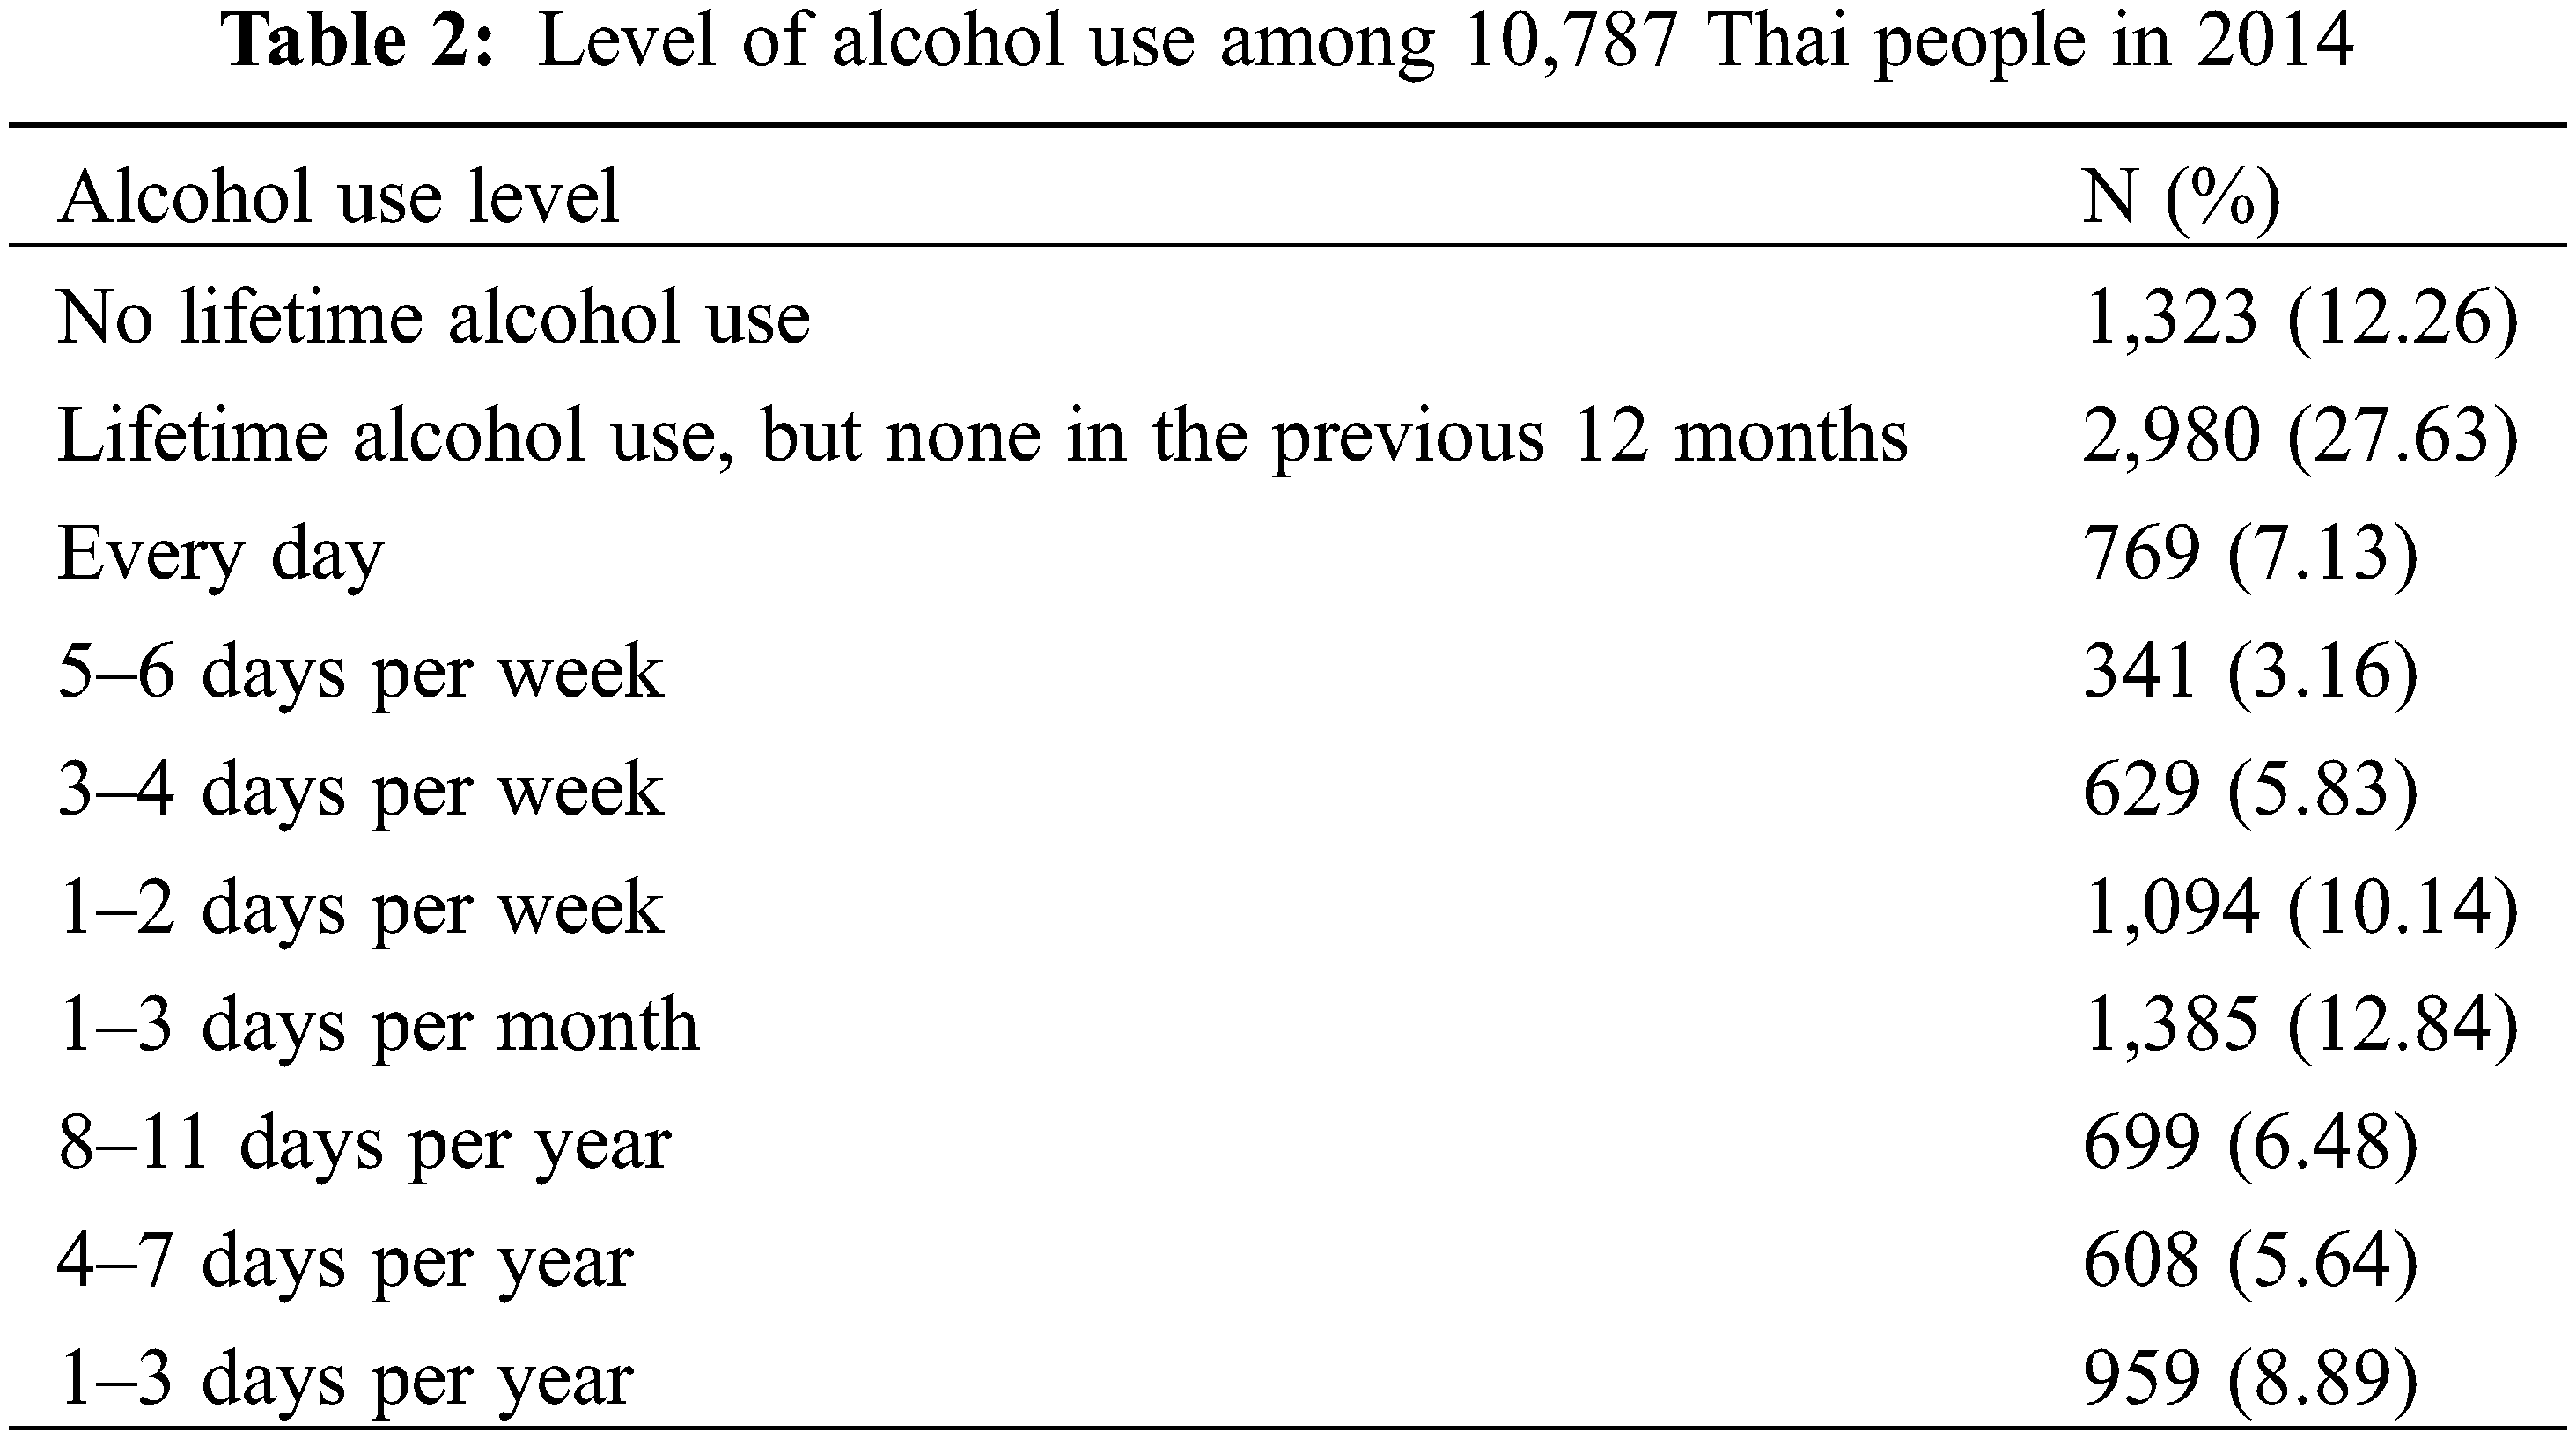
In this analysis, we defined heavy or hazardous drinking based on WHO’s definition. WHO defines a heavy drinker as a person who drinks 60 grams or more of pure alcohol (1 standard drink is equal to 10 grams) at least once a month. We considered three questions from the survey about drinking behavior to classify alcohol use severity. The alcohol consumption level was judged by reference to answers to the following questions: 1) Have you ever consumed alcohol in the last 12 months? 2) How often did you drink alcohol? and 3) How many milliliters of alcohol did you drink per time? We focused on participants who answered “YES” to the first question. Moreover, we considered only persons who consumed alcohol at least one day per month and whose alcohol consumption level was more significant than or equal to 60 cc of pure alcohol per occasion (1 cc = 1 gram). In total, our sample comprised 4,218 individuals.
Regarding peers, we supposed that respondent drinkers were associated with two networks: close friends and immediate family. We investigated the survey questions to count the number of peers who consumed alcohol by focusing on the question “How many of your close friends and immediate family members drank in the past 12 months?” The participants could answer from zero to ten persons for close friends and immediate family members.
As for socioeconomic status, we considered education and income. We focused on the highest level of education. In terms of income, the questionnaire asked about both tangible and intangible assets. Finally, participants had to sum all their assets to calculate an amount of net worth.
In our equation, the endogenous variable is alcohol consumption in the past 12 months. Table 3 shows the values of the mean and standard deviation of the relevant variable. The average rate of alcohol consumption is 12.72 times/month. The exogenous variable of the alcohol peer pressure equation consists of the number of close friends who consume alcohol, the number of immediate family members who also drink, education level, and income. We note that possessing the minimum level of education, primary education was reported by 39 percent of the sample.
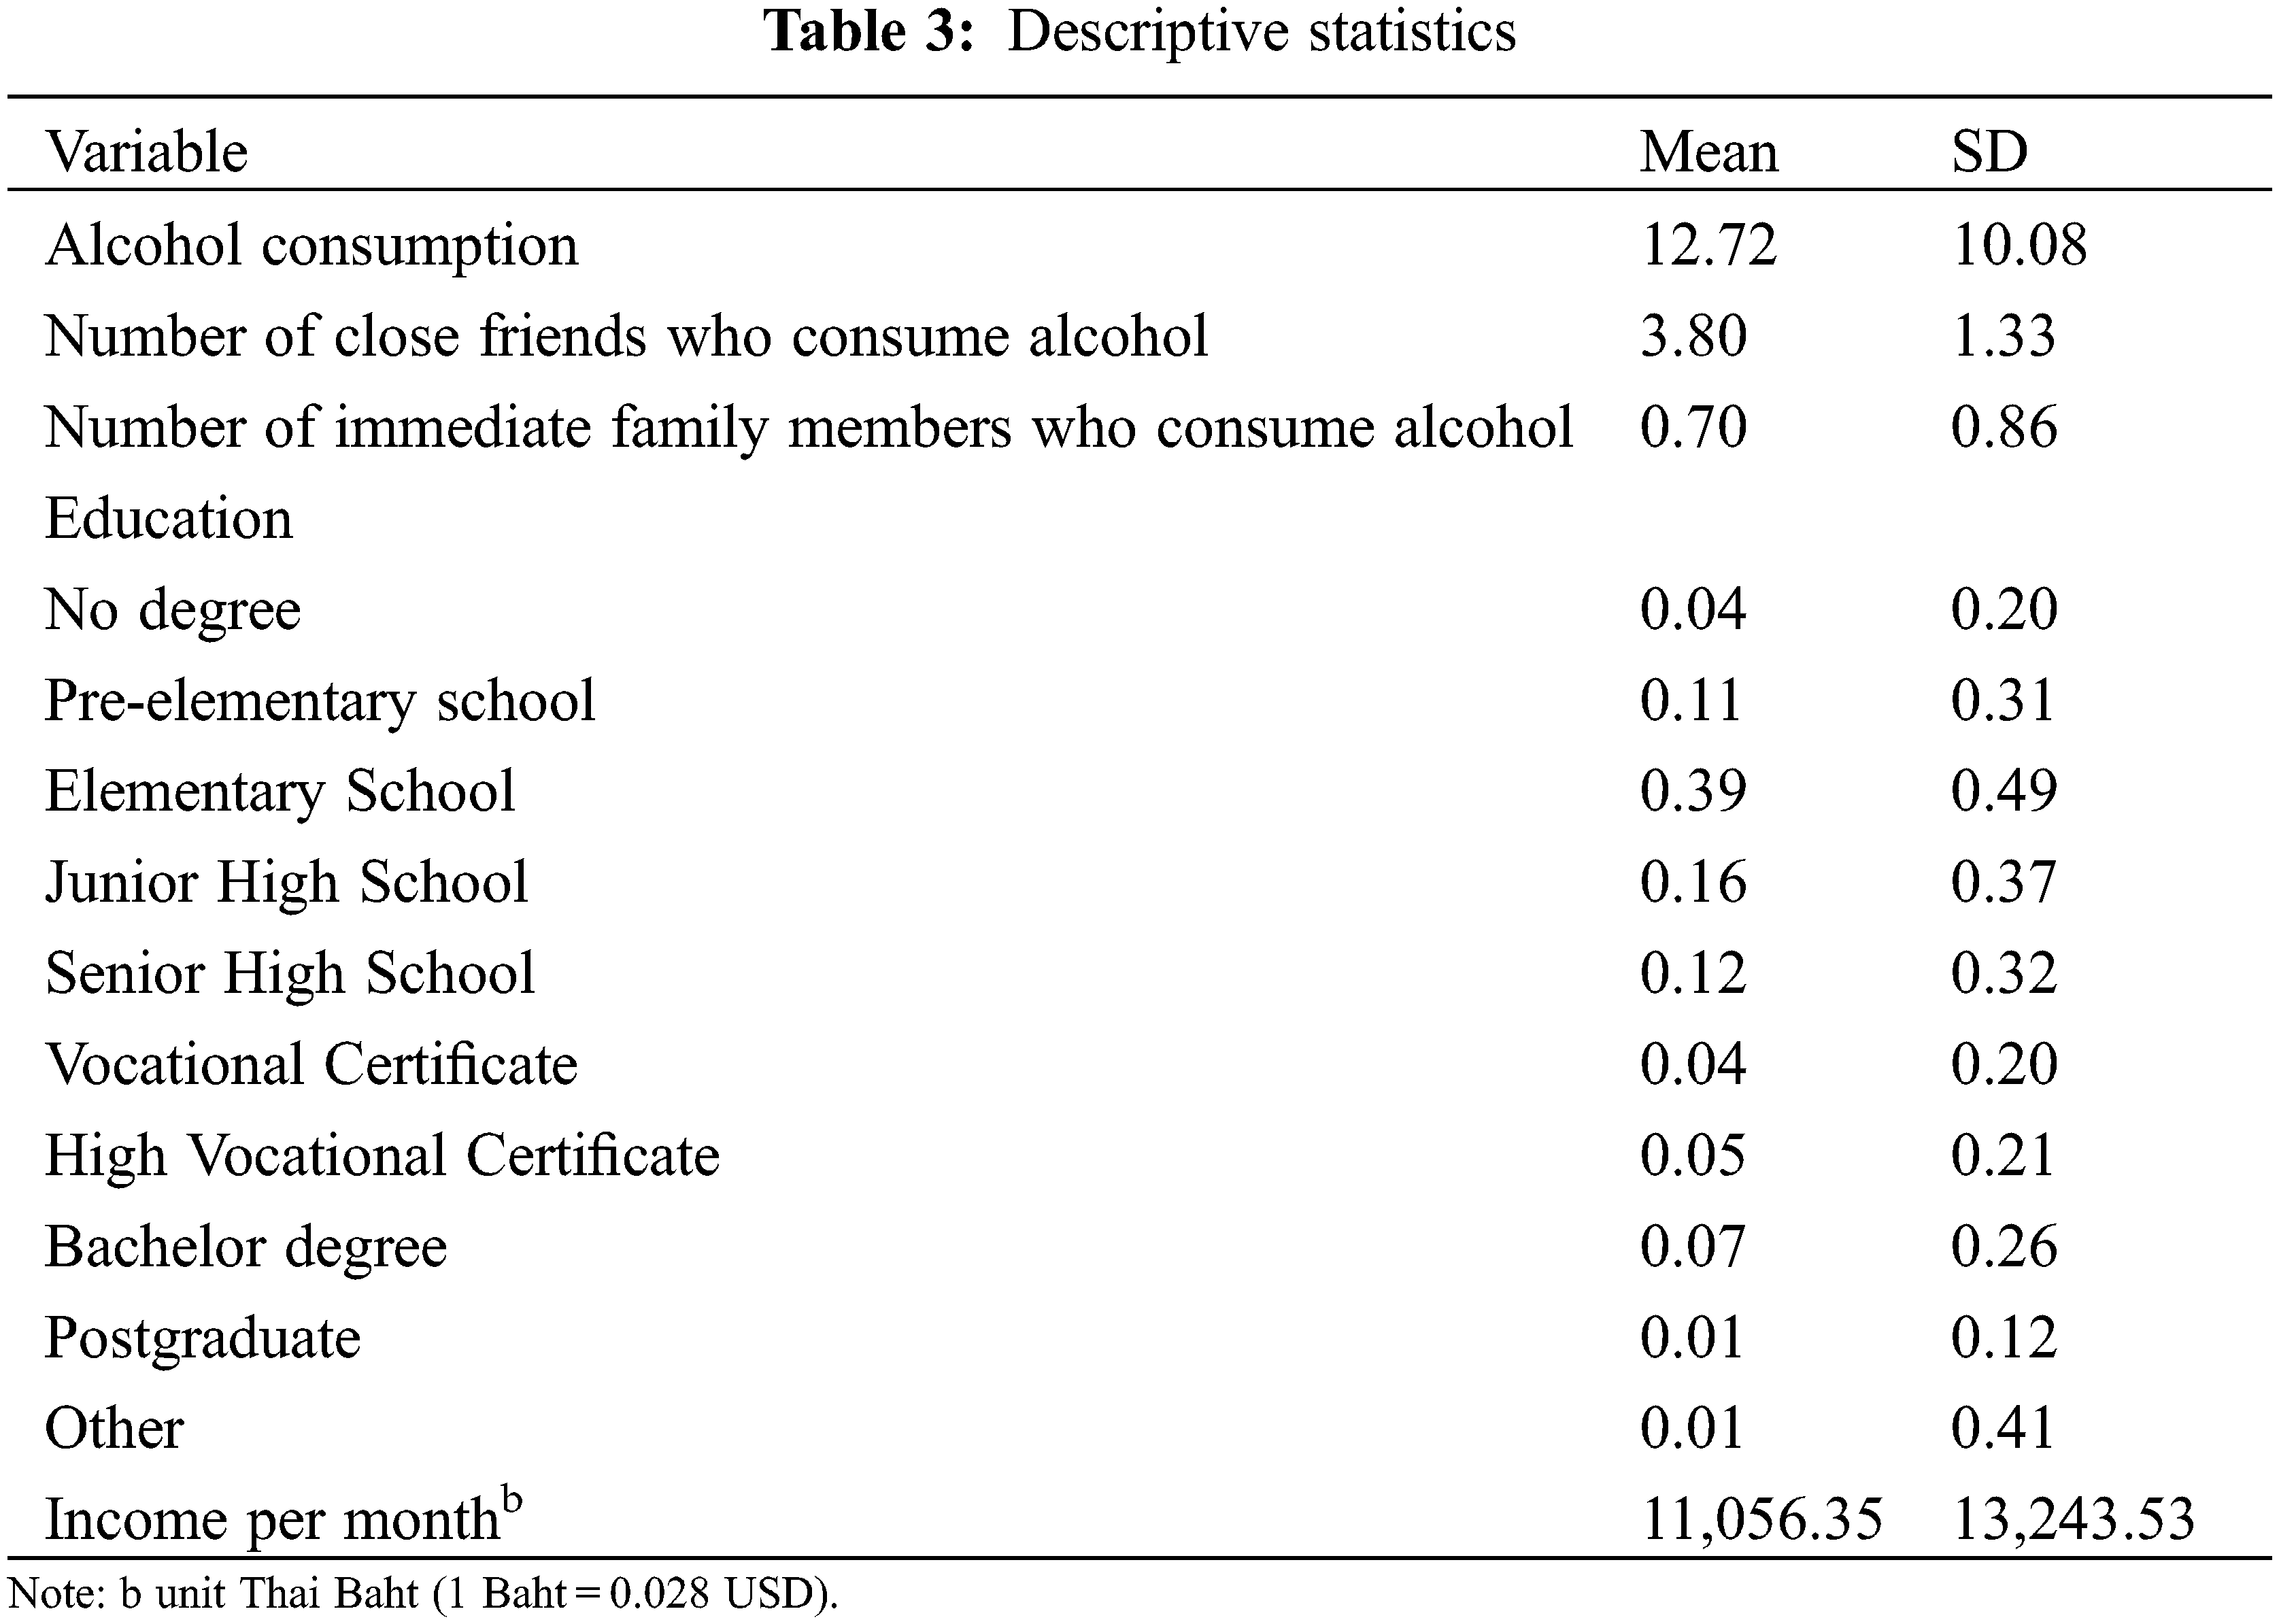
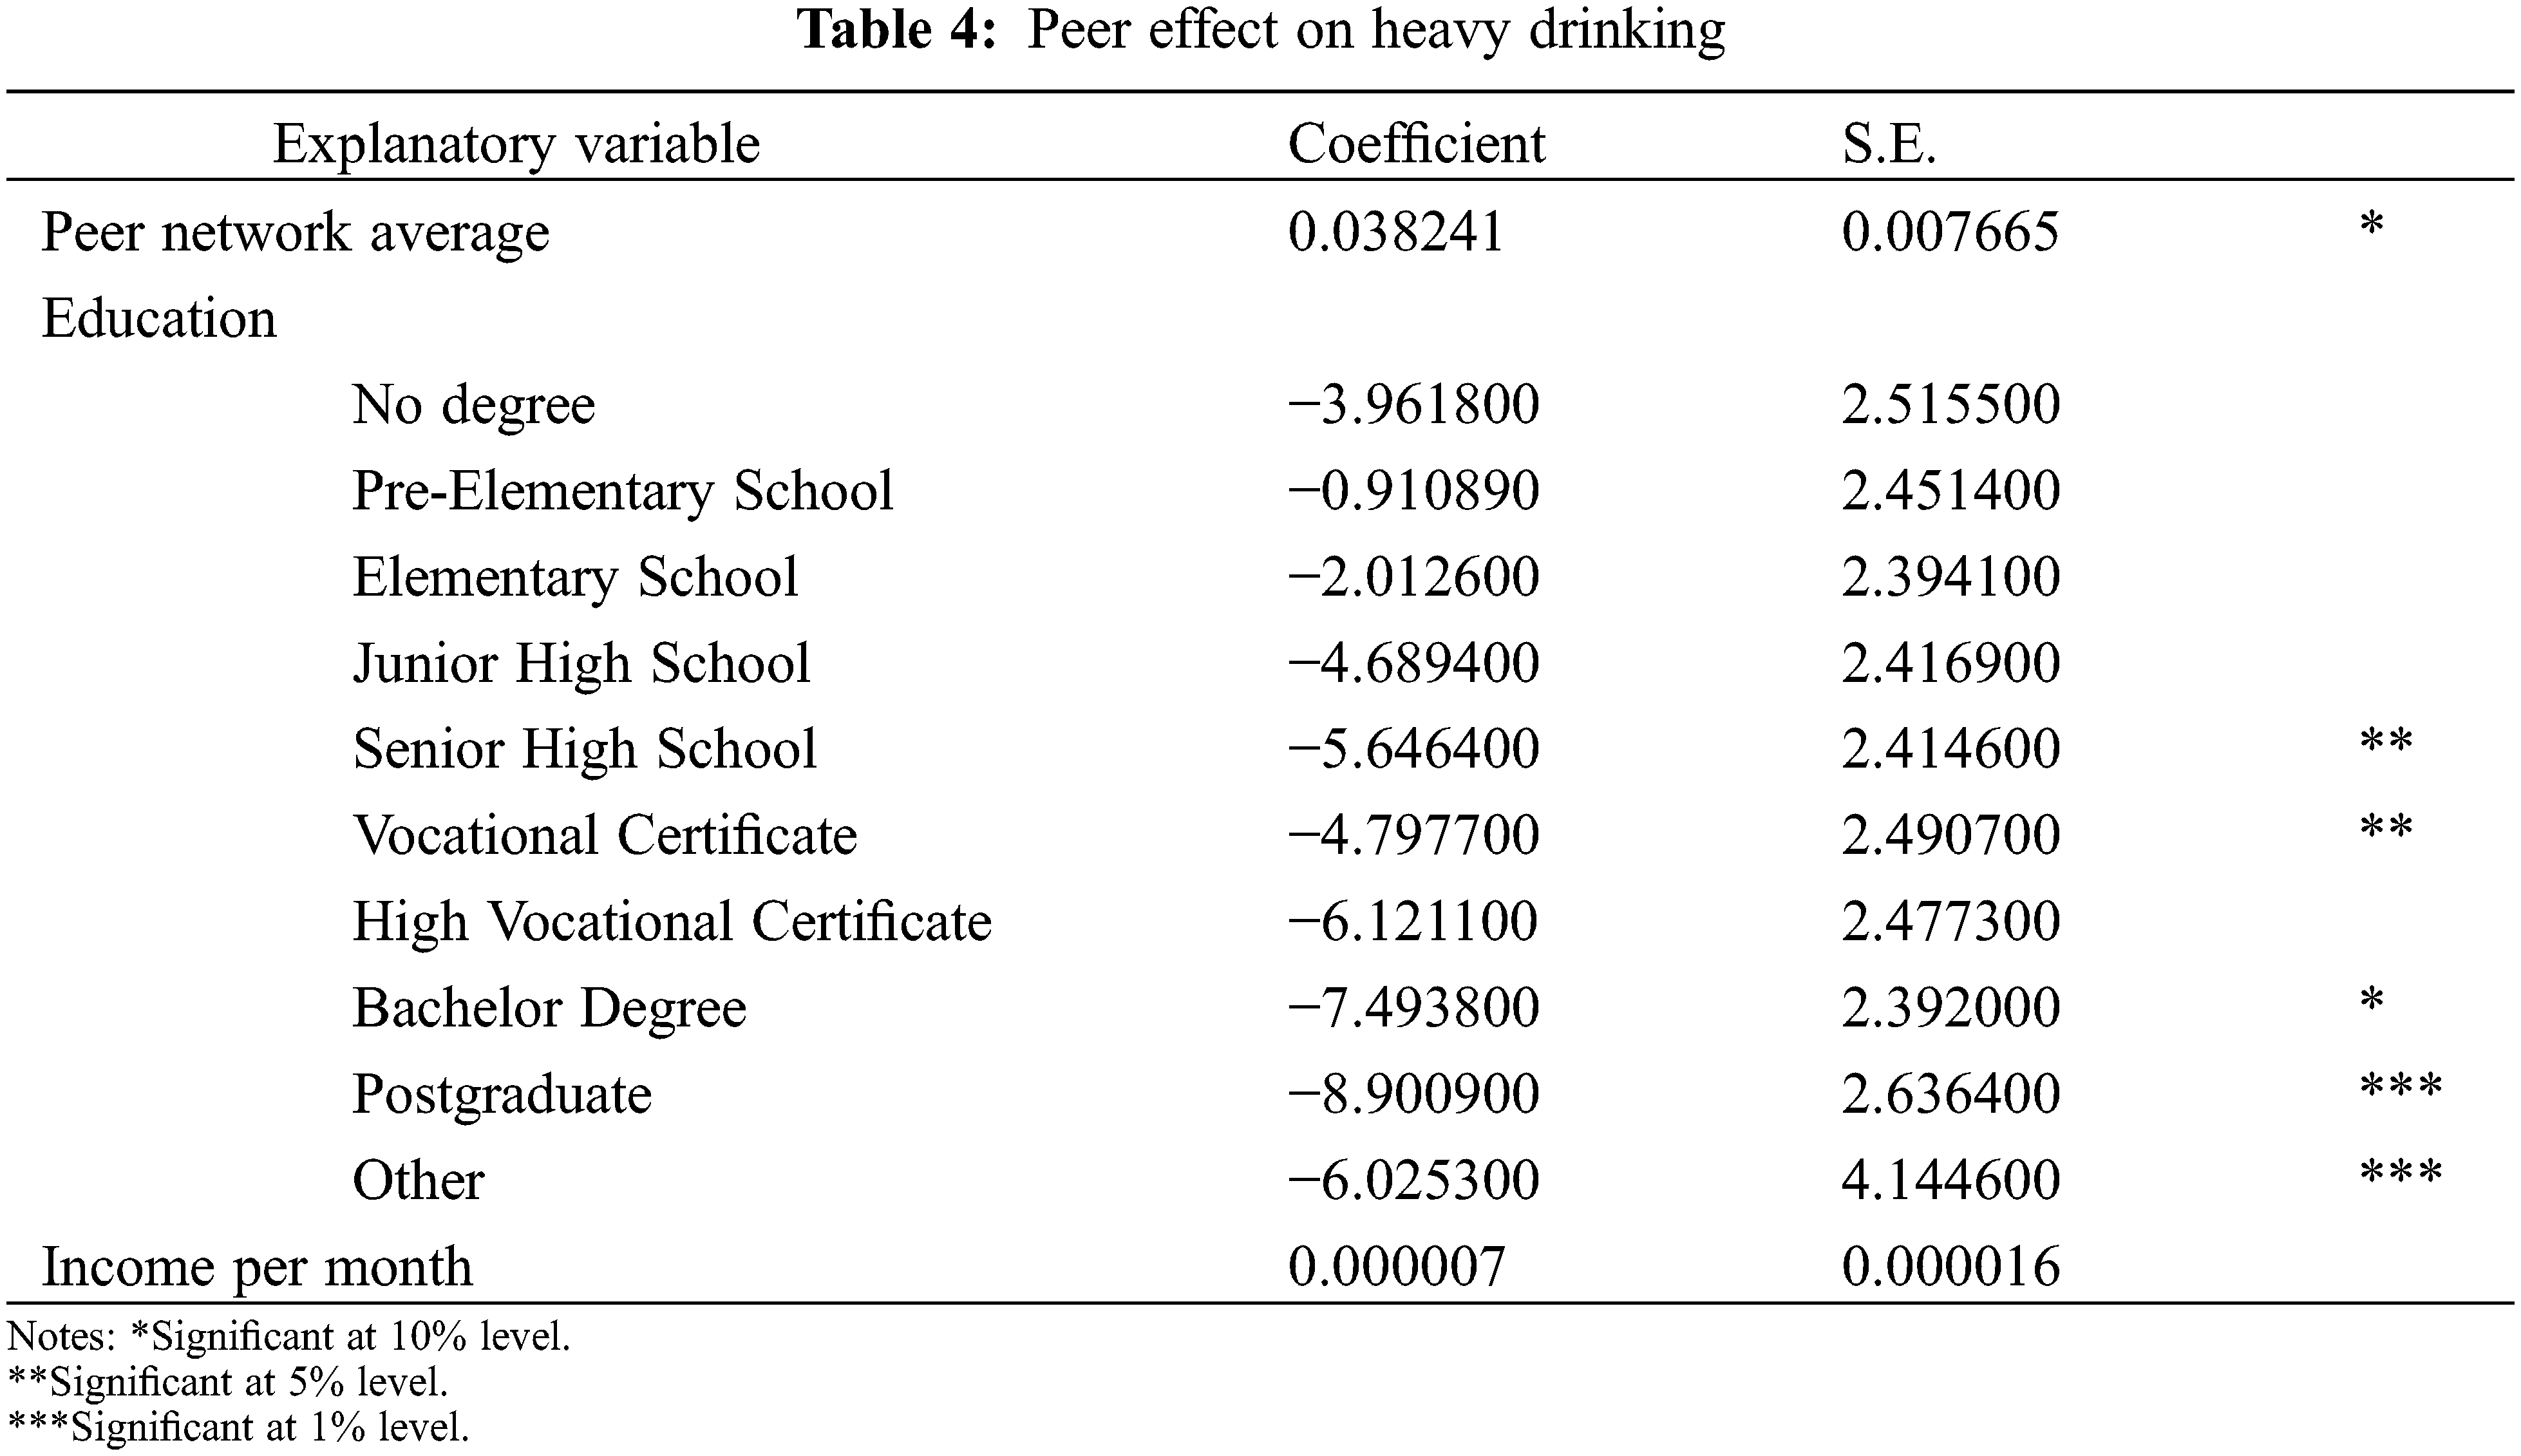
Table 4 shows the empirical results. The estimation outcome of the SAR model presents a positive and significant value of peer effect. It indicates that peer alcohol use is connected with respondents’ level of personal alcohol use; this relationship is statistically significant and positive. However, the results show exciting estimation results regarding respondents’ education. All education levels display negative values, meaning respondents with high education levels will have lower alcohol consumption rates. The effect is only significant for respondents with Senior High School, High-Level Vocational Certificates, Bachelor’s degrees, Postgraduate degrees, and Others. In particular, individuals holding Postgraduate degrees and Other degrees demonstrated highly significant values. Individuals with higher education are less likely to be influenced by their peers to drink alcohol.
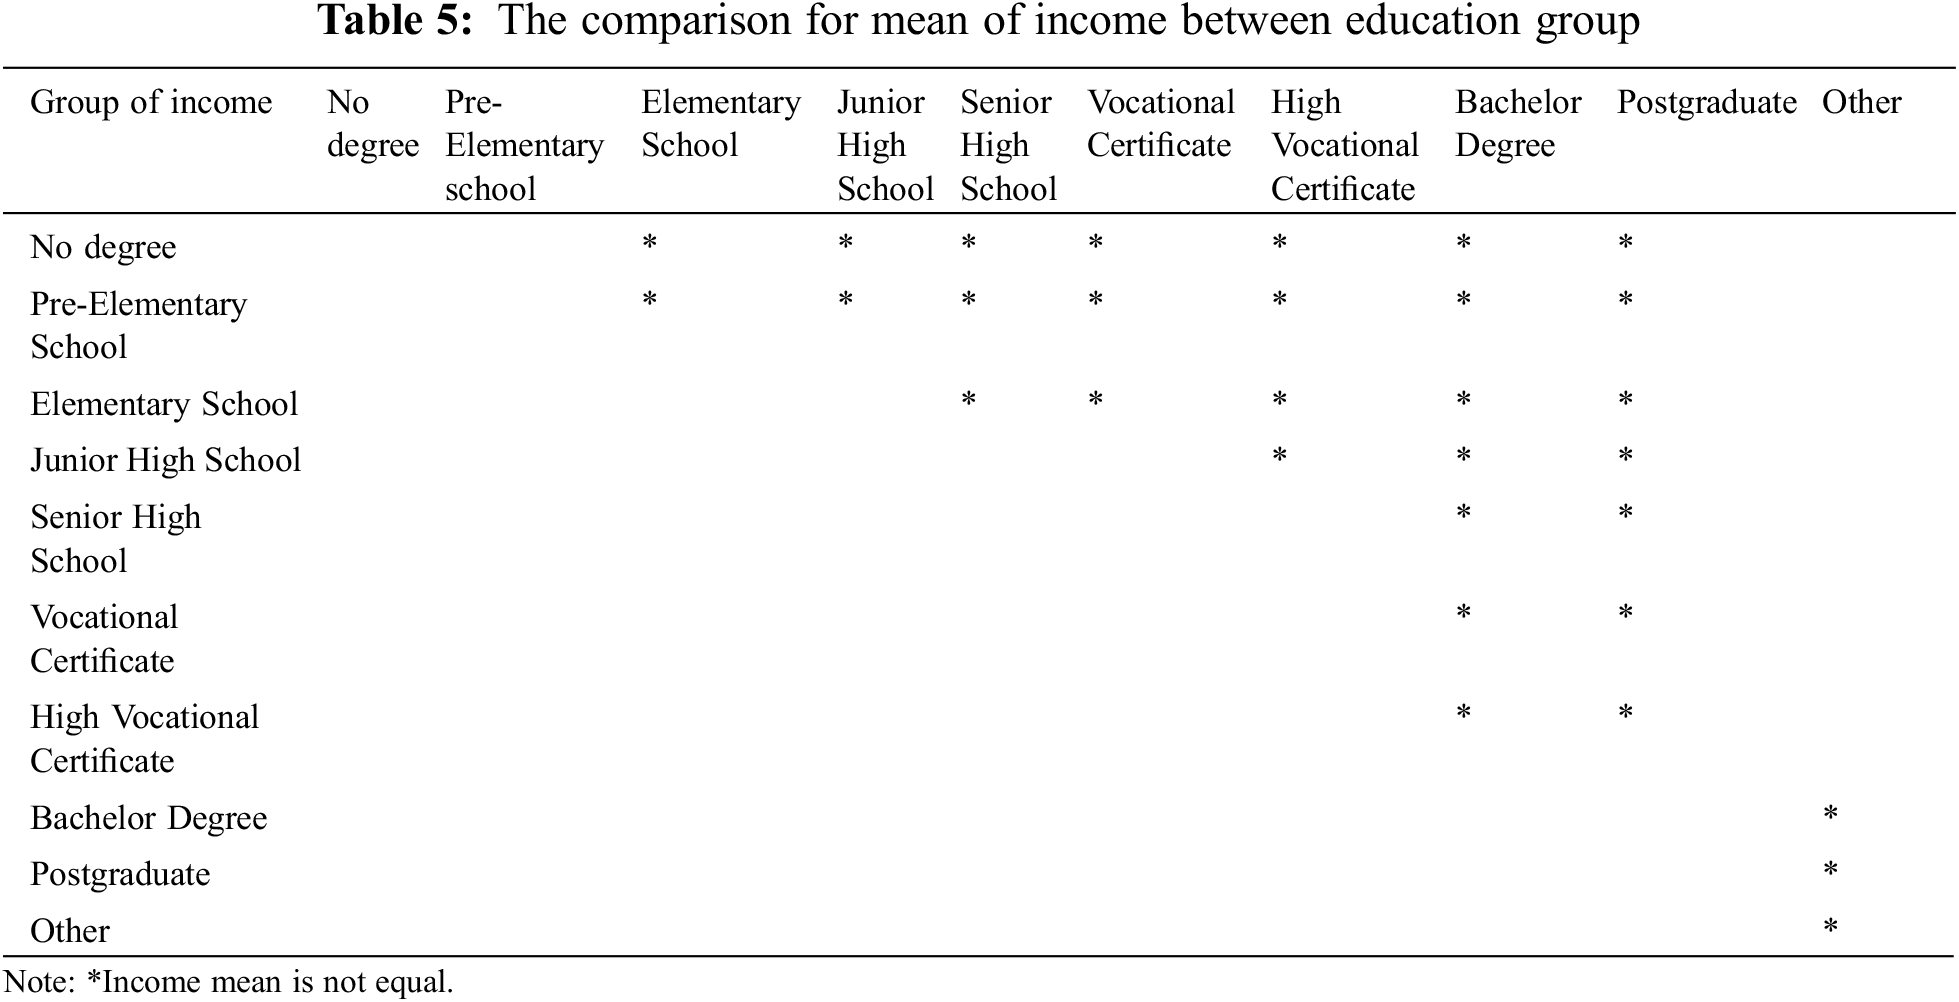
We also calculate a correlation to check whether the income variable depends on the education variable by using One Way ANOVA with significance at 5% level between 10 education groups with the following hypothesis:
H0: All income groups mean are equal.
Ha: At least one income group means is not equal to others.
We found that p-value is less than 0.05, which means that at least one income mean of some education groups is not equal to others. We do the further post-hoc test by using Scheffe. We have compared the mean income between education groups presented in Table 5.
5 Discussion and Concluding Remarks
A significant increase in alcohol consumption was observed among the Thai population between 1999 and 2008. Furthermore, among all the Southeast Asian countries, Thailand revealed the highest per capita alcohol consumption rate in WHO’s South-East Asia Region [46]. The primary goal of this study is to unlock the black box that is peer pressure by studying its impact on Thai alcohol drinkers by using data from the 2014 Thai Survey of Cigarette Smoking and Alcoholic Drinking Behaviour. A spatial autoregressive model (SAR) was applied to the data set to solve the reflection problem because it can distinguish between peer effects and other effects. The drinkers were assumed to socialize with immediate family and close friends. This paper analyzed the impact of peer pressure on hazardous drinking patterns in Thailand. The key finding was a significant and positive peer effect on alcohol consumption among binge and heavy drinkers. Moreover, interesting, exciting evidence uncovered of education resulting, and there is a correlation between income and education. In addition, Wasi et al. also determined the association between wages and education from 1988 to 2017 at the individual level. Groups with higher levels of education got higher pay than those with lower levels of education [47].
Using the model of Manski [38] makes it challenging to isolate peer effects from other effects because of the reflection problem. However, the SAR model can solve this problem. Lee et al. [45,48], Bramoullé et al. [33], and Blume et al. [43] untangled this problem. In this paper, the model can identify different types of effects because the Thai data satisfies two essential conditions: 1) there is more than one group, and groups have different sizes, and 2) individuals must be excluded from their networks. The SAR model is more appropriate for handling peer effect estimation and the type of data represented by the sample. The empirical outcome from the SAR model showed that peer effect exists in the harmful use of alcohol in Thailand.
Harmful use of alcohol carries with it tremendous cost. It constitutes a threat to public health worldwide because of the health risk associated with heavy drinking and binge drinking [2]. Although the Thai government implemented alcoholic beverage controls in 2008 that restricted the availability of liquor and raised the legal drinking age from 18 to 20 years of age, the number of drinkers did not decline [49]. The number of imbibers has been continuously expanding [50]. This investigation’s results help us understand the link between the peer effect and alcohol consumption behavior. Policymakers can apply this knowledge to formulate effective strategies to decrease the alcohol consumption rate in Thailand. To this end, three significant suggestions are offered below, hoping that policymakers can apply them to the future development of prevention strategies.
First, due to peer pressure playing a crucial role in deciding to drink, people with a more fragile temperament might be at higher risk of excessive alcohol consumption. Alcohol consumption was found to be markedly affected by peer influence. This outcome shows explicitly that if drinkers’ peers consume alcohol, namely their immediate family and close friends, this is linked to the drinkers’ harmful use of alcohol. Thus, policies can be more effective if they focus on drinkers’ peers.
Second, our research revealed that a higher level of education was linked with lower levels of alcohol consumption. Education may help drinkers and their peers better understand and perceive the associated health risks. The government should provide essential information to educate citizens about the connection between alcohol and health problems. The policy should be aimed not only at educating drinkers but also at educating drinkers’ peer networks.
Finally, we found in this research that peer pressure significantly impacts the decision to drink. On the other hand, we can do future research to examine the influence of peer pressure on quitting drinking. We may utilize peer pressure to limit alcohol use and the number of drinkers if there is a relationship between drinking and quitting.
Funding Statement: The authors received no specific funding for this study.
Conflicts of Interest: The authors declare that they have no conflicts of interest to report regarding the present study.
References
1. World Health Organization (2022). World health statistics 2022: Monitoring health for the SDGs, sustainable development goals. World Health Organization. [Google Scholar]
2. World Health Organization (2021). Global alcohol action plan 2022–2030 to strengthen implementation of the global strategy to reduce the harmful use of alcohol. Second draft. World Health Organization. [Google Scholar]
3. World Health Organization (2022). WHO global information system on alcohol and health [online database], global health observatory data. https://www.who.int/data/gho/data/themes/topics/topic-details/GHO/levels-of-consumption [Google Scholar]
4. Nontarak, J., Geater, A. F., Assanangkornchai, S., Aekplakorn, W. (2022). Expected years of life lost due to alcohol consumption in Thai adults: A 16-year follow-up cohort of national health examination survey 2004–2019. Alcohol and Alcoholism, 57(4), 490–499. https://doi.org/10.1093/alcalc/agab075 [Google Scholar] [PubMed] [CrossRef]
5. Wakabayashi, M., McKetin, R., Banwell, C., Yiengprugsawan, V., Kelly, M. et al. (2015). Alcohol consumption patterns in Thailand and their relationship with non-communicable disease. BMC Public Health, 15(1), 1–9. https://doi.org/10.1186/s12889-015-2662-9 [Google Scholar] [PubMed] [CrossRef]
6. Leibenstein, H. (1950). Bandwagon, snob, and veblen effects in the theory of consumers’ demand. The Quarterly Journal of Economics, 64(2), 183–207. https://doi.org/10.2307/1882692 [Google Scholar] [CrossRef]
7. Becker, G. S. (1974). A theory of social interactions. Journal of Political Economy, 82(6), 1063–1093. https://doi.org/10.1086/260265 [Google Scholar] [CrossRef]
8. Becker, G. (1992). Habits, addictions, and traditions. Kyclos, 45(3), 327–345. https://doi.org/10.1111/j.1467-6435.1992.tb02119.x [Google Scholar] [CrossRef]
9. Becker, G. S., Murphy, K. M. (1988). A theory of rational addiction. Journal of Political Economy, 96(4), 675–700. https://doi.org/10.1086/261558 [Google Scholar] [CrossRef]
10. Becker, G. S., Murphy, K. M. (2009). Social economics. In: Social economics. USA: Harvard University Press. [Google Scholar]
11. Lindbeck, A., Nyberg, S., Weibull, J. W. (1999). Social norms and economic incentives in the welfare state. The Quarterly Journal of Economics, 114(1), 1–35. https://doi.org/10.1162/003355399555936 [Google Scholar] [CrossRef]
12. Rice, N., Carr-Hill, R., Dixon, P., Sutton, M. (1998). The influence of households on drinking behaviour: A multilevel analysis. Social Science & Medicine, 46(8), 971–979. https://doi.org/10.1016/S0277-9536(97)10017-X [Google Scholar] [PubMed] [CrossRef]
13. Clasen, D. R., Brown, B. B. (1985). The multidimensionality of peer pressure in adolescence. Journal of Youth and Adolescence, 14(6), 451–468. https://doi.org/10.1007/BF02139520 [Google Scholar] [PubMed] [CrossRef]
14. Clark, A. E., Lohéac, Y. (2007). “It wasn’t me, it was them!” social influence in risky behavior by adolescents. Journal of Health Economics, 26(4), 763–784. https://doi.org/10.1016/j.jhealeco.2006.11.005 [Google Scholar] [PubMed] [CrossRef]
15. Gaviria, A., Raphael, S. (2001). School-based peer effects and juvenile behavior. Review of Economics and Statistics, 83(2), 257–268. https://doi.org/10.1162/00346530151143798 [Google Scholar] [CrossRef]
16. Lundborg, P. (2006). Having the wrong friends? peer effects in adolescent substance use. Journal of Health Economics, 25(2), 214–233. https://doi.org/10.1016/j.jhealeco.2005.02.001 [Google Scholar] [PubMed] [CrossRef]
17. Kremer, M., Levy, D. M. (2003). Peer effects and alcohol use among college students. Journal of Economic Perspectives, 22, 189–206. [Google Scholar]
18. Jamison, J., Myers, L. B. (2008). Peer-group and price influence students drinking along with planned behaviour. Alcohol & Alcoholism, 43(4), 492–497. https://doi.org/10.1093/alcalc/agn033 [Google Scholar] [PubMed] [CrossRef]
19. Scull, T. M., Kupersmidt, J. B., Parker, A. E., Elmore, K. C., Benson, J. W. (2010). Adolescents’ media-related cognitions and substance use in the context of parental and peer influences. Journal of Youth and Adolescence, 39(9), 981–998. https://doi.org/10.1007/s10964-009-9455-3 [Google Scholar] [PubMed] [CrossRef]
20. Case, A., Katz, L. F. (1991). The company you keep: The effects of family and neighborhood on disadvantaged youths. In: Working paper 3705. USA: National Bureau of Economic Research. [Google Scholar]
21. Studer, J., Baggio, S., Deline, S., N’Goran, A. A., Henchoz, Y. et al. (2014). Peer pressure and alcohol use in young men: A mediation analysis of drinking motives. International Journal of Drug Policy, 25(4), 700–708. https://doi.org/10.1016/j.drugpo.2014.02.002 [Google Scholar] [PubMed] [CrossRef]
22. Luecha, T., van Rompaey, B., Peremans, L. (2021). From abstainer to current drinker: A qualitative investigation of the process of alcohol use initiation among early adolescents in Thailand. Journal of Ethnicity in Substance Abuse, 1–15. https://doi.org/10.1080/15332640.2021.1897050 [Google Scholar] [PubMed] [CrossRef]
23. Sonthon, P., Janma, N., Saengow, U. (2021). Association between age at first alcohol use and heavy episodic drinking: An analysis of Thailand’s smoking and alcohol drinking behavior survey 2017. PLoS One, 16(11), e0259589. https://doi.org/10.1371/journal.pone.0259589 [Google Scholar] [PubMed] [CrossRef]
24. Wichaidit, W., Sittisombut, M., Assanangkornchai, S., Vichitkunakorn, P. (2021). Self-reported drinking behaviors and observed violation of state-mandated social restriction and alcohol control measures during the COVID-19 pandemic: Findings from nationally-representative surveys in Thailand. Drug and Alcohol Dependence, 221, 108607. https://doi.org/10.1016/j.drugalcdep.2021.108607 [Google Scholar] [PubMed] [CrossRef]
25. Yangyuen, S., Mahaweerawat, C., Thitisutthi, S., Mahaweerawat, U. (2021). Relationship between health literacy in substance use and alcohol consumption and tobacco use among adolescents, Northeast Thailand. Journal of Education and Health Promotion, 10, 120. https://doi.org/10.4103/jehp.jehp_603_20 [Google Scholar] [PubMed] [CrossRef]
26. Wibulpolprasert, S. (2005). Thailand health profile 2001–2004. Bangkok: Bureau of Policy and Strategy, Ministry of Public Health. [Google Scholar]
27. Rattanawibool, S. (2007). Blood alcohol concentrations after “one standard drink” in Thai healthy volunteers. Journal of the Medical Association of Thailand, 90(6), 1137–1142. [Google Scholar] [PubMed]
28. Rehm, J., Neufeld, M., Room, R., Sornpaisarn, B., Stelemekas, M. et al. (2021). The impact of alcohol taxation changes on unrecorded alcohol consumption: A review and recommendations. International Journal of Drug Policy, 99, 103420. [Google Scholar]
29. Newman, I. M., Shell, D. F., Li, T., Innadda, S. (2006). Buddhism and adolescent alcohol use in Thailand. Substance Use & Misuse, 41(13), 1789–1800. https://doi.org/10.1080/10826080601006490 [Google Scholar] [PubMed] [CrossRef]
30. Pensuksan, W. C., Taneepanichskul, S., Williams, M. A. (2010). A peer-drinking group motivational intervention among Thai male undergraduate students. International Journal of Drug Policy, 21(5), 432–436. https://doi.org/10.1016/j.drugpo.2010.02.005 [Google Scholar] [PubMed] [CrossRef]
31. Miller, B. A., Byrnes, H. F., Cupp, P. K., Chamratrithirong, A., Rhucharoenpornpanich, O. et al. (2011). Thai parenting practices, family rituals and risky adolescent behaviors: Alcohol use, cigarette use and delinquency. International Journal of Child and Adolescent Health, 4(4), 367–378. [Google Scholar] [PubMed]
32. Wongtongkam, N., Ward, P. R., Day, A., Winefield, A. H. (2014). The influence of protective and risk factors in individual, peer and school domains on Thai adolescents’ alcohol and illicit drug use: A survey. Addictive Behaviors, 39(10), 1447–1451. https://doi.org/10.1016/j.addbeh.2014.05.026 [Google Scholar] [PubMed] [CrossRef]
33. Bramoullé, Y., Djebbari, H., Fortin, B. (2009). Identification of peer effects through social networks. Journal of Econometrics, 150(1), 41–55. https://doi.org/10.1016/j.jeconom.2008.12.021 [Google Scholar] [CrossRef]
34. Comola, M. (2008). Educational programs in rural Nepal: Peer communication and information spillovers. SSRN, 1019237. https://doi.org/10.2139/ssrn.1019237 [Google Scholar] [CrossRef]
35. Sacerdote, B. (2001). Peer effects with random assignment: Results for dartmouth roommates. The Quarterly Journal of Economics, 116(2), 681–704. https://doi.org/10.1162/00335530151144131 [Google Scholar] [CrossRef]
36. Conley, T. G., Udry, C. R. (2004). Learning about a new technology: Pineapple in Ghana. American Economic Review, 100(1), 35–69. [Google Scholar]
37. Bandiera, O., Barankay, I., Rasul, I. (2007). Social incentives: The causes and consequences of social networks in the workplace. UK: London School of Economics. [Google Scholar]
38. Manski, C. F. (1993). Identification of endogenous social effects: The reflection problem. The Review of Economic Studies, 60(3), 531–542. https://doi.org/10.2307/2298123 [Google Scholar] [CrossRef]
39. Manski, C. F. (2000). Economic analysis of social interactions. Journal of Economic Perspectives, 14(3), 115–136. https://doi.org/10.1257/jep.14.3.115 [Google Scholar] [CrossRef]
40. Moffitt, R. A. (2001). Policy interventions, low-level equilibria, and social interactions. Social Dynamics, 4(45–82), 6–17. [Google Scholar]
41. Brock, W. A., Durlauf, S. N. (2001). Interactions-based models. In: Handbook of econometrics, vol. 5, pp. 3297–3380. Amsterdam: Elsevier. [Google Scholar]
42. Brock, W. A., Durlauf, S. N. (2007). Identification of binary choice models with social interactions. Journal of Econometrics, 140(1), 52–75. https://doi.org/10.1016/j.jeconom.2006.09.002 [Google Scholar] [CrossRef]
43. Blume, L. E., Brock, W. A., Durlauf, S. N., Jayaraman, R. (2015). Linear social interactions models. Journal of Political Economy, 123(2), 444–496. https://doi.org/10.1086/679496 [Google Scholar] [CrossRef]
44. Blume, L. E., Durlauf, S. N. (2005). Identifying social interactions: A review. Madison: Social Systems Research Institute, University of Wisconsin. [Google Scholar]
45. Lee, L. F., Yu, J. (2010). Estimation of spatial autoregressive panel data models with fixed effects. Journal of Econometrics, 154(2), 165–185. https://doi.org/10.1016/j.jeconom.2009.08.001 [Google Scholar] [CrossRef]
46. Waleewong, O. (2017). Moving Thailand’s mountain of alcohol-related harm. Bull World Health Organ, 95, 487–488. https://doi.org/10.2471/BLT.17.020717 [Google Scholar] [PubMed] [CrossRef]
47. Wasi, N., Paweenawat, S. W., Ayudhya, C. D. N., Treeratpituk, P., Nittayo, C. (2019). Labor income inequality in Thailand: The roles of education, occupation and employment history. Bangkok: Puey Ungphakorn Institute for Enonomic Research. [Google Scholar]
48. Lee, L. F., Li, J., Lin, X. (2014). Binary choice models with social network under heterogeneous rational expectations. Review of Economics and Statistics, 96(3), 402–417. https://doi.org/10.1162/REST_a_00401 [Google Scholar] [CrossRef]
49. Alcohol Beverage Control Act (2008). Alcohol Beverage Control Act B.E. 2551. Bankong: Royal Thai Government Gazette. [Google Scholar]
50. Sherman, D. K. (2013). Self-affirmation: Understanding the effects. Social and Personality Psychology Compass, 7(11), 834–845. https://doi.org/10.1111/spc3.12072 [Google Scholar] [CrossRef]
Cite This Article
 Copyright © 2023 The Author(s). Published by Tech Science Press.
This work is licensed under a Creative Commons Attribution 4.0 International License , which permits unrestricted use, distribution, and reproduction in any medium, provided the original work is properly cited.
 Downloads
 Citation Tools