
 Submit a Paper
 Propose a Special lssue
 Open Access
ARTICLE
An Open and Adaptable Approach to Vulnerability Risk Scoring
1 Kaze Technologies, Kaze Consulting, Bath, BA1 2HN, UK
2 School of Mathematics, University of Bristol, Bristol, BS8 1UG, UK
* Corresponding Author: Harri Renney. Email:
Journal of Cyber Security 2025, 7, 221-238. https://doi.org/10.32604/jcs.2025.064958
Received 28 February 2025; Accepted 28 June 2025; Issue published 14 July 2025
 View Full Text
 Download PDF
Abstract
In recent years, the field of cybersecurity has expanded to encompass a deeper understanding of best practices, user behaviour, and the tactics, motivations, and targets of threat actors. At the same time, there is growing interest in how cyber data analytics can support informed decision-making at senior levels. Despite the broader advancements, the field still lacks a robust scientific foundation for accurately calculating cyber vulnerability risk. Consequently, vulnerabilities in hardware and software systems often remain unaddressed for extended periods, undermining the effectiveness of risk mitigation efforts. This paper seeks to address the gap in vulnerability risk prioritisation by defining a repeatable approach for building risk prioritisation formulae by detailing the building blocks necessary for practitioners to develop tailored vulnerability risk scoring systems. The approach leverages a two-layered system, where the global layer calculates vulnerability risk per CVE, and the local layer continues to enrich the global CVE risk with additional contextual components per organisational system(s). To demonstrate the approach, an exemplar system called the V-Score was developed and evaluated in a user study. During the study, a vulnerability management team transitioned from using the CVSS score to the V-Score. Results indicate that the V-Score delivered improved risk prioritisation distributions, enhanced user experience, and provided greater predictive accuracy. Specifically, when identifying high-risk vulnerabilities referenced by the CERT Coordination Center, the V-Score achieved 75% accuracy and 52% recall, compared to 39% accuracy and 18% recall for the CVSS score. Thus, this paper addresses the identified gap in scientifically grounded risk calculation methods and contributes to the advancement of knowledge across both academic and industry domains.Keywords
Hardware and software vulnerabilities have been a widespread concern since the adoption of computer technology. Yet, it was not until 1999 that vulnerabilities could be addressed using a common standard called the Common Vulnerabilities and Exposures (CVE) [1]. The CVE standard made coordinating and communicating vulnerability information possible and encouraged authorities and vendors to disclose vulnerabilities. Before 2004, disclosing and publishing vulnerability information was often considered bad practice for fear of being exploited [2]. However, the growing evidence suggests that the contrary is true [3–5], and secrecy in vulnerability security has limited circumstantial benefits [2]. Organisations once relying on secrecy are now encouraged by institutes like the United States National Institute of Standards and Technology (NIST) to engage in vulnerability disclosure [6] and instead now depend upon strong security paradigms and governance, such as secure by design (SbD) principles [7,8] and proactive risk management [9]. Consequently, the shift toward open disclosure is reshaping the vulnerability management landscape, introducing complex new taxonomies [10] and generating vast volumes of publicly available data [11] that must be continuously processed and managed to maintain effectiveness. Fig. 1a illustrates the growing number of vulnerabilities released yearly by the National Vulnerability Database (NVD). The volume of newly disclosed vulnerabilities continues to grow annually, and this trend is expected to continue at a similar pace. At the time of writing, there are now 280,000+ vulnerabilities that require technological solutions to manage effectively; indeed, intelligent and autonomous prioritisation of vulnerabilities is now essential to optimising vulnerability triage. Investigations conducted by Positive Technologies in 2021 [12] revealed that the average organisation had approximately 1066 known vulnerabilities. Similarly, a study by Mend.io examining 1000 companies [13] found that, on average, only 13% of vulnerabilities were remediated, and the typical time to patch a vulnerability from its CVE publication was 271 days. These findings highlight a critical challenge: most organisations lack the resources and capacity to remediate all known vulnerabilities. As a result, effective prioritisation is essential, and organisations must focus their limited remediation efforts on addressing the highest-risk vulnerabilities first. Fig. 1b presents a conceptual diagram illustrating an organisation’s full theoretical vulnerability landscape (in grey), a subset of which represents vulnerabilities likely to be targeted and exploited (in red). The objective is to maximise the overlap between limited remediation capacity (in green) and these high-risk vulnerabilities to reduce potential exploitation. This conceptual idea is the goal of vulnerability management, to optimise the triage of vulnerabilities to remediate the vulnerabilities that are most likely to be exploited within the limits of an organisation’s resource-restricted remediation capability. Arbitrarily remediating vulnerabilities at random is inefficient; instead, data-driven risk prioritisation is essential during triage to ensure that an organisation’s limited remediation capacity is focused on the highest-risk vulnerabilities.
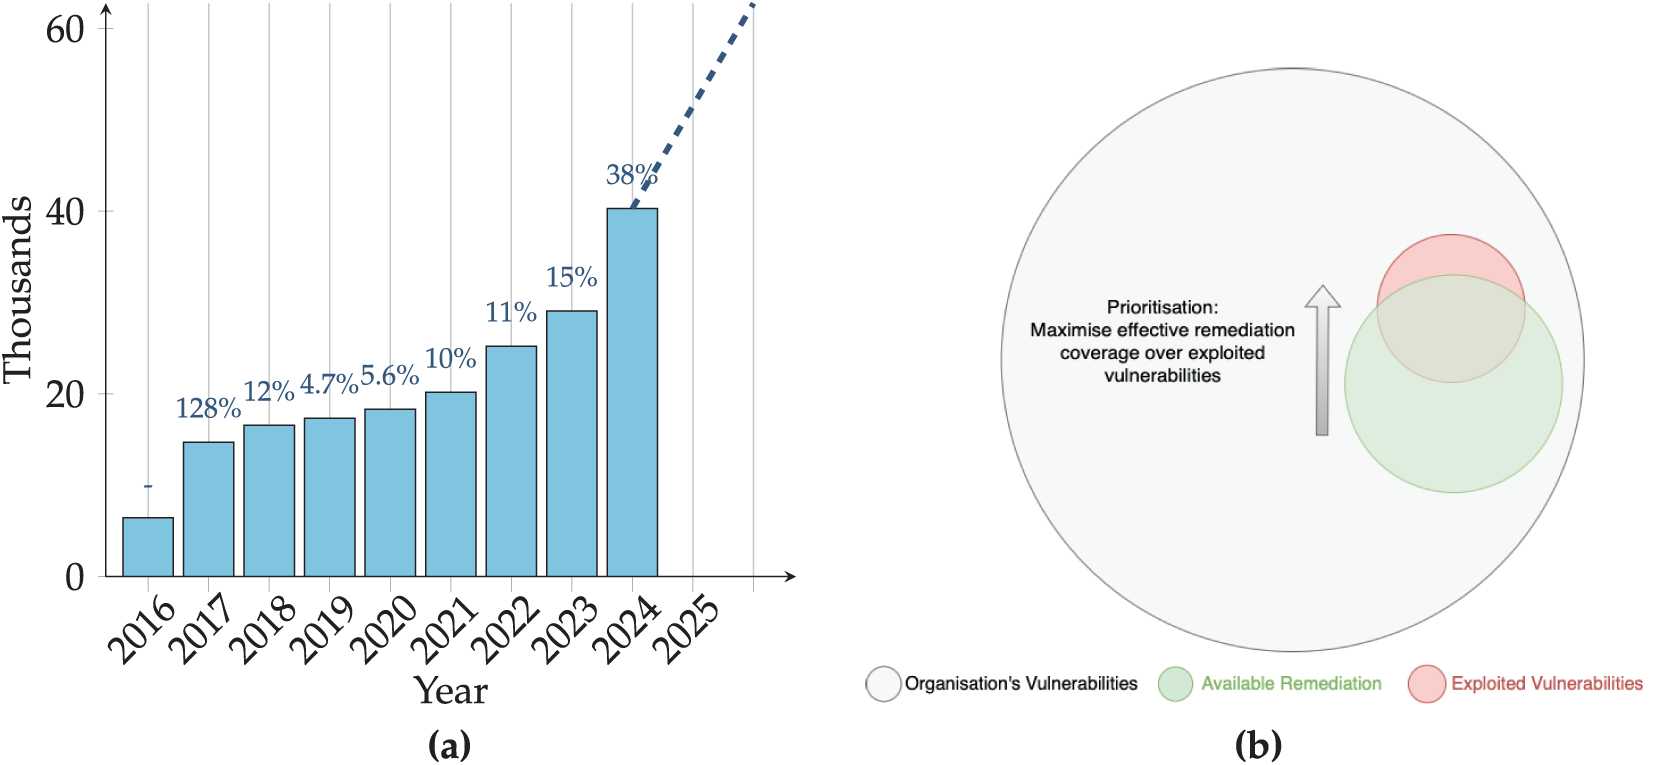
Figure 1: (a) Number of vulnerabilities published by the NVD per year. Percentage increases are calculated from the previous year. (b) Concept diagram illustrating vulnerability landscape
There already exist well-defined methods to effectively calculate vulnerability risk, such as those covered by NIST 8286 [14] and the Bayesian approach detailed by Open Group in Open-FAIR [15]. The issue with these methods is that they require considerable resources, personnel time, and often access to experts to correctly model quantifiable risk. Hence, these methods are not economically viable for small to medium sized enterprises (SMEs) [16,17]. As an alternative, autonomous prioritisation algorithms and technological solutions offer an alternative to accessible and cost-effective vulnerability management.
This paper covers the relevant literature review in Section 2, including an overview of existing Open Source Intelligence (OSINT) risk components for risk impact in Section 2.1, risk exploitability in Section 2.2 and a review of existing vulnerability risk calculation methodologies in Section 2.3. In Section 3, this paper proposes the approach for building risk scoring systems in detail, from core fundamentals through to the combined arrangements for calculating the global risk of CVEs in Section 3.1, to the localised risk of vulnerability instances in Section 3.2. Using this methodology to build a novel vulnerability risk scoring system, the V-Score is explicitly defined in Section 4. The V-Score is evaluated in Section 5 with a review of the global scores’ distribution in Section 5.1 and suggestive evidence of effectiveness gathered from the user study in Section 5.2. As the authors believe that public vulnerability disclosure has improved vulnerability management, they hope that open and transparent risk calculations can do the same. This contribution is discussed in Section 6, where the results and concepts of future work are summarised.
This section provides an overview of the prerequisite background on the existing OSINT vulnerability risk impact components in Section 2.1, exploitability components in Section 2.2, and other existing approaches to scoring risk for prioritisation purposes in Section 2.3.
In Cybersecurity, impact is recognised as the negative consequences experienced by an individual or organisation when a cyber incident occurs. The impact can be represented in various forms, most commonly as either ordinal or quantitative values [18]. One of the most widely recognised and openly accessible scores that captures a subset of impact for CVEs is the Common Vulnerability Scoring System (CVSS). Released by the NIST in 2005 [19], the CVSS has become the de facto standard for assessing vulnerability impact severity across industry and government organisations [20]. Undergoing multiple iterations of changes from CVSS v1 in 2005 to the latest in-use CVSS v3 [21,22]1, the current definition employs a multi-dimensional metric system comprising three primary categories: Base, Temporal, and Environmental. The metrics within each category are designed to be manually assessed and input by a vulnerability expert [23]. The Base score reflects general severity attributes and is typically provided by the vulnerability’s disclosing authority (i.e., the supplier). In contrast, consumers of the CVSS score are responsible for populating the Temporal metrics, which account for factors that may evolve over time, and the Environmental metrics capture context-specific elements unique to the user’s operational environment. Despite widespread adoption, the CVSS Score suffers from several well-documented limitations [24]. The system employs ordinal categories (e.g., “Low,” “Medium,” “High,” “Critical”) as input metrics that lack quantitative precision, resulting in poor score diversity [25], poor score distributions (see Fig. 6) and range compression [26]. Furthermore, the metrics are prone to subjective misinterpretation between individuals submitting the metrics [27]. This subjectivity and reliance on expert human input also creates a high level of dependency, which limits the repeatability and automation capability. This has become a significant issue as, at the time of writing, the NVD has fallen considerably behind in processing CVEs and was recently reported as having a backlog of 17,000+ vulnerabilities [28]. This issue does not stop at the CVSS Base Score, as end-users tasked with enriching Temporal and Environmental metrics also struggle with human-centric design. As a result, many organisations tend to rely on the CVSS base score alone, which is intended only as a generic severity indicator and ignores the context-specific adjustments needed for effective risk management (e.g., at the time of writing, Microsoft still uses CVSS alone for prioritising risk [20]).
Research such as [29] acknowledges the issues with the CVSS score and proposes a solution for automating CVSS enrichment by defining processes for calculating environmental CVSS metrics. For example, they define a process for calculating ‘Collateral Damage Potential’ (CDP) that can be used to automate the enrichment of CVSS Environmental metrics that would otherwise require human intervention to populate. Whilst this research has merit to enhance the CVSS scoring system by automating and removing the subjectivity of CVSS environmental metrics, it remains confined to operate entirely within the CVSS system, where the Base score still has all the previously mentioned issues, and the metrics are entirely categorical, leading to ineffective distributions, low score diversity and a rigid system that does not support the inclusion of progressive metrics. In this paper, we recognise that it will be beneficial to explore a fundamentally different solution that still considers the CVSS score as a valuable component of risk, but is considered within a wider, holistic approach that considers more risk components, continuous measurements and support for adaptations outside of the strict definitions of the CVSS specification.
Occasionally, there are long delays between CVE identification and CVSS calculation. In an extreme case, CVE-2022-42475 officially had no information for 454 days [30]. Even on occasions when the NVD promptly releases an initial CVSS score, it often remains a static, unchanging score despite new risks and emerging threats evidently exploiting them. Consider CVE-2022-21894 as an example; it was identified as a universally high-risk vulnerability connected to the BlackLotus campaign as early as March 2023 [31], with further confirmation by Microsoft in April 2023 [32]. Fig. 2a2 presents approximately two months of CVSS time series data surrounding the disclosure of the BlackLotus campaign, including the confirmation of CVE-2022-21894’s role in the activity. During this period, the NVD set the CVSS score to 4.4 (Medium severity). Two years later, despite being explicitly connected to a threat campaign, the NVD has not updated it. Plotted alongside it, the V-Score (detailed in Sections 3, 4) includes evidence of exploitation and social media as inputs into the risk calculation. Therefore, on the 11th of April 2023, when Microsoft released an article documenting threat actors using CVE-2022-21894 in BlackLotus malware, the V-Score—which includes risk components tracking evidence of exploitation from Cyber Threat Intelligence (CTI) reports, exploit prediction models (EPSS score) and social media monitoring—dynamically increased. Regarding risk classification, this raised the CVE from a low-risk vulnerability to a top-priority critical vulnerability. The example of CVE-2022-21894 demonstrates a serious issue with the CVSS score’s rigidity. Relying on the CVSS alone for dynamically reflecting vulnerability risk does not work; other risk components must be combined to reflect this. It would be logical to suggest that this is precisely what the CVSS ‘Temporal’ (CVSS-T) metric enrichment is for. However, by enriching CVSS-T with the following details: high exploit code maturity (E:H), remediation level official fix (RL:O) and report confidence is confirmed (RC:C), the CVSS-T comes out even lower at 4.2. This emphasises that whilst the CVSS system acknowledges a need for temporal metrics that include measurements of likelihood, the method used to address them fails to represent the actual risk.
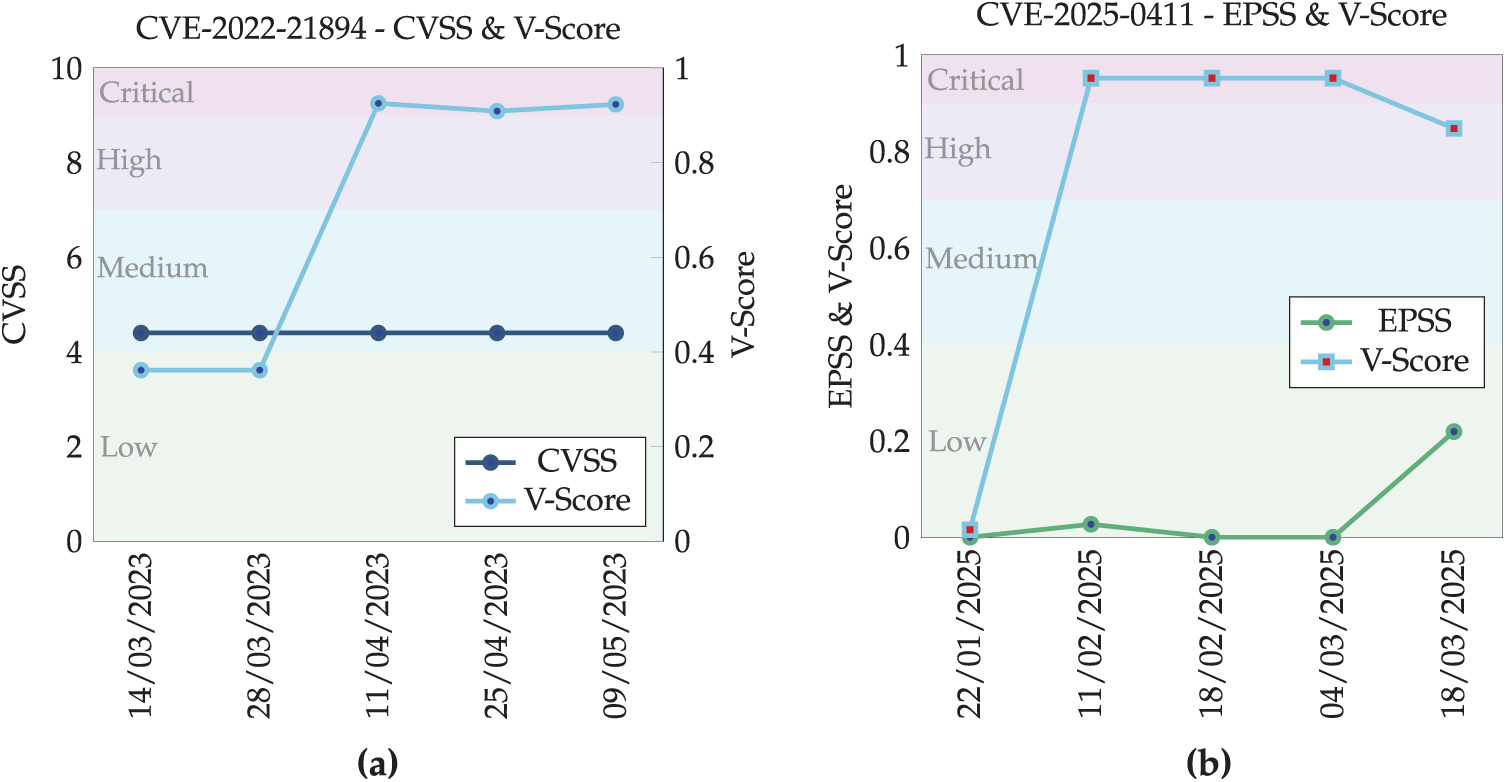
Figure 2: Examples of time-series tracking of the V-Score compared to the CVSS in (a) for CVE-2022-21894 and EPSS in (b) for CVE-2025-0411
The example of CVE-2022-21894 and the narrative around the BlackLotus campaign demonstrates that CVSS’s human-centric dependence is often too rigid and not dynamic enough to reflect changes in cyber threat intelligence quickly enough to act on them. Furthermore, as explained in NIST 800-37’s Risk Management Framework (RMF) [33], the impact must be combined with information on the likelihood of exploitation. Whilst the CVSS scoring system attempts to include metrics to capture likelihood, its strict rigidity and limited scope prevent it from dynamically reacting to outright evidence of exploitation. Therefore, additional sources of vulnerability likelihood should be considered for an accurate view of vulnerability risk.
2.2 Risk Exploitation Components
In cybersecurity, the exploitability of a vulnerability is the measurement of how often or likely a vulnerability is to be exploited “in the wild”. Evidence indicates that approximately 4%–5% of the known vulnerabilities are actively exploited [34,35]. This highlights the limited remediation capacity available to organisations and underscores the importance of prioritising vulnerabilities that are more likely to be exploited. To do this effectively requires information that factors in the likelihood of vulnerabilities being exploited. Sources of exploitability include identifying known exploits in the wild, proof of concept (PoC) exploit code, and exploit prediction models. The Exploit Prediction Score System (EPSS) is a publicly available scoring system generated using a gradient-boosted machine learning algorithm to analyse the properties and data of a vulnerability to predict the chance it will be exploited within the next 30 days [35]. The EPSS score has been demonstrated to be an effective predictor of exploitability [36]. However, as addressed by the authors of the EPSS themselves, “we must consider how EPSS and CVSS may coexist.” This aligns with what NIST has published—calculating risk requires impact and exploitability components.
As the EPSS is entirely dependent on an autonomous machine learning model, on its own, it has no way to correct for inaccuracies. This can be seen when tracking the time-series EPSS score for the 7-Zip Zero-Day Vulnerability CVE-2025-0411 in Fig. 2b. On the initial disclosure of this CVE, it was identified as the core vulnerability being exploited in the SmokeLoader malware campaign targeting Ukrainian entities [37]. Although the EPSS Score performs well statistically across the broader vulnerability landscape, exclusive reliance on it can be problematic. Notably, there are edge cases, such as CVE-2025-0411, where clearly high-risk vulnerabilities are under-represented or misclassified by the EPSS model. In contrast, the V-Score plotted alongside incorporates additional risk components, including cyber threat intelligence (CTI) reports released on 23 January 2025 and the vulnerability’s inclusion in the Cybersecurity and Infrastructure Security Agency (CISA) Known Exploited Vulnerabilities (KEV) catalogue on 8 February 2025. Furthermore, the V-Score tracked significant social media engagement related to this CVE, with the audience size peaking at 563,928 on 17 February 2025. By calculating all these sources holistically, the V-Score generates a critical risk score of 0.95 during this period, whilst the EPSS score misclassified the vulnerability as low risk, assigning it a score of just 0.21.
Researchers in [38] found that between 2015 and 2017, a quarter of CVEs were first identified on social media platforms prior to their official publication in the NVD. For these cases, the average time lag between initial social media detection and NVD publication was 87 days. On top of these delays, the NVD has accumulated a backlog of over 17,000 CVEs lacking CVSS scores. By including additional components for tracking CVEs on social media, a scoring system can provide insights into these gaps. For these reasons, the authors suggest the inclusion of social media tracking risk components when calculating vulnerability risk scores.
Naturally, cybersecurity vendors operating in the vulnerability management industry have developed and released details on their own risk scoring systems. The authors have extensively examined the documentation released on several notable vulnerability risk scoring systems by industry leaders selling proprietary solutions in this field. From their descriptions, several scoring systems support the basic RMF principles by NIST [33], including vulnerability impact, exploitability and organisational context within their scoring systems. However, a key feature missing from all the proprietary scores is a fully disclosed, explicit and reproducible scoring system. For instance, CISCO’s Kenna [39] makes the following claim: “Our predictive modelling forecasts the weaponisation of new vulnerabilities with a confirmed 94% accuracy rate...”. Statements like these are observed from various cyber security vendors but are meaningless without explicitly referencing their open experimental methodology and results. Another vendor reviewed was Orpheus, whose OVSS scoring system is described in their white paper [40]. However, the paper uses ambiguous explanations, such as the question “Is this vulnerability actively exploited now?”, to describe its scoring components, without providing any quantifiable metrics or replicable methodology.
None of the vulnerability risk calculation methods reviewed by the authors provided a clear definition, reproducible methodology, or evidence of rigorous effectiveness testing. Instead, these approaches appear to rely primarily on organisational reputation and brand credibility to instil confidence in their risk scores, despite the absence of scientifically validated evidence supporting their effectiveness. Only by openly evaluating scoring systems with repeatable experiments and peer-reviewed testing can the effectiveness of these scoring systems be determined. In answer to this, we present an open approach for vulnerability risk scoring that is fully transparent and adaptive to support bespoke requirements.
3 Adaptable Vulnerability Risk Scoring
The proposed methodology for designing an openly transparent and adaptable vulnerability risk scoring system using OSINT components is first introduced in Section 3.1, focusing on CVEs within a universal or global context. Section 3.2 then builds on this foundation to demonstrate how global CVE risk can inform the development of localised, organisational risk assessments for specific systems or devices.
According to NIST’s widely accepted definition of cyber security risk, it is fundamentally a combination of vulnerability impact and the likelihood of exploitation [33]. When combining these two components to calculate risk, it is logical to start with a uniformly weighted sum,
Instead of uniformly distributing the weight of each component in the risk calculation, variable weights can be added to control the influence of each risk component. This can be done by modifying the uniformly weighted sum into a distributed weighted sum algorithm
As covered in Section 2, there are numerous sources of openly available official and unofficial vulnerability impact and likelihood information. Among these, the most comprehensive are the CVSS score for assessing impact and the EPSS score for estimating likelihood. Utilising these metrics to represent the abstract components of impact
So far, the equation reflects the widely accepted definition of cyber risk and provides data sources for the chosen components from openly accessible and up-to-date datasets. From here, it will be useful to continue expanding the equation to include further sources of risk impact and likelihood. By adding an additional component
In this paper, the approach for monitoring CVEs on X (formerly Twitter) involves aggregating the total number of followers across all user accounts that mention a specific CVE within a 30-day window.4 In order to use the aggregated CVE audience count
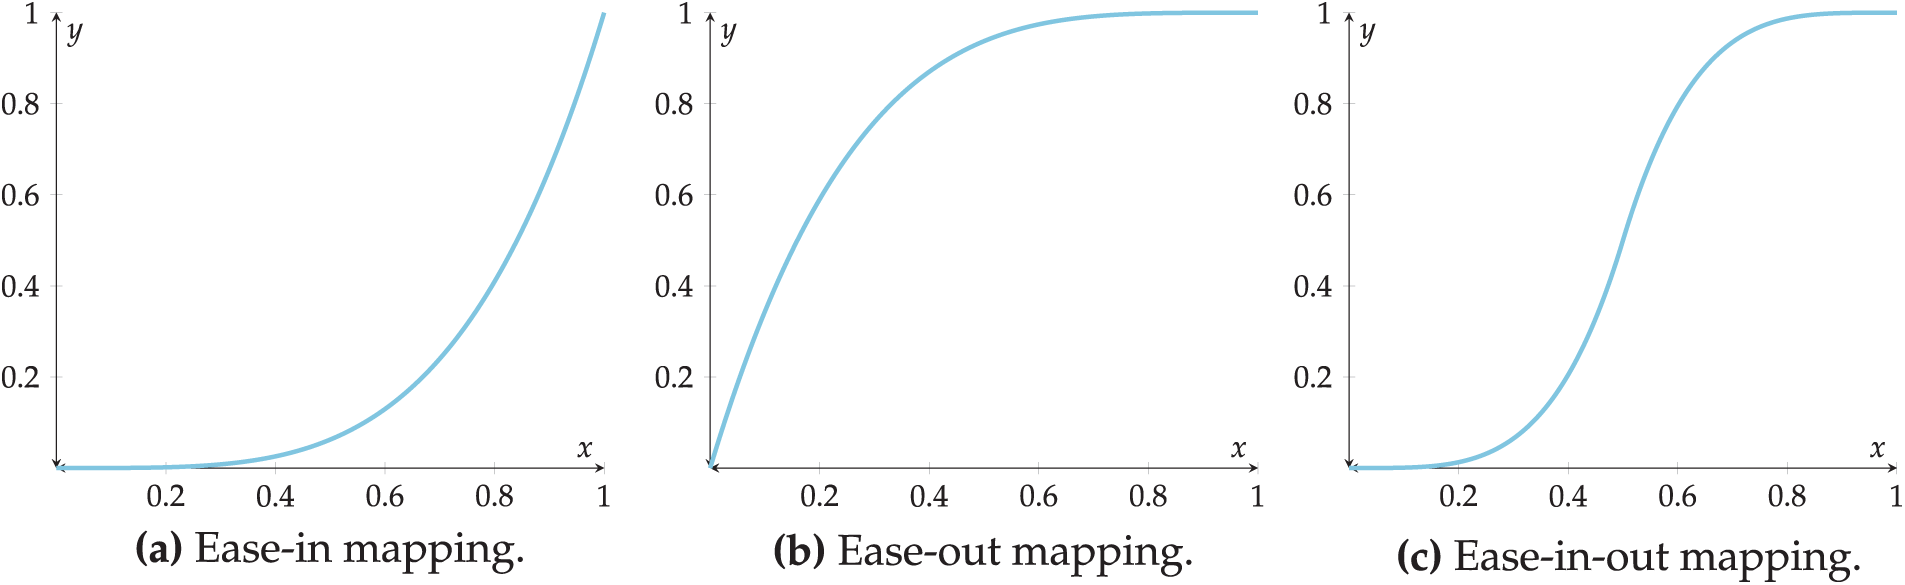
Figure 3: Collection of useful mapping functions
Of the three mapping functions in Fig. 3, the ease-in-out mapping in Fig. 3c is an appropriate mapping for converting the exposed social media count to a component of the risk calculation. This function eases into and then back out of the influence this component has as it scales, starting with little influence for small values, then accelerating to considerable influence for the middle range of values before tapering off to continue increasing, but with diminishing returns. An example of such an ease-in-out function for mapping the raw social media count
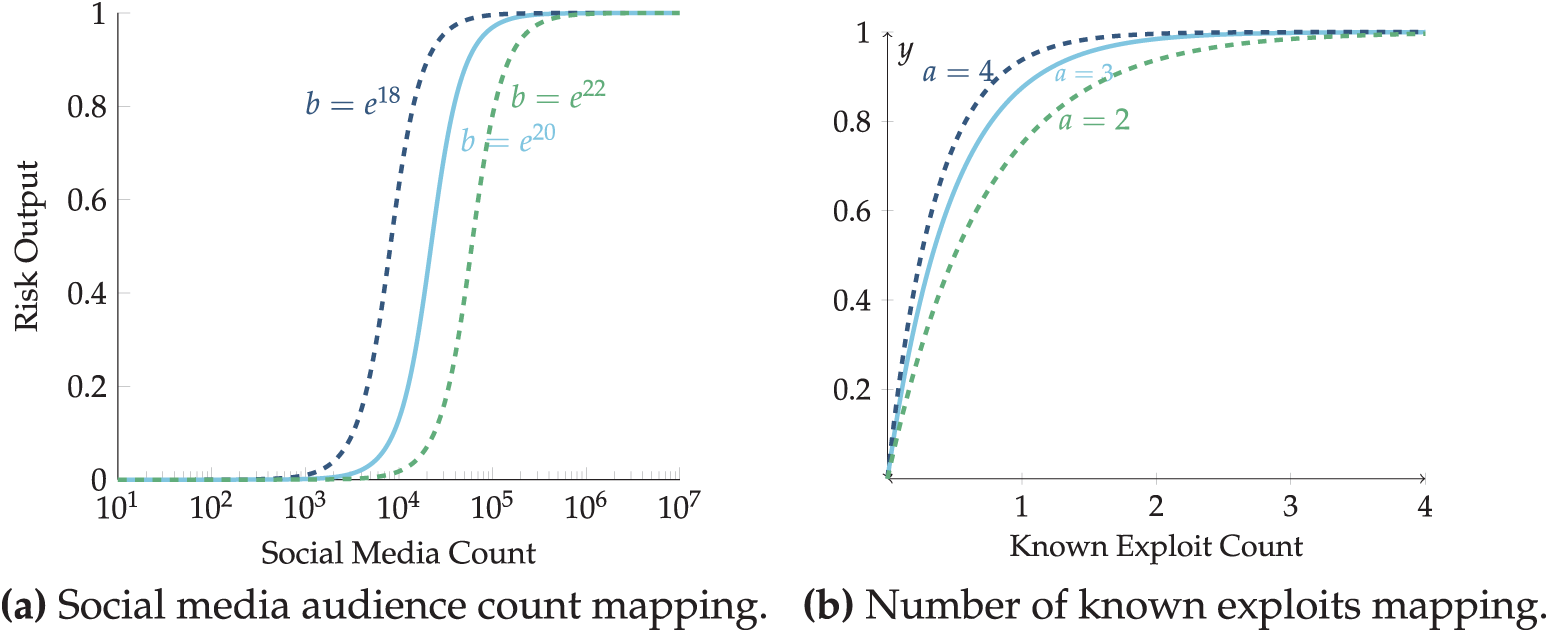
Figure 4: Collection of mapping function shapes
As more components are added to the equation, a method for handling missing components should be defined. For example, CVE-2023-45866 on the 12th of December 2023 had no CVSS or EPSS score, but discussions of this CVE reached a substantial 228,400 social media accounts. If these missing components
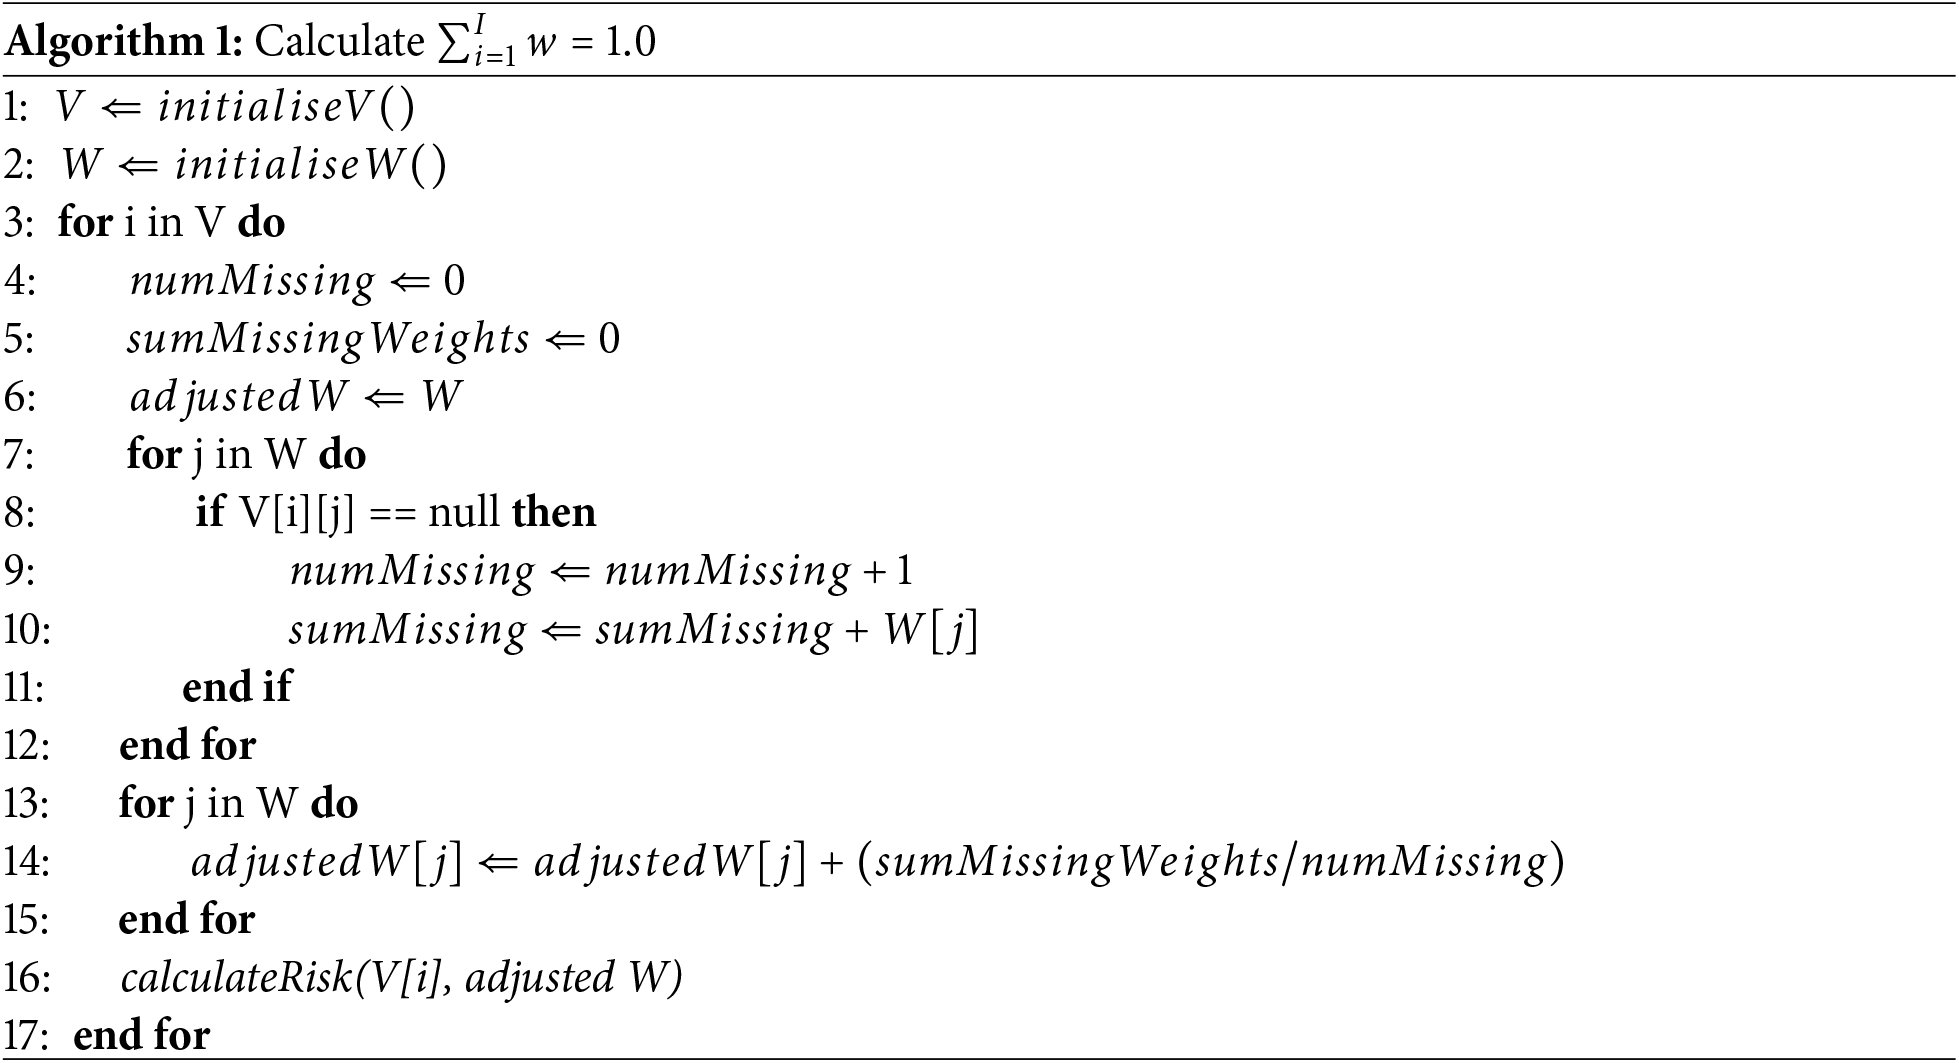
Alternatives to uniformly distributing the weights of the missing components exist; for example, the weights can be distributed proportionally. To do this, line 14 would need to be replaced by
To summarise the approach outlined in this section, calculating general vulnerability risk can now be condensed into the following steps:
1. Identify the specific risk components that will represent impact and likelihood in the risk calculation.
2. Convert the raw data underlying each selected component into a normalised range
3. Configure the relative weights for each normalised component based on their significance to the organisation.
4. Iteratively evaluate and refine the risk calculation by adjusting weights and component selection according to the previous steps to align with evolving organisational requirements.
The approach defined so far only considers the scope of the universal context of generalised CVE risk and is visualised in the CVE layer of the V-Score in Fig. 5a. For many, the universal CVE risk provides enough value for their risk management needs. However, according to the international standard ISO/IEC 27005 [42], integrating organisational context is required for effective risk assessment. To support this, a localised layer of calculations (the VI layer of Fig. 5a) can be applied to the output of the global CVE risk and combined with contextual-level components.
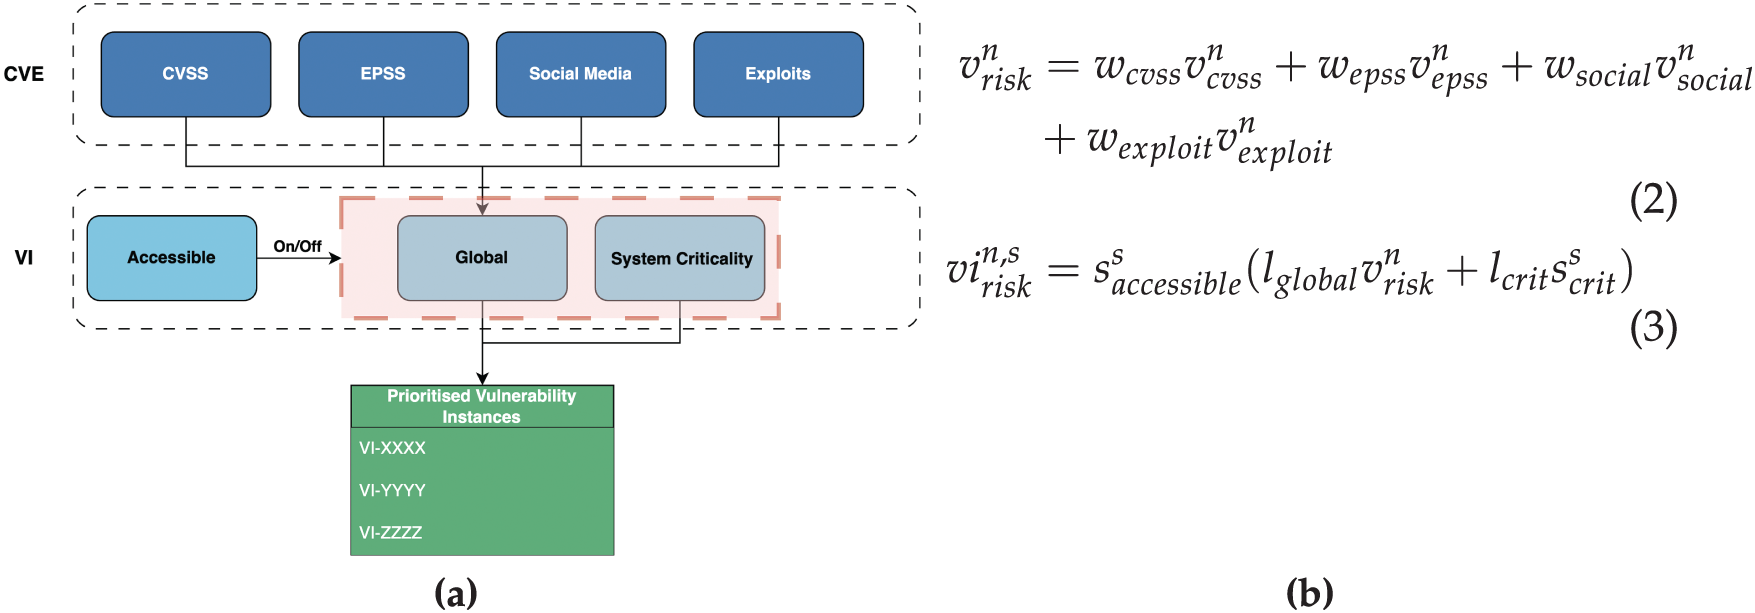
Figure 5: V-Score concept diagram (a) with global and local risk calculation definitions in (b)
The same foundational components introduced in Section 3.1 are repurposed in the local layer to construct risk elements tailored to the organisational context. A new equation is formed for calculating the risk of vulnerability instances (VIs) of CVEs on a system/asset by combining the CVE’s risk
Once a prioritised list of vulnerability instances
where S is the number of systems on which the vulnerability
Based on the approach outlined in this paper, a transparent and configurable vulnerability risk scoring system, referred to as the V-Score, has been developed and evaluated. The V-Score was designed by a consulting team in collaboration with an active vulnerability management (VM) team5 whose responsibility was to secure and protect critical infrastructure for various ministerial government departments. The VM team was comprised of three expert cyber security analysts, each with at least three years of experience in patching, compliance, and vulnerability remediation. Through a series of workshops, these experts explained the components needed to evaluate vulnerability risk effectively. As a result, the scoring system, including each component’s influence level (weight), was determined. A conceptual diagram of the V-Score is provided in Fig. 5a alongside the global and local risk calculation formulae used in this study (Eqs. (2) and (3), respectively). The global layer follows the approach from Section 3 with the addition of a known exploits component
The V-Score’s local risk
Evaluating the effectiveness of a vulnerability risk scoring system is a challenging task. Ideally, an observational study is needed to monitor the number of cyber security incidents before and after introducing a new vulnerability scoring system [44]. However, this takes considerable time to organise, review and analyse. In this fast-moving field, preliminary evidence of effectiveness can offer suggestive insights that may be validated and reproduced through future research. The suggestive evidence collected to evaluate the V-Score’s effectiveness is assessed in direct comparison to the CVSS score, serving as a relative benchmark. These comparisons are first demonstrated through trend and distribution analysis in Section 5.1, followed by user experience feedback, remediation performance monitoring and predictive accuracy of high-risk vulnerabilities in Section 5.2.
One of the most common observations and criticisms of the CVSS score is that the distribution of the scores is mostly grouped towards the upper end of the range and has low dispersion [45]. At the time of writing, the histogram in Fig. 6 was recorded as showing 85,061 out of 150,589 (
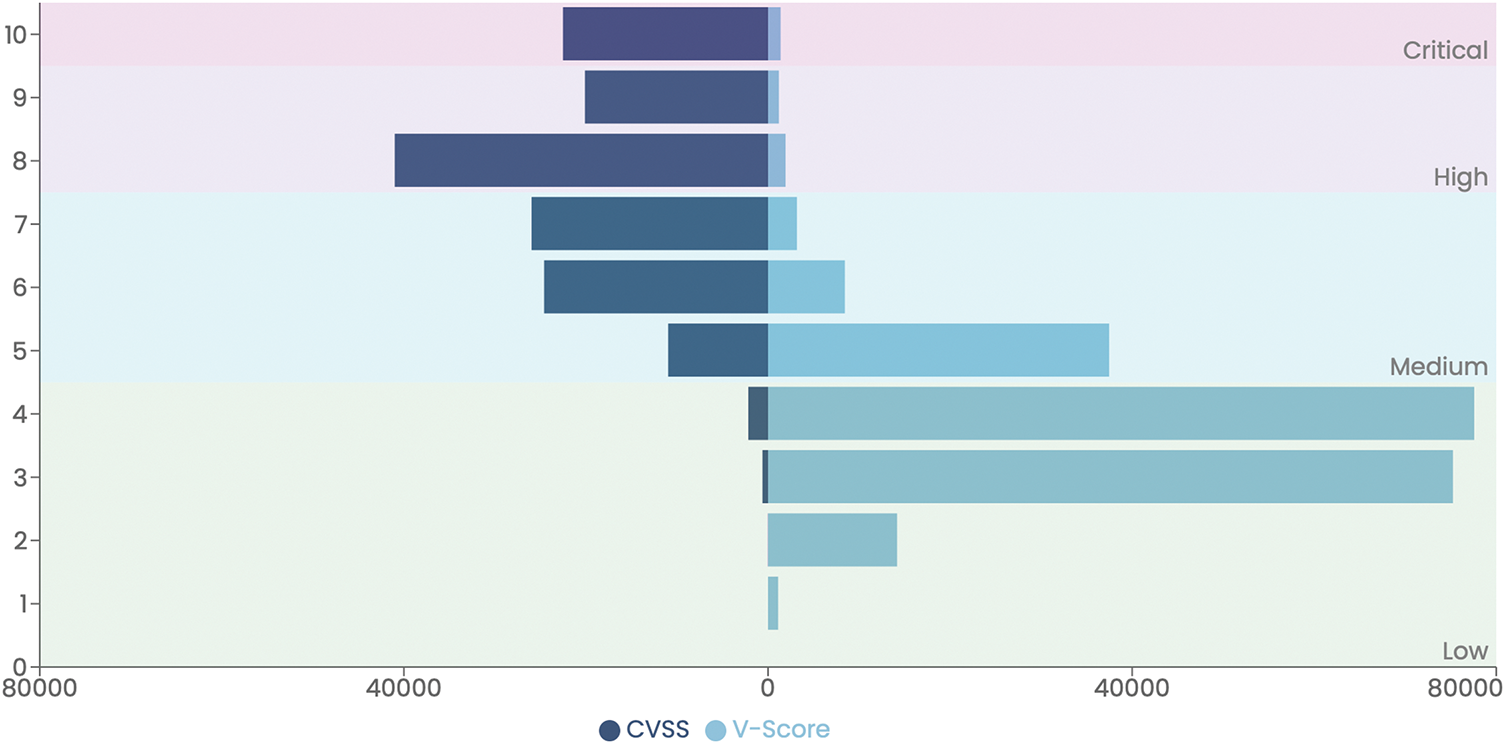
Figure 6: Histogram distribution of the CVSS and V-Scores normalised to a similar range [0, 10]
The small user study gathers the experience and remediation data from a VM team of three professionals comprising an organisation’s dedicated Patching and Compliance team. This team is responsible for issuing vulnerability remediation mandates across thousands of devices, prioritising limited remediation efforts to achieve maximum risk reduction. The observed VM team have gone through the process of previously using the CVSS score as their primary data source for vulnerability prioritisation and then transitioning to the V-Score as defined in Eqs. (2) and (3). During the transition from the CVSS score to the V-Score, the team agreed to anonymously record and share a number of their high-level remediation activities. Further, they agreed to complete a user survey after 6 months of experience using the V-Score. As early as 2014, the VM team relied upon the CVSS score to supply risk insights. However, for the past two years (since May 2023), the V-Score system has supplanted the CVSS and is now actively used by the organisation’s VM team. The V-Score has reportedly sharpened the organisation’s ability to respond to prioritised vulnerabilities according to risk, whereby risk is categorised both numerically and colour-coded using a traffic light (green, amber, red) system. Performance data and user surveys were collected from the VM team on September 2023 and December 2023, respectively.
The survey consisted of 8 questions aimed at gathering feedback on the user experience of the VM team transitioning from using the CVSS score to the V-Score. The general sentiment of the responses favoured the V-Score over the CVSS. Consider the responses from question 8 in Fig. 7, where two VM team members subjectively expressed that having transitioned to the V-Score, they were now more effective vulnerability experts. For the interested reader, the full results of the survey are available from the Open Science Framework. The authors interpret the V-Score user experience results as suggestive evidence, acknowledging potential bias stemming from relationships between the VM and consultant teams. Consequently, further studies are necessary to validate the reported positive experience.
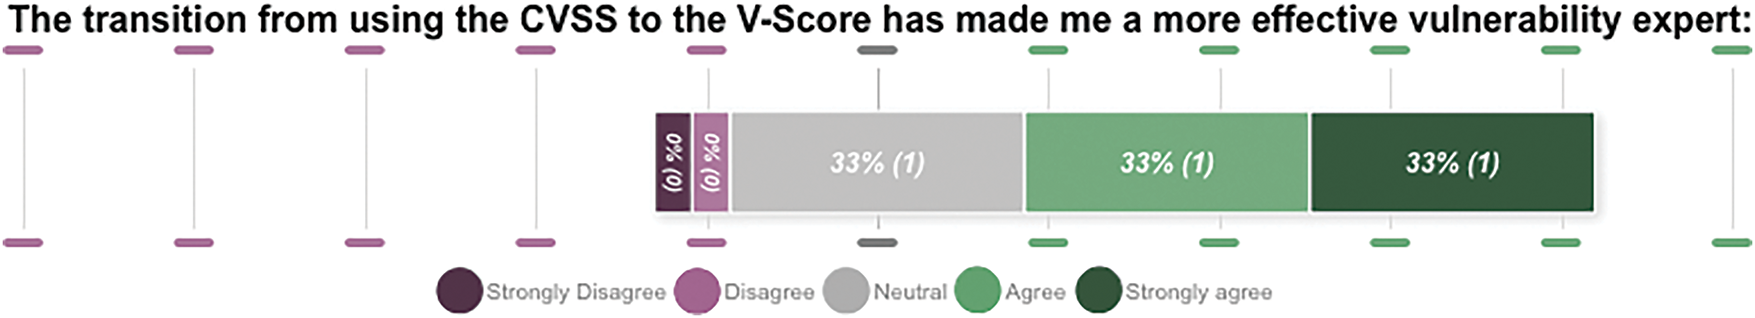
Figure 7: Likert Chart results from the user survey for the final Question 8 that focuses on whether the transition from CVSS to V-Score has benefited the users
As an additional use case, the V-Score has also enabled the development of a separate dataset built and managed by the consultant team’s organisation. This dataset tracks, identifies and provides context-specific CVE prioritisation using the V-Score according to any user organisation’s specific context. To date, the dataset has 1460 users, 400 active users weekly, and 343 users from distinct international companies, the five highest-use sectors being Computer Software and IT, Higher Education, Banking, Professional Training and Defence. In the last year, users of this dataset were sent an e-survey asking them to provide feedback on their experience. Of those who responded, nearly one quarter (23.5%) indicated that their organisation would experience ‘minor disruption’ should the dataset suddenly become unavailable, whilst nearly one-tenth (8.2%) of respondents indicated that their organisation would experience ‘significant disruption’ should the dataset suddenly become unavailable. This signifies that for many companies and users, the V-Score is an indispensable tool that empowers organisations to efficiently prioritise vulnerabilities, mitigate risks, and maintain operational resilience. The early development of this system has already proven its critical role in safeguarding diverse sectors worldwide.
Between 11 May 2023 and 15 June 2023 at roughly weekly intervals (except for week 4), the performance of the VM team was recorded by tracking the total number of vulnerabilities identified, prioritised and remediated. During this observation period, the VM team adopted a new vulnerability management tool that prioritised vulnerabilities based on the V-Score instead of the CVSS. As their remediation process dictated, the VM team prioritised remediating critical vulnerabilities before moving down to the next category of high-risk vulnerabilities and so on, depending on their remaining remediation capacity before new vulnerabilities were identified. Fig. 8a plots the number of prioritised (right axis values) and remediated (left axis values) vulnerabilities in the captured time frame. It can be seen that during the tracked period, the weekly vulnerabilities completely remediated started at 24 and increased to 55 before appearing to look like it may settle around this rate. This increased significantly by approximately 229% from their original baseline remediation rate. Simultaneously, the number of prioritised critical and high-risk vulnerabilities categorised by the V-Score was dropping. This suggests that with more effective risk prioritisation, the remediation rate will be improved, and critical and high-risk vulnerabilities will be reduced, closing the gap between an organisation’s typically limited remediation capability and the target prioritised critical and high-risk vulnerabilities.
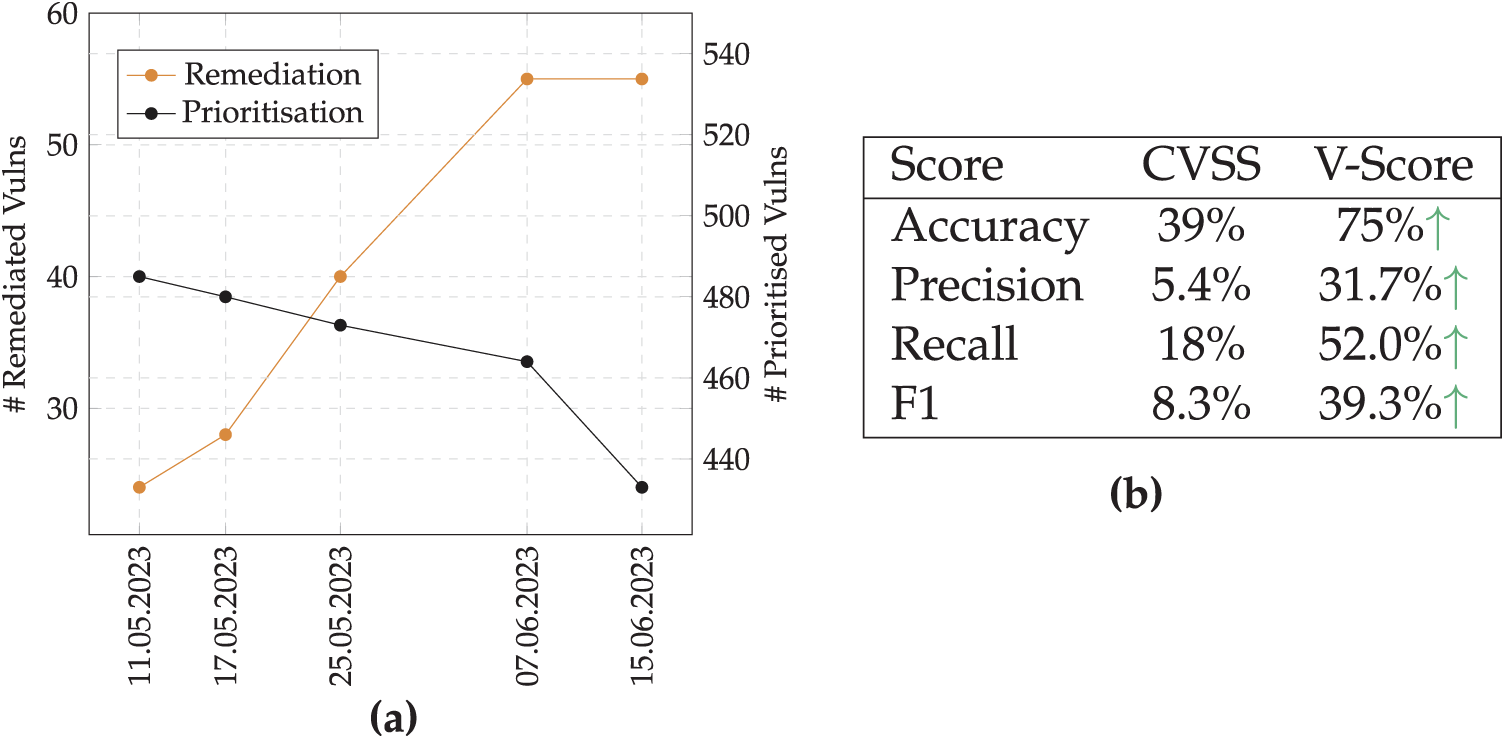
Figure 8: (a) User Study group’s remediation and prioritisation count between 11 May 2023–15 June 2023 (b) Performance of CVSS and the V-Score for predicting CERTs as high-risk
The findings presented constitute the suggestive evidence obtainable within the scope of this study. However, several caveats must be acknowledged. Notably, the observed performance improvement cannot be attributed solely to the V-Score, as the VM team simultaneously adopted a new vulnerability management tool that prioritised using the V-Score. Additionally, the observation period was limited in duration and lacked the granularity required for drawing definitive conclusions. To rigorously assess the V-Score’s impact on team performance, future studies should incorporate extended evaluation periods, detailed performance metrics, multiple teams, and controlled conditions to better isolate the V-Score’s influence.
The primary source of quantifiable evidence for evaluating the effectiveness of the V-Score in this study is its predictive performance in identifying high-risk vulnerabilities, as recognised by the Computer Emergency Readiness Team Coordination Center (CERT/CC) [46]7. In the dataset sourced from the CERT/CC Vulnerability Notes Database [47], if collaborating vendors, experts and the CERT authority publish a CERT for a vulnerability, it is a strong indicator that it is a high-risk vulnerability. This assumption enables a comparative analysis of the CVSS and V-Score in terms of accuracy and recall when classifying CERT-designated CVEs as critical vulnerabilities, indicating their relative performance. Note, that CERTs are not a comprehensive indicator of every high-risk vulnerability. Otherwise, the problem of vulnerability prioritisation would have already been solved. Instead, they are an accurate sub-set of high-risk vulnerabilities. Therefore, when calculating the performance of CERT predictions, measuring the percentage of CERTs predicted (the recall) is the focus, and the ratio against false positives (the precision) is less important, as the scores may be accurately predicting other high-risk CVEs that the CERTs do not cover.
Gathered from the User-Study, the CVEs being monitored by the VM team were collected and CERT mappings captured for them. The performance was then evaluated using conventional predictive modelling evaluation approaches [48]. Fig. 8b presents the accuracy, precision, recall, and F1 scores for both the CVSS and V-Score, calculated based on the CVEs monitored by the VM team throughout the study period8. A green upwards arrow indicates where the V-Score performance results surpass the CVSS. It can be seen that the V-Score outperformed the CVSS score for all performance metrics. The authors suggest, for reasons previously discussed, that recall is the most important performance metric to focus on for CERT prediction. The recall of the CVSS score was 18% compared to the improved 52% from the V-Score.
This paper presents a repeatable and scalable approach for developing bespoke vulnerability scoring systems that incorporate multiple risk components in alignment with the NIST Risk Management Framework (RMF). The proposed approach enables practitioners to design and configure prioritisation algorithms tailored to specific use cases by leveraging both global and local contextual layers. While the approach facilitates the creation of custom vulnerability scoring systems, it also encourages openness and reusability. Scoring systems, along with their supporting data, can be openly shared, enabling broader adoption by practitioners who may lack the resources or expertise to develop such systems independently. This promotes accessibility, particularly for small-to-medium enterprises (SMEs) and individuals. It allows them to quickly adopt an existing scoring system and retain the flexibility to modify and/or tune it as needed. An example application of this approach is demonstrated through the V-Score. The complete V-Score dataset is publicly available online9, promoting community adoption, evaluation, and refinement through its transparent and extensible design. The V-Score was further evaluated in a user study, providing suggestive evidence that it was preferred over the CVSS score across all measured criteria.
To reiterate, the CVSS score calculated 56% of 150,589 vulnerabilities as ‘critical’ or ‘high-risk’. In contrast, the V-Score only categorised 3% of vulnerabilities for the same classification brackets, leading to an improved score distribution. The user study identified that over half of the users believed the V-Score had made them a ‘more effective vulnerability expert’. Additionally, over the entire study duration, the VM team increased their remediation rate by 229% and by prioritising risk according to the V-Score system over the CVSS, accuracy for predicting high-risk vulnerabilities published by the CERT/CC almost doubled (1.92X), recall more than doubled (2.89X), F1 was more than four times greater (4.73X), and precision increased five-fold (5.87X).
The discussions and results also reaffirm that relying upon the CVSS score alone for risk prioritisation is a flawed solution. By incorporating multiple risk components, the approach enables analysis of the rapidly expanding vulnerability landscape, an expansion that may accelerate with the use of large language models to discover new vulnerabilities. The authors recognise that the approach presented is not the absolute optimal solution for vulnerability prioritisation, but is more likely an intermediate stage before highly adaptable machine learning models (similar to EPSS but for tailored risk) are developed. A combination of machine learning models such as Graph Neural Networks (GNNs) and Natural Language Processing (NLP) techniques leveraging Large Language Models (LLMs) might be used to significant effect, similar to how they have been used with promising results to automate CVE CPE enrichment in VulnScopper [49]. Properly trained and configured machine learning models can capture complex interrelationships among monitored risk components and may enable highly optimised risk calculations at both global and local levels. However, training and deploying such models pose challenges, including the engineering of continuous data gathering pipelines and dynamic machine learning operations (ML-Ops) pipelines. As a counterpoint, the weighted sum approach in this paper maintains certain inherent advantages over a complete machine learning solution, particularly the interpretability and control of this approach, which is often preferable in explainable decision-making contexts [50].
The authors hope this paper acts as a clarion call to scholars to further incorporate the approach within their studies and share relevant data. Readers are encouraged to use all or parts of this approach to develop and test their risk prioritisation algorithms further. Adopting this approach could provide researchers, community initiatives, and small to medium-sized enterprises access to powerful new algorithms and risk assessment processes previously unavailable to the wider community.
Acknowledgement: The authors thank the anonymous reviewers for their valuable suggestions and the users who volunteered to participate in the study. We are especially grateful to Dr. Olivia Williams for her insightful guidance and support during the revision of this manuscript. This work was supported by Kaze Digital & Data Ltd.
Funding Statement: The authors received no specific funding for this study.
Author Contributions: The authors confirm the following contributions: Conceptualization, James Lang; methodology, Harri Renney and Rohini Paligadu; software, Maxim Nethercott; validation, Isaac V Chenchiah; writing, Harri Renney and Isaac V Chenchiah. All authors reviewed the results and approved the final version of the manuscript.
Availability of Data and Materials: The data supporting the findings of this study are openly available from the Open Science Framework at https://osf.io/mp9qf (accessed on 11 June 2025).
Ethics Approval: Ethical approval for this study was obtained from the Kaze Consulting review board, and all research protocols were conducted in accordance with company guidelines. All data collected was anonymised and securely stored in compliance with company policies and data protection regulations to ensure the confidentiality and safety of participant information.
Conflicts of Interest: The authors declare no conflicts of interest to report regarding the present study.
1Whilst CVSS v4 was released in 2024, the NVD has not officially adopted it, and the authors do not consider the changes worth differentiating from for the purpose of this work.
2Full underlying data for tracking and calculating the scores is openly available at the Open Science Framework.
3In this paper, we use the range
4This window length was selected based on the methodology observed in the successful CVE social media tracking service, CVETrends [41].
5For ease, throughout the remainder of this paper, we will refer to the team assisting the adoption of this approach and the V-Score as the ’consultant team’ and the vulnerability management team within the organisation as the ’VM team’.
6For this implementation of the V-Score, the sources of exploitation used were Metasploit, CISA’s KEV and the Exploit DB.
7For convenience, high-risk CVEs disclosed by the CERT will be referred to as having ‘CERTs’
8A full breakdown of each scores confusion matrix and table of results is openly available from the Open Science Framework
9https://github.com/kaze-technologies/cvefree (accessed on 11 June 2025).
References
1. Mann DE, Christey SM. Towards a common enumeration of vulnerabilities. In: 2nd Workshop on Research with Security Vulnerability Databases. Indiana: The MITRE Corporation; 1999. [Google Scholar]
2. Schneier B. The nonsecurity of secrecy. Commun ACM. 2004;47(10):120. doi:10.1145/1022594.1022629. [Google Scholar] [CrossRef]
3. Arora A, Krishnan R, Telang R, Yang Y. An empirical analysis of software vendors’ patch release behavior: impact of vulnerability disclosure. Inform Syst Res. 2010;21(1):115–32. doi:10.1287/isre.1080.0226. [Google Scholar] [CrossRef]
4. Arora A, Krishnan R, Nandkumar A, Telang R, Yang Y. Impact of vulnerability disclosure and patch availability-an empirical analysis. In: Third Workshop on the Economics of Information Security. Pittsburgh, PA, USA: John Heinz III School of Public Policy and ManagementCarnegie Mellon University; 2004. Vol. 24, p. 1268–87. [Google Scholar]
5. Zhuang Y, Choi Y, He S, Leung ACM, Lee GM, Whinston AB. Information disclosure and security vulnerability awareness: a large-scale randomized field experiment in Pan-Asia. In: 53rd Hawaii International Conference on System Sciences. Maui, HI, USA; 2020. p. 6040–9. [Google Scholar]
6. Stapleton JJ. Security without obscurity: a guide to confidentiality, authentication, and integrity. Boca Raton, FL, USA: CRC Press; 2014. [Google Scholar]
7. Deogun D, Johnsson DB, Sawano D. Secure by design. Shelter Island, NY, USA: Manning Publications; 2019. [Google Scholar]
8. Abioye TE, Arogundade OT, Misra S, Adesemowo K, Damaševičius R. Cloud-based business process security risk management: a systematic review, taxonomy, and future directions. Computers. 2021;10(12):160. doi:10.3390/computers10120160. [Google Scholar] [CrossRef]
9. Ogundokun RO, Misra S, Segun-Owolabi T, Gulanikar AA, Agrawal A, Damasevicius R. A web application vulnerability testing system. In: Recent innovations in computing: proceedings of ICRIC 2021. Singapore: Springer; 2022. Vol. 2, p. 741–51. [Google Scholar]
10. Strom BE, Applebaum A, Miller DP, Nickels KC, Pennington AG, Thomas CB. Mitre attack: design and philosophy. In: Technical report. McLean, VA, USA: The MITRE Corporation; 2018. [Google Scholar]
11. Glyder J, Threatt AK, Franks R, Adams L, Stoker G. Some analysis of common vulnerabilities and exposures (cve) data from the national vulnerability database (nvd). In: Proceedings of the Conference on Information Systems Applied Research. Washington, DC, USA; 2021. Vol. 2167. [Google Scholar]
12. Technologies P. Positive technologies finds an average of 31,000 security vulnerabilities are present in each organization; 2022 [cited 2025 Jun 11]. Available from: https://global.ptsecurity.com/about/news/positive-technologies-finds-an-average-of-31-000-security-vulnerabilities-are-present-in-each-organization [Google Scholar]
13. Murray A. Securing the software supply chain: key findings from the mend open source risk report; 2023. [cited 2025 Jun 11]. Available from: https://www.mend.io/blog/securing-the-software-supply-chain-mend-open-source-risk-report/. [Google Scholar]
14. Quinn S, Barrett M, Witte G, Gardner R, Ivy N. Prioritizing cybersecurity risk for enterprise risk management. NIST Interagency/Internal Report (NISTIR). Gaithersburg, MD, USA: National Institute of Standards and Technology; 2022. [Google Scholar]
15. Carlson CT. How to manage cybersecurity risk: a security leader’s roadmap with open FAIR. Irvine, CA, USA: Universal-Publishers; 2019. [Google Scholar]
16. Alahmari A, Duncan B. Cybersecurity risk management in small and medium-sized enterprises: a systematic review of recent evidence. In: 2020 International Conference on Cyber Situational Awareness, Data Analytics and Assessment (CyberSA). Dublin, Ireland: IEEE; 2020. p. 1–5. [Google Scholar]
17. Renaud K, Weir GR. Cybersecurity and the unbearability of uncertainty. In: 2016 Cybersecurity and Cyberforensics Conference (CCC). Amman, Jordan: IEEE; 2016. p. 137–43. [Google Scholar]
18. Rechtman Y. Guide for conducting risk assessments: information security. CPA J. 2013;83(3):11. [Google Scholar]
19. Radack S. The common vulnerability scoring system (CVSS). Gaithersburg, MD: ITL Bulletin, National Institute of Standards and Technology. [cited 2025 Jun 24]. Available from: https://tsapps.nist.gov/publication/get_pdf.cfm?pub_id=51280. [Google Scholar]
20. Trust B. Microsoft vulnerabilities report; 2023 [cited 2025 Jun 11]. Available from: https://assets.beyondtrust.com/assets/documents/2023-Microsoft-Vulnerability-Report_BeyondTrust.pdf. [Google Scholar]
21. Group F. Scoring system v3.0: specification document; 2015 [cited 2025 Jun 11]. Available from: https://www.first.org/cvss/v3.0/cvss-v30-specification_v1.9.pdf. [Google Scholar]
22. Group F. Common vulnerability scoring system version 3.1 specification document revision 1; 2019. [cited 2025 Jun 11]. Available from: https://www.first.org/cvss/v3-1/cvss-v31-specification_r1.pdf. [Google Scholar]
23. Team C. Common vulnerability scoring system v3.0: specification document. First org. 2015. [Google Scholar]
24. Howland H. CVSS: ubiquitous and Broken. Digit Threats. 2022 Feb;4(1):1. doi:10.1145/3491263. [Google Scholar] [CrossRef]
25. Scarfone K, Mell P. An analysis of CVSS version 2 vulnerability scoring. In: 2009 3rd International Symposium on Empirical Software Engineering and Measurement. Lake Buena Vista, FL, USA: IEEE; 2009. p. 516–25. [Google Scholar]
26. Hubbard DW, Seiersen R. How to measure anything in cybersecurity risk. Hoboken, NJ, USA: John Wiley & Sons; 2023. [Google Scholar]
27. Wunder J, Kurtz A, Eichenmüller C, Gassmann F, Benenson Z. Shedding light on CVSS scoring inconsistencies: a user-centric study on evaluating widespread security vulnerabilities. In: 2024 IEEE Symposium on Security and Privacy (SP). San Francisco, CA, USA; 2024. p. 1102–21. [Google Scholar]
28. Register T. NIST’s security flaw database still backlogged with 17K+ unprocessed bugs. Not great; 2024 [cited 2025 Jun 11]. Available from: https://www.theregister.com/2024/10/02/cve_pileup_nvd_missed_deadline/. [Google Scholar]
29. Walkowski M, Krakowiak M, Jaroszewski M, Oko J, Sujecki S. Automatic CVSS-based vulnerability prioritization and response with context information. In: 2021 International Conference on Software, Telecommunications and Computer Networks (SoftCOM). Split, Hvar, Croatia: IEEE; 2021. p. 1–6. [Google Scholar]
30. Guenni. FortiGuard Labs reports: critical vulnerability CVE-2022-42475 in FortiOS is exploited; 2022 [cited 2025 Jun 11]. Available from: https://borncity.com/win/2022/12/13/fortiguard-labs-reports-critical-vulnerability-cve-2022-42475-in-fortios-is-exploited/. [Google Scholar]
31. Lumen. Black Lotus Labs uncovers another new malware that targets compromised routers; 2023 [cited 2025 Jun 11]. Available from: https://news.lumen.com/2023-03-06-Black-Lotus-Labs-uncovers-another-new-malware-that-targets-compromised-routers. [Google Scholar]
32. Response MI. Guidance for investigating attacks using CVE-2022-21894: the BlackLotus campaign. 2023 [cited 2025 Jun 11]. Available from: https://www.microsoft.com/en-us/security/blog/2023/04/11/guidance-for-investigating-attacks-using-cve-2022-21894-the-blacklotus-campaign/. [Google Scholar]
33. Force JT. Risk management framework for information systems and organizations. Gaithersburg, MD, USA: NIST Special Publication; 2018. Vol. 800. [Google Scholar]
34. Householder AD, Chrabaszcz J, Novelly T, Warren D, Spring JM. Historical analysis of exploit availability timelines. In: 13th USENIX Workshop on Cyber Security Experimentation and Test. Berkeley, CA, USA; 2020. [Google Scholar]
35. Jacobs J, Romanosky S, Adjerid I, Baker W. Improving vulnerability remediation through better exploit prediction. J Cybersecur. 2020;6(1):tyaa015. doi:10.1093/cybsec/tyaa015. [Google Scholar] [CrossRef]
36. Jacobs J, Romanosky S, Edwards B, Adjerid I, Roytman M. Exploit prediction scoring system (EPSS). Digit Threats: Res Pract. 2021;2(3):1–17. doi:10.1145/3436242. [Google Scholar] [CrossRef]
37. Micro T. CVE-2025-0411: ukrainian organizations targeted in zero-day campaign and homoglyph attacks; 2025 [cited 2025 Jun 11]. Available from: https://www.trendmicro.com/en_gb/research/25/a/cve-2025-0411-ukrainian-organizations-targeted.html. [Google Scholar]
38. Shrestha P, Sathanur A, Maharjan S, Saldanha E, Arendt D, Volkova S. Multiple social platforms reveal actionable signals for software vulnerability awareness: a study of GitHub, Twitter and Reddit. PLoS One. 2020;15(3):e0230250. doi:10.1371/journal.pone.0230250. [Google Scholar] [PubMed] [CrossRef]
39. CISCO. How kenna security works a peek “Under the Hood” of modern vulnerability management; 2022. [cited 2025 Jun 11]. Available from: https://www.cisco.com/c/dam/global/en_hk/assets/pdfs/cisco-how-kenna-works.pdf. [Google Scholar]
40. Orpheus. Risk Based vulnerability management using threat intelligence and machine learning; 2022. [cited 2025 Jun 11]. Available from: https://orpheus-cyber.com/wp-content/uploads/2025/01/Case-Study_Ministry-of-Defence.pdf. [Google Scholar]
41. Bell SJ. CVETrends; 2024. [cited 2025 Jun 11]. Available from: https://cvetrends.com. [Google Scholar]
42. Information security, cybersecurity and privacy protection—Guidance on managing information security risks. Geneva, Switzerland: International Organization for Standardization; 2022. [Google Scholar]
43. Farris KA, Shah A, Cybenko G, Ganesan R, Jajodia S. VULCON: a system for vulnerability prioritization, mitigation, and management. ACM Trans Priv Secur (TOPS). 2018;21(4):1–28. [Google Scholar]
44. Edgar TW, Manz DO. Research methods for cyber security. Cambridge, MA, USA: Syngress; 2017. [Google Scholar]
45. Wu C, Wen T, Zhang Y. A revised CVSS-based system to improve the dispersion of vulnerability risk scores. Sci China Inf Sci. 2019;62(3):1–3. doi:10.1007/s11432-017-9445-4. [Google Scholar] [CrossRef]
46. University CM. Coordination center (CERT/CC); 2024 [cited 2025 Jun 11]. Available from: https://www.kb.cert.org/vuls/. [Google Scholar]
47. University CM. Vulnerability notes database; 2023. [cited 2025 Jun 11]. Available from: www.kb.cert.org. [Google Scholar]
48. Powers DM. Evaluation: from precision, recall and F-measure to ROC, informedness, markedness and correlation. arXiv:2010.16061. 2020. [Google Scholar]
49. Alfasi D, Shapira T, Bremler-Barr A. VulnScopper: unveiling hidden links between unseen security entities. In: Proceedings of the 3rd GNNet Workshop on Graph Neural Networking Workshop; Los Angeles, CA, USA; 2024. p. 33–40. [Google Scholar]
50. Rudin C. Stop explaining black box machine learning models for high stakes decisions and use interpretable models instead. Nat Mach Intell. 2019;1(5):206–15. doi:10.1038/s42256-019-0048-x. [Google Scholar] [PubMed] [CrossRef]
Cite This Article
 Copyright © 2025 The Author(s). Published by Tech Science Press.
This work is licensed under a Creative Commons Attribution 4.0 International License , which permits unrestricted use, distribution, and reproduction in any medium, provided the original work is properly cited.
 Downloads
 Citation Tools