
 Submit a Paper
 Propose a Special lssue
 Open Access
ARTICLE

Remote Sensing Plateau Forest Segmentation with Boundary Preserving Double Loss Function Collaborative Learning
1 School of Physics and Electronic Information Engineering, Qinghai Minzu University, Xining, 810007, China
2 The Information Department, Beijing University of Technology, Beijing, 100124, China
3 Advanced Information Network Beijing Laboratory, Beijing, 100124, China
4 Computational Intelligence and Intelligent Systems Beijing key Laboratory, Beijing, 100124, China
5 Institute of Remote Sensing and Geographic Information System, School of Earth and Space Sciences, Peking University, Beijing, 100871, China
6 Department of Computer Science, University of Pittsburgh, 15260, USA
* Corresponding Author: Pengyu Liu. Email:
Journal of New Media 2022, 4(4), 165-177. https://doi.org/10.32604/jnm.2022.026684
Received 05 November 2021; Accepted 03 April 2022; Issue published 12 December 2022
 View Full Text
 Download PDF
Abstract
Plateau forest plays an important role in the high-altitude ecosystem, and contributes to the global carbon cycle. Plateau forest monitoring request in-suit data from field investigation. With recent development of the remote sensing technic, large-scale satellite data become available for surface monitoring. Due to the various information contained in the remote sensing data, obtain accurate plateau forest segmentation from the remote sensing imagery still remain challenges. Recent developed deep learning (DL) models such as deep convolutional neural network (CNN) has been widely used in image processing tasks, and shows possibility for remote sensing segmentation. However, due to the unique characteristics and growing environment of the plateau forest, generate feature with high robustness needs to design structures with high robustness. Aiming at the problem that the existing deep learning segmentation methods are difficult to generate the accurate boundary of the plateau forest within the satellite imagery, we propose a method of using boundary feature maps for collaborative learning. There are three improvements in this article. First, design a multi input model for plateau forest segmentation, including the boundary feature map as an additional input label to increase the amount of information at the input. Second, we apply a strong boundary search algorithm to obtain boundary value, and propose a boundary value loss function. Third, improve the Unet segmentation network and combine dense block to improve the feature reuse ability and reduces the image information loss of the model during training. We then demonstrate the utility of our method by detecting plateau forest regions from ZY-3 satellite regarding to Sanjiangyuan nature reserve. The experimental results show that the proposed method can utilize multiple feature information comprehensively which is beneficial to extracting information from boundary, and the detection accuracy is generally higher than several state-of-art algorithms. As a result of this investigation, the study will contribute in several ways to our understanding of DL for region detection and will provide a basis for further researches.Keywords
The Sanjiangyuan Nature Reserve we focused on in this project is the source of the Yangtze River, the Yellow River and the Lancang River located in Qinghai province, which covers an area of more than 360,000 square kilo meters and plays as a critical area for the concentrated protection of natural resources in China [1]. The unique geographical environment and natural climatic conditions in Sanjiangyuan area makes it not only plays a role as one of important recharge area for freshwater resources, but also acts as a protective barrier for ecological security threaten in Qinghai-Tibet Plateau. Long et al. have mentioned the “three barriers and two shelter belts” in China in 2018 which contains Sanjiangyuan area as a critical part of ecological security pattern [2].
It is undeniable that the forest system is the largest, the most complex and the resource-richest ecosystem on the land. Sanjiangyuan area has a unique and typical alpine vegetation system especially the forest rich in species. This makes it play an irreplaceable role in maintaining biodiversity, water conservation, carbon sequestration as well as economic functions such as providing biological resources. However, in the past few decades, the forest system in Sanjiangyuan area shows a trend of grassland degradation and land desertification due to overdevelopment. At present, the forest ecosystem monitoring mainly occurs the contents from forest composition and structure, accumulation, and estimation of land cover, to all aspects of forest ecosystem, such as forest biomass, forest health, biodiversity, wildlife and so on. Due to the dynamic characteristics of forest ecosystem, long production cycle and large scales, the traditional survey method that regards the survey area as a scattered point comes up with various problems such as large workload, high cost, long cycle, low efficiency, and poor timeliness. There is an urgent need to propose more efficient and intelligent method to address the issue. 1) The most traditional way is field visit. However, the complex landform and large scale of Sanjiangyuan area requires many skillful technicians and long time periods for plateau forest investigation. Those skillful technicians are supposed to both get used to harsh plateau environment and be professional in statistic analyzation of the biological source of forests. What’s more, the long-period survey can’t ensure a high frequency to surveillance one area for forest land cover changes. 2) With the recent development of the satellite technologies, remote-sensing data becomes available for the large-scale high-altitude plateau forest monitoring. However, how to obtaining accurate knowledge of the special patterns of plateau forest remains challenging. The human-annotated statistics on remote sensing maps also required a lot of human resources and inefficient. Instead of these traditional methods, we have proposed a more efficient method by multidimensional feature learning. The basic principle is based on the DL analyzation of features obtained by remote sensing. It undeniable that with the use of machine learning (ML) algorithms, we will make forest conservation digitize and intelligence.
1.2 Overseas and Domestic Research Status
The last century has witnessed a rapid development of remote sensing systems on scope and diversity, same as various applications. The types of images referred by RSIs excluded the traditional aerial photographs like those visible to the naked eye but defined as the satellite imagery which contains more information such as physical texture and chemical constitution of the Earth’s surface. Natural resources monitoring in optical RSIs is to determine if one or more objects included by the categories we interested in and label the location of each detected targets in the given satellite imagery dataset. The term ‘object’ used in many researches refers to universal form, covering natural objects (such as animals, plants, and so on) independent of surrounding background with sharp boundaries, as well as landscape feature (such as land-use/land-cover (LULC) parcels) that have vague boundaries and act as parts of the background [3]. The reason why we use RSIs to surveillance plateau forest in Sanjiangyuan area can be attributed by several reasons. Firstly, RSIs provides a synoptic view to allow wall-to-wall mapping and surveillance of significant ecological variables. Secondly, the digital information that imagery contains can be easily pre-processed as spatial datasets in a geographical information system. Moreover, we can acquire data beyond the visible wavelengths (i.e., ultraviolet, and thermal wavelengths) reflected or absorbed by materials across the electromagnetic spectrum uniquely owned by RSIs to detect land covers (i.e., forest and canopy cover). Finally, forest monitoring with remote-sensing methods has underpinned rules such as Reducing Greenhouse Gas Emissions from Deforestation and Forest Degradation (REDD+) and Roundtable on Sustainable Palm Oil certification [4].
For biophysical monitoring to RSIs, the approach such as the normalized difference vegetation index (NDVI) and ratio vegetation index (RVI) which combine the field visit with vegetation indices is the most common. However, for categories mapping, classification algorithms supervised using ground truth such as the maximum likelihood classifier and machine-learning approaches meets great popularity. The most typical methods here are supported vector machine (SVM) and random forest. On the other hand, rather than being divided into pixels in ML methods, RSIs with high resolution data more likely apply geographic object-based approach to classify the objects [5]. It firstly aggregates the pixels to form objects that represent meaningful units (e.g., a cluster of trees) depending on their similar RGB feature or textural properties. As mentioned before, regarded as one of the most popular enablers, object detection methodology has significantly evolved over the consecutive development in dealing with RSIs. Looking back to the development of the object detection methods as we briefly discussed above, it is hard for template matching-based object detection methods to deal with rotated or distortion image especially large-scale RSIs, although feature learning can be used for generating more appropriate object class. Solberg proposed the use of knowledge-based object detection for forest in 1999, which still have been a common detection method in optical RSIs [6]. To overcome the inherent limitation in these methods-namely that the defined rule cannot be robust to possible disturbance–ML-based object detection was adopted for the object classification. Based on training model with supervisor, the ML matches the corresponding feature to its label. Amongst the above-mentioned detection techniques, they only analyzed the surface meaning of image, which can easily misjudge because of the interferences. By contrast, OBIA-based object detection grouping relative local homogeneous pixels in to meaningful objects to make classification [7], while the CNN, one of OBIA-based DL methodology, is what we focused on in this project.
DL techniques, which has been currently proposed to RSIs reveal a better adaptability and greater robustness faced to satellite imagery under uncertain environment condition. It can be primarily classified by its structure into many categories where most of which are complemented by the more recently proposed artificial neural network. Khelifi (2006) illustrated the distribution of DL models used in studies where the most prominent representative DL methodology is CNN, which has attracted extensive attention in various fields of computer vision, including the RSIs analysis [8].
1.3 Motivation and Contribution
While the above literature review has shown the basis for understanding the development of remote-sensing image detection schemes with traditional image processing techniques, the multi-featured-based DL methodology is far from being fully understood. Lu et al. [9] proposed a random forest model based on super-pixel segmentation (SLIC), with particular attention devoted to poor sample quality and inhomogeneity. Since SLIC can obtain incomplete regular shapes with certain visual significance by clustering adjacent pixels with different features such as texture and color, it has outstanding advantages in binary classification with speed and model complexity. However, the focus of binary classification is not our work. What we need to do is detecting a specific area precisely. More particularly, Chen et al. (2019) [10] introduced some algorithms of the existing CNN techniques and identified the scene-contextual feature pyramid network (SCFPN) for enhance the relationship between object and the scene. Liu et al. [11] discussed a SVM model based on mixed kernels, aiming for deal with the unfit of multi kernel to multi-features as well as the salt and pepper noise caused by the large spectrum variation of the same land surface feature. Since the spectra of the same ground object vary greatly in the influence of high resolution, the classification of high-resolution images using the pixel-based method will result in noise. Li et al. [12] compared several commonly used hyperspectral remote sensing classification methods such as maximum likelihood method, minimum distance method, support vector machine (SVM) method and spectral angle mapping (SAM) method. They concluded that SVM classification method has the highest accuracy after comparative analysis.
In terms of image segmentation, FCN is one of the masterpieces [13]. Unlike classic CNN, FCN makes pixel-level predictions for images, and can accept input images of any size while retaining the spatial information in the original input image. The Unet proposed by Ronneberger et al. [14] is an improvement of FCN. Unet adds a jump connection between encoding and decoding of FCN. Through jump connection, the decoder can receive low-level features from the encoder, form an output and retain boundary information. The network can achieve a better extraction effect by encoding and decoding image features and fusing the semantic features of the high and low layers of the network. Guo et al. [15] combined the multiple loss method with the attention mechanism based on the Unet network, and proved the effectiveness of their method on public data sets. Kang et al. [16] used Dense Spatial Pyramid Pooling (DSPP) to extract multi-scale features, and used focal loss [17] to suppress the influence of incorrect labels on training, which increased the prediction efficiency by 2 to 4 times. Ye et al. [18] improved the accuracy of small target detection based on the characteristics of residual features and feature pyramid multi-scale prediction. Although the above deep learning methods have improved the accuracy of image segmentation to a certain extent [19], there are still the following shortcomings: First, the ability to extract detailed features is insufficient, and it is difficult to filter out effective features from a large number of features. Second, for images of different shapes, it is impossible to extract accurate features of the border [20,21].
The proposed model for plateau forest monitoring in this project uses keras API in software to identify the forest area in the satellite images by pre-processing, segmentation, feature extraction and comparison, and other operations. The rest of the paper is as follows: Section 2 is related work. Section 3 provides the materials and methods. Section 4 explains the experiments. Section 5 concludes the paper and the future work.
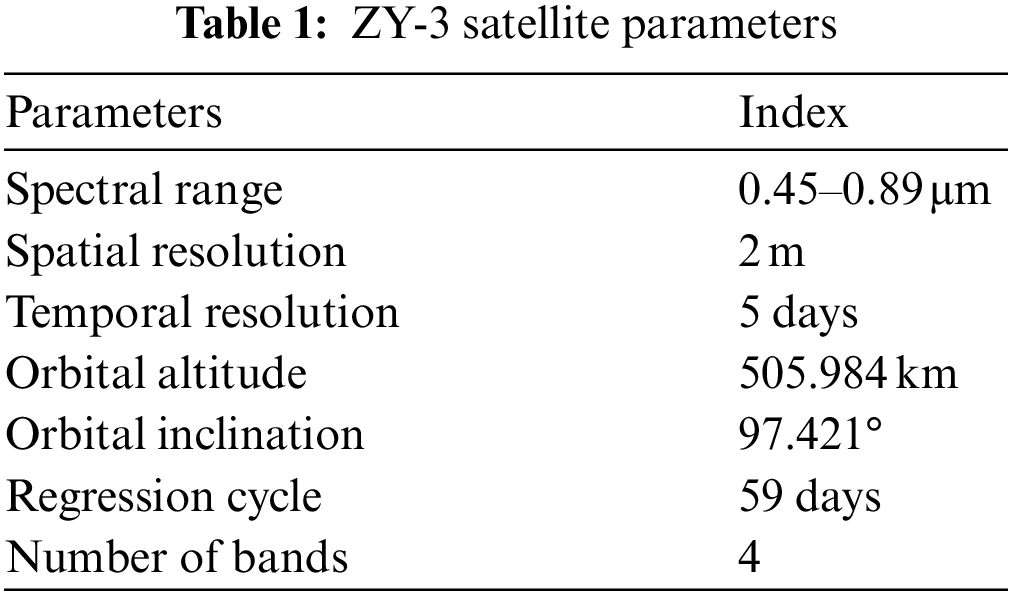
The area we focused on is The Sanjiangyuan Nature Reserve, which located in Qinghai province, China. Our data is obtained from State Bureau of Surveying and Mapping of China, which is provided by remote sensing satellite ZY-3. The relevant parameters of the Resource 3 satellite are shown in Table 1.
For multi-spectral remote sensing images provided by remote sensing satellites, the image data normalization, data enhancement, and sample pre-collection data processing processes are used as preprocessing. The original remote sensing images are about 30000 * 30000 pixels and we crop them into 128 * 128, which can be input in the segmentation models. As data normalization, we use Normalized Difference Vegetation Index (NDVI) [22], which is a specific remote sensing index reflecting the status of land cover live green vegetation. NDVI is used helping select the images which contain forest area. As shown in Fig. 1, the yellow color lump is what we detected as forests. We delineate 1200 images using the LabelMe software to label forest area, which are used as the ground truth. The cropped plateau forest image is shown in Fig. 2. All the images in our datasets are divided into training, validation, testing with a ratio of 7:2:1 randomly using stratified sampling.

Figure 1: Sample visualization, NDVI model prediction and NDVI ground truth of high-density plateau forest (row1) and low-density plateau forests. Larger value of vegetation index will indicate larger probability of forest area, which means yellow color lump is what we detected as forests

Figure 2: Visualization of the plateau forest image after cropping
Our proposed Boundary Preserving method including two main parts. We extracted boundary outline to make boundary pixel label and boundary value label, which are acted on input and loss function separately. In Fig. 3, we used improved network based on Unet as the backbone of the method. We designed dense block consist of 3 * 3 convolution, BN layer and Relu activation function. The normalization layer BN acts on the channel axis, and followed by the linear rectification activation function Relu (Rectified Linear Unit). The size of the convolution kernel of MaxPooling is 2, and the step size is 2. Each MaxPooling changes the image size to half of the original size, but does not change the number of image channels. At the same time, the connection of dense blocks improves the feature reuse ability and reduces the image information loss of the model during training.

Figure 3: Structure of boundary preserving method based on improved network of Unet
The boundary pixel label is a feature map to enhance important points, and weaken or ignore unimportant points. This operation can improve the segmentation accuracy of the forest area, and continue to maintain the lightweight of the network. The input of the structure is consisting of three part of images, which is shown as
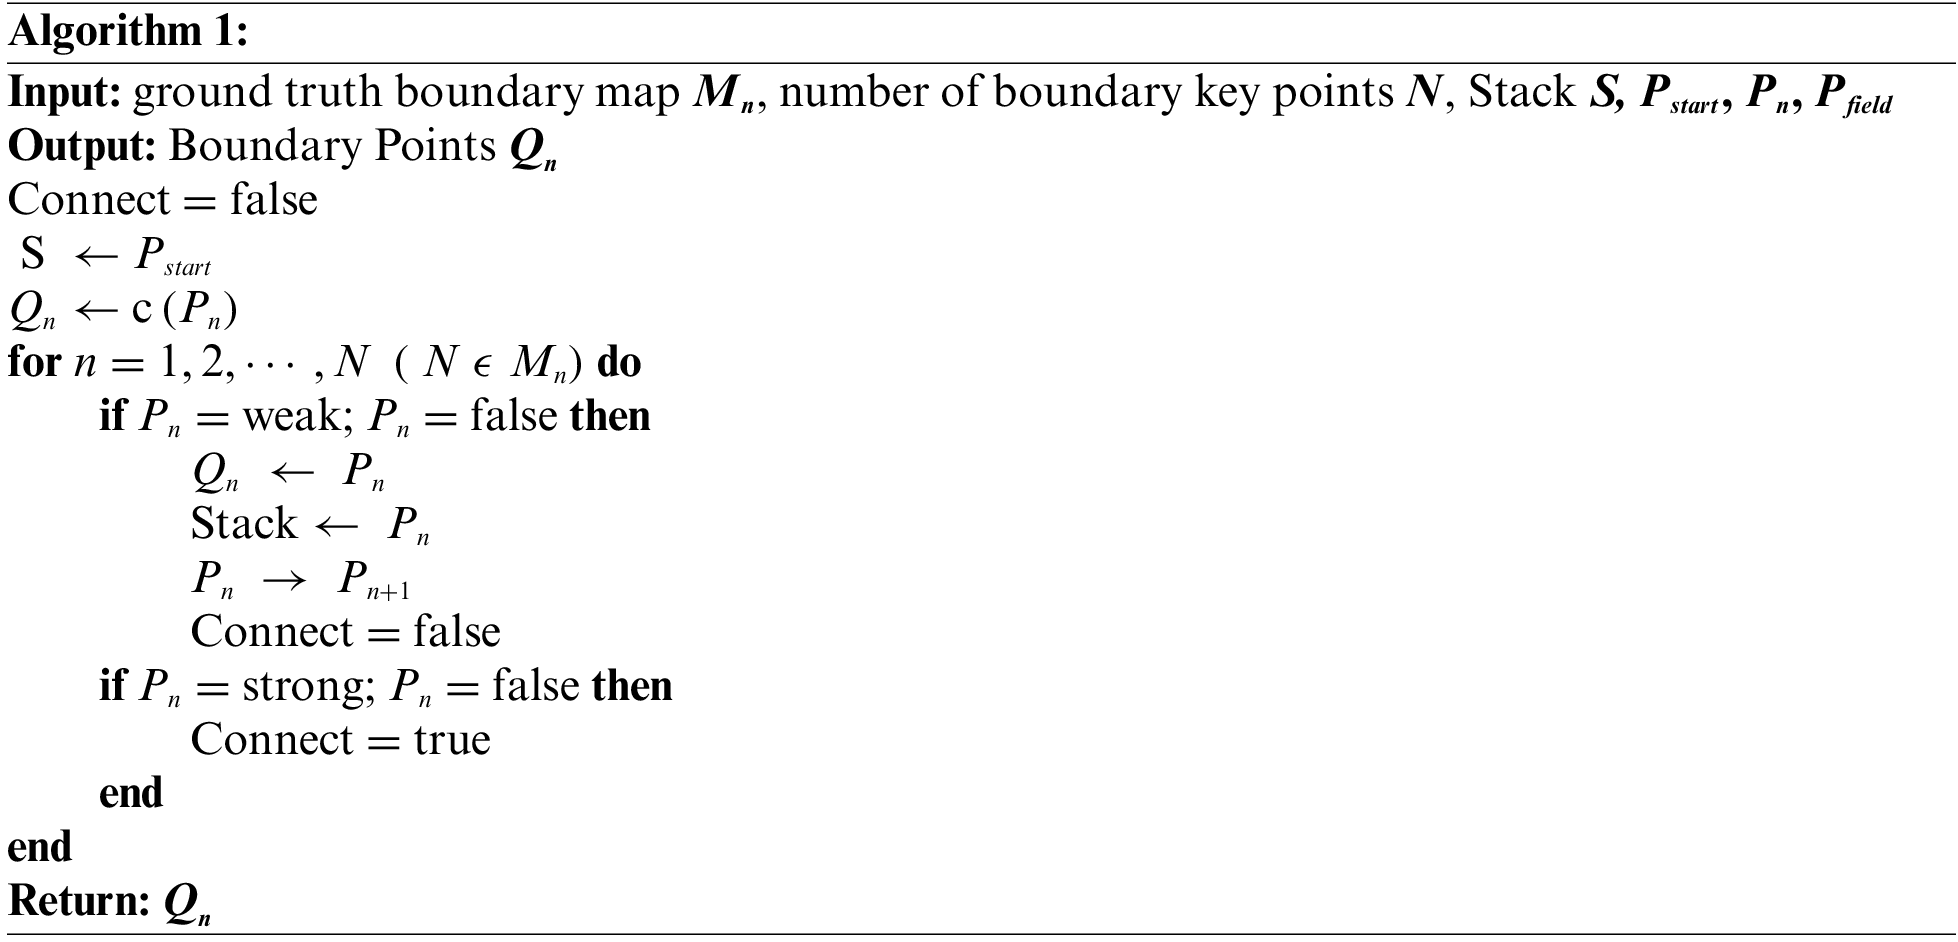
We apply a strong boundary search algorithm to obtain boundary value. Search all connected weak edges by depth-first algorithm. If any point of a connected weak edge is connected to a strong edge point, then this weak edge is retained, otherwise the weak edge is suppressed. Prepare a stack S and a queue Q, and set the connected indicator variable connected to false.
1) Starting from the first point of the image, enter the second operation.
2) If this point is a weak boundary point and has not been marked, mark it and put it in the stack S as the first element, and put it in the queue Q for recording the connected curve at the same time, and enter the third operation. If this point is not a weak boundary or has been marked, go to the next point in the image and repeat the second operation.
3) Take an element from the stack S and look for its 8-pixel area. If a field pixel is a weak boundary and has not been marked, mark the field pixel and add it to stack S and queue Q at the same time. At the same time, find the strong boundary map corresponding to the field. If a pixel is a strong boundary, it means that the weak boundary curve is connected with the strong boundary. Set connected to true. Repeat the third operation until there are no more elements in the stack. If connected is false, each element is taken from the queue Q in turn, and the mark is cleared. If connected is true, keep the mark. Clear the queue Q, set connected to false, and move to the next point of the image.
To train the segmentation network in an adversarial way, we employ two types of loss functions.
The first is segmentation loss function. It can reduce the difference between the ground-truth segmentation map and the predicted segmentation map. It is defined as:
The second one is boundary value loss function. The boundary value label is optimized by minimizing the cross-entropy loss between the estimated boundary value label and ground-truth pixel label. It is defined as:
Thus, the total loss function for training segmentation network is shown as:
Accuracy rate, recall rate and F1-score are commonly used evaluation indexes in image segmentation. The mathematical definitions of these three indexes are shown in Eqs. (2)–(4) respectively.
The number TP represents correctly classified positive categories. The number FP represents misclassified positive categories. The number TN represents correctly classified negative categories. The number FN represents misclassified negative categories. In our experiment, the positive categories are forest area, and the negative categories are non-forested area.
Our experiment used Ziyuan-3 satellite high-resolution remote sensing image data as the data source. Our research selected the images collect from 2016 to 2017, in northwest of Qinghai province (97.181508∼102.719060, 35.134949∼38.474832). The images include panchromatic map, multi-spectral map, and visible light map.
3.2 Experiment Results and Analysis
The experiment processes are implemented with the Window 10, Python 3.5 and GTX2080 environment. We apply ADAM optimizer with initial learning rate 0.0001 and the weight decays 1E-5 in the segmentation network. The unified size of all input training, verification and test data is 128 * 128, which is convenient for model evaluation. We train the networks from scratch with randomly initialized weights with 10 input batches. For every iteration, we train the segmentation network 10 times to train network in an adversarial manner.
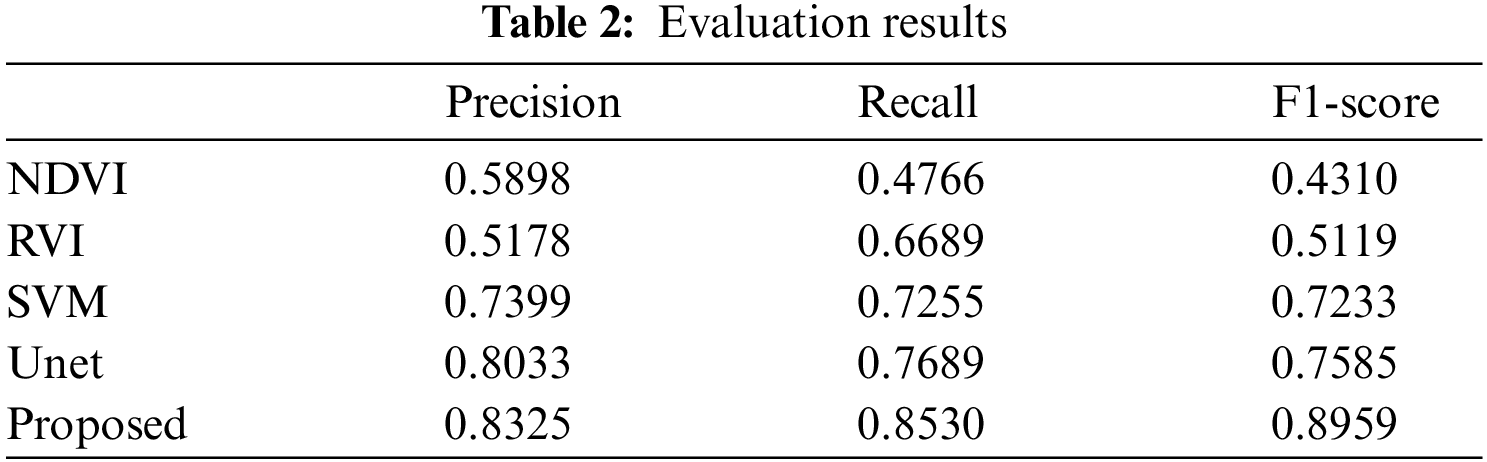
To verify the proposed method, we integrate our method to segmentation networks. We compare the proposed algorithm with similar classical machine learning methods with and mainstream pattern recognition algorithms, the main comparison algorithms are NDVI, RVI, SVM, and Unet. NDVI and RVI are classical thresholding methods in the field of forest remote sensing. SVM is one of the classical pattern recognition methods in the field of machine learning, which has been widely used in data classification and segmentation applications. Deep learning model Unet is one of the mainstream models in the field of medical image segmentation, which has been widely used in the field of medical image segmentation, and is a representative method of deep learning image segmentation model, and also has good application effect in the field of remote sensing. The comparison results are shown in Table 2.
In order to visualize the experimental results, we show the values of the evaluation indicators in the form of bar graphs, as shown in Fig. 4. And Fig. 5 shows the loss and accuracy during training and test process. It can be seen that the model is able to converge properly.

Figure 4: Histogram of precision, recall, and F1 score for the proposed method and baseline methods
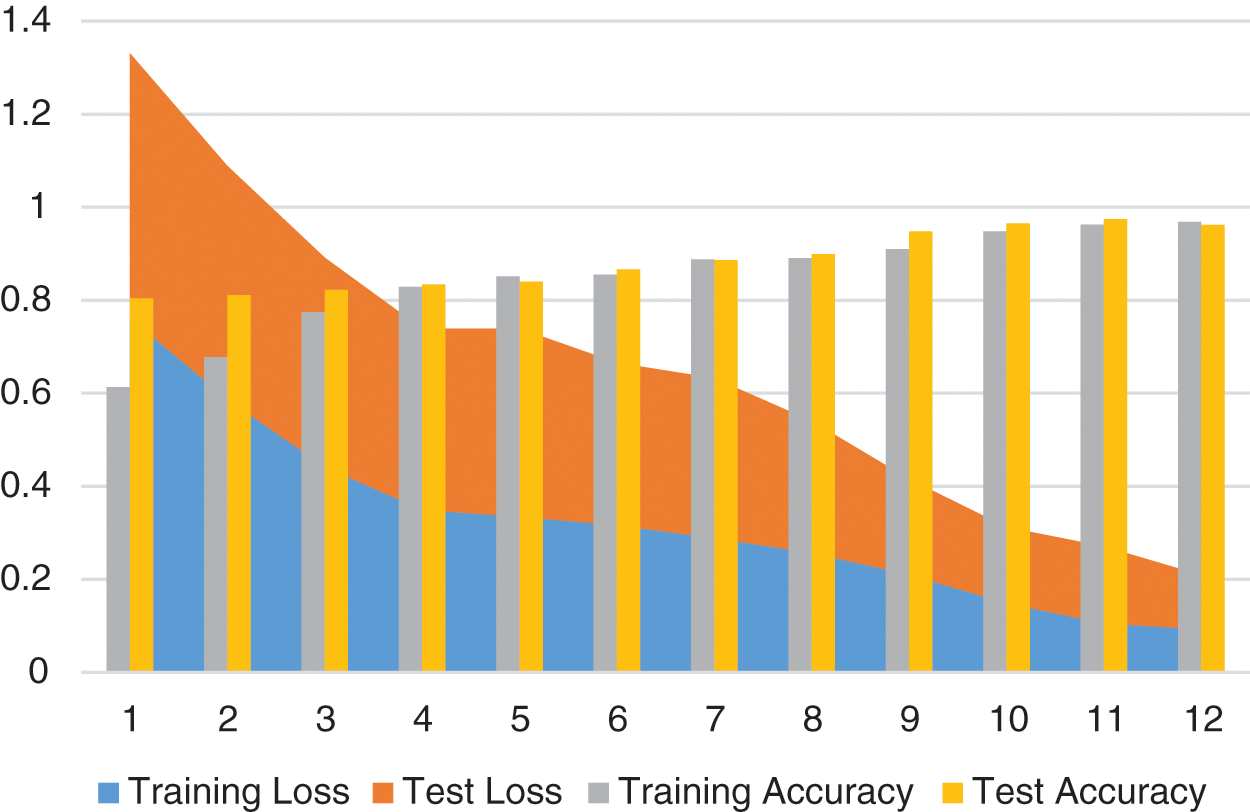
Figure 5: Loss and accuracy during training and test process
To further illustrate the image segmentation effect of the algorithms in this chapter, Fig. 6 shows the output results of the algorithms in this chapter and the comparison algorithms on the segmentation of the test image samples. It can be seen that the algorithm in this chapter can discriminate the forest detail regions more completely for the edge regions of the fragmented forest communities, and thus obtain better forest image segmentation results.

Figure 6: Figures of sample visualization, NDVI, RVI, RF segmentation binary results (row 1), sample ground truth, SVM, UNET, Proposed segmentation binary results (row 2)
Aiming at the problem of inaccurate edges in image segmentation, we propose a collaborative learning method based on boundary preservation and double loss function. Firstly, we use the boundary feature map as an input label to increase the amount of information at the input. Then we improved the Unet segmentation network and combine dense block to improve the feature reuse ability and reduces the image information loss of the model during training. Finally, we apply a strong boundary search algorithm to obtain boundary value, and propose a boundary value loss function. We then demonstrate the utility of our method by detecting plateau forest regions from ZY-3 satellite regarding to Sanjiangyuan nature reserve. The experimental results show that the proposed method can utilize multiple feature information comprehensively which is beneficial to extracting information from boundary, and the detection accuracy is generally higher than several state-of-art algorithms. As a result of this investigation, the study will contribute in several ways to our understanding of DL for region detection and will provide a basis for further researches.
Acknowledgement: Our research was financed by the Basic Research Program of Qinghai Province. We are grateful to two anonymous of BJUT referees for helpful comments on earlier drafts. Thanks also to data support of China State Bureau of Surveying and Mapping.
Funding Statement: This paper is supported by the following funds: Basic Research Program of Qinghai Province under Grants No. 2020-ZJ-709, National Key R&D Program of China (2018YFF01010100), Natural Science Foundation of Beijing (4212001) and Advanced information network Beijing laboratory (PXM2019_014204_5000 29).
Conflicts of Interest: The authors declare that they have no conflicts of interest to report regarding the present study.
References
1. L. Li, F. X. Li, A. H. Guo and X. D. Zhu, “Study on the climate change trend and its catastrophe over “Sanjiangyuan” region in recent 43 years,” Nat. Res, vol. 21, pp. 79–85, 2016. [Google Scholar]
2. K. Long, X. W. Wang and C. H. Li, “Application of satellite communication in ecological monitoring of ‘Sanjiangyuan’,” Digital Communication World, vol. 3, pp. 14–16, 2018. [Google Scholar]
3. G. Cheng and J. W. Han, “A survey on object detection in optical remote sensing images,” ISPRS Journal of Photogrammetry and Remote Sensing, vol. 117, pp. 11–28, 2016. [Google Scholar]
4. P. Arévalo, P. Olofsson and C. E. Woodcock, “Continuous monitoring of land change activities and post-disturbance dynamics from landsat time series: A test methodology for REDD+ reporting,” Remote Sensing Environment, vol. 238, pp. 111051, 2020. [Google Scholar]
5. A. M. Lechner, G. M. Foody and D. S. Boyd, “Applications in remote sensing to forest ecology and management,” One Earth, vol. 2, no. 5, pp. 405–412, 2020. [Google Scholar]
6. A. H. S. Solberg, “Contextual data fusion applied to forest map revision,” IEEE Transactions on Geoscience & Remote Sensing, vol. 37, pp. 1234–1243, 2002. [Google Scholar]
7. T. Blaschke, C. Burnett and A. Pekkarinen, “Image segmentation methods for object-based analysis and classification,” in Remote Sensing Image Analysis: Including the Spatial Domain, Netherlands: Springer, pp. 211–236, 2004. [Google Scholar]
8. L. Khelifi and M. Mignotte, “Deep learning for change detection in remote sensing images: Comprehensive review and meta-analysis,” IEEE Access, vol. 8, pp. 126385–126400, 2020. [Google Scholar]
9. K. F. Lu, Y. S. Zhang, Y. Yu, G. L. Lai and L. Ding, “Random forest remote sensing image change detection with super pixel,” Journal of Geomatics Science and Technology, vol. 11, no. 3, pp. 269–274, 2019. [Google Scholar]
10. C. Y. Chen, W. G. Gong, Y. L. Chen and W. H. Li, “Object detection in remote sensing images based on a scene-contextual feature pyramid network,” Remote Sensing, vol. 3, pp. 269–274, 2020. [Google Scholar]
11. Y. Z. Liu, H. R. Lai, D. W. Zhang, F. P. Liu, X. L. Jiang et al., “Remote sensing image change detection based on multi-feature hybrid kernel SVM model,” Remote Sensing of Territorial Resources, vol. 1, pp. 16–21, 2019. [Google Scholar]
12. X. M. Li, B. X. Tan, Z. Y. Li and Q. L. Zhang, “A comparative study of forest type classification methods in CHRIS hyperspectral images,” Remote Sensing Technology and Applications, vol. 2, pp. 227–234, 2010. [Google Scholar]
13. J. Long, E. Shelhamer and T. Darrell, “Fully convolutional networks for semantic segmentation,” IEEE Transactions on Pattern Analysis and Machine Intelligence, vol. 39, no. 4, pp. 640–651, 2017. [Google Scholar]
14. O. Ronneberger, P. Fischer and T. Brox, U-net: Convolutional Networks for Biomedical Image Segmentation, Berlin, Germany: Springer International Publishing, pp. 234–241, 2015. [Google Scholar]
15. M. Q. Guo, H. Liu, Y. Y. Xu and Y. Huang, “Building extraction based on U-net with an attention block and multiple losses,” Remote Sensing, vol. 12, no. 9, pp. 1400, 2020. [Google Scholar]
16. W. C. Kang, Y. M. Xiang, F. Wang and H. J. You, “EU-net: An efficient fully convolutional network for building extraction from optical remote sensing images,” Remote Sensing, vol. 11, no. 23, pp. 2813, 2019. [Google Scholar]
17. T. Y. Lin, P. Goyal, R. Girshick and K. M. He, “Focal loss for dense object detection,” in Proc. of the IEEE Int. Conf. on Computer Vision, Venice, Italy, pp. 2980–2988, 2017. [Google Scholar]
18. Z. R. Ye, Y. Y. Fu, M. Y. Gan, J. S. Deng and A. Comber, “Building extraction from very high-resolution aerial imagery using joint attention deep neural network,” Remote Sensing, vol. 11, pp. 2970–2990, 2019. [Google Scholar]
19. L. C. Chen, G. Papandreou, I. Kokkinos, K. Murphy and A. Yuille, “Deeplab: Semantic image segmentation with deep convolutional nets, atrous convolution, and fully connected CRFS,” IEEE Transactions on Pattern Analysis and Machine Intelligence, vol. 40, no. 4, pp. 834–848, 2017. [Google Scholar]
20. C. He, S. L. Li, D. H. Xiong, P. Z. Fang and M. S. Liao, “Remote sensing image semantic segmentation based on edge information guidance,” Remote Sensing, vol. 12, no. 9, pp. 1501, 2020. [Google Scholar]
21. W. Liu, J. W. Xu, Z. H. Guo, E. Z. Li and X. Li, “Building footprint extraction from unmanned aerial vehicle images via PRU-net: Application to change detection,” IEEE Journal of Selected Topics in Applied Earth Observations and Remote Sensing, vol. 14, pp. 2236–2248, 2021. [Google Scholar]
22. G. M. Gandhi, S. Parthiban, N. Thummalu and A. Christy, “Ndvi: Vegetation change detection using remote sensing and GIS-A case study of Vellore District,” Procedia Computer Science, vol. 57, pp. 1199–1210, 2016. [Google Scholar]
Cite This Article
 Copyright © 2022 The Author(s). Published by Tech Science Press.
This work is licensed under a Creative Commons Attribution 4.0 International License , which permits unrestricted use, distribution, and reproduction in any medium, provided the original work is properly cited.
 Downloads
 Citation Tools