
 Submit a Paper
 Propose a Special lssue
 Open Access
ARTICLE

Developing a Secure Framework Using Feature Selection and Attack Detection Technique
Department of Electrical Engineering and Computer Science, College of Engineering and Applied Science, University of Cincinnati, 2600 Clifton Ave, Cincinnati, OH 45221, USA
* Corresponding Author: Mahima Dahiya. Email:
Computers, Materials & Continua 2023, 74(2), 4183-4201. https://doi.org/10.32604/cmc.2023.032430
Received 18 May 2022; Accepted 12 July 2022; Issue published 31 October 2022
 View Full Text
 Download PDF
Abstract
Intrusion detection is critical to guaranteeing the safety of the data in the network. Even though, since Internet commerce has grown at a breakneck pace, network traffic kinds are rising daily, and network behavior characteristics are becoming increasingly complicated, posing significant hurdles to intrusion detection. The challenges in terms of false positives, false negatives, low detection accuracy, high running time, adversarial attacks, uncertain attacks, etc. lead to insecure Intrusion Detection System (IDS). To offset the existing challenge, the work has developed a secure Data Mining Intrusion detection system (DataMIDS) framework using Functional Perturbation (FP) feature selection and Bengio Nesterov Momentum-based Tuned Generative Adversarial Network (BNM-tGAN) attack detection technique. The data mining-based framework provides shallow learning of features and emphasizes feature engineering as well as selection. Initially, the IDS data are analyzed for missing values based on the Marginal Likelihood Fisher Information Matrix technique (MLFIMT) that identifies the relationship among the missing values and attack classes. Based on the analysis, the missing values are classified as Missing Completely at Random (MCAR), Missing at random (MAR), Missing Not at Random (MNAR), and handled according to the types. Thereafter, categorical features are handled followed by feature scaling using Absolute Median Division based Robust Scalar (AMD-RS) and the Handling of the imbalanced dataset. The selection of relevant features is initiated using FP that uses ‘3’ Feature Selection (FS) techniques i.e., Inverse Chi Square based Flamingo Search (ICS-FSO) wrapper method, Hyperparameter Tuned Threshold based Decision Tree (HpTT-DT) embedded method, and Xavier Normal Distribution based Relief (XavND-Relief) filter method. Finally, the selected features are trained and tested for detecting attacks using BNM-tGAN. The Experimental analysis demonstrates that the introduced DataMIDS framework produces an accurate diagnosis about the attack with low computation time. The work avoids false alarm rate of attacks and remains to be relatively robust against malicious attacks as compared to existing methods.Keywords
Government, banking, business, and health care all require robust, dependable cyber security solutions [1]. It's certain, the difficulty has grown significantly in the big data age in comparison to already applied solutions, such as classic intrusion detection systems (IDS) [2,3]. The rapid development of technical capabilities has made way for cyber threats that use a variety of hostile tactics to target persons or businesses. Traditional security measures such as firewalls, anti-virus software, and virtual private networks (VPNs) are not necessarily sufficient in this threat environment, and effective systems for detecting intrusions must be established [4]. Thus, installing IDS with other traditional security solutions is a critical approach [5,6]. IDS are software applications that monitor network traffic to detect malicious content or activity [7,8]. The IDS is structured in a way that it gives alarms and tells when harmful information is obtained. Even though most IDS systems are created to identify and outline dubious network activity, it's important to note that sophisticated systems can block suspicious network traffic [9,10].
In general, the IDS are divided into misuse detection systems where the detection is based upon the signature and anomaly detection systems where the detection is based on profile [11,12]. In Anomaly detection systems there is a variation in ordinary system profile which is the main goal of this method, but in misuse detection systems, the main goal is to match with the attack case [13,14]. The fake alarm rate is normally high in anomaly detection systems because it is used to identify unfamiliar attacks having high-performance rates. These drawbacks are normally reduced by using the misuse detecting system that depends upon the difference between the normal and malicious behavior of the signature [15]. Even though, both systems are having a direct impact on detection rules freshness, enhancement in the accuracy of detection and studying the speed of the detection system is more difficult [16].
Recently, a high accuracy rate and identification of various attack methods are achieved by using the data mining method in network intrusion detection systems [17]. The statistics and artificial intelligence methods are used by data mining methods to make knowledge from the large datasets to produce the solutions for complex problems. The machine learning method is used as a technical tool in data mining techniques to produce information from the raw data. The data present in the data mining technique is saved in electronic form and both the automatic and semiautomatic methods are used to find the pattern [18].
Currently, data mining-based IDS turns to be very challenging due to, false positives, false negatives, low detection accuracy, high running time, adversarial attacks, and uncertain attacks. To address this issue, the work has developed a DataMIDS framework using the Bengio Nesterov Momentum-based Tuned Generative Adversarial Network (BNM-tGAN) detection technique.
The remaining part of the paper is organized as follows: Section 2 is a brief survey of the associated work on the proposed method. In Section 3 the proposed methodology is explained. Section 4 illustrates the results and discussion for the proposed method based on performance metrics. Finally, Section 5 concludes the paper with future work.
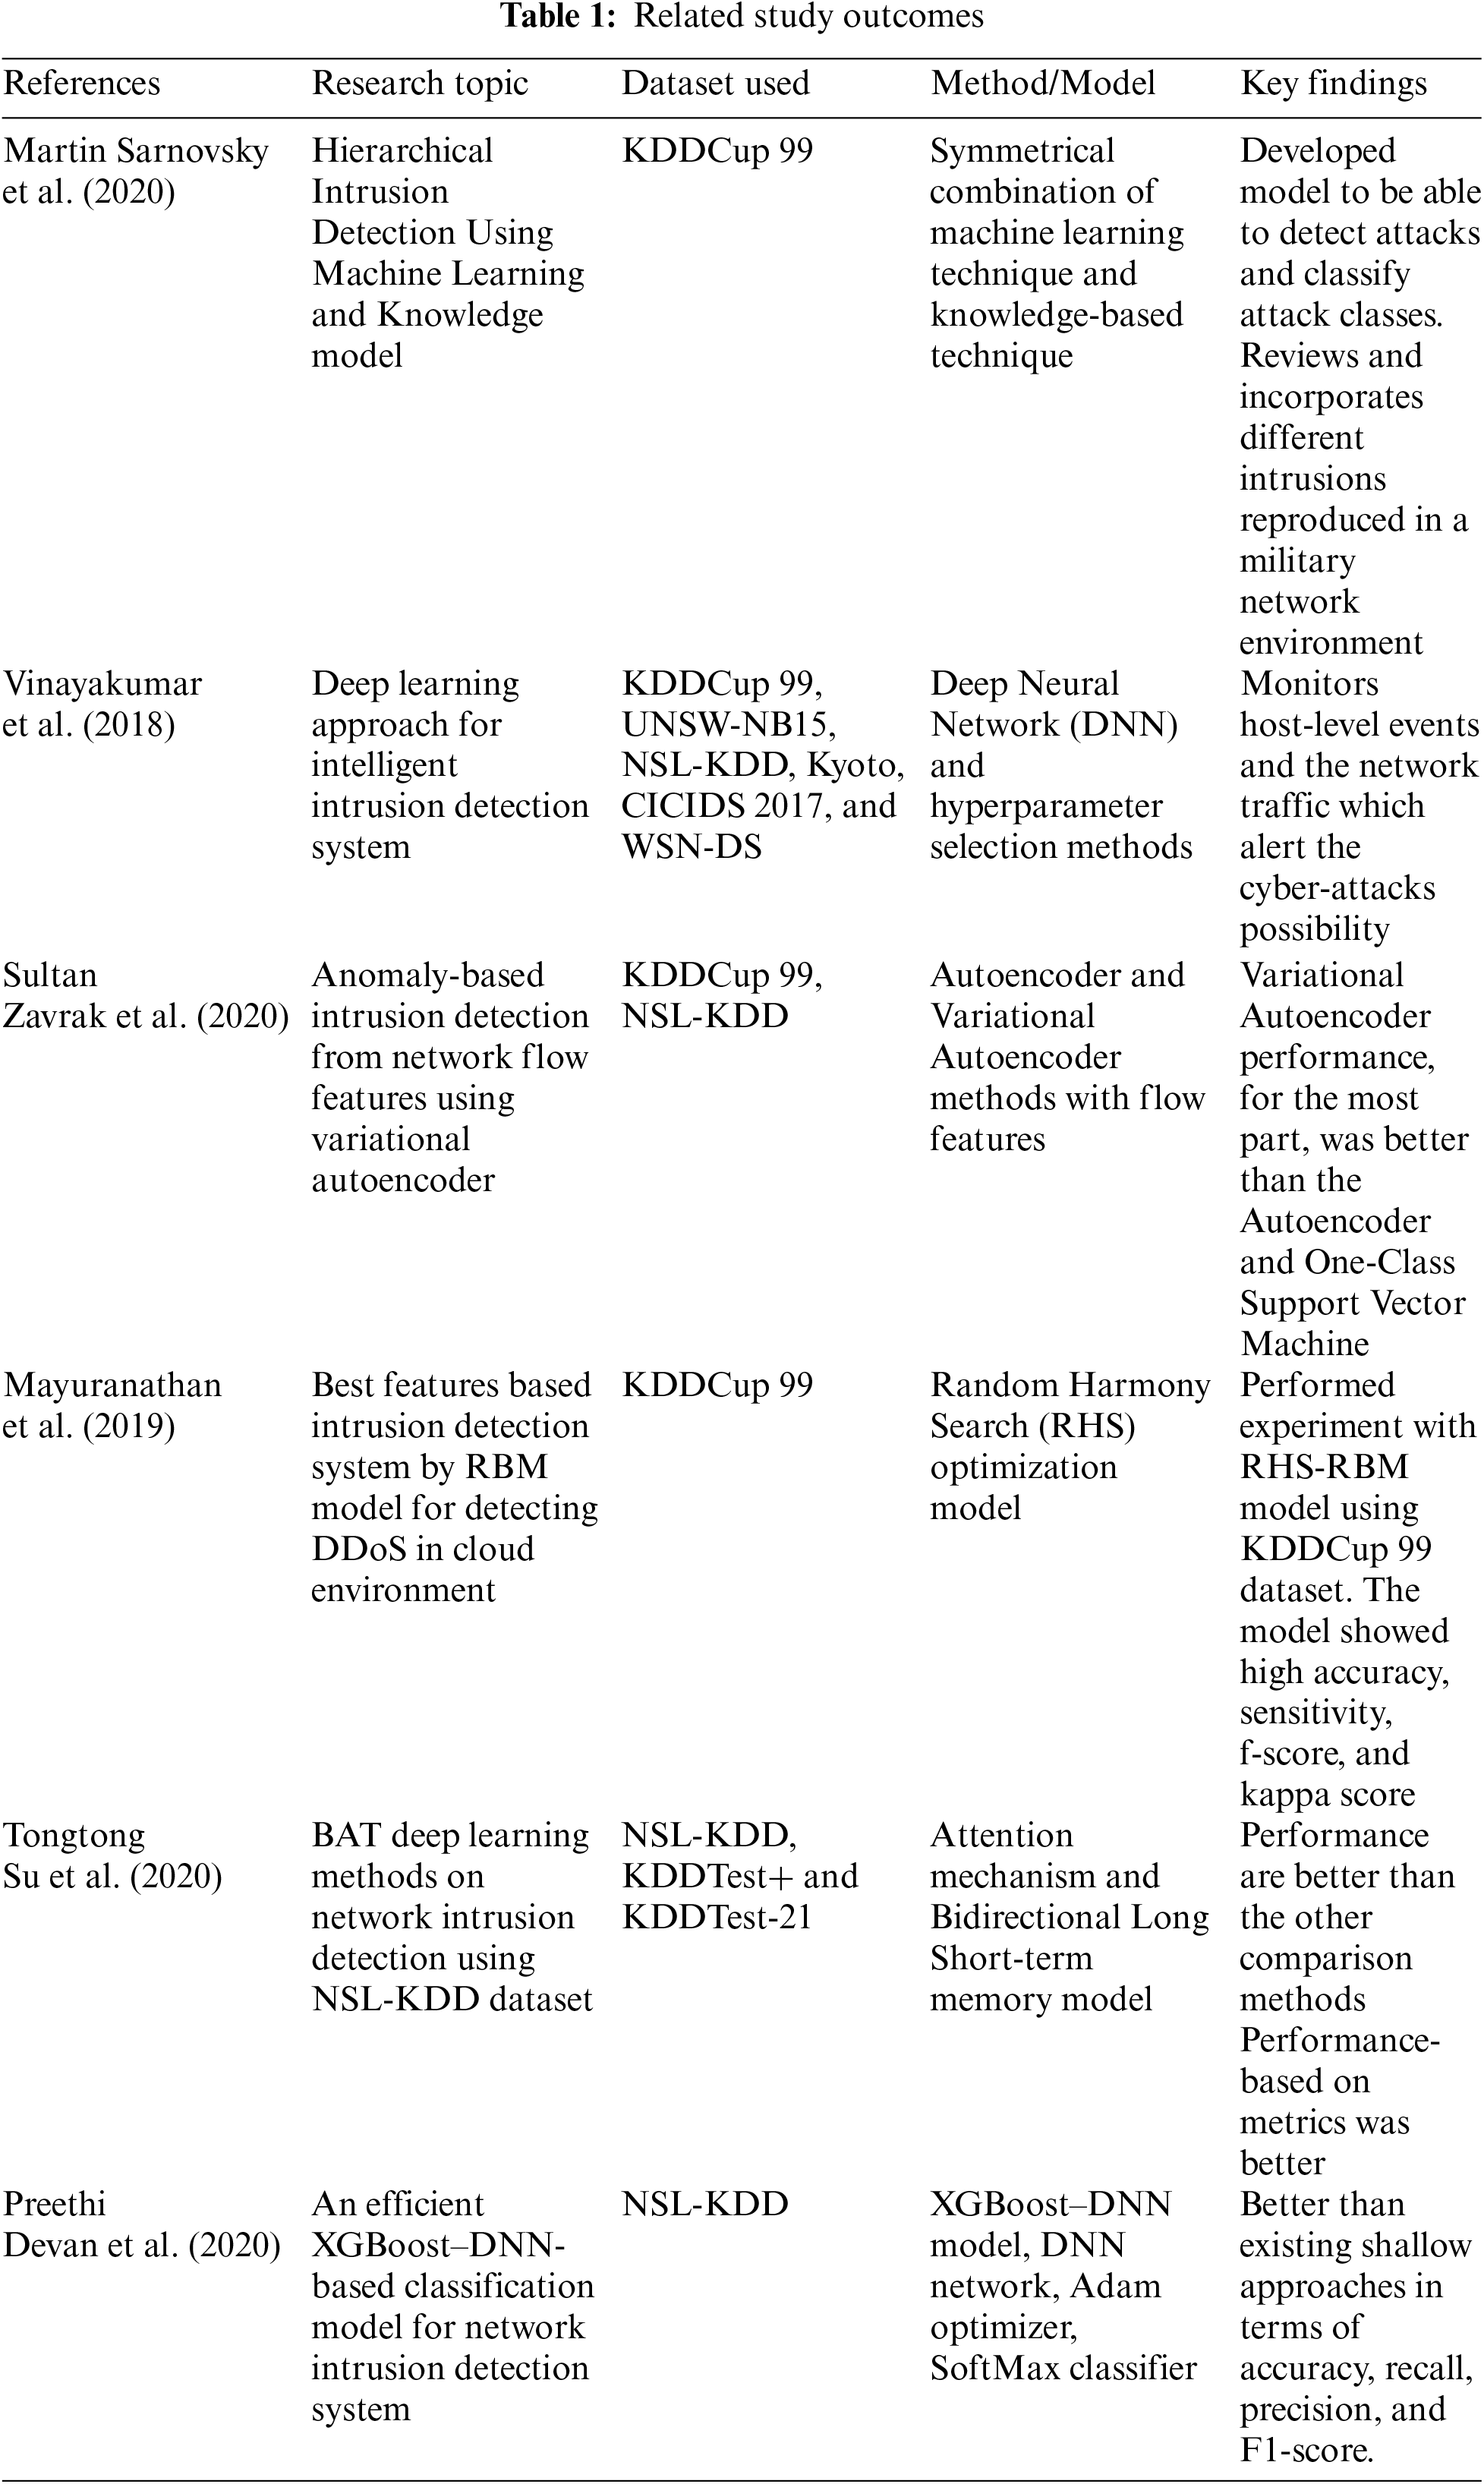
Sarnovsky et al. [19] developed a new IDS topology which is the symmetrical combination of machine learning technique and knowledge-based technique designed to evaluate the network attacks Predictive models capable of detecting normal connections from assaults and then forecasting attack classes and specific attack types comprised the multi-stage hierarchical prediction. We were able to travel through the attack taxonomy and select the right model to do a prediction on the given level using the knowledge model Knowledge Discovery in Databases (KDD) 99 dataset consists of a set of data that's reviewed and incorporates different intrusions reproduced in a military network environment [20]. On the widely used KDD, Designed IDS was examined and compared to similar techniques. However, the characteristics’ useless data resulted in erroneous attack detection.
Vinayakumar et al. [21] developed the effective IDS and flexible by considering a Deep Neural Network (DNN) to predict and unforeseen the cyber-attacks detection and classification. Based on the Hyperparameter selection methods the optimal network parameters and network topologies for DNNs were chosen with the KDDCup 99 dataset. Then conducting more experiments by the DNNs till the learning rate reaches 1,000 epochs that ranged between [0.01–0.5]. The DNN model which performed well on KDDCup 99 was applied on other datasets such as University of New South Wales (UNSW)-NB15, Network Security Laboratory (NSL)-KDD, Kyoto, CICIDS 2017, and WSN-DS to conduct the benchmark. Finally, develop a Scale-Hybrid-IDS-AlertNet (SHIA) which is a highly scalable, and hybrid DNNs framework called Scale-Hybrid-IDS-AlertNet (SHIA) was developed, that is used to monitor host-level events and the network traffic which alert the cyber-attacks possibility. As the training of DNN was not sufficient, this led to the underfitting of the model and increased the error rate.
Zavrak et al. [22] developed a semi-supervised learning approach with unsupervised deep learning methods for monitoring the irregular traffic from low-based data. And to identify unknown attacks the Autoencoder and Variational Autoencoder methods were introduced with flow features. This approach used the features which are extracted out of network traffic data with flow features, which included typical and different types of attacks. The One-Class Support Vector Machine is compared with the Receiver Operating Characteristics (ROC) and the area under the ROC curve is calculated. The performance is analyzed using the ROC curves at various threshold levels. The final result shows that the Variational Autoencoder performance to a great degree was better than the Autoencoder and One-Class Support Vector Machine. But the approach was vulnerable to adversarial and uncertain attacks.
Mayuranathan et al. [23] illustrated an effective feature subset selection-based classification model for Distributed Denial of Service (DDoS) attack detection. DDoS are a subclass of DOS attack. They target an online website by overwhelming it with the traffic using the online connected devices like router and server. The Random Harmony Search (RHS) optimization model is used to detect the DDoS attack in IDS, with maximum detection the best feature sets were selected. After the features selection, the DDoS detection is done by introducing a Deep learning-based classifier model with Restricted Boltzmann Machines (RBM). The DDoS attack detection rate was improved, and seven additional levels were added in between the RBM's visible and hidden layers. The experimentation is done for the RHS-RBM model against the KDD′99 dataset. The experimental results showed that the RHS-RBM model achieved a specificity of 99.96, maximum sensitivity of 99.88, F-score of 99.93, the accuracy of 99.92, and kappa value of 99.84, but it was not able to handle dynamic and random behavior of malicious attack.
Su et al. [24] combined attention mechanism and BLSTM (Bidirectional Long Short-term memory) for IDS. The network flow vector consisted of packet vectors created by the BLSTM model, which may obtain the main features for network traffic classification, which was screened using the attention mechanism. In addition, it used many convolutional layers to collect traffic data's local properties. The network classification is done through the SoftMax classifier. The testing is performed for this approach using the public benchmark dataset, and the experimental results show that the performance is better than the other comparison methods. The performance-based on metrics was better but it took more computational time, which may be helpful for attackers to trap data.
Devan et al. [25] utilized XGBoost–DNN for feature selection and categorization of network intrusion, followed by a deep neural network (DNN). The XGBoost–DNN model had three steps: feature selection, normalization, and classification. DNN used learning rate optimization in the Adam optimizer, and classification of network intrusions is completed through the SoftMax classifier. The tests were carried out on the benchmark NSL-KDD dataset. The accuracy, recall, precision, and F1-score classification evaluation metrics were generated and compared to the existing shallow approaches. The method outperforms the dataset's current shallow methods, but the false alarm rate was observed to be high that decreasing approach accuracy for detecting the attack. Tab. 1 given below discusses about the various network models, algorithms and the outcomes achieved after doing experimental analysis using the datasets as mentioned for different research papers.
3 Proposed Secure DataMIDS Framework
Intrusion detection is a tough technique in cyberspace security that protects a system from hostile assaults. As shown in Fig. 1, a unique accurate and effective misuse IDS that depends on distinct attack signatures to discriminate between normal and malicious activities is offered to identify various assaults based on the DataMIDS architecture utilising the BNM-tGAN detection approach.
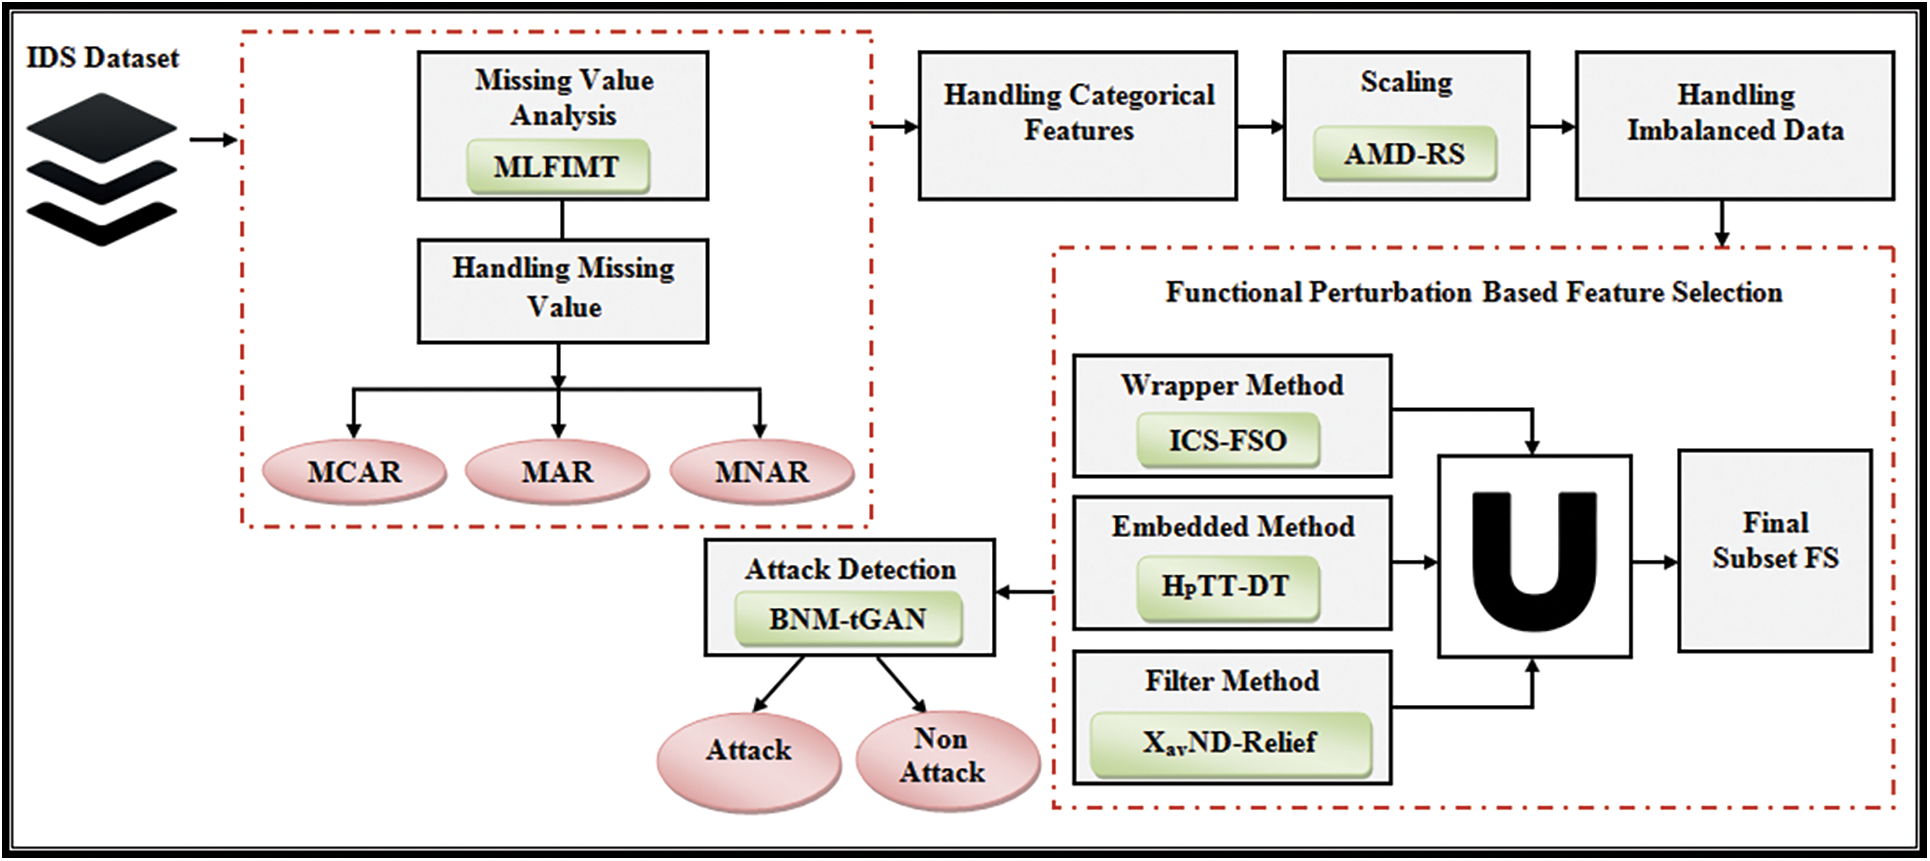
Figure 1: Proposed data mining intrusion detection system (DataMIDS) framework
Missing value analysis can assist to improve the IDS by identifying and resolving issues caused by missing data. If cases with missing data are consistently different from those without missing values, the conclusions of attack behaviour may be deceiving. Another difficulty is that many statistical procedures’ assumptions are based on datasets, and missing numbers may make understanding the attack more difficult.
When dealing with missing data, it is important to remember that the observed data
The missingness is defined
The various types of missing data refer to various relationships between
Now to get the information of the impact of missing values on the dependent class attacks the work has developed a Marginal Likelihood Fisher Information Matrix (MLFIM). The existing fisher matrix computes the log-likelihood using a derivative function that leads to more computational time and ignoring the marginal likelihood analysis of the data which leads to giving misleading information regarding the missing values and observed values. To address this issue, the work has developed Marginal likelihood by performing integral log-likelihood functions.
The MLFIM is used to calculate the amount of information that an observable random variable
Suppose the log-likelihood without missing values is
The Fisher information Under specific regularity conditions is given by
The Fisher information matrix helps to collect the respective information about the data i.e.,
The complete information:
The observed information:
The missing information:
Then we have
Now based on the relation information collected, the nature of missing values is identified whether the missing values are MCAR, MAR, or MNAR and are handled via respective techniques. Handling missing values concepts are given by
(a) Missing Completely at Random (MCAR)
In this method, the observation missing is not dependent upon the variables and it has the probability of missing an observation rely on
If the missing value is caused due to MCAR then the work uses the mean, median, and mode method to fill the missing values.
(b) Missing at random (MAR)
The likelihood of a missed observation is solely determined by the observed data
If the missing value is caused due to MAR, then the work uses forward fill or backward fill to handle the missing values.
(c) Missing Not at Random (MNAR)
It is used for the missing data is either MCAR or MAR. They are determined by both the missing and observed values. Handling missing values in this approach is frequently impossible since it is dependent on unseen data. The MNAR probability is calculated as follows:
If the missing value is caused due to MAR, then the work uses a regression model to handle the missing values.
3.2 Handling of Categorical Feature
Categorical features tend to obscure and mask a large amount of critical traffic data in a dataset. Handling categorical features is essential because machine learning algorithms cannot understand categories. Instead, the categories are transformed into numerical variables, which are subsequently utilised by machine learning models.
where,
The purpose of feature scaling is to get the dataset feature of the same unit, which is to standardise the range of independent variables or data features. The huge difference in distance found in the IDS dataset is related to the data set's vast range characteristic. As a result, broad range values of the instances must be normalised or scaled to reduce the big variance. To scale down the features within the same range, the work uses the Absolute Median Deviation-based Robust Scaler (AMD-RS). Robust Scaler generates the feature vector by removing the median of each feature and dividing it by the interquartile range (75%–25%). However, the variance of the data exceeds the mean of the individual characteristics, resulting in the skewness of the data set and producing a loss in meaningful data. This study has employed median absolute deviation to address this issue. The AMD-RS approaches aid in the detection of outliers or irregular data assaults.
where,
Thus, overall, the IDS data is being pre-processed to obtain healthier data.
In this method, the random over sampler is used to balance the imbalanced data. This random over sampler introduced balanced data by means of randomly duplicating the examples from the minority class
3.5 Functional Perturbation Based Feature Selection
The process of picking the most suitable characteristics that help to the development of a robust model is known as feature selection. Feature selection can be done manually or with the use of various approaches and algorithms. It is a critical stage in developing a strong Intrusion Detection System (IDS) to remove extraneous elements that cause false alerts and boost the system's accuracy. The work established a functional perturbation-based feature selection to avoid false alarms.
Functional perturbation selects a final subset of the features needed to detect the assault. On the same set of data
3.5.1 Feature Selection Based on Wrapper Method
The Inverse chi square-based Flamingo Search Optimization (ICS-FSO) is used to create Feature Selection Model 1. To preserve the balance between exploitation and exploration, the ICS-FSO restricts the global search space throughout the flamingo's foraging range. Furthermore, the existing chi-square test in FSO becomes locked for big independent variables, resulting in a high error rate. The ICS working mechanism is paired with FSO to overcome these challenges. The created approach takes flamingo as the feature and fitness value as the best feature score. The ICS-FSO approach takes the following steps:
Step 1: Initially, the population of the flamingo is initialized that tries to produce the optimum solution based on the available data, the research area is selected where the availability of food is most abundant. Let us assume the Flamingo (
Let consider the
where,
where,
Let's consider certain assumptions, such as food for a large number of people is
The flamingo's foraging location is denoted by the equation,
where,
Step 2: The flamingos migrate to the next area due to the scarcity of food in the present area. Let assume that the area which has rich food consumption having
where,
3.5.2 Feature Selection Technique Using Embedded Method
Feature selection mechanism depends upon the embedded system technique for feature selection and classification. The work has developed a Hyperparameter-tuned Threshold-based decision tree (HpTT-DT). The Feature selection technique used a tree-based decision-making construction method that is used to process the feature selection. While evaluating the features of partition samples which is present at every layer, some standard values are used to calculate the feature, from these sample portion one best feature is selected at every time. But decision tree construction for categorical features is quite easy as compared to the numerical data. IDS dataset comprises of maximum numerical data, so to handle it, a threshold technique has been used. But the selection of a threshold for constructing a decision tree tends to be a difficult task. To conquer that, the Hyperparameter tuning is done based on confidence interval for threshold finding. The thresholds are based on the confidence level computed with the statistic. The confidence interval gives us the lower and upper bound under the 95% confidence level to perform the tree splitting.
where
HpTT-DT minimizes variance and performs variable selection. DT performs the selection of features based on gain (
where,
Finally, the embedded method gives the most relevant features to predict the crop yield that is given by:
3.5.3 Feature Selection Technique Using the Filter Method
The variables are chosen rather than the model through the filter-based feature selection approach. They rely mostly on correlation with the variable to be predicted. The work has developed a Xavier Normal Distribution Based Relief (XavND-Relief) feature weighting algorithm that delivers varying weights based on relevance and categories. It addresses the issue of high computing cost and computes the initial weight using the Xavier Normal distribution weight initialization method to prevent slowing down the computation time. The capacity of features to discriminate between close samples determines the importance of features and categories in the created algorithms. The weights are first initialised using the Xavier normal distribution weights initialization procedure, which is provided by:
where,
Thereafter, the approach selects sample data points
where: function
For discrete features:
For continuous feature:
After updating the weights of the feature, they are sorted in descending orders and the greater weight of a feature implies a highly relevant feature for stronger classification ability. Thus, the most relevant features are ranked that is given by:
Overall, the function uses a union operation to evaluate its inputs using the Eq. (31), the best feature is evaluated, i.e., baseline feature set.
Finally, the functional perturbation-based feature selection provides a secondary optimal set of features that improves the attack detection accuracy.
Feature selection data calculate the attack detection which is used to train the given model. The introduced work uses a Bengio Nesterov Momentum-based Tuned Generative Adversarial Network (BNM-tGAN). The existing GAN leads to a high error rate for performing IDS due to complex loss function and high computed optimizer to handle the loss. The poor performance of the GAN leads to misclassification of attack which in turn gives an unsecured IDS system. To conquer this issue, the work has used the Wasserstein loss function that is used as a tuned factor in GAN, which make the training model more stable and produce a lossy function that correlates with the quality of generated attack or noise and the loss function is compiled using Bengio Nesterov momentum optimizer that selects moderate weight value and computes within low time with high accuracy.
Basically, BNM-tGAN uses the machine learning algorithm which is an unsupervised method that spontaneously finds and learns the pattern used in input data. Similarly, this method is utilized to produce or generate the new outputs from the given original dataset as shown in Fig. 2.
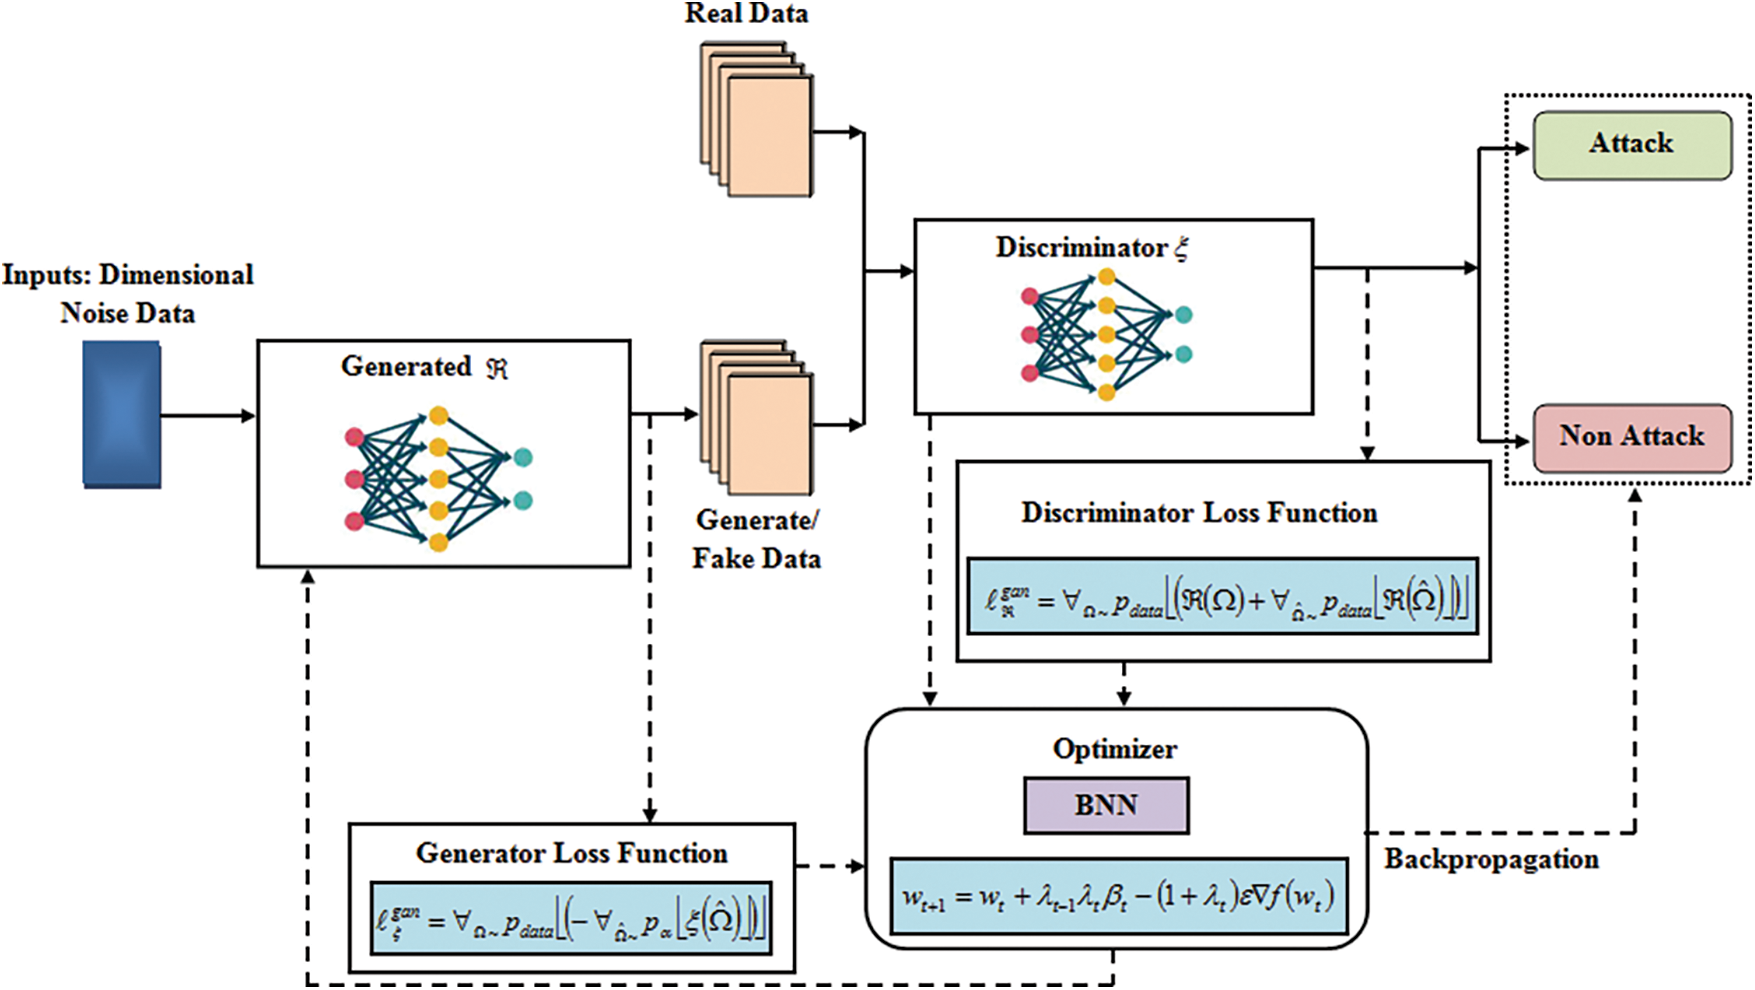
Figure 2: Proposed Bengio Nesterov momentum-based tuned generative adversarial network (BNM-tGAN) architecture
The approach consists of discriminator
Now, the work has initiated with Wasserstein loss for discriminator (
where,
where,
Finally, the loss function is reduced, and the accurate detection of attack is done using BNM-tGAN. Thus, a brief description of the intended BNM-tGAN is shown in the form of pseudo code in Fig. 3.
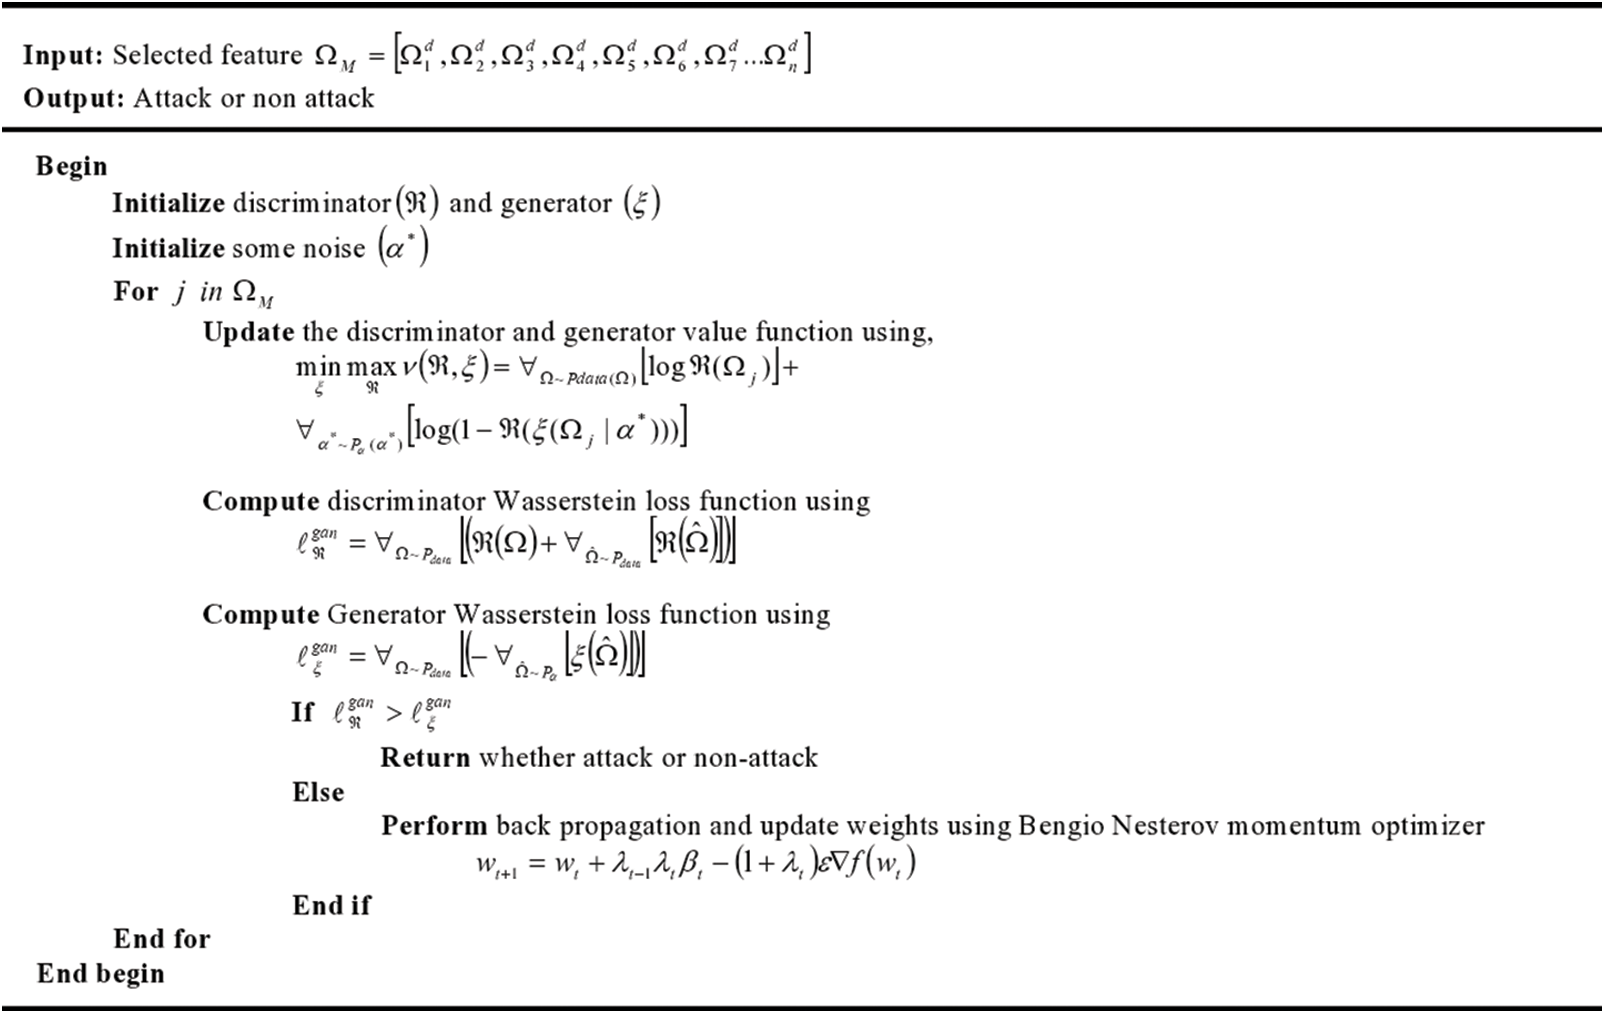
Figure 3: Pseudo code for proposed BNM-tGAN
The proposed framework for a highly secured intrusion detection system for IoT has been analysed and compared with the existing techniques to determine its strength. The following experiments were set up 5PK8T Intel Core 11th Generation i7-1165G7 Processor (Quad Core, Up to 4.70 GHz, 12MB Cache), 64-bit Windows 11 OS. The work has been implemented in Python v3.7 platforms based on the NSL-KDDCUP99 available on the kaggle website (https://www.kaggle.com/).
The UNSWNB15 data set is a mix of real, modern, normal, and contemporary artificial network traffic attack activities. Existing and novel methods are utilized to totally generate 49 features with the class label of the UNSWNB15 data set. Fuzzers, Analysis, Backdoors, DoS, Exploits, Generic, Reconnaissance, Shellcode, and Worms are among the nine types of attacks in this dataset. From the dataset, 80% of data is used for training and 20% of data is used for testing.
The KDD Cup'99 dataset is used to build an IDS. It contains 41 features per network connection which are listed into certain groups. Here, 80% of data is used for training and 20% is used for testing. A drawback of this dataset is that a huge amount of redundant data is duplicated for the testing and training set making the learning algorithm biased. This prevents from detecting infrequent records that are more harmful to U2R attacks. Due to this, a new dataset termed NSL-KDD was made to solve the poor evaluation of anomaly detection methods and performance of the evaluated system [26]. The experimental analysis is done using this. Here, 70% of data is taken for training and 30% for testing.
4.1 Performance Evaluation of Feature Selection Technique
This section analyses the performance of the proposed FP-FS method based on fitness vs. iteration. The fitness of the proposed method is contrasted against the existing Squirrel Search Optimization (SSO), Stimulated Annealing Based Particle Swarm Optimization (SA-PSO), Genetic Algorithm based Grey Wolf Optimization (GA-GWO), and Chimp Optimization Algorithm (ChOA) methods.
Fig. 4 depicts the graphical depiction of fitness vs. iteration performance of proposed and existing approaches. The term “Fitness vs. Iteration” refers to the strategy that adheres to the best fitness value while reducing computing time within a minimum number of iterations. The number of iterations ranges from 10–50 with a step size of 10. The proposed approach has a fitness value of 139 after 10 iterations while for the 10 iterations, for existing works it ranges from 58 to 95. With further analysis, the proposed approach has a fitness ranging from 158 to 215 for the remaining iterations, whereas the existing methods reach a fitness ranging from 65 to 135. Existing approaches show poor fitness value for number of iterations in comparison to the proposed method. This shows that the suggested technique outperforms the existing methods. The findings show that the suggested FD-FS technique efficiently decreases the dimensions of the dataset by picking the best features for classification and increases classification accuracy.
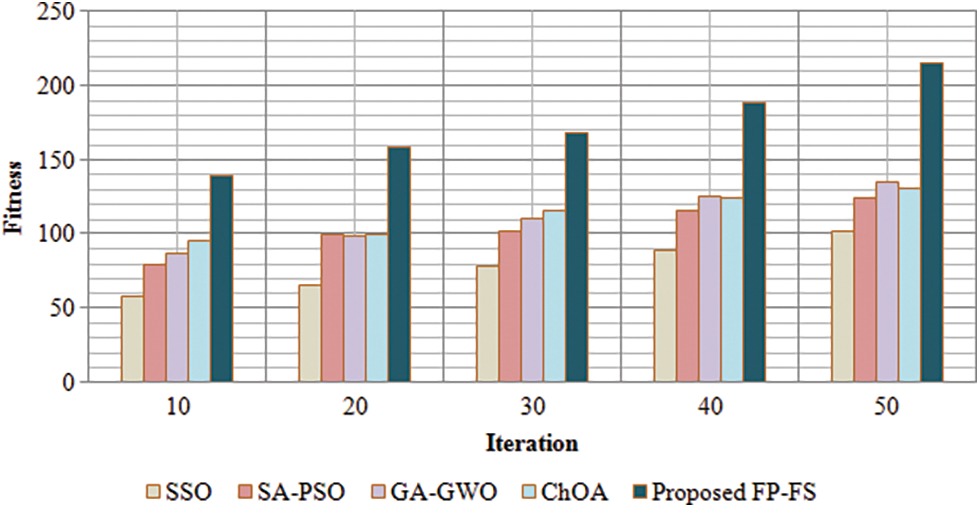
Figure 4: Performance of proposed FD-FS based on fitness vs. iteration
From Fig. 4, the graphical representation of the proposed FD-FS algorithm is analysed which aspires to produce a better fitness outcome for the respective iteration than the existing SSO, SA-PSO, GA-GWO, and ChoA algorithm. At low iteration, the fitness value is improved with the decrease in time and good accuracy is achieved without any delay.
4.2 Performance Evaluation of Classification Technique
Here, the performance evaluation of the proposed BNM-tGAN method is analysed using the existing Elman Neural Network (ENN), Convolution Neural Network (CNN), Generative Adversarial Network (GAN), and Adaptive neuro-fuzzy interface system (ANFIS) methods based on accuracy, sensitivity, specificity, precision, F-measure, False Positive Rate (FPR), False Negative Rate (FNR), and Mathews Correlation Coefficient (MCC). Then, the performance analysis is given for the computation time and attack detection time of the proposed and existing methods. The various performance metrics for the Attack Detection is calculated as follows
The Tab. 2 shown below depicts the assessment of the proposed BNM-tGAN based on performance measures like Accuracy, Specificity, Sensitivity, Precision, F-Measure, FPR, FNR, and MCC. The metrics value is decided by four key parameters: true positive (TP), true negative (TN), false positive (FP), and false negative (FN). These factors are the base for the performance measures. TP asserts that the actual value and the predicted value is not an attack while TN asserts that they are an attack. Whereas FP asserts that the actual value is an attack but the predicted value is not an attack, and FN asserts that the actual value is not an attack but the predicted value is interpreting an attack. So, identifying an assault depends on the four factors and the metric values are produced and represented visually based on these.
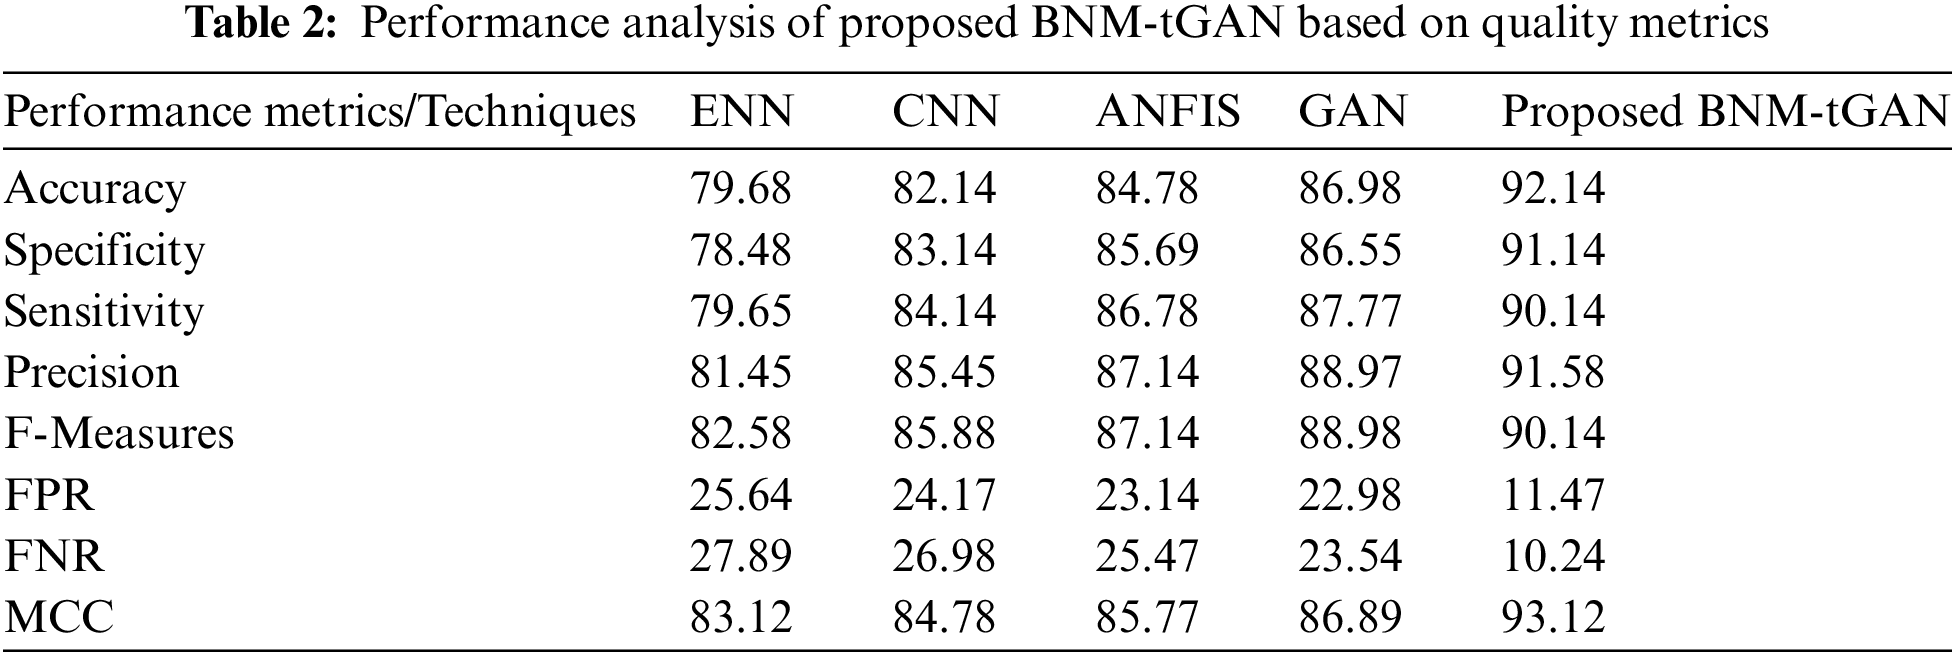
The suggested technique achieves 92.14% classification accuracy, where the existing ENN, CNN, ANFIS, and GAN methods obtain 79.68%, 82.14%, 84.78%, and 86.98%, respectively, which are lower than the proposed BNM-tGAN method. And, the given technique has sensitivity, specificity, and accuracy of 91.14%, 90.14%, and 91.58%, respectively, which is more than the existing methods, which vary from 78.48% to 88.97%. The proposed BNM-tGAN method has FPR and FNR of 11.47% and 10.24%, respectively, which is lower than the existing CNN, ENN, ANFIS, and GAN. Similarly, the F-measure and MCC are 90.14% and 93.12%, respectively, which are more than the existing approaches. According to the results of the analysis, the suggested strategy surpasses the current methods in all aspect.
The Fig. 5 given below compares the computation times of the proposed BNM-tGAN approach to those of the existing CNN, ANFIS, ENN, and GAN techniques. It's performed on a variety of datasets, including NSL-KDDCUP99, KDD99, UNSW-NB15 and CIDDS-001. The computation time should be minimized for an efficient classifier. The BNM-tGAN method takes 65, 75, 78 and 62 s to compute KDD99 dataset, NSL-KDDCU99 dataset, CIDDS-001 dataset, and UNSW-NB15 dataset. Existing approaches take more time to compute for all datasets. The final result shows that the proposed method more efficient in the detection of assaults than the existing methods.
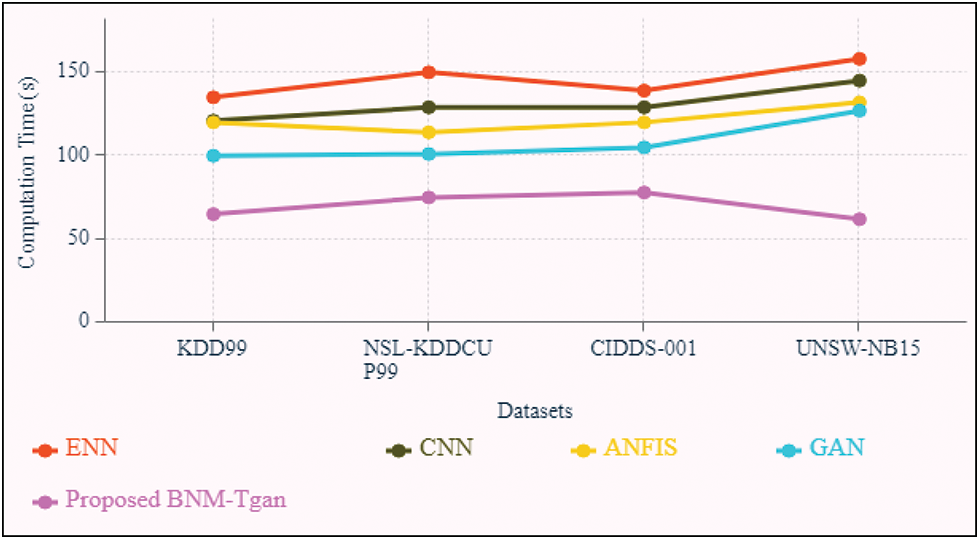
Figure 5: Computation time of the proposed and existing methods
• In this experiment, the NSL-KDDCUP99 dataset has been used to resolve the poor evaluation of anomaly detection methods and performance of the evaluated system.
• The work uses Marginal Likelihood Matrix to perform log-likelihood functions so as to resolve the issue of misleading information related to the observed values and missing values.
• The work uses the AMD-RS method to reduce the features that lie within the same range so as to lessen the big variance.
• The work uses hyperparameter tuning to find the threshold finding based on the confidence interval for threshold finding to construct the decision tree. The framework uses Wasserstein loss function as a tuning factor in BNM-tGAN model to stabilize the training model and generate the loss function which is then compiled by Bengio Nesterov momentum optimizer.
• The work produces higher accurate diagnosis and reduces false alarm rate with respect to the attack having low computational time using the DataMIDS framework.
Intrusion detection, which can detect unknown threats in network traffic, has proven to be an efficient network security method. Traditional intrusion detection systems (IDS) in cloud platforms have low detection accuracy and a large processing complexity. Keeping this issue in mind, the work has developed a secure Data Mining Intrusion detection system (DataMIDS) framework using FP feature selection and BNM-tGAN attack detection technique. The work focuses on resolving the issue of insecure IDS by focusing on factors like false positive, low detection accuracy etc. Based on the MLFIMT method, the IDS data is examined for finding the relationship among the values missing and attack classes. The framework handles the high dimensionality of the exchanged data by employing a robust feature selection technique that reduces the time complexity for identifying attacks. The framework uses ‘3’ FS techniques i.e., XavND-Relief filter method, ICS-FSO wrapper method, and HpTT-DT embedded method for relevant features selection and AMD-RS technique for handling categorical features. The work performs shallow learning of the feature and analyzes the missing values to get in-depth knowledge of missing values’ impact over the attack classes. The false alarm rate of detecting attack is decreased and higher accuracy with low computation time is achieved by the proposed framework. The chances of uncertain attacks and adversarial attacks are conquered by the proposed framework and can evaluate illegal system usage, misuse, and abuse. Experimental analysis declared that the model tends to obtain an accuracy of 92.14%, sensitivity of 90.14%, and specificity of 91.14%. In addition to that, the proposed model reduces the false alarm rate by obtaining an FPR, FNR of 11.47% and 10.24% respectively. In comparison to the currently available state-of-the-art method the proposed model tends to perform well.
Funding Statement: The authors received no specific funding for this study.
Conflicts of Interest: The authors declare that they have no conflicts of interest to report regarding the present study.
References
1. R. Sahani, Shatabdinalini, C. Rout, C. Badajena J, A. K. Jena et al., “Classification of Intrusion Detection Using Data Mining Techniques,” Singapore: Springer, 1st ed., ISBN: 978-981-10-7870-5, 2018. [Google Scholar]
2. W. Wang, Y. Sheng, J. Wang, X. Zeng, X. Ye et al., “HAST-IDS learning hierarchical spatial temporal features using deep neural networks to improve intrusion detection,” IEEE Access, vol. 6, pp. 1792–1806, 2017. [Google Scholar]
3. Z. A. Foroushani and Y. Li, “Intrusion detection system by using hybrid algorithm of data mining technique,” in 7th Int. Conf. on Software and Computer Applications, February 8–10, 2018, Kuantan Malaysia, 2018. [Google Scholar]
4. I. Bouteraa, M. Derdour and A. Ahmim, “Intrusion detection using data mining a contemporary comparative study,” in 3rd Int. Conf. on Pattern Analysis and Intelligent Systems (PAIS), 24–25 Oct 2018, Tebessa, Algeria, 2018. [Google Scholar]
5. F. Salo, M. Injadat, A. B. Nassif, A. Shami and A. Essex, “Data mining techniques in intrusion detection systems a systematic literature review,” IEEE Access, vol. 4, pp. 1–14, 2016. [Google Scholar]
6. A. Khraisat, I. Gondal, P. Vamplew and J. Kamruzzaman, “Survey of intrusion detection systems: Techniques, datasets and challenges,” Cybersecurity, vol. 2, no. 20, pp. 1–22, 2019. [Google Scholar]
7. V. P. Mishra, J. Dsouza and L. Elizabeth, “Analysis and comparison of process mining algorithms with application of process mining in intrusion detection system,” in 7th Int. Conf. on Reliability, Infocom Technologies and Optimization (Trends and Future Directions) (ICRITO), Noida, India, 29–31 Aug 2018. [Google Scholar]
8. H. Yao, Q. Wang, L. Wang, P. Zhang, M. Li et al., “An intrusion detection framework based on hybrid multi-level data mining,” International Journal of Parallel Programming, vol. 47, no. 3, pp. 1–19, 2019. [Google Scholar]
9. I. H. Sarker, A. S. M. Kayes, S. Badsha, H. Alqahtani, P. Watters et al., “Cybersecurity data science: An overview from machine learning perspective,” J. Big Data, vol. 7, no. 41, pp. 1–29, 2020. [Google Scholar]
10. M. A. Ferrag, L. Maglaras, A. Ahmim, M. Derdour and H. Janicke, “RDTIDS rules and decision tree-based intrusion detection system for internet-of-things networks,” Future Internet, vol. 12, no. 3, pp. 1–14, 2020. [Google Scholar]
11. B. Selvakumar and K. Muneeswaran, “Firefly algorithm based feature selection for network intrusion detection,” Computers and Security, vol. 81, pp. 148–155, 2018. [Google Scholar]
12. O. Almomani, “A feature selection model for network intrusion detection system based on PSO, GWO, FFA and GA algorithms,” Symmetry, vol. 12, no. 6, pp. 1–20, 2020. [Google Scholar]
13. A. Nagaraja, U. Boregowda and G. R. Kumar, “UTTAMA An intrusion detection system based on feature clustering and feature transformation,” Foundations of Science, vol. 25, no. 1, pp. 1049–1075, 2019. [Google Scholar]
14. T. H. Divyasree and K. K. Sherly, “A network intrusion detection system based on ensemble CVM using efficient feature selection approach,” Procedia Computer Science, vol. 143, pp. 442–449, 2018. [Google Scholar]
15. K. Peng, V. C. M. Leung and Q. Huang, “Clustering approach based on mini batch k means for intrusion detection system over big data,” IEEE Access, 2017. https://doi.org/10.1109/ACCESS.2018.2810267. [Google Scholar]
16. J. H. Woo, J. Y. Song and Y. J. Choi, “Performance enhancement of deep neural network using feature selection and preprocessing for intrusion detection,” in Int. Conf. on Artificial Intelligence in Information and Communication (ICAIIC), 11–13 Feb 2019, Okinawa, Japan, 2019. [Google Scholar]
17. K. M. Firoz and S. Hartmann, “Cyber security challenges an efficient intrusion detection system design,” in Int. Young Engineers Forum, Caparica, Portugal, May 4, 2018. [Google Scholar]
18. H. P. Vinutha and B. Poornima, “An Ensemble Classifier Approach on Different Feature Selection Methods for Intrusion Detection,” Singapore: Springer, 1st ed., ISBN: 978-981-10-7511-7, 2018. [Google Scholar]
19. M. Sarnovsky and J. Paralic, “Hierarchical intrusion detection using machine learning and knowledge model,” Symmetry, vol. 12, no. 2, pp. 1–14, 2020. [Google Scholar]
20. The UCI KDD Archive, University of California, Irvine, October 28,, 1999. [Online]. Available: http://kdd.ics.uci.edu/databases/kddcup99/kddcup99.html. [Google Scholar]
21. R. Vinayakumar, A. Mamoun, K. P. Soman, P. Poornachandran, A. Al-Nemrat et al., “Deep learning approach for intelligent intrusion detection system,” IEEE Access, vol. 7, pp. 41525–41550, 2018. [Google Scholar]
22. S. Zavrak and M. Iskefiyeli, “Anomaly-based intrusion detection from network flow features using variational autoencoder,” IEEE Access, vol. 8, pp. 108346–108358, 2020. [Google Scholar]
23. M. Mayuranathan, M. Murugan and V. Dhanakoti, “Best features based intrusion detection system by RBM model for detecting DDoS in cloud environment,” Journal of Ambient Intelligence and Humanized Computing,” Springer, vol. 12, no. 3, pp. 3609–3619, 2021. https://doi.org/10.1007/s12652-019-01611-9. [Google Scholar]
24. T. Su, H. Sun, J. Zhu, S. Wang and Y. Li, “BAT deep learning methods on network intrusion detection using NSL-KDD dataset,” IEEE Access, vol. 8, pp. 29575–29585, 2020. [Google Scholar]
25. P. Devan and N. Khare, “An efficient XGBoost–DNN-based classification model for network intrusion detection system,” Neural Computing and Applications, vol. 32, no. 3, pp. 1–16, 2020. [Google Scholar]
26. S. Revathi and A. Malathi, “A detailed analysis on NSL-KDD dataset using various machine learning techniques for intrusion detection,” International Journal of Engineering Research & Technology (IJERT), vol. 2, no. 12, pp. 1848–1853, December 2013. [Google Scholar]
Cite This Article
 Copyright © 2023 The Author(s). Published by Tech Science Press.
This work is licensed under a Creative Commons Attribution 4.0 International License , which permits unrestricted use, distribution, and reproduction in any medium, provided the original work is properly cited.
 Downloads
 Citation Tools