
 Submit a Paper
 Propose a Special lssue
 Open Access
ARTICLE

Residual Attention Deep SVDD for COVID-19 Diagnosis Using CT Scans
1 Information Systems Department, Faculty of Computers and Information, Mansoura University, Mansoura, 35511, Egypt
2 Computer Science Department, Ibb University, Ibb, Yemen
3 SE Department, Faculty of Computer Sciences and Informatics, Amman Arab University, Amman, 11953, Jordan
* Corresponding Author: Akram Ali Alhadad. Email:
Computers, Materials & Continua 2023, 74(2), 3333-3350. https://doi.org/10.32604/cmc.2023.033413
Received 16 June 2022; Accepted 26 July 2022; Issue published 31 October 2022
 View Full Text
 Download PDF
Abstract
COVID-19 is the common name of the disease caused by the novel coronavirus (2019-nCoV) that appeared in Wuhan, China in 2019. Discovering the infected people is the most important factor in the fight against the disease. The gold-standard test to diagnose COVID-19 is polymerase chain reaction (PCR), but it takes 5–6 h and, in the early stages of infection, may produce false-negative results. Examining Computed Tomography (CT) images to diagnose patients infected with COVID-19 has become an urgent necessity. In this study, we propose a residual attention deep support vector data description SVDD (RADSVDD) approach to diagnose COVID-19. It is a novel approach combining residual attention with deep support vector data description (DSVDD) to classify the CT images. To the best of our knowledge, we are the first to combine residual attention with DSVDD in general, and specifically in the diagnosis of COVID-19. Combining attention with DSVDD naively may cause model collapse. Attention in the proposed RADSVDD guides the network during training and enables quick learning, residual connectivity prevents vanishing gradients. Our approach consists of three models, each model is devoted to recognizing one certain disease and classifying other diseases as anomalies. These models learn in an end-to-end fashion. The proposed approach attained high performance in classifying CT images into intact, COVID-19, and non-COVID-19 pneumonia. To evaluate the proposed approach, we created a dataset from published datasets and had it assessed by an experienced radiologist. The proposed approach achieved high performance, with the normal model attained sensitivity (0.96–0.98), specificity (0.97–0.99), F1-score (0.97–0.98), and area under the receiver operator curve (AUC) 0.99; the COVID-19 model attained sensitivity (0.97–0.98), specificity (0.97–0.99), F1-score (0.97–0.99), and AUC 0.99; and the non-COVID pneumonia model attained sensitivity (0.97–1), specificity (0.98–0.99), F1-score (0.97–0.99), and AUC 0.99.Keywords
COVID-19 is the common name of the disease caused by the novel coronavirus (2019-nCoV) that appeared in Wuhan, China in 2019 [1]. This virus has been affected all aspects of our life because it spreads rapidly in all countries and causes acute respiratory distress syndrome [2]. Infected Patients in the first stage are suffering from many common symptoms, including headache, fever, cough, and strong pain in most body muscles [3,4]. Many people died because they suffered from acute pneumonia and shortness of breath [5]. The fast transfer of the virus makes a big terrible, so the diagnosis of the infected people is a very important factor in the fight against COVID-19 and saving the patient’s life. The gold-standard test to diagnose COVID-19 is polymerase chain reaction (PCR), but it takes 5–6 h and in the early stages of infection may produce false-negative results [6].
In addition, the dramatic increase in the number of patients daily creates another trouble because of the shortage of PCR kits. Consequently, there is an urgent need for early, accurate diagnosis and health interventions to combat the virus’s spread. Therefore, many studies are conducted to emphasize the efficiency of thoracic Computed Tomography (CT) in confirming the COVID-19 infection [6]. These studies show that most patients’ CT images exhibit ground-glass opacities (GGO) and consolidation regions, which means CT scans can be considered an important tool to confirm COVID-19 infection and follow-up therapy progress [6,7]. Unfortunately, the rapid transmission of COVID-19 from one person to another, as well as indirectly through interaction with the same patients’ environments, causes additional issue because checking CT scans requires more specialist radiologists to avoid incorrect diagnosis. [8].
With the great and quick evolution of vision techniques, many vision techniques have been used to diagnose tumors and detect lesions in medical images. Many systems have been proposed by researchers to segment lesions in the brain, skin, etc. These systems use various types of medical images such as CT scans, ultrasound, magnetic resonance imaging (MIR), and X-ray images [9,10]. It is remarkable that many of these systems produced outstanding results, outperforming radiologists in some cases [11].
CT images attract researchers to work hard using deep learning and vision techniques to diagnose COVID-19. A lot of papers have been published presenting systems using CT images to diagnose COVID-19 and detect lesions in the lungs [12,13]. Although these systems show good accuracy, they are still not reliable enough. Most of these systems use deep learning techniques because of the ability of deep learning to extract appropriate features to achieve good results, but deep learning techniques need a large dataset to achieve high accuracy. The lack of enough data poses challenges in the training stage [14].
Many researchers proposed a deep-learning approach and attempted to address the lack of big datasets through data augmentation, transfer learning techniques, or the development of a custom network architecture. Wu et al. [15] proposed a deep model based on the ResNet50 architecture, which consists of three branches, each of which receives the CT images from a different view. The extracted features by the three branches are fused to be classified in the next dense layers. (AUC = 0.819, accuracy = 0.760, sensitivity = 0.811, Specificity = 0.615), classes (COVID-NONCOVID). Ma et al. [16] used ten pre-trained convolutional neural networks to distinguish between patients infected by COVID-19 and others infected by different viral pneumonia. Only cropped regions by radiologists were passed to the classifier. Amyar et al. [17] proposed a multitask network in which three tasks are done (classification, segmentation, and reconstruction). The input CT image is passed through a common encoder, whose output is used in the three tasks. The U-NET architecture is used for segmentation and reconstruction tasks. (accuracy = 94.67, sensitivity = 96, and Specificity = 92). Gozes et al. [18] extracted the lung region using the U-net network, and then regions of interest were classified into normal and COVID-19 using pretrained ResNet50. A system combining classification and lesions segmentation tasks is proposed by Wu et al. [19]. Res2Net is used in the classification task to distinguish COVID-19 and non-COVID-19 patients. Yousefzadeh et al. [20] benefited from all the slices in the CT file to diagnose the COVID-19 patient. All slices are passed through EfficientNetB3 to extract features, which are then passed to fully connected layers to be classified into three classes. Wang et al. [21] proposed a method consisting of two stages. In the first stage, CT images are segmented using 3D-UNet to extract lung lobes, which are then used to segment the whole lung parenchyma. COVID-19 prediction is accomplished via two subnetworks, one to predict pneumonia existence and the second to predict the pneumonia type. They proposed an attention learning block based on self-attention and residual net style named self-prior-residual block.
Although the promising results of these researches in diagnosing COVID-19, some improvements are also required to overcome some challenges. Some of these challenges are the unbalanced and lack of data, inter-class similarity, and intra-class variation. In addition, because most CT images that were utilized in most research were acquired from various resources, there is a great variation in images, and the majority of the images are not clear. Furthermore, the diagnosis of COVID-19 in most research relies on the assumption that the disease currently spreading is COVID-19. Therefore, in the binary classification of CT into COVID-19 and intact, any abnormalities in the lungs will be classified as COVID-19, which is not a realistic result from the practical perspective.
To overcome the aforementioned challenges as much as possible, we proposed RADSVDD approach based on DSVDD [22] and residual attention [23]. RADSVDD is a novel approach combining residual attention with DSVDD to classify the CT images. To the best of our knowledge, we are the first to combine residual attention with DSVDD in general, and especially in COVID-19 diagnosis. Combining attention with DSVDD may result in model collapse if done naively. Because each class has its own classifier, our approach addresses the imbalanced data problem. In addition, residual attention block can overcome the lack of data. The contributions of this research can be summarized as follows:
• We created a dataset collected from three different datasets published on the internet.
• We judged our dataset by an expert radiologist to make sure there were no images placed in a wrong class and to exclude images that did not contain lung parenchyma.
• We developed a novel approach to distinguish COVID-19 from the other types of pneumonia and intact lungs. Our approach consisted of three novel residual attention deep SVDD(RADSVDD) models.
• Because our proposed models are one-class classifiers, they address the unbalanced data problem.
The rest of this paper is organized as follows: In Section 2 preliminaries, a brief explanation of all the necessary techniques or concepts that are used in our approach is presented. The dataset description is presented in Section 3. The proposed approach with all the details about the different parts is presented in Section 4. Experiments and results are discussed in detail in Section 5. Section 6 concludes this work.
In this section, a brief explanation of the used techniques is introduced, and some notations are illustrated.
2.1 Support Vector Data Description (SVDD) [22]
SVDD is a one-class classifier in which a hypersphere is used to enclose the data. SVDD aims to find the smallest hypersphere that has a center
Given training data
Slack variable
Deep learning is a branch of machine learning that uses techniques to simulate the neocortex activity of the human brain. The neocortex consists of layers of neurons representing 80% of the brain in which most thinking activity occurs. These layers are learned in a hierarchical manner where levels of abstraction representations are learned to understand the patterns of data. Low and multiple levels of data abstraction represent the high-level abstractions. One of the most significant advantages of using deep learning is the capability to learn extracting feature automatically at different levels of abstraction. This property allows building systems capable of finding complex mapping functions without the need for extracting handcrafted features [24]. When we solve a problem with a neural network composed of vertical-stacked layers, we use a deep neural network and deep learning. Deep neural networks (DNNs) often require a huge quantity of data to learn how to extract features hierarchically. Lower layers learn to extract low-level features such as edges, whereas the higher layers learn to extract high-level features. The learning process means updating the weights and biases in the network during backward propagation to improve the accuracy of decisions made by the network [25].
The attention mechanism in DNN generally allows the model to look at the most significant information affecting the model’s decision. It prioritizes this valuable information, which improves the training process and decision accuracy [26].
There has recently been a lot of research aimed at embedding attention with convolution neural network (CNN) in vision tasks such as image captioning. The fundamental idea behind embedding attention with CNN is to discover salient features in feature maps to decrease redundancy [27]. The residual attention model (RAM) [23] is a robust attention technique. It consists of two branches: the trunk and the mask. The trunk branch processes the features. As a result, it can be used in any network architecture. The mask branch generates a soft mask to weight the features produced in the trunk branch. One advantage of RAM is that each trunk has its own mask, which is generated to be adapted to the trunk branch’s features. Stacking multiple attention blocks without thinking will degrade the performance since the mask’s values will cause the feature maps in the higher layers to have values between zero and one. Furthermore, the soft mask may affect the trunk branch negatively. To address these problems, this model uses residual learning, where the output
The mask branch M(x) ranges from [0, 1], with M(x) approximates 0,
2.4 Deep Support Vector Data Description (DSVDD)
The great success of deep learning in recent years attracts most researchers. Ruff et al. [22] proposed a deep SVDD model to detect anomalous images. Deep SVDD combines a deep convolution network to transfer data and SVDD to find the smallest closed hypersphere. It learns deep features representing data with the goal of one-class classification. In their work, one-class and soft-margin models are proposed. In the one-class model, the loss function is a minimization problem of the mean squared distance between all training data samples and the center of a hypersphere. Because this hypersphere is supposed to encompass normal images, images falling outside of it are considered anomalous, as shown in Fig. 1.
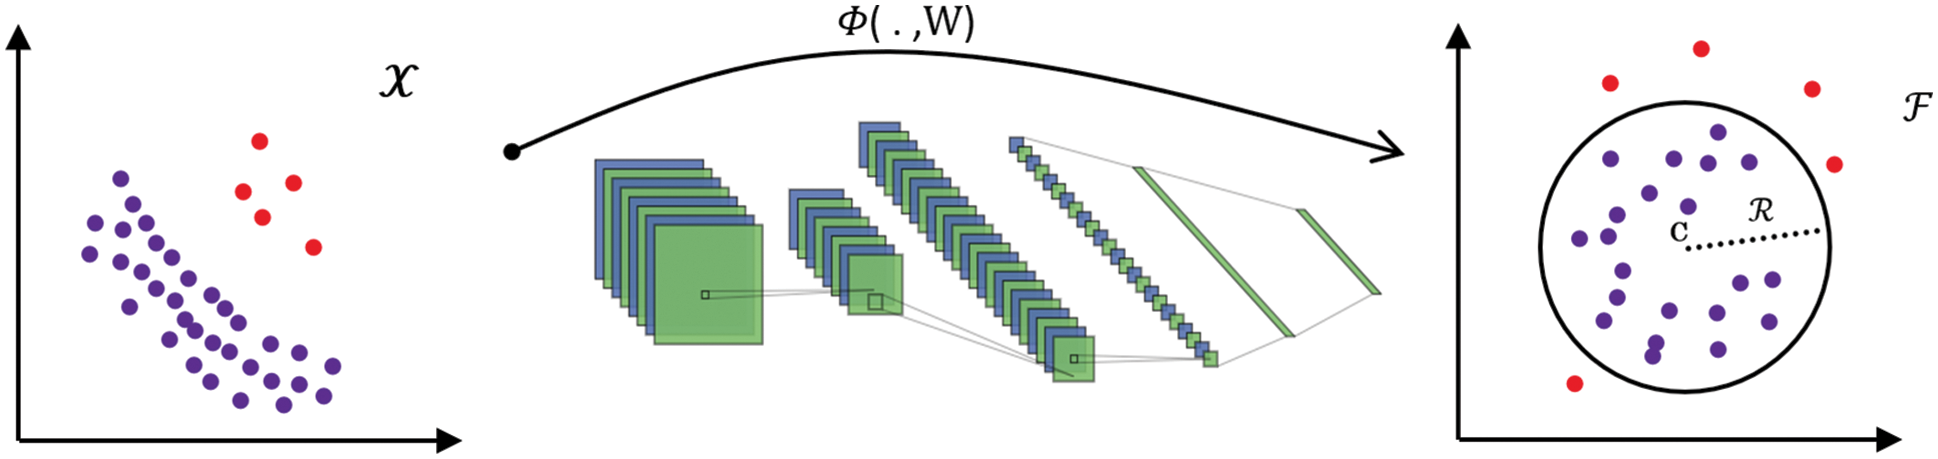
Figure 1: The neural network with weights W is trained by deep SVDD to transform data from
The authors set constraints on the neural network to avoid model collapse, which occurs when DSVDD attempts to map the features to a single point
COVID-19 is a novel disease; hence, developing an automatic diagnostic system is a challenging task due to a lack of data. Most researchers used clinical data because there isn’t enough data to train deep models. Three publicly available datasets on the internet were combined to create a dataset with three classes (COVID-19, pneumonia, and normal). Because CT scan files contain several slices that may not always have an infection or lung parenchyma [28], these datasets were judged by an expert radiologist to exclude images that did not have a lung parenchyma or abnormalities in the case of COVID-19 or pneumonia CT scan files.
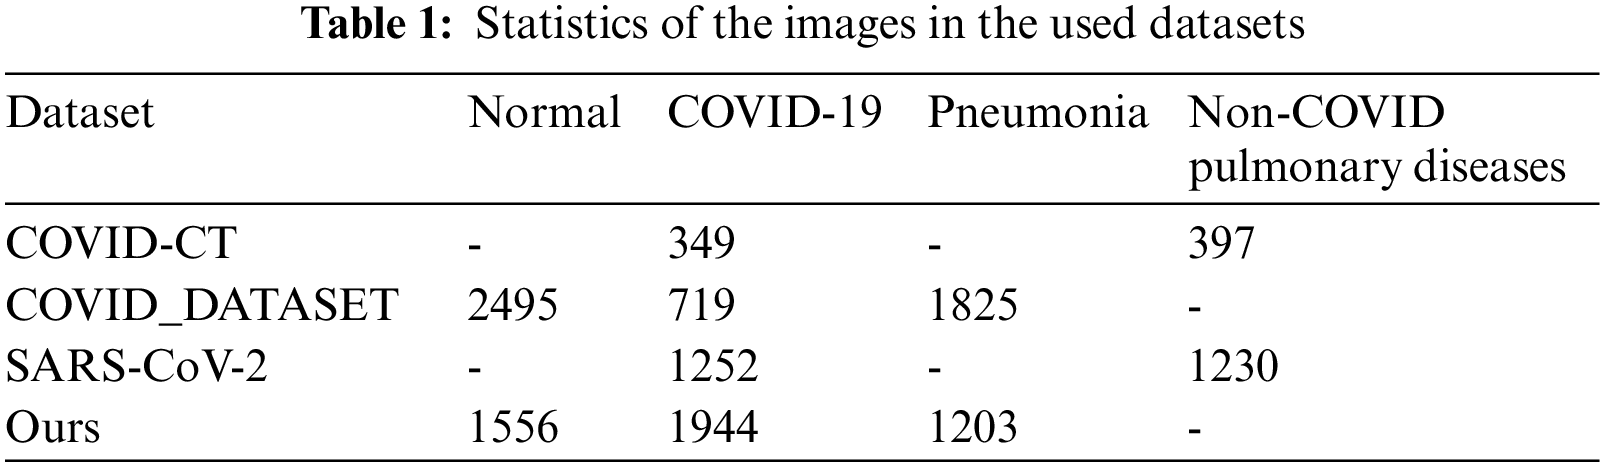
The COVID-CT dataset [29] contains two groups of images. The first group consists of (349) images for COVID-19 patients, while the second consists of (397) images for a non-COVID-19 lung infection. Two datasets are also used to increase data. COVID_DATASET [30] comprises of three classes COVID-19 (719 images), Normal (2495) and pneumonia (1825). Finally, the SARS-CoV-2 CT dataset [31] contains two classes: 1252 COVID-19 CT images for infected patients by COVID-19 and 1230 non-COVID19 CT images, which contains another pulmonary disease. Since we aim to build a dataset that contains three classes as mentioned above, the non-COVID images from the last two datasets are excluded because they may contain a different variety of pulmonary diseases, Fig. 2 shows samples of our dataset.
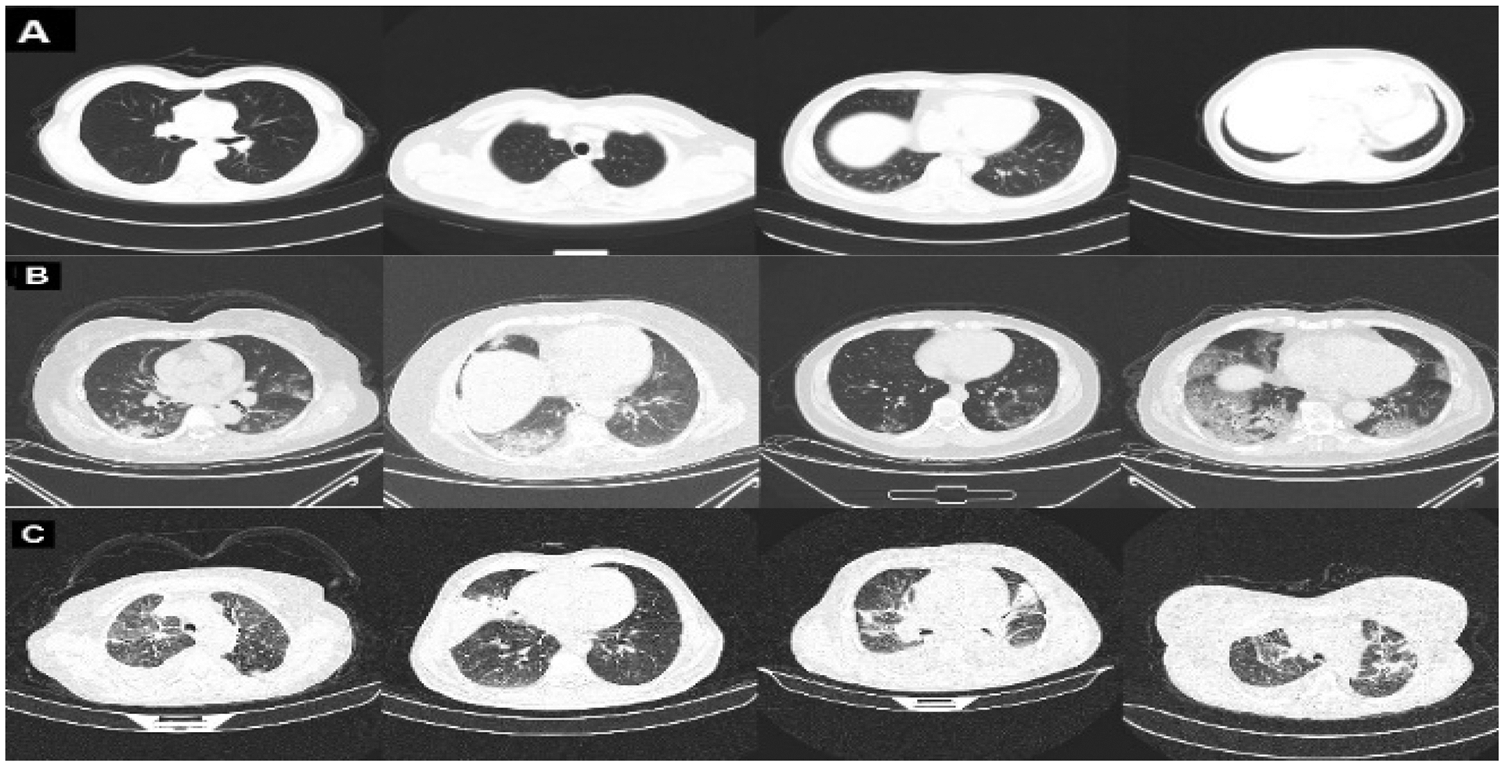
Figure 2: Representative samples from our dataset representing A: normal, B: COVID-19, and C: pneumonia
In addition, COVID-19 [32] dataset was used , which contains 20 COVID-19 CT scan files (nii.gz files) with ground truth files. The ground truth files contain three groups of masks, one for the entire parenchyma including the lesion areas; the second one contains masks for the lesion areas only and the last one contains masks for the parenchyma. This dataset was used to train U-Net [33] to segment lung parenchyma. Tab. 1 shows the sample statistics of all datasets.
This section provides a detailed explanation of the proposed approach, which covers data preprocessing and the deep classification model. The proposed approach is depicted in Fig. 3.
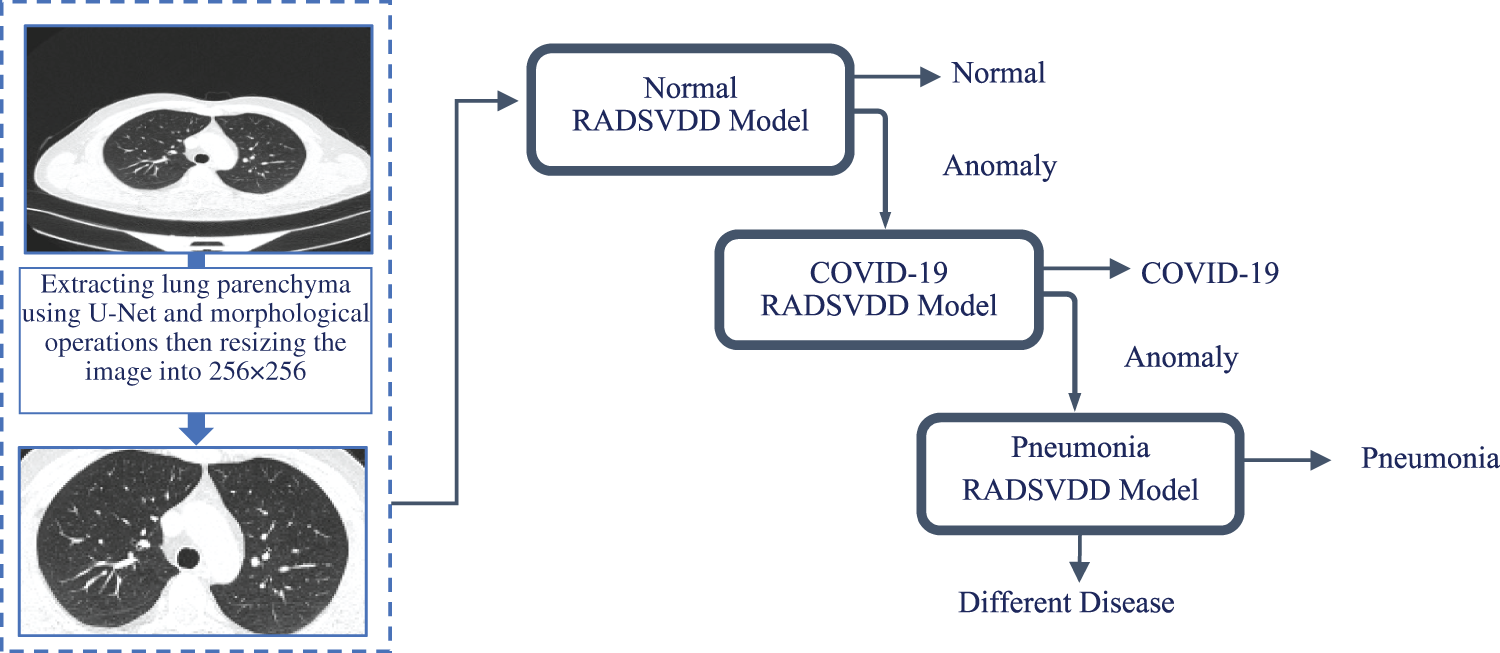
Figure 3: CT image is fed into a trained u-net to extract parenchyma. To remove undesired parts, morphological operations are applied. The normal model is then used to classify the image. If the CT image is not normal, it will be sent to the COVID-19 model to determine if it is a COVID-19 infection. If the image is not normal or COVID-19, it will be classified by the pneumonia model as pneumonia or a different disease
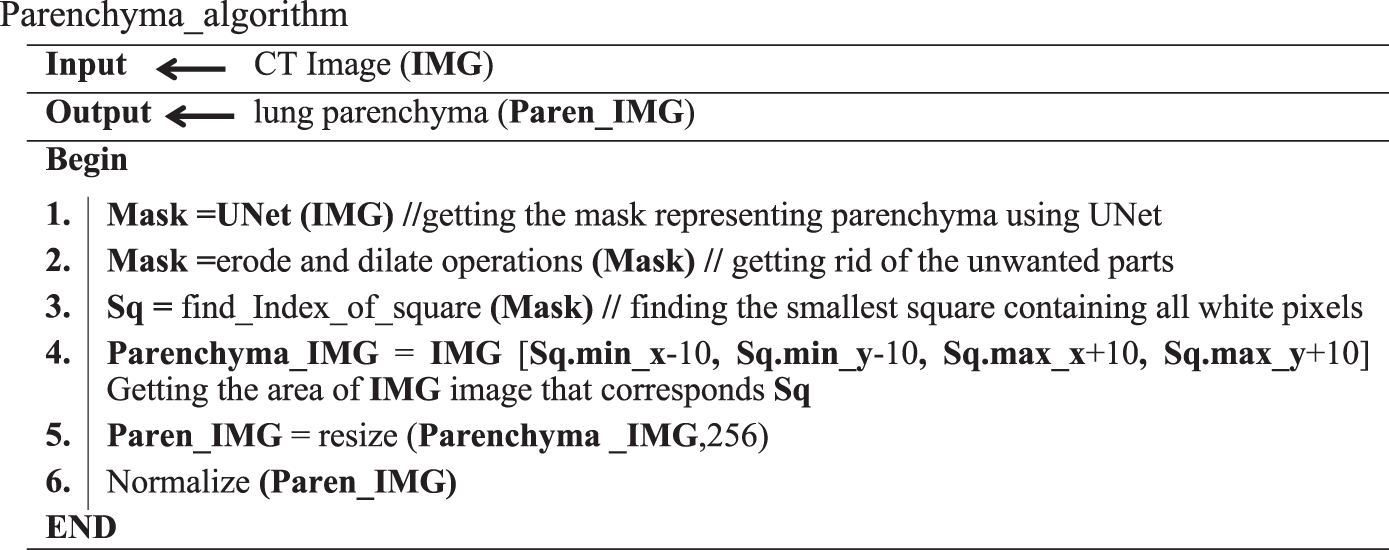
Data preprocessing is a vital stage in building most deep learning models. Since our dataset images are collected from different resources, images may contain verity lines around lung tissue that may affect the classification process. U-Net is trained to extract the lungs’ parenchyma mask. To remove the small portions that may surround the lungs’ parenchyma, morphological operations are applied to the mask. This mask is used to extract parenchyma and exclude images that do not contain parenchyma. The processed image is resized to 256 × 256 and the color is normalized to be in the range [0, 1]. Parenchyma_algorithm shows the preprocessing steps.
Inspired by DSVDD [22] and the residual attention model [23], RADSVDD is proposed that is trained in an end-to-end fashion. RADSVDD combines the residual attention model and SVDD. In this section, an explanation of the proposed method in detail is presented.
4.2.1 Residual Attention Network (RAN)
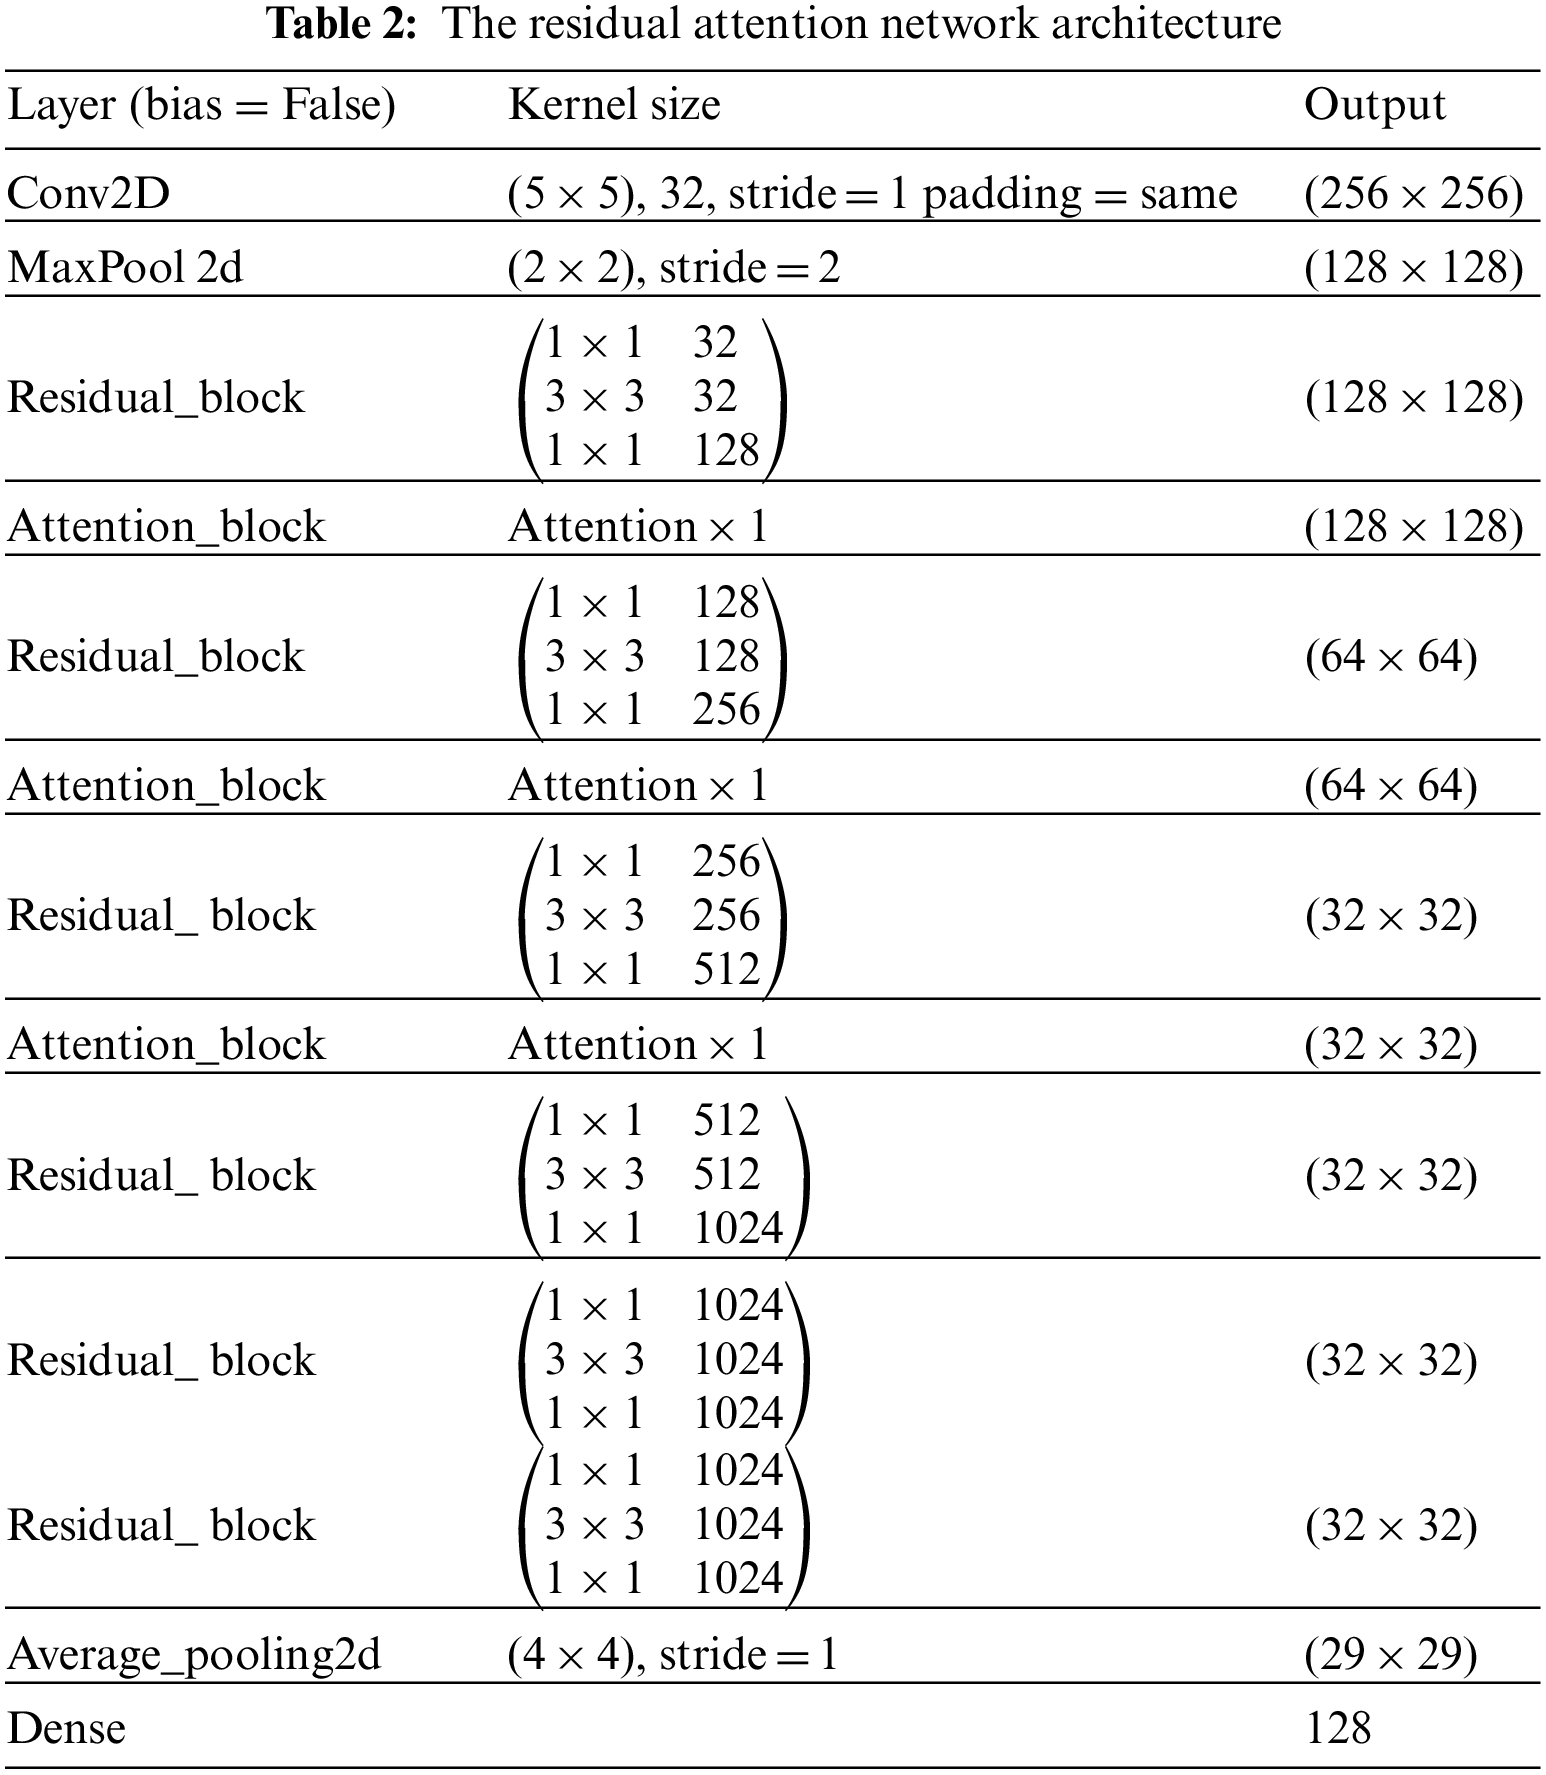
Residual attention network (RAN) is designed by stacking a set of residual blocks and attention blocks as shown in Tab. 2 These blocks are designed to address vanishing gradients and guide convolution via the attention mechanism during the training stage. An explanation of these blocks will be presented in the following section:
The field of image classification has been revolutionized by deep convolution networks. Algorithm and hardware advancements have increased the ability to add layers to the deep convolution network. Because of vanishing gradients, training a neural network becomes more difficult as network depth increases. As the value of gradient approaches zero in early layers, networks with too many layers become highly unstable. With each additional layer, the gradient value shrinks and eventually becomes insignificant. Vanishing gradients reduce network performance, and adding more layers only exacerbates the problem. A residual connection connects the output of one layer to the input of the previous layer, ensuring that gradient values do not vanish abruptly [34]. Consider H(x) to be an underlying mapping to be fitted by a few stacked layers (not necessarily the complete net), with x representing the inputs to the first of these layers. If one believes that several nonlinear layers can asymptotically approximate complicated functions, it is equal to believing that they can asymptotically approximate residual functions, i.e., H(x)-x (assuming that the input and output are of the same dimensions). Instead of expecting stacked layers to approach H(x), these layers are allowed expressly to approximate a residual function F(x)= H(x) − x. As a result, the original function becomesF(x) + x. Although both forms should be able to approach the necessary functions asymptotically (as expected), the ease of learning may differ [35]. Fig. 4 shows the complete pre-activation block, which includes Leaky Relu activation, batch normalization, and a 2D convolution layer three times.
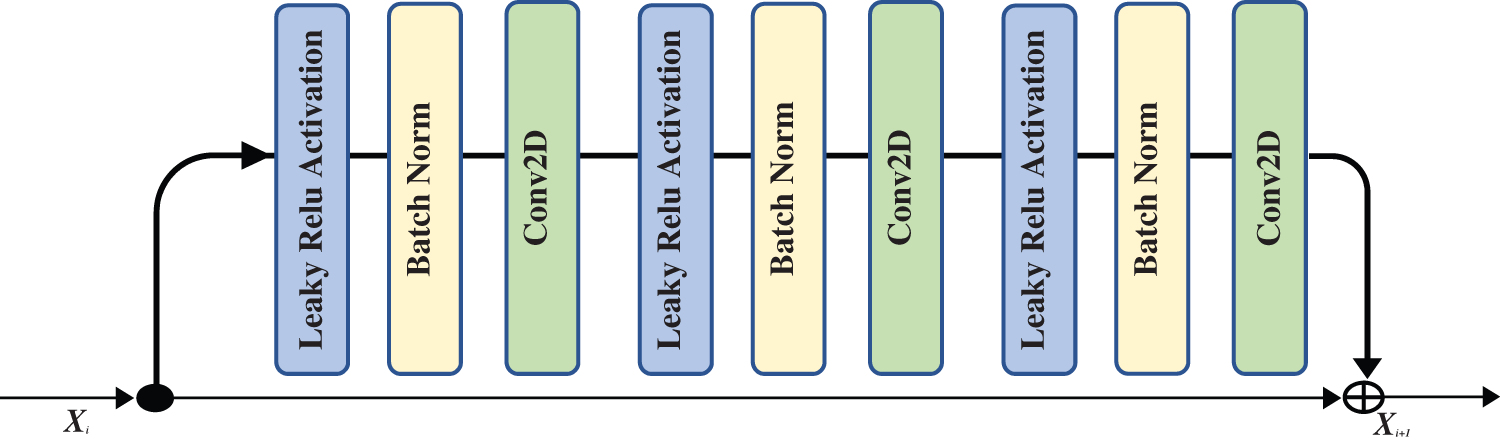
Figure 4: The residual block that is used in our proposed network
Using attention in deep models has grown in popularity in computer vision, image processing, and natural language processing. Attention-aware features and features that can be extracted based on spatial, context, or channel aware-features can be generated by attention techniques. Attention techniques learn the significance and relationships between features. In a vision classification task, using visual attention assists in determining the relevant image regions and their relationships. The classification task is dependent on the existence or absence of these portions of the image. In our case, these regions on the chest CT image represent signs of COVID-19 or another type of pneumonia infection. Data in the attention block passes through two branches: the trunk and the mask. The trunk branch processes data to extract features, while the other branch generates a soft mask that acts as a control gate for the output of the trunk branch. The soft mask branch combines bottom-up and top-down structures. Bottom-up structures extract low-resolution features, which will be extended by top-down structures using linear interpolation. Fig. 5 shows the attention block.
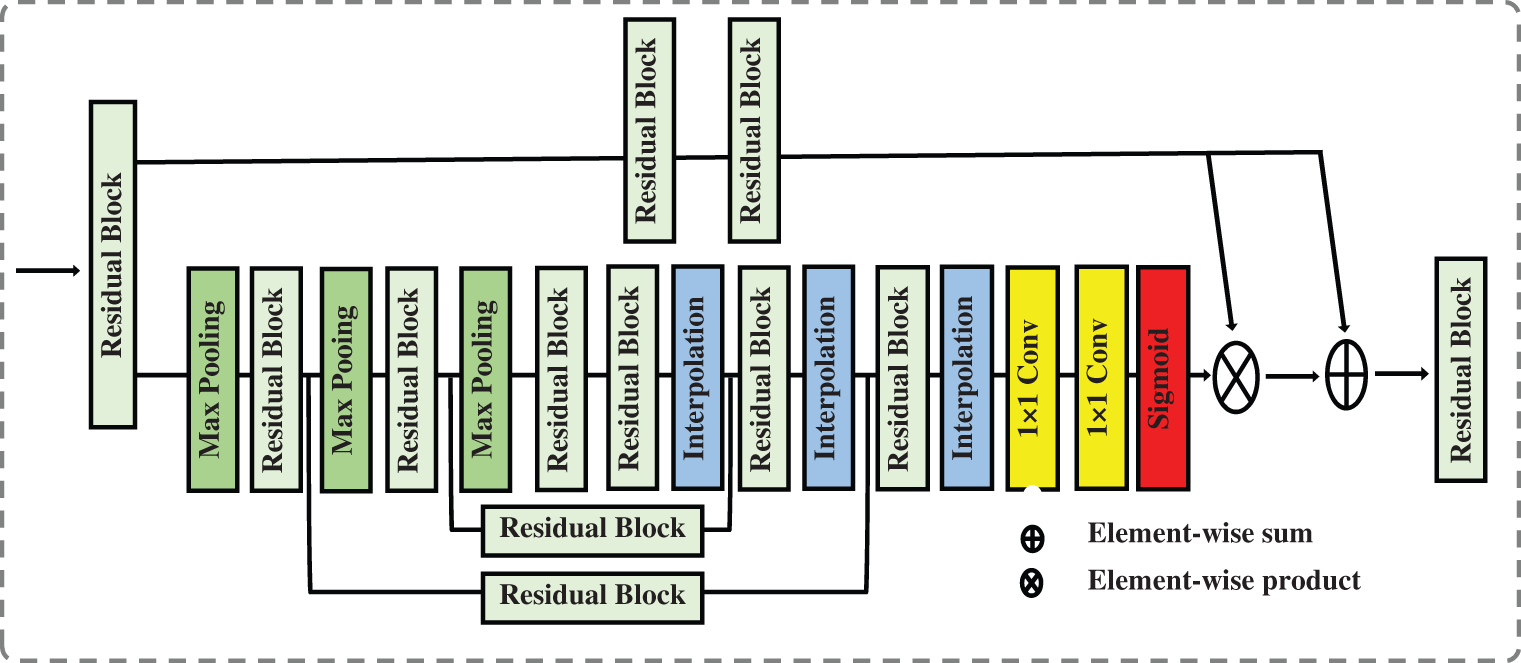
Figure 5: The attention block that is used in our proposed network
As shown in Fig. 5, the soft mask branch begins with a sequence of max pooling and residual blocks that represent bottom-up feedforward structure and results in robust semantic information. The robust semantic information passes through a sequence of linear interpolation and residual blocks represent top-down feedforward structure to expand the semantic information to be the same size as the output of the trunk branch. The sigmoid function is used at the end of the soft mask branch to normalize the output but it may cause degradation of the feature the deeper the network becomes. To address the degradation caused by using the sigmoid function, we add one to each value in the generated soft mask M i.e., M = M + 1.
4.2.2 Residual Attention Deep Support Vector Data Description (RADSVDD)
Since CT images of COVID-19 patients show abnormalities compared to normal CT images, they can be considered anomalous images. This abnormality volume increases with the severity of infection [6]. Residual Attention Deep SVDD (RADSVDD) is proposed to extract effective information and accordingly enhance the prediction. Our model combines the residual attention model as a feature extractor and DSVDD to find the smallest hypersphere encompassing the normal images. The attention block guides the network to concentrate on the most effective features in the CT images, increasing prediction efficiency, whilst the residual block prevents gradient vanishing.
Let
The distance of the extracted features
where
According to the number of the classes, three models were trained separately. In each model, one of the classes was considered to be a normal class, whereas the others were anomalous classes. A mini-batch of only four images was used to train our models due to the limited resources. All models were trained for 50 epochs on NVIDIA Tesla K80 GPU using TensorFlow and Keras. The Adam optimizer was used with an initial learning rate of (10−5) and β1, β2 were set to 0.9 and 0.999 respectively. Bias was removed from all layers to avoid the model collapse.
5.1 Training and Testing Strategy
As described in the proposed approach, we trained three models. In the training of the normal model, intact CT images were considered to be the normal class. A portion of 70% of the normal class was picked out randomly to train the model. 10% was used for validation, whereas 20% was used for testing. 10% of the COVID-19% and 10% of the pneumonia CT images were also picked out randomly to be used for the validation. The rest of the COVID-19 and pneumonia CT images were used during the testing of the model. The COVID-19 CT images were considered the normal class during the training of the COVID-19 model, while the intact and pneumonia CT images were considered the anomalous class. The model was trained with the same strategy as the normal model. In the last model, the pneumonia class was considered the normal class, whereas the COVID-19 and the intact CT images were the anomalous classes. The final model was trained in the same manner as the models in the previous training steps. A checkpoint was saved automatically if the current validation performance exceeded the previous best validation performance. To confirm the efficiency of the proposed models, the models were also trained using different sample ratios as follows: (50%, 10%, 40%), (30%, 10%, 60%) representing (training, validation, and testing) respectively.
The proposed models were evaluated using sensitivity, specificity, F1 score, and area AUC. Sensitivity tells us how much the model can distinguish positive cases, whereas specificity tells us how much the negative cases can be distinguished by the model. Since we dealt with high-imbalanced data binary classification task, the AUC metric and F1 score were used to evaluate the overall performance of each model. The equations of the used metrics are as follows:
where TP = True Positive, FN = False Negative, FP = False Positive and TN = True Negative.
The testing and validation results of the three models will be presented in this section.
Tab. 3 displays the sensitivity, specificity, F1 score, and AUC of the normal model validation and testing for each dataset split ratio. The results show that our model learns even with a small dataset and can recognize healthy CT images with outstanding performance. The confusion matrices of the normal model on validation and testing data are shown in Fig. 6. Fig. 7 shows the receiver operating characteristics (ROC) curve of the normal model for each dataset splitting ratio, which appears to show the stability and the ability of the proposed model to achieve high performance.
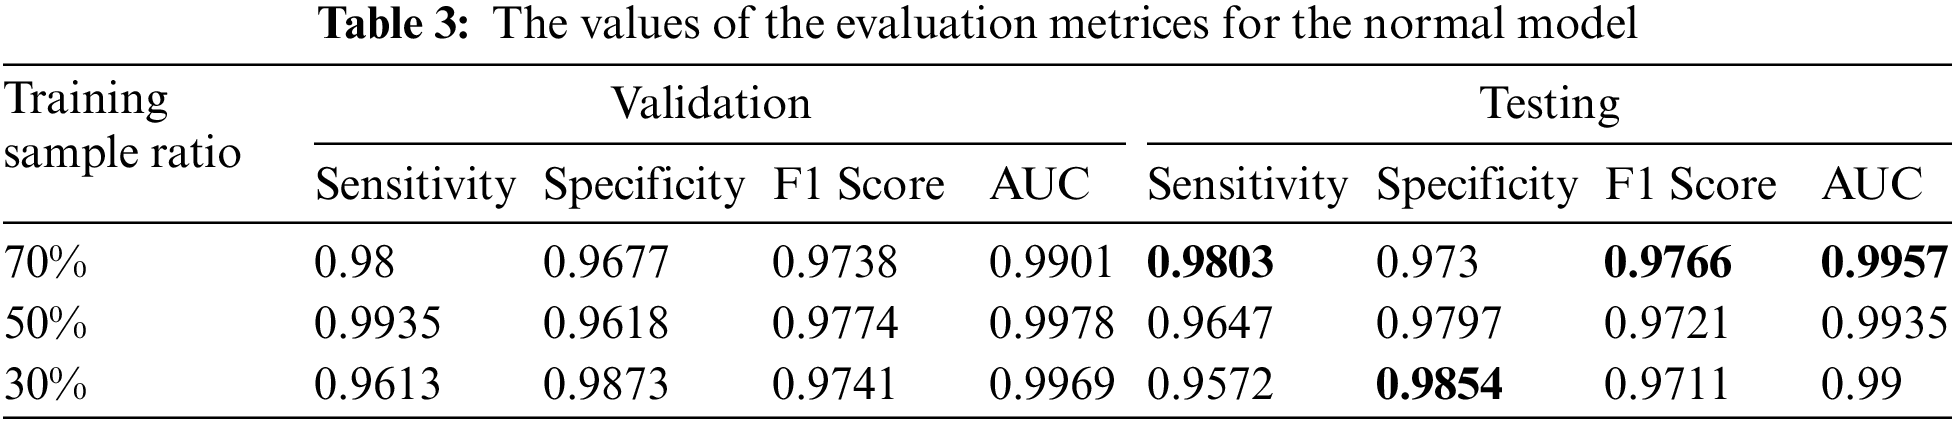
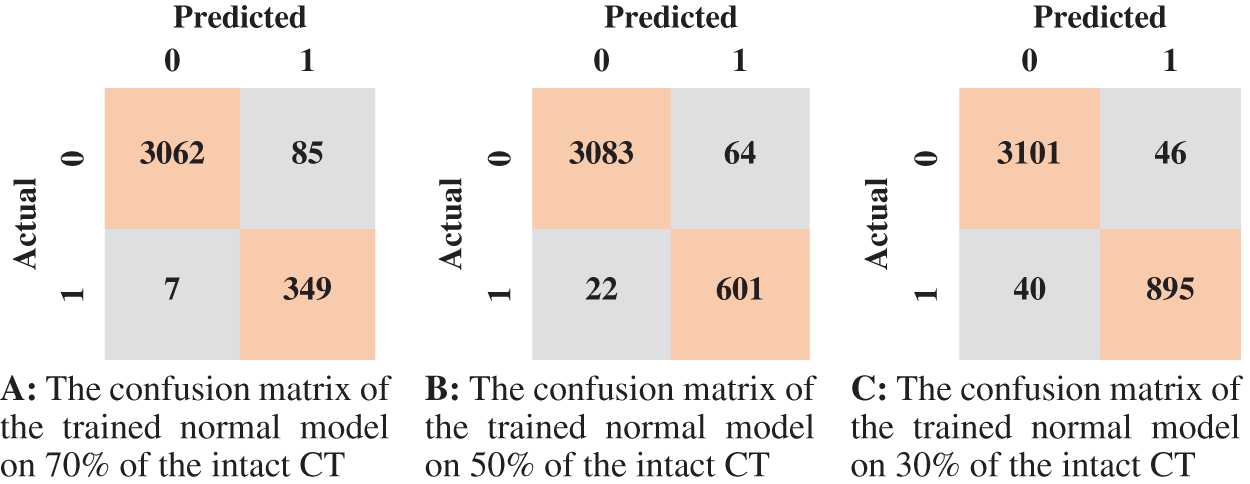
Figure 6: The confusion matrices of the trained normal model according to all training data spilt ratios
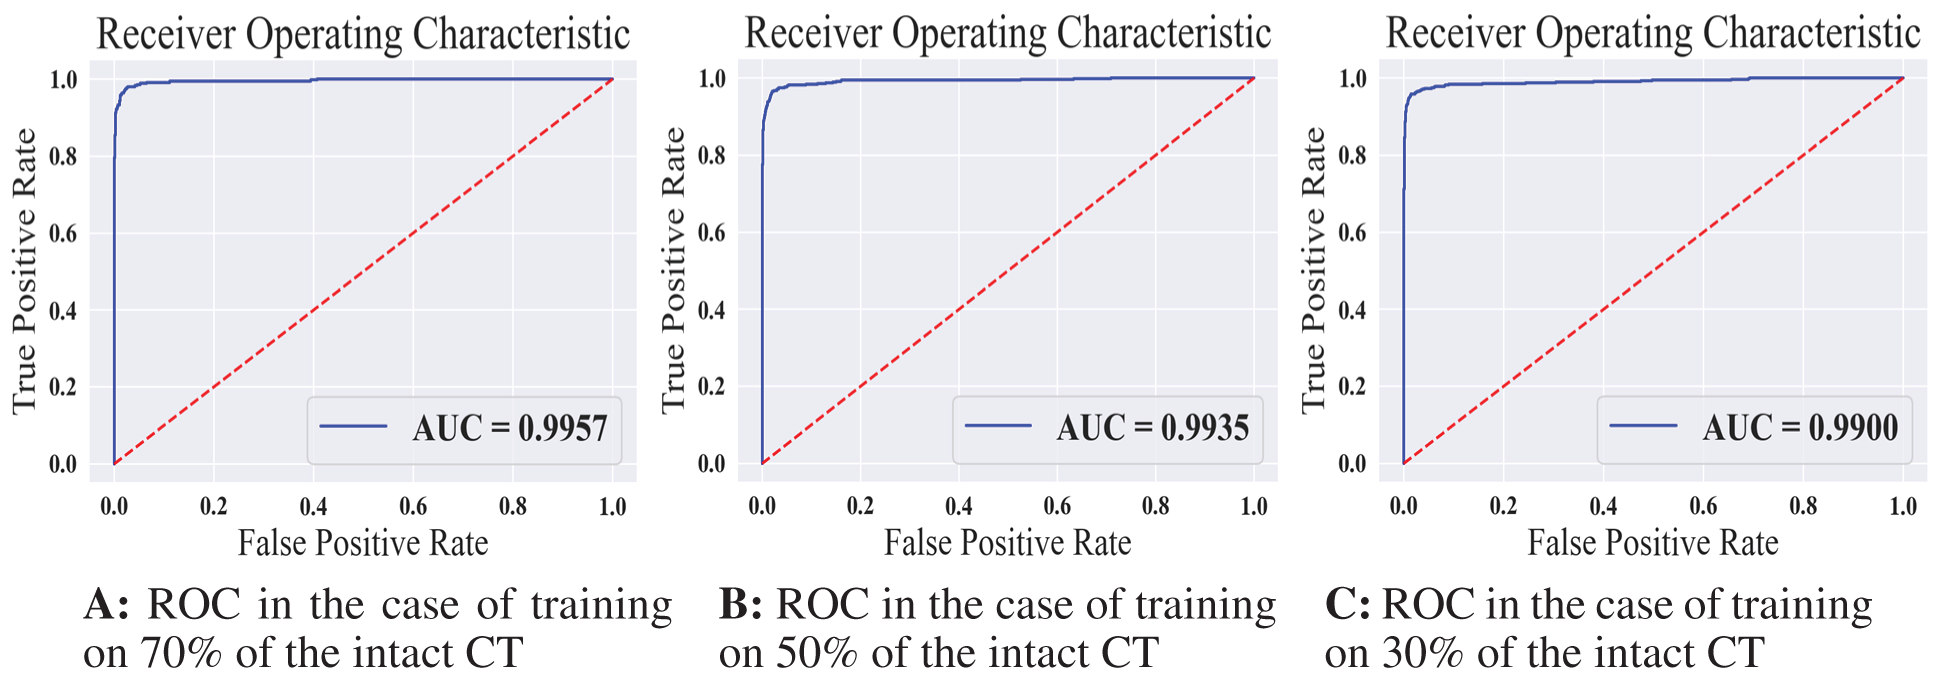
Figure 7: The receiver operating characteristics for all training scenarios of the normal model
According to the confusion matrix of the model trained on 70% normal data, only 7 normal images were classified as anomaly images, indicating that the model is highly sensitive to normal images. Fig. 8 shows examples of false-negative and false-positive images. Except for the specificity value, which was attained by the model trained on 30% of the normal data, the model trained on 70% of the normal data achieved the highest metrices values when compared to the other normal models.
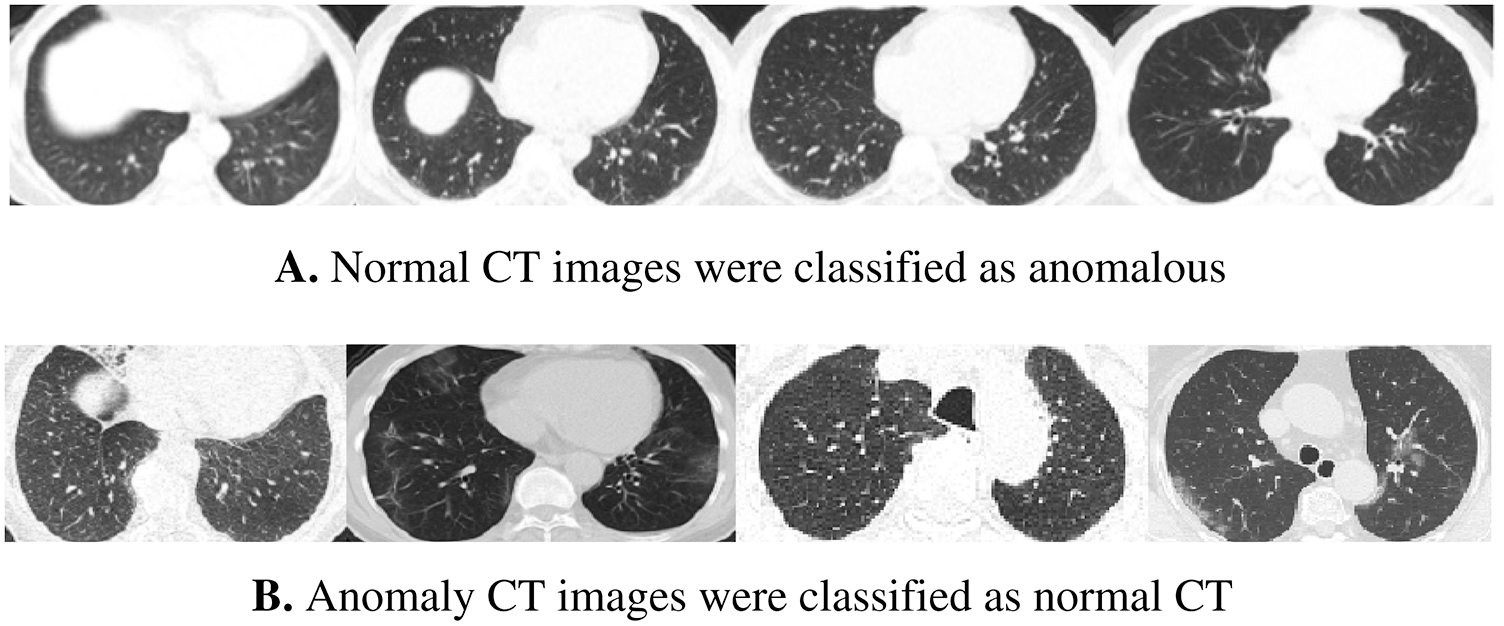
Figure 8: Samples of wrong-classified CT images by the normal model
We summarized the values of the evaluation metrices of the COVID-19 model for validation and testing in Tab. 4. By examining the confusion matrices in Fig. 9, we notice that the model can distinguish the COVID-19 from pneumonia and intact CTs with high efficiency Confusion matrices show how exact the features extracted by the network are, with sensitivity and specificity values above 97 percent and reaching 99 percent in practically all COVID-19 models. Fig. 10 shows the ROC curves of the COVID models, which appear to show the stability and robustness of the proposed model.
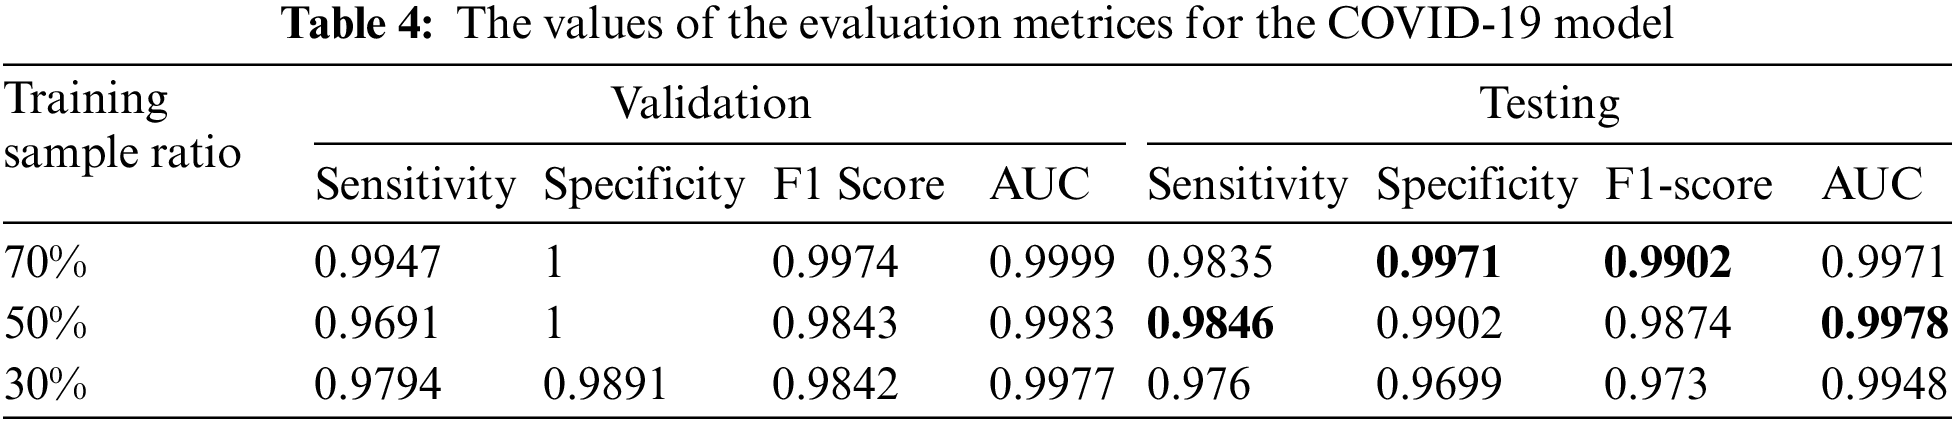
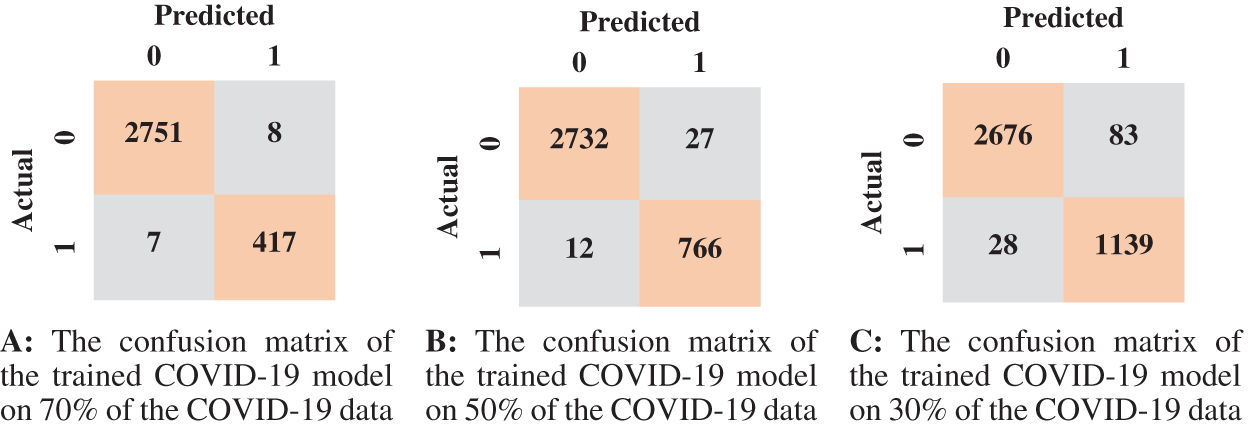
Figure 9: The confusion matrices of the trained COVID-19 model according to all training data ratios
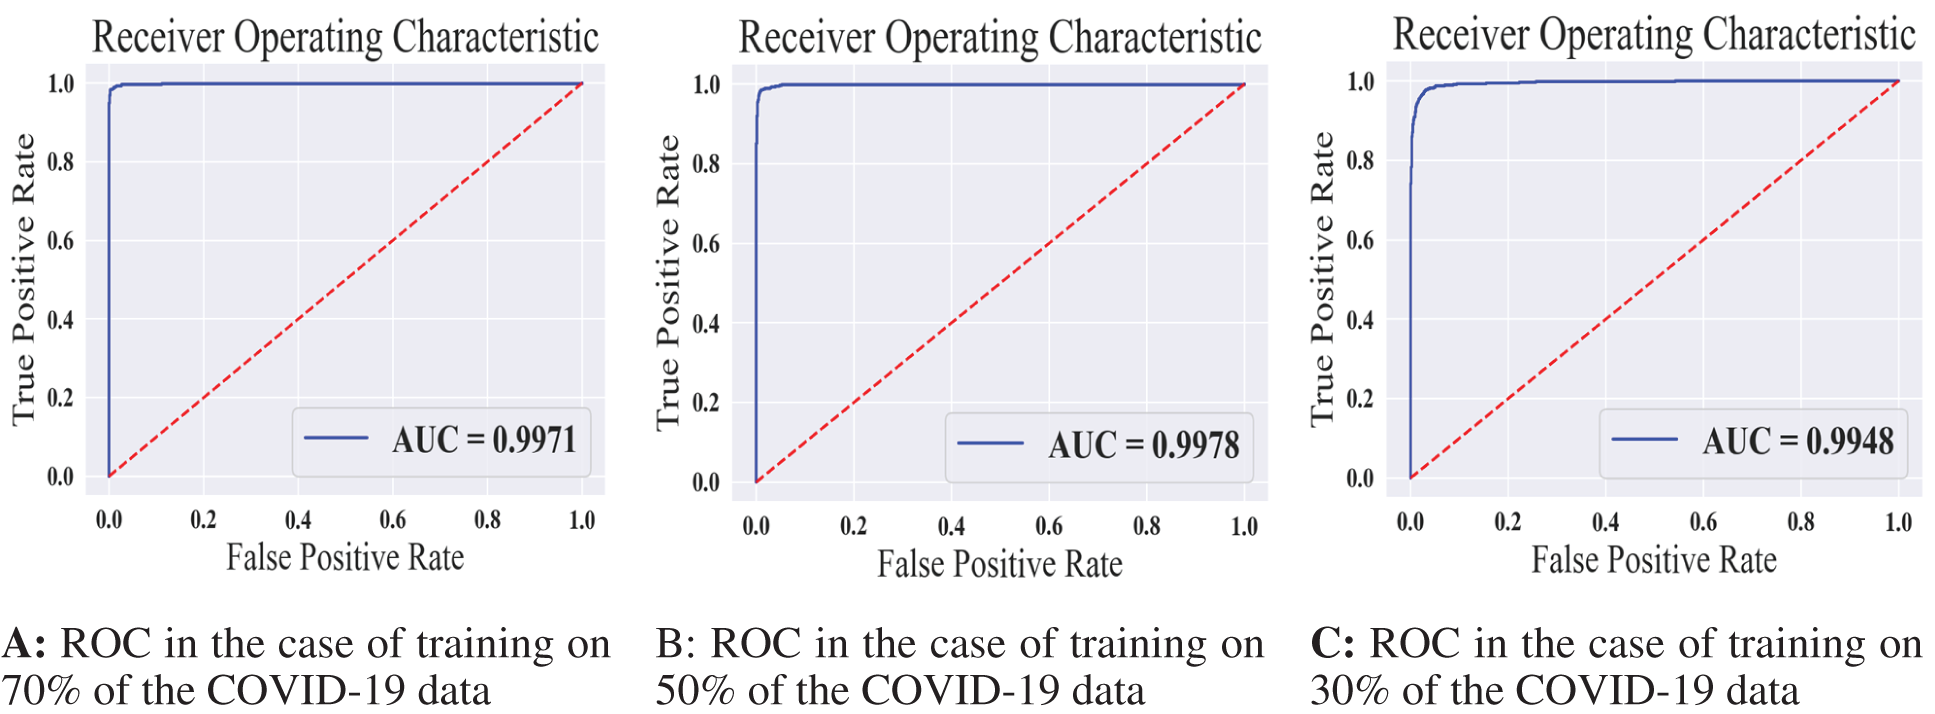
Figure 10: The receiver operating characteristics for all training scenarios of the COVID-19 model
Fig. 11 shows some wrongly classified samples. Fig. 11A depicts false-negative samples, which were supposed to be classified as COVID-19 but were classified as non-COVID. Fig. 11B shows CT images that were supposed to be classified as non-COVID but were instead classified as COVID-19 CT. The arrows in the CT images in Fig. 11A indicate lesion regions affected by Corona disease. The lungs in CT 1, 2, and 3 in Fig. 11A contain slight lesions, which makes them closer to the CT of healthy lungs, whereas the lungs in CT 4 for acute non-COVID pneumonia patients. CT 2, 3 in Fig. 11B are intact CT, but due to the circled regions that are similar to the (GGO, consolidation) areas, they were wrongly classified as COVID-19 CT. CT 4 in Fig. 11B was classified as COVID-19 because COVID-19 and other viral pneumonias share common characteristics (GGO, consolidation), and the majority of the regions in this CT are consolidation areas.
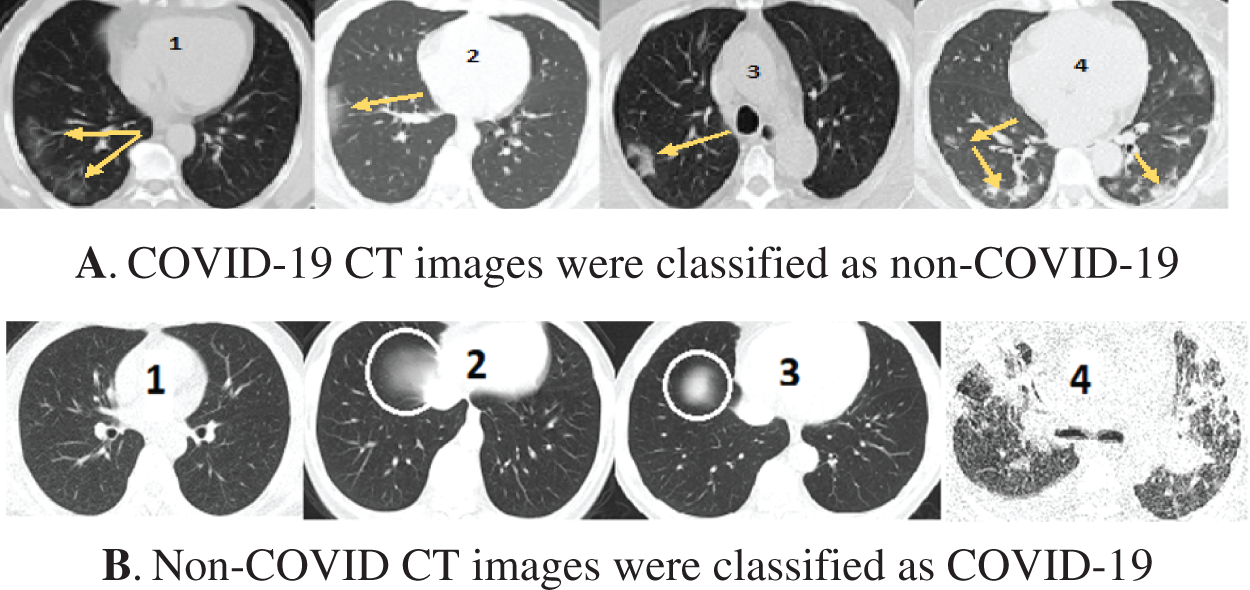
Figure 11: Samples of misclassified CT images by the COVID-19 model
We reported the sensitivity, specificity, F1 Score, and AUC of the pneumonia model on validation data and testing data in Tab. 5. The proposed model has high sensitivity for distinguishing pneumonia from COVID-19 and intact CT images, as shown in Tab. 5. The confusion matrices of the pneumonia models on the validation and testing data are shown in Fig. 12 according to the different split ratios. Confusion matrices give strong evidence of the robustness of the proposed model, as the false-negative values in the three models are (0, 10, 16). Fig. 13 depicts the pneumonia model’s ROC curves, which demonstrates the model’s stability and capacity to attain high performance despite the lack of a big dataset. Fig. 14 shows some false-positive samples.
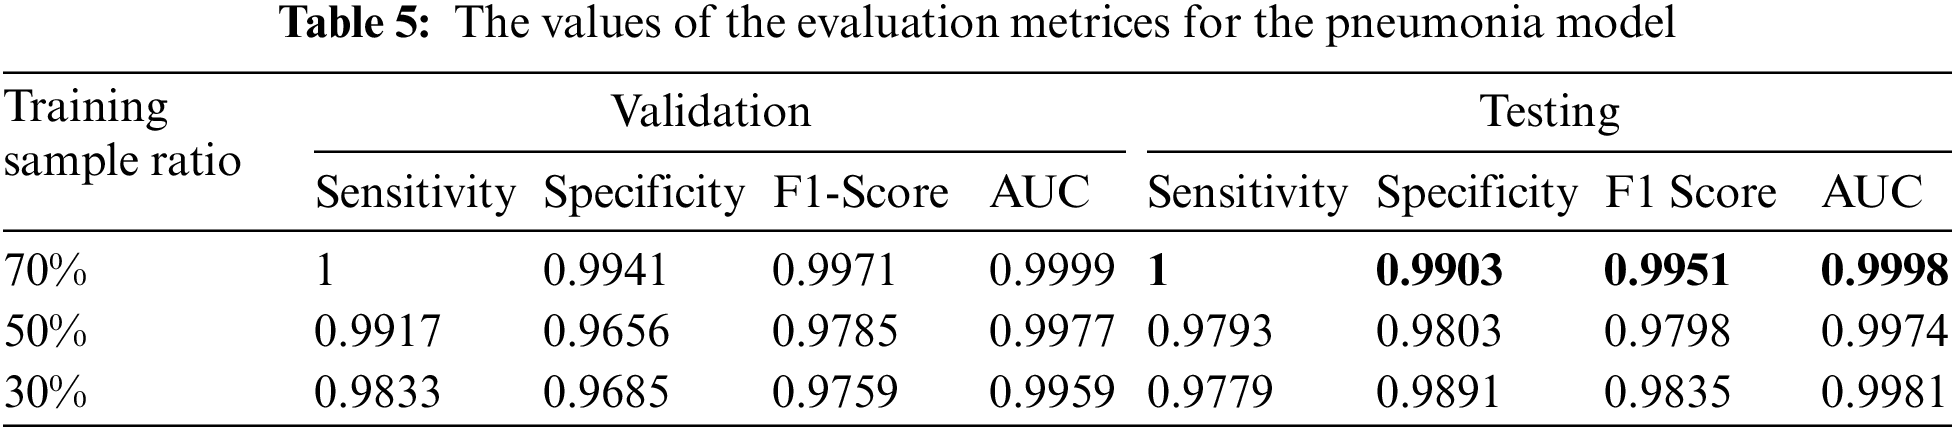
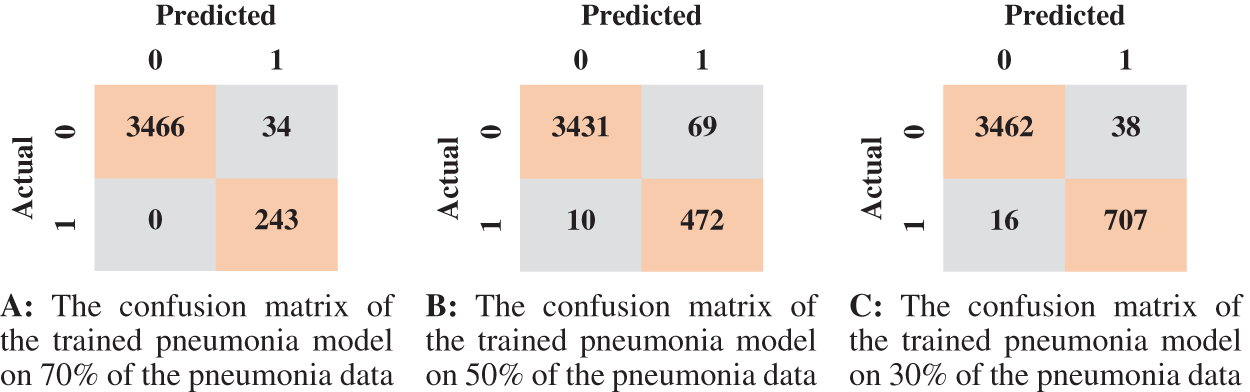
Figure 12: The confusion matrices of the trained pneumonia model according to all training data ratios
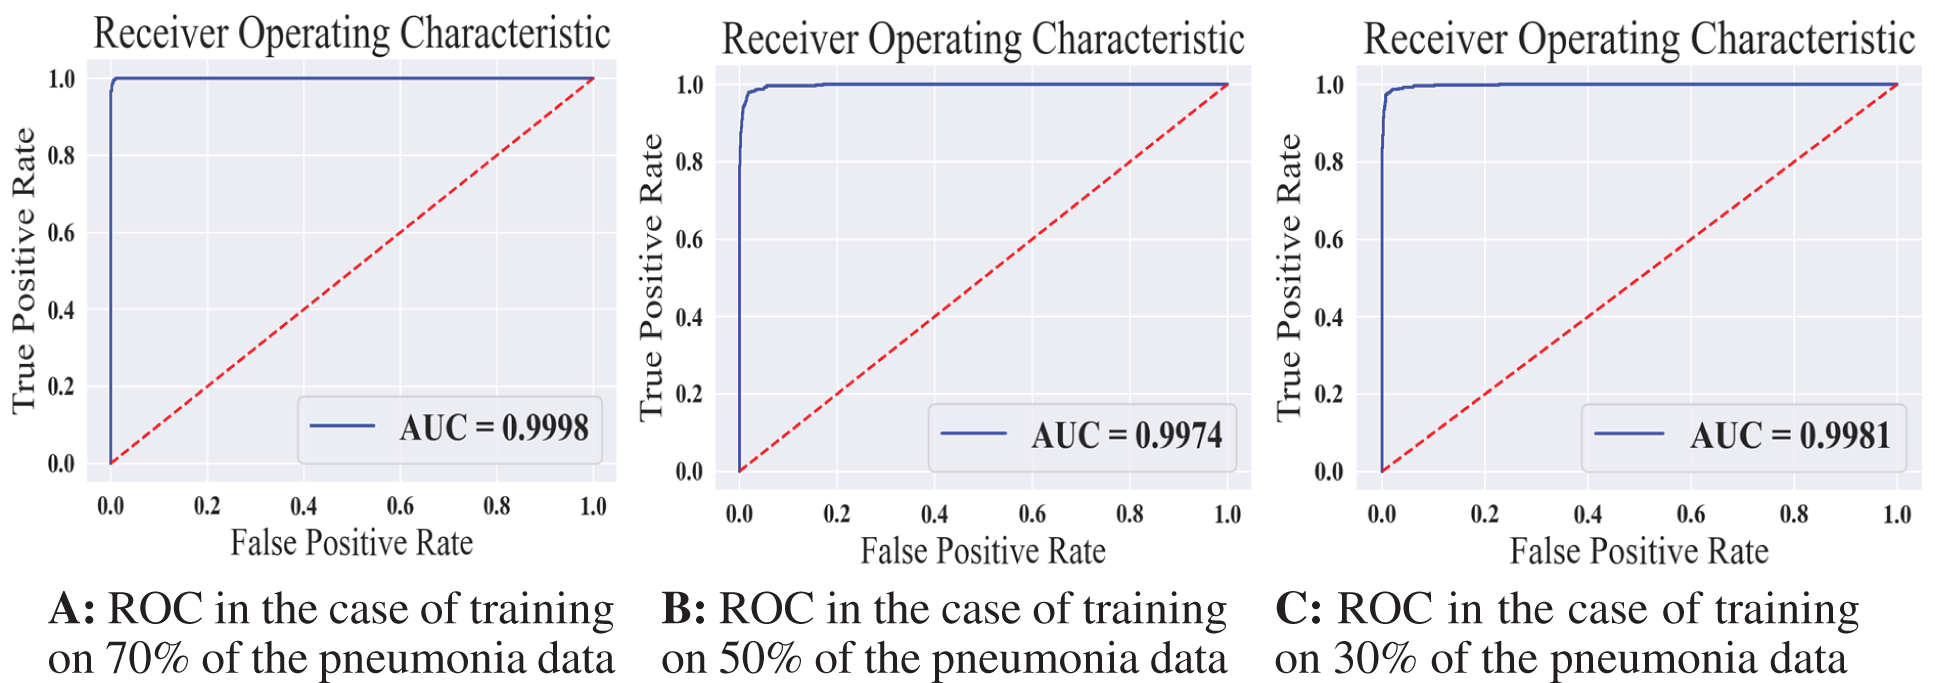
Figure 13: The receiver operating characteristics for all training scenarios of the pneumonia model
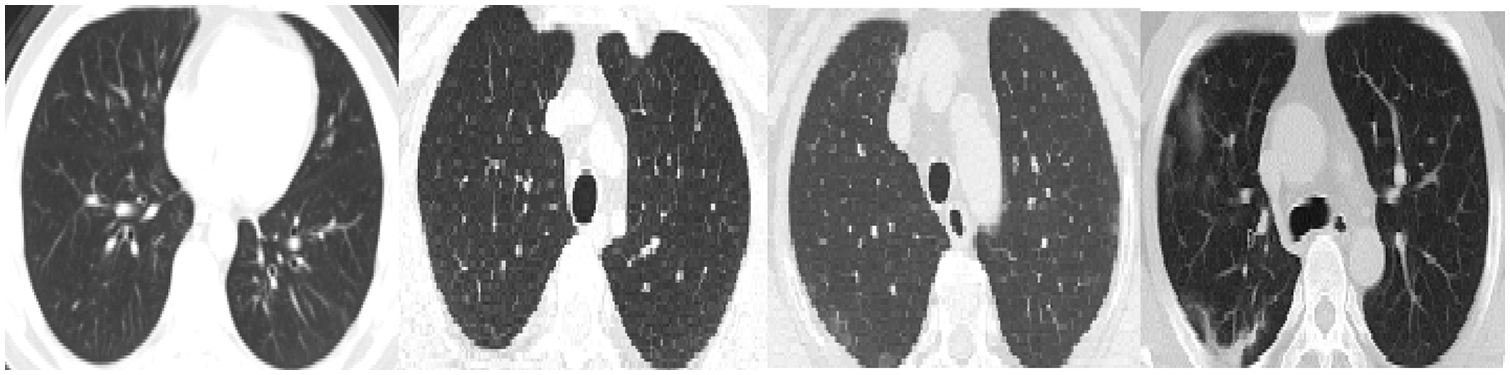
Figure 14: False-positive samples were classified by the pneumonia model. The first left two images are intact CT images, whereas the last two images represent COVID-19 CT
In this paper: we proposed a novel approach to diagnose COVID-19 and distinguish COVID-19 from other types of pneumonia. Three RADSVDD models were used in the proposed approach. Each RASVDD model was trained to recognize only one class and classify the others as anomalies. To train and assess the performance of the proposed approach, a CT dataset was built using publicly available datasets on the internet with the assistance of an expert radiologist. This dataset comprised CT images for three different classes: intact, COVID-19, and non-COVID pneumonia. To emphasize the proposed model’s ability to learn with a small dataset, three different data ratios were employed to train each model. Because each model is a one-class classifier, when a new virus emerges, we can train a new model to recognize it and add it into our existing models. The normal model attained sensitivity (0.96–0.98), specificity (0.97–0.99), F1-score (0.97–0.98), and AUC 0.99. The COVID model attained sensitivity (0.97–0.98), specificity (0.97–0.99), F1-score (0.97–0.99), and AUC 0.99. The non-COVID pneumonia model attained sensitivity (0.97–1), specificity (0.98–0.99), F1-score (0.97–0.99), and AUC 0.99. In the future, Since COVID-19 shares some characteristics with other types of pneumonia, merging the symptoms with the features extracted by our deep model will improve the diagnosis. For that, we aim to extend our dataset by adding CT scan images with the symptoms of the patients. In addition, we aim to consider all the slices of the patient’s CT scans as one sample during the diagnosis. To confirm the robustness of our framework, we will use CT datasets for another pulmonary diseases and measure the ability of our model to distinguish between different diseases.
Funding Statement: The authors received no specific funding for this study.
Conflicts of Interest: The authors declare that they have no conflicts of interest to report regarding the present study.
References
1. “WHO. Coronavirus Disease (COVID-19),” [Online], 2021. Available: https://www.who.int/health-topics/coronavirus#tab = tab_1. [Google Scholar]
2. N. Zhu, D. Zhang, W. Wang, X. Li, B. Yang et al., “A novel coronavirus from patients with pneumonia in China, 2019,” New England Journal of Medicine, vol. 382, no. 8, pp. 727–733, 2020. [Google Scholar]
3. C. Huang, Y. Wang, X. Li, L. Ren, J. Zhao et al., “Clinical features of patients infected with 2019 novel coronavirus in Wuhan, China,” The Lancet, vol. 395, no. 10223, pp. 497–506, 2020. [Google Scholar]
4. M. M. Lotfy, H. M. El-Bakry, M. M. Elgayar, S. El-Sappagh, G. Abdallah et al., “Semantic pneumonia segmentation and classification for COVID-19 using deep learning network,” Computers, Materials & Continua, vol. 73, no. 1, pp. 1141–1158, 2022. [Google Scholar]
5. D. S. Hui, E. I. Azhar, T. A. Madani, F. Ntoumi, R. Kock et al., “The continuing 2019-nCoV epidemic threat of novel coronaviruses to global health—The latest 2019 novel coronavirus outbreak in Wuhan, China,” International Journal of Infectious Diseases, vol. 91, pp. 264–266, 2020. [Google Scholar]
6. C. Long, H. Xu, Q. Shen, X. Zhang, B. Fan et al., “Diagnosis of the coronavirus disease (COVID-19rRT-PCR or CT?” European Journal of Radiology, vol. 126, pp. 108961, 2020. [Google Scholar]
7. A. Khan, S. H. Khan, M. Saif, A. Batool, A. Sohail et al., “A survey of deep learning techniques for the analysis of COVID-19 and their usability for detecting omicron,” arXiv preprint arXiv:2202.06372, 2022. [online] Available: https://arxiv.org/abs/2202.06372. [Google Scholar]
8. M. Rahimzadeh, A. Attar and S. M. Sakhaei, “A fully automated deep learning-based network for detecting COVID-19 from a new and large lung CT scan dataset,” Biomedical Signal Processing and Control, vol. 68, pp. 102588, 2021. [Google Scholar]
9. G. Litjens, T. Kooi, B. E. Bejnordi, A. A. A. Setio, F. Ciompi et al., “A survey on deep learning in medical image analysis,” Medical Image Analysis, vol. 42, pp. 60–88, 2017. [Google Scholar]
10. N. El-Rashidy, S. El-Sappagh, S. Islam, H. M. El-Bakry and S. Abdelrazek, “End-to-end deep learning framework for coronavirus (COVID-19) detection and monitoring,” Electronics, vol. 9, no. 9, pp. 1439, 2020. [Google Scholar]
11. T. Javaheri, M. Homayounfar, Z. Amoozgar, R. Reiazi, F. Homayounieh et al., “Covidctnet: An open-source deep learning approach to identify COVID-19 using CT image,” arXiv preprint arXiv:2005.03059, 2020. [online] Available: https://arxiv.org/abs/2005.03059. [Google Scholar]
12. A. I. Khan, J. L. Shah and M. M. Bhat, “CoroNet: A deep neural network for detection and diagnosis of COVID-19 from chest x-ray images,” Computer Methods and Programs in Biomedicine, vol. 196, pp. 105581, 2020. [Google Scholar]
13. N. Subramanian, O. Elharrouss, S. Al-Maadeed and M. Chowdhury, “A review of deep learning-based detection methods for COVID-19,” Computers in Biology and Medicine, vol. 143, pp. 105233, 2022. [Google Scholar]
14. D. Shen, G. Wu and H. -I. Suk, “Deep learning in medical image analysis,” Annual Review of Biomedical Engineering, vol. 19, pp. 221–248, 2017. [Google Scholar]
15. X. Wu, H. Hui, M. Niu, L. Li, L. Wang et al., “Deep learning-based multi-view fusion model for screening 2019 novel coronavirus pneumonia: A multicentre study,” European Journal of Radiology, vol. 128, pp. 109041, 2020. [Google Scholar]
16. J. Ma, A. R. Kanafi, U. R. Acharya, N. Khadem and A. Mohammadi, “Application of deep learning technique to manage COVID-19 in routine clinical practice using CT images: Results of 10 convolutional neural networks,” Computers in Biology and Medicine, vol. 121, pp. 103795, 2020. [Google Scholar]
17. A. Amyar, R. Modzelewski, H. Li and S. Ruan, “Multi-task deep learning based CT imaging analysis for COVID-19 pneumonia: Classification and segmentation,” Computers in Biology and Medicine, vol. 126, pp. 104037, 2020. [Google Scholar]
18. O. Gozes, M. Frid-Adar, N. Sagie, H. Zhang, W. Ji et al., “Coronavirus detection and analysis on chest CT with deep learning,” arXiv preprint arXiv:2004.02640, 2020. [online] Available: https://arxiv.org/abs/2004.02640. [Google Scholar]
19. Y. -H. Wu, S. -H. Gao, J. Mei, J. Xu, D. -P. Fan et al., “Jcs: An explainable COVID-19 diagnosis system by joint classification and segmentation,” IEEE Transactions on Image Processing, vol. 30, pp. 3113–3126, 2021. [Google Scholar]
20. M. Yousefzadeh, P. Esfahanian, S. M. S. Movahed, S. Gorgin, D. Rahmati et al., “Correction: Ai-corona: Radiologist-assistant deep learning framework for COVID-19 diagnosis in chest CT scans,” Plos One, vol. 16, no. 9, pp. e0257119, 2021. [Google Scholar]
21. J. Wang, Y. Bao, Y. Wen, H. Lu, H. Luo et al., “Prior-attention residual learning for more discriminative COVID-19 screening in CT images,” IEEE Transactions on Medical Imaging, vol. 39, no. 8, pp. 2572–2583, 2020. [Google Scholar]
22. L. Ruff, R. Vandermeulen, N. Goernitz, L. Deecke, S. A. Siddiqui et al., “Deep one-class classification,” in Int. Conf. on Machine Learning, PMLR, Stockholm, Sweden, vol. 80, pp. 4393–4402, 2018. [Google Scholar]
23. F. Wang, M. Jiang, C. Qian, S. Yang, S. Li et al., “Residual attention network for image classification,” in Proc. of the IEEE Conf. on Computer Vision and Pattern Recognition (CVPR), Honolulu, HI, USA, pp. 3156–3164, 2017. [Google Scholar]
24. A. Bhardwaj, W. Di and J. Wei, “Why deep learning?” in Deep Learning Essentials: Your Hands-on Guide to the Fundamentals of Deep Learning and Neural Network Modeling, 1st ed., Birmingham, UK: Packt Publishing Ltd., Chapter 1, pp. 8–18, 2018. [Google Scholar]
25. A. Glassner, “Deep learning,” in Deep Learning: From Basics to Practice, 1st ed., vol. 1, Seattle WA, USA: The Imaginary Institute, Chapter 1, pp. 37–43, 2018. [Google Scholar]
26. J. Zhang, Y. Xie, Y. Xia and C. Shen, “Attention residual learning for skin lesion classification,” IEEE Transactions on Medical Imaging, vol. 38, no. 9, pp. 2092–2103, 2019. [Google Scholar]
27. A. M. Hafiz, S. A. Parah and R. U. A. Bhat, “Attention mechanisms and deep learning for machine vision: A survey of the state of the art,” arXiv preprint arXiv:2106.07550, 2021. [online] Available: https://arxiv.org/abs/2106.07550. [Google Scholar]
28. Z. Han, B. Wei, Y. Hong, T. Li, J. Cong et al., “Accurate screening of COVID-19 using attention-based deep 3D multiple instance learning,” IEEE Transactions on Medical Imaging, vol. 39, no. 8, pp. 2584–2594, 2020. [Google Scholar]
29. “COVID-CT,” [online], 2020. Available: https://github.com/UCSD-AI4H/COVID-CT/tree/master/Images-processed. [Google Scholar]
30. zeynaloy. “(2020-09-20). “COVID-19 CT images dataset,” [online] Available: https://www.kaggle.com/zeynaloy/covid19-ct-images-dataset. [Google Scholar]
31. PlamenEduardo. “(2020-04-22). “SARS-COV-2 CT-scan dataset,” [online] Available: https://www.kaggle.com/plameneduardo/sarscov2-ctscan-dataset. [Google Scholar]
32. J. Ma, G. Cheng, W. Yixin, A. Xingle, G. Jiantao et al., (April 20, 2020). “COVID-19 CT lung and infection segmentation dataset,” [online] Available: https://zenodo.org/record/3757476#.Yab9b9BBxPa. [Google Scholar]
33. O. Ronneberger, P. Fischer and T. Brox, “U-Net: Convolutional networks for biomedical image segmentation,” in Int. Conf. on Medical Image Computing and Computer-Assisted Intervention, Munich, Germany, pp. 234–241, 2015. [Google Scholar]
34. V. Sharma and C. Dyreson, “COVID-19 screening using residual attention network an artificial intelligence approach,” in 2020 19th IEEE Int. Conf. on Machine Learning and Applications (ICMLA), Miami, FL, USA, pp. 1354–1361, 2020. [Google Scholar]
35. K. He, X. Zhang, S. Ren and J. Sun, “Deep residual learning for image recognition,” in Proc. of the IEEE Conf. on Computer Vision and Pattern Recognition, Las Vegas, NV, USA, pp. 770–778, 2016. [Google Scholar]
Cite This Article
 Copyright © 2023 The Author(s). Published by Tech Science Press.
This work is licensed under a Creative Commons Attribution 4.0 International License , which permits unrestricted use, distribution, and reproduction in any medium, provided the original work is properly cited.
 Downloads
 Citation Tools