
 Submit a Paper
 Propose a Special lssue
 Open Access
ARTICLE

Brain Tumor Segmentation in Multimodal MRI Using U-Net Layered Structure
1 Department of Information Technology, The Superior University, Lahore, Pakistan
2 Department of Software Engineering, The Superior University, Lahore, Pakistan
3 Department of Information Sciences, Division of Science and Technology, University of Education, Lahore, Pakistan
4 Department of Computer Science, Government College University, Faisalabad, Pakistan
5 Deptment of Oral and Maxillofacial Surgery, Faculty of Dentistry, Universiti Kebangsaan Malaysia, Kuala Lumpur, Malaysia
6 Institute of IR4.0, Universiti Kebangsaan Malaysia, Bangi, Selangor, Malaysia
* Corresponding Author: Muhammad Anwar. Email:
Computers, Materials & Continua 2023, 74(3), 5267-5281. https://doi.org/10.32604/cmc.2023.033024
Received 05 June 2022; Accepted 22 September 2022; Issue published 28 December 2022
 View Full Text
 Download PDF
Abstract
The brain tumour is the mass where some tissues become old or damaged, but they do not die or not leave their space. Mainly brain tumour masses occur due to malignant masses. These tissues must die so that new tissues are allowed to be born and take their place. Tumour segmentation is a complex and time-taking problem due to the tumour’s size, shape, and appearance variation. Manually finding such masses in the brain by analyzing Magnetic Resonance Images (MRI) is a crucial task for experts and radiologists. Radiologists could not work for large volume images simultaneously, and many errors occurred due to overwhelming image analysis. The main objective of this research study is the segmentation of tumors in brain MRI images with the help of digital image processing and deep learning approaches. This research study proposed an automatic model for tumor segmentation in MRI images. The proposed model has a few significant steps, which first apply the pre-processing method for the whole dataset to convert Neuroimaging Informatics Technology Initiative (NIFTI) volumes into the 3D NumPy array. In the second step, the proposed model adopts U-Net deep learning segmentation algorithm with an improved layered structure and sets the updated parameters. In the third step, the proposed model uses state-of-the-art Medical Image Computing and Computer-Assisted Intervention (MICCAI) BRATS 2018 dataset with MRI modalities such as T1, T1Gd, T2, and Fluid-attenuated inversion recovery (FLAIR). Tumour types in MRI images are classified according to the tumour masses. Labelling of these masses carried by state-of-the-art approaches such that the first is enhancing tumour (label 4), edema (label 2), necrotic and non-enhancing tumour core (label 1), and the remaining region is label 0 such that edema (whole tumour), necrosis and active. The proposed model is evaluated and gets the Dice Coefficient (DSC) value for High-grade glioma (HGG) volumes for their test set-a, test set-b, and test set-c 0.9795, 0.9855 and 0.9793, respectively. DSC value for the Low-grade glioma (LGG) volumes for the test set is 0.9950, which shows the proposed model has achieved significant results in segmenting the tumour in MRI using deep learning approaches. The proposed model is fully automatic that can implement in clinics where human experts consume maximum time to identify the tumorous region of the brain MRI. The proposed model can help in a way it can proceed rapidly by treating the tumor segmentation in MRI.Keywords
The abnormal growth of cells or masses in the body is known as a tumour. These masses, known as brain tumours, build in the brain or other body organs. According to the “National Cancer Institute (NCI)” [1], normal cells in the human body grow and later become old and must die in due time. After that, new cells take their place when the body needs them. But when cancer occurs in the body organ, this process disturbs badly. After time passes, these cells should die, but they remain alive; they divide and spread into the body’s other tissues. This process of division and spreading continues, making a tumour shape mass. Tumours are of two general types: one is a malignant tumor, and the second is a benign tumor. Malignant tumor divides and can spread to different positions in the body to make new tumor cells [2].
This spreading of tumour cells happens through the blood or lymph system. On the other hand, a benign tumour does not divide and spread. Although benign tumours can easily be removed from the body, malignant tumors create trouble. This research study is essential and challenging because many people suffer from this disease and die because of a late diagnosis. Most of the time, experts take time to identify whether a patient has a tumor and, if it has, where it is located in the brain. This problem occurs because of the manual system. Nowadays, the technology works in every field of study and performs very healthy tasks. Especially in the biomedical imaging domain, computer science works to contribute value to complex problems [3].
MRI is an imaging technology primarily used in neurology and neurosurgery [4]. This imaging technology allows viewing the brain, spinal cord, and anatomy of vascular tissues. The main advantage of this technology is that it provides a 3D view of the concerned area or location. For instance, the brain can be seen as axial, sagittal, and coronal views. Axial view means to see the brain from the top or bottom, sagittal view means to see the brain from the left or right, and coronal view means to see the brain from the backside of the head or front. MRI has four different modalities T1, T1C, T2, and FLAIR sequences [5]. Each sequence has a particular purpose, but the most frequently used are T1, T1C, T2, and FLAIR. A brain structure containing a tumour such as an edema or necrosis could be easily segmented. In brain structure, including tumors. But routinely, the FLAIR imaging sequence is used as a standard MRI sequence to detect the tumour tissues in the brain images. The main challenge is segmenting the brain’s tumorous region after examining the MRI images. For this purpose, there are three different segmentation ways: the first is a manual method, the second is a semi-automatic method, and the last is a fully automatic method. In the manual mode, the neurology and neurosurgery experts manually view and analyze the brain MRI, then highlight the tumour area if they find it. In the second method of tumorous segmentation, the human expert and the computing software are involved. The human expert gives the input to the system, and the software process the information, then returns the results to the human expert. However, this method is not too good because, for every expert, output results will be varied based on their experience or analysis.
The fully automatic method [6] means no involvement of a human expert. The automated system works itself without taking the manual inputs to initialize. Some image processing and machine learning algorithms work in the system that segments the image and then classifies the brain’s normal vs. tumorous cells. This method’s main challenge is handling the brain tumor’s different sizes, shapes, and irregular boundaries in MRI.
The proposed model addresses the complex challenge of accurate brain tumor segmentation. This research study addressed the tumour’s size, shape and variation. It also focused on identifying the irregular tumour boundaries in brain MRI images [7]. There is a need to address the large volume dataset for training and to deploy the model on real-time implementations. A big challenge is to address the irregular boundary variation of the brain tumor in MRI.
The proposed research model in this study is automatic brain tumor segmentation. This proposed model introduces the pre-processing techniques that help to identify the tumor size, shape and appearance from the brain MRI images [8]. This research study suggested a deep learning model named U-Net with improved layered structure and updated parameters with their values for tumour segmentation in the state-of-the-art BRATS 2018 [5] training dataset. This research study’s challenge is accurately segmenting tumor regions from MRI. The proposed model will accurately address the tumour’s size, shape and appearance [9]. It also identifies the tumour boundaries from brain MRIs. The main focus is brain tumour segmentation using MRIs in the early stages [10].
The rest of the paper is divided into different sections. Section 2 discusses the existing techniques, Section 3 elaborates on the dataset, Section 4 focuses on the proposed methodology, and Section 5 discusses the evaluated results. The conclusion and future work are discussed at the end of the paper.
The best solution is the need for any real-time problem such that accurate tumor segmentation is the need of time. Early detection and finding the precise area of the tumour is still a crucial problem. Various techniques were already worked on and proposed with existing methods [11]. But there are research gaps in tumour segmentation, such that an early diagnosis, accurate tumour area segmentation, the size, and shape of the tumour variations, and how one can accurately segment out in multiple slices. It proposed an automatic method for brain tumor segmentation using MRI [12]. They used a superpixel-based method for image segmentation and manually extracted features, i.e., statistical, texture, fractal and curvature. A randomized classifier was applied to classify between normal and abnormal superpixels. The proposed model was evaluated using the BRATS 2017 dataset with the FLAIR sequence. The main objective of the proposed system was to identify the tumorous images and segment the tumorous area. DSC value got 0.88 with test samples.
A classification method took FLAIR images as input and classified the results into tumor and non-tumour slices [13]. This research study used a superpixel-based segmentation approach to divide the image into small patches. The proposed research study extracted statistical, texture and fractal features from the MRI. In the end, this research study applied three different classifiers, Support Vector Machine (SVM), AdaBoost and Random Forest (RF), to classify the superpixels whether they are tumorous or not. After comparing these three classifiers, this research study found RF performs better and has a precision value of 5% greater than other classifiers. The BRATS 2012 dataset was used as a test sample to evaluate the proposed model.
A new model for the extraction of brain tumors was introduced [14]. In this method, brain MRI images with FLAIR sequence were used for the model training. After image acquisition, the tumour was enhanced in the images. After segmenting the tumour, the marker-based watershed segmentation method was used to extract shape, texture and point features. This model used the chi-square approach to select 70% of high-priority features at the feature selection step. For classification, this model passed these features to the SVM machine learning classifier, which classified the images as tumorous and non-tumorous. The proposed method was trained and tested upon three different datasets, such as Harvard, BRATS-2013 and privately collected data. The accuracy values were calculated of these datasets Harward, BRATS-2013 and Private 98.17%, 98.88% and 98.50%, respectively.
The focus was on finding the tumor region and whether it was a benign or malignant tumor [15]. The process followed these steps: first pre-processing images to remove noise. Second segmentation to find the area of interest, the third features extraction, and the fourth classification using a Neural Network. The results of the proposed model were 93.33% accuracy, 96.6% specificity, 93.33% sensitivity and precision, with 94.44% this model claimed that this model performs better than the AdaBoost that classifies the images into three types (Normal image, benign image, and malignant image) with accuracy 89.90%. In addition, 60 MRI images were privately collected to train and test the proposed model.
The fully-automated multi-parametric method [16], segmented brain tumours, In the experimental setup, the first step was pre-processing like skull stripping, noise removal and enhancing the image dataset. For segmentation, applied super pixel-based segmentation was based on spatial and intensity-based distances. After that, extract features on the different paradigms like first-order statistical-based features, texton features based on the histogram and fractal features. The next step performed feature selection and normalization by using PCA for feature selection and ICA for feature normalization because ICA was the most efficient for selecting the significant features. And then, to apply SMOTE for class balancing, MICCAI BRATS 2012 dataset was used to evaluate the model, and DSC was obtained 0.91 for this dataset.
The work was explained [17], which was proposed for brain segmentation, detecting tumorous areas and evaluating the efficacy of statistical features over Gabor features. This research study claimed that this comparison was made the first time. The algorithm used mutual information from two hemispheres of the brain. When an image slice with a tumour was found, it was segmented to delineate the tumor area. The proposed algorithm took fewer computing powers than the others. This research study trained and tested the model over the BRATS-2013 standard dataset.
Another study [18] was proposed the technique to diagnose the abnormalities in the MRI using a computer-aided diagnosis approach. The research aimed to develop a robust system that accurately identifies MRI images and brain-related disease MRI. Also, tumor types were detected, which the proposed model. The proposed system used Gabor texture and statistical feature extraction techniques. The SVM classifier was used for the classification and the whole system was trained on the brain Atlas-Harvard medical school dataset. The accuracy achieved up to 90.6%, proving the system outcome.
Further, in another study, [19,20] the segmentation method was discussed based on the confidence region detection in the MRI. The crucial problem discussed in this study was the variation of the tumor in MRI slices due to variations in intensities and spatial. The proposed technique of confidence region and contour detection was provided to detect the tumorous area in MRI. The proposed model gives the best solution for tumorous region detection in MRI.
A method proposed by Anwar et al. [21] classifies normal and abnormal images and the volume of detected tumors. First, the proposed applied pre-processing techniques enhance the image intensity. Then k-means and Fuzzy C-Means clustering algorithms are used to generate clusters of images. Features are extracted from the clustered images and passed to the SVM classifier that categorizes the images as normal or abnormal. Next, the abnormal images are segmented through Active contour by level set (ACLS). Finally, intensity adjustment and the tumor area and volume were computed from the abnormal images. The tested dataset consists of 40 slices collected privately.
It was proposed that the automated brain tumor segmentation model can accurately find the tumor segments in brain MRI. This research study used a superpixel-based approach to segment the tumourous region in the MRI. First, different features were extracted, like statistical, curvature, tax to taxation, gabbor, and SIFT, to create the feature vector for the model training. Then, machine Learorithms were used to train the model using SVM, Decision tree and KNN to classify the abnormal and normal superpixels. A significant contribution was introducing the class balancing algorithm for the unbalanced feature vector and training the BRATS 2017 whole dataset and superpixel approach to identify the tumorous regions in MRI images. The proposed model outperformed as compared to the other state-of-the-art methods. The proposed model obtained 0.85 DSC and 0.82 DSC values in HGG and LGG test volumes, respectively [7].
Reviewing various already implemented techniques showed some crucial challenges, such as accurate segmentation in MRI and detection of the tumour’s contour, size and shape. Early detection for tumour segmentation and to segment the tumorous area is a crucial problem that still needs to be resolved. Based on the previous techniques, the proposed model suggests the solution for the automatic brain tumor segmentation using U-Net improved layered structure on the state-of-the-art BRATS 2018 dataset.
The proposed model has some most important points that were discussed in the study and implemented during the development and research work. The primary purpose is brain tumor segmentation using deep learning techniques and finding the accurate tumor from the MRI. In addition, the following steps are performed during the research and development.
There are various open-source datasets for the brain tumor segmentation challenge in which the most common use nowadays is MICCAI BRATS. The proposed model has collected a multimodal MRI dataset for brain tumor segmentation from BRATS 2018 challenge [22]. This dataset has some specifications, i.e., it has only an axial view, and four sequences are discussed below in detail. And some of the essential points about the BRATS 2018 dataset are discussed here.
All the given volumes in the BRATS 2018 are available in the form of neuroimages named NifTI (.nii.gz), which have different modalities like T1, T2, T1Gd and FLAIR. However, various available techniques use only the FLAIR sequence for experimental analysis because it is more visible spatial. The BRATS dataset already defined their three labels in their research paper [5] published in the Institute of electrical and electronics engineers (IEEE). The labels are like enhancing tumour labelled 4, edema labelled 2, Necrotic tumour, and the tumour which is non-enhancing core labelled one and labelled 0 for the remaining regions.
After performing pre-processing, distributed the dataset and converted it into the same structural format. As all the data was skull stripped, this converted it into the (1 mm3) resolution, the same for all the datasets. All the BRATS 2018 datasets contain two main folders named HGG, which have 210 volumes (patients) of data. And the other is LGG which has only 75 volumes of patient data. Each volume has an MRI scan of the specific patient; the folders or volumes have four modalities, as mentioned above. There is also a ground truth for each volume inside, and in volume one NifTI file consists of four modalities and one ground truth for each modality. There are various solutions to read and convert the NifTI (.nii.xx) files into the array named 3D NumPy. Because all the volumes have NifTI files, it isn’t easy to compute as it is in the format.
Pre-processing requires a few steps, which are mentioned in detail to prepare the dataset for the proposed model. Without pre-processing, it could not get the optimum results. There are some necessary steps that this study followed are mentioned below:
Step-01: The dataset obtained from the BRATS 2018 was already skull stripped, collected all the MRI scans for each patient, and then combined them. The purpose is to make them NumPy array and the size for the array mentioned in the form of (N, S, N1, N1, X), where these annotations are:
N = Number of HGG/LGG datasets or volumes
N1 = Total 2D slices from the MRI 3D each volume
X = Number of modalities or sequences
So, all the pre-processing is held using the Google Collaboratory, which provides free Graphics processing unit (GPU) and Tensor Processing Unit (TPU) services to compute a large amount of data. Due to RAM availability and fast computation used and handled very accurately.
Step-02: In this step, this model handles the HGG and LGG volumes one by one. The purpose is to get the 3-D volume given in the example (N, 155, 240, 240, 4). HGG has a total of 210 patients or volumes dataset, and LGG has 75 patients or volumes. There is a need to distribute HGG volumes into three equal parts like N = 70, which makes 210 for the three HGG sets and makes three sets named data11.npy for the first set containing N = 70, the second was data12.npy which has N = 70, and the last was data13.npy also has N = 70. LGG has only N = 75, which is only one set and named data2.npy. As all the volumes have ground truths, it was gt11, gt12, and gt13 for the HGG volumes and gt2 for the LGG volumes.
Step-03: In this step, pre-processed all the given data separately. Observing the slices, they do not show the tumor area, so it decides to remove the unnecessary slices from the volumes at the start and end of the volume. This model used only slices from 30 to 120 for all the data files. The final shape is extracted like (N1, 240, 240, 4). Also, the same shape was extracted for the ground truths. As for the HGG volume, the value for N1 was 90 × 70 = 5600, and for the LGG volumes, the N1 was 90 × 75 = 6750.
Step-04: The final and experimental dimension is the optimum value (N1, 192, 192, 4), and we use this shape for all the data files.
Step-05: The last pre-processing step divides the data into three forms: the first is for training with 60%, the second is for validation with 20%, and the last is testing with a 20% ratio. Then the final prepared dataset is used for the model for training and testing purposes.
This model proposes the deep learning approach using U-Net (CNN algorithm) for the semantic segmentation problem with its improved layer structure and tuned parameters. The detailed picture for the proposed model is shown in Fig. 1. In the proposed model, all the steps are discussed and performed during the execution. First, arrange the dataset and apply the pre-processing steps to make the data usable for the model.
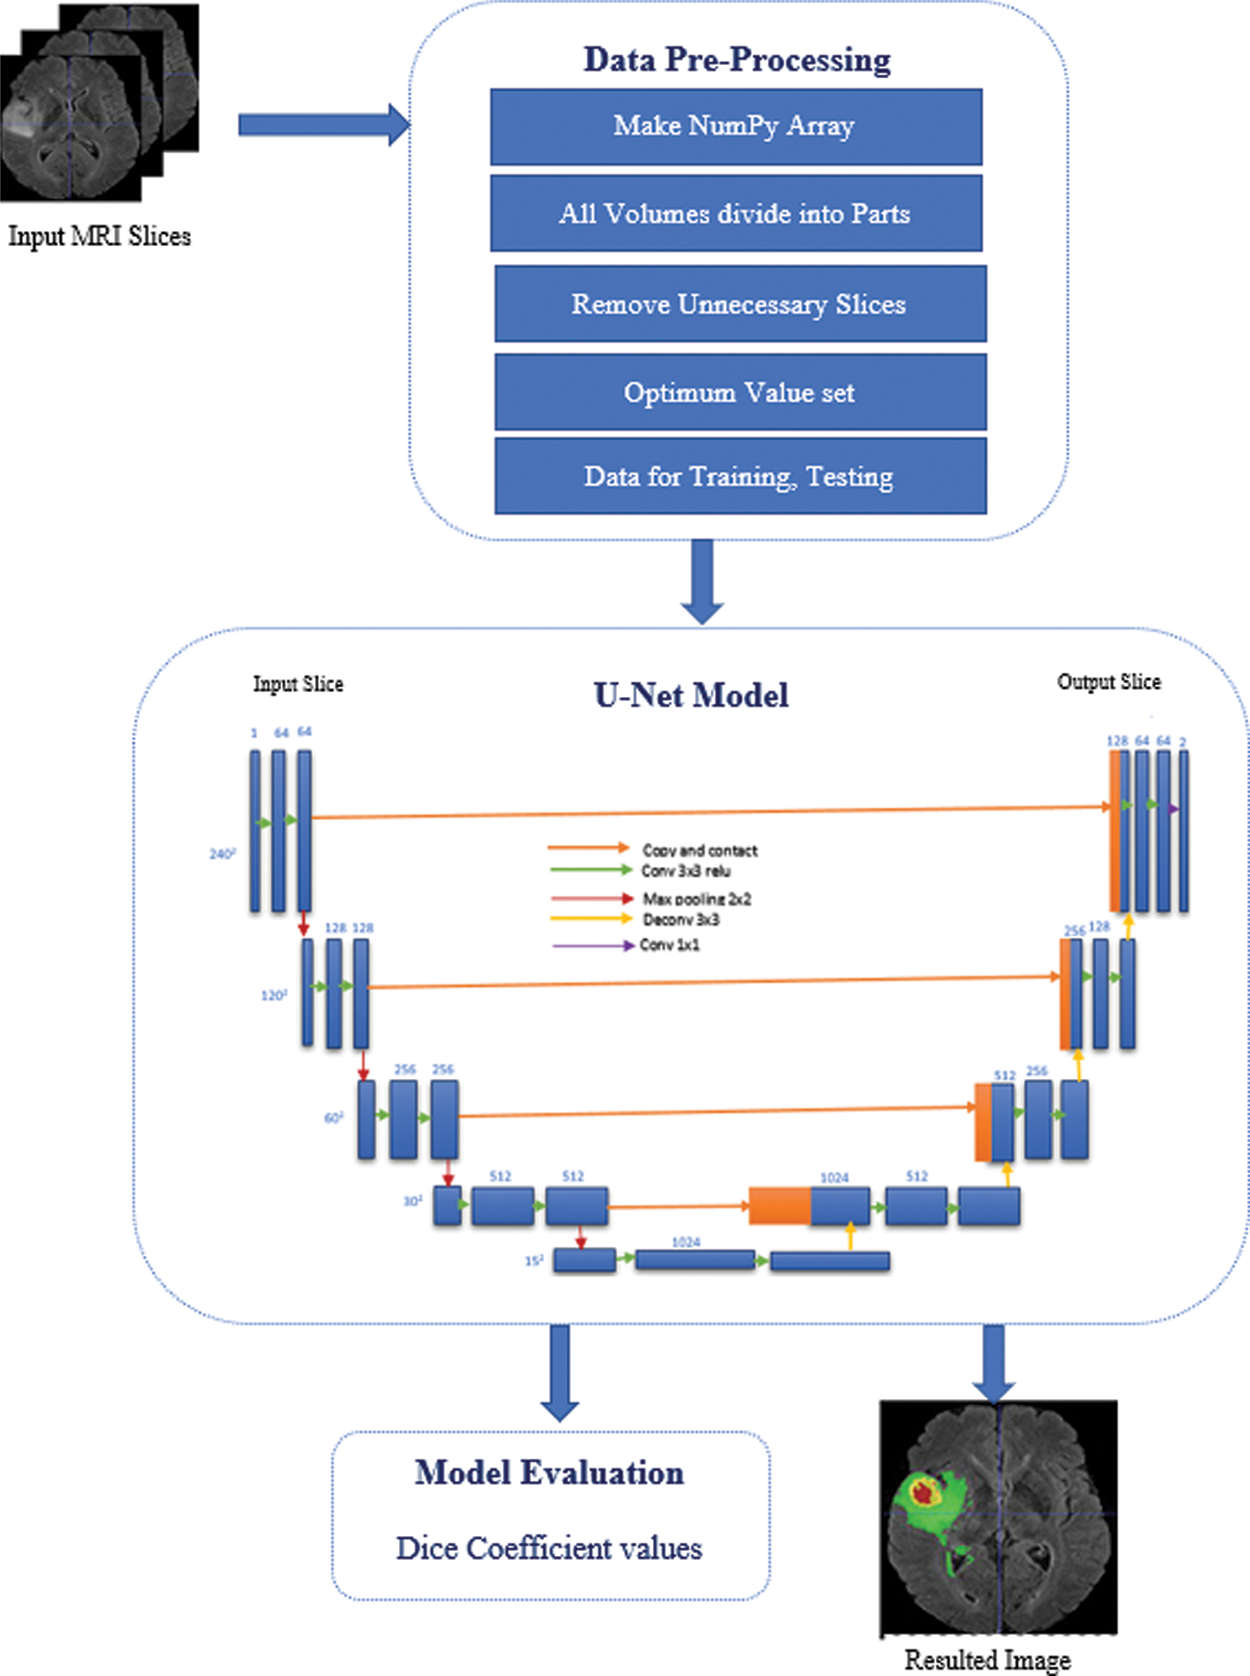
Figure 1: Proposed model methodology
Then apply the U-Net algorithm in which convolution, pooling, and final segmented results are achieved from the start of the input layer. The detailed picture shows in Fig. 1 how the U-net model worked for the semantic segmentation in the brain tumor segmentation process. This model was developed and inspired by the study of semantic segmentation [23] and apply it to the brain tumor segmentation problem using U-Net for this problem. The U-Net model has various convolution operations on each layer, improving the tumor segmentation in MRI. The U-Net model [24] is convolutional network architecture used for fast and precise image segmentation, specifically in medical imaging. It has a multi-channel feature map, and the number of channels is usually shown on top of the architecture. The x-y size shows the box’s lower-left edge, and some boxes show the feature maps. And the arrows denote the different operations. Most of the already existing techniques use Fully convolutional neural networks (FCNN) [25] and various using Recurrent neural network (RNN) [26] models for tumour segmentation in MRI using the different types of datasets.
Fig. 1 illustrates the proposed U-Net architecture for tumor segmentation with their improved layered network. The proposed model suggested a Dynamic convolutional layer (DCL) which helps to improve the training in the U-Net algorithm. This additional layer convolves with 1 × 1 convolution in the U-Net model. Lower branch, the number of channels will be changed due to the 1 × 1 convolution, and in the upper branch, these channels will also be changed on the feature maps. The1 × 1 convolution will also sum up the 1 × 1 convolution branch with the stack for the 1 × 1 convolution [27]. This layered approach helps smooth the computation and gets every minor change in the slice so the tumour area can be identified after the computation.
The U-net has multiple applications, as it is used for pattern recognition, image segmentation, and computer vision. In this proposed model, update the existing U-Net and add more layers to get the best outcome. As discussed in the results section, the proposed model is evaluated using the BRATS 2018 dataset and obtained optimum DSC values for the HGG and LGG volumes. At the end of the proposed model, use an evaluation measure to identify the model performance.
As discussed in the previous section for the proposed model and this section, we discuss the results obtained. The obtained results from the proposed model are reasonable. See the resulting images shown in Figs. 2 and 3. The proposed model is evaluated both for HGG and LGG volumes. The pictorial results view for the HGG and LGG volumes are shown in Figs. 2 and 3, respectively.
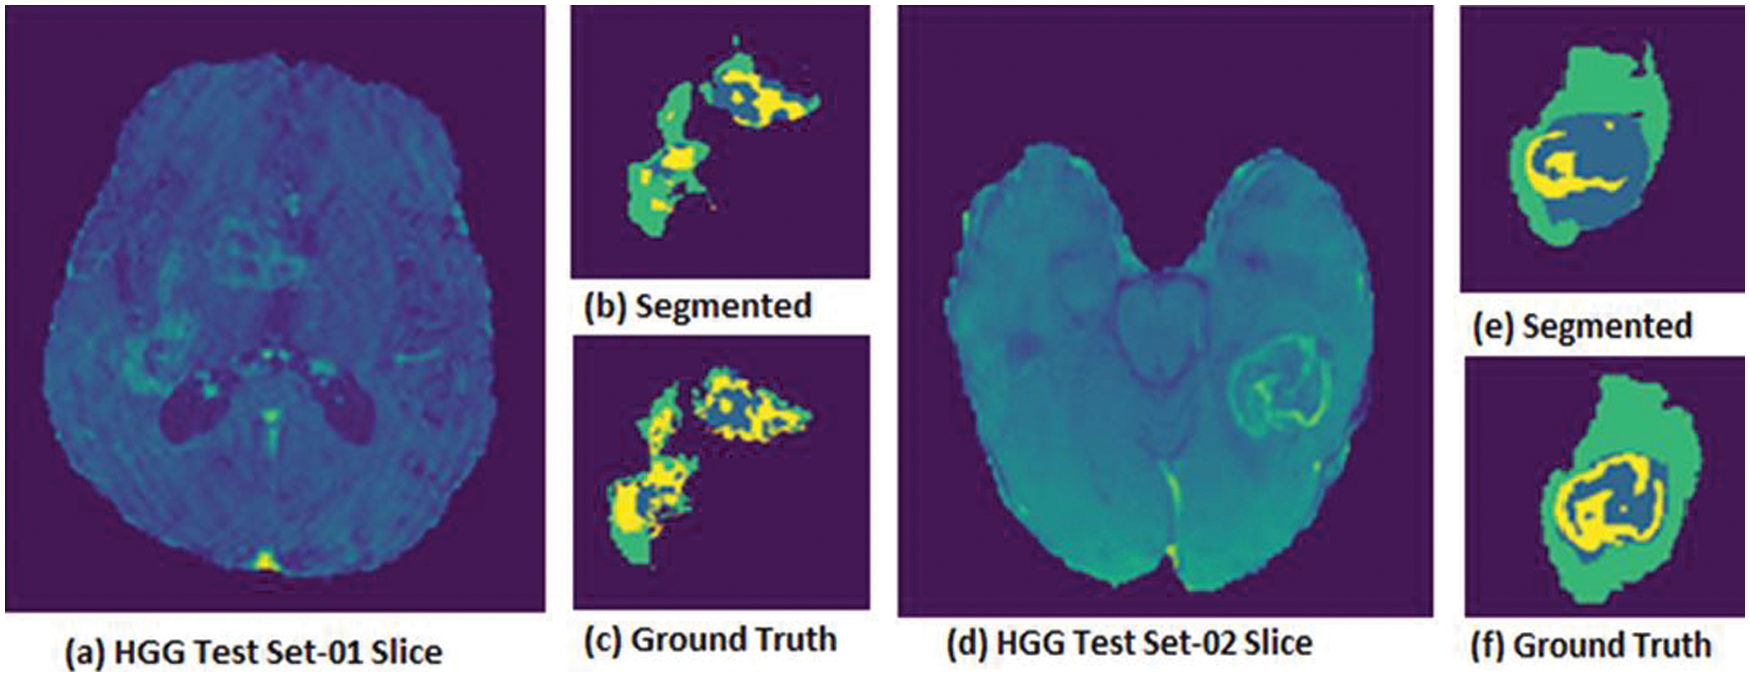
Figure 2: HGG Volumes where (a) hgg test set-01 slice, (b) segmented image set-01, (c) ground truth image test set-01, (d) hgg test set-02 slice, (e) segmented image test set-02, (f) ground truth image test set-02
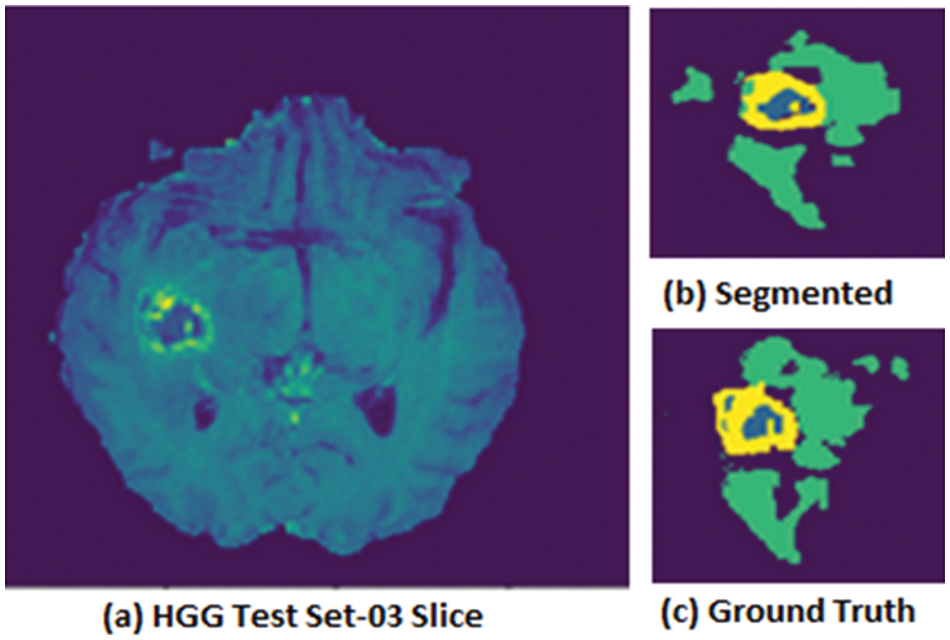
Figure 3: HGG Volume where (a) HGG test set-03 Slice, (b) segmented image test set-03, (c) ground truth image test set-03
HGG volumes evaluated using test images and results are shown in Fig. 2 and for a few samples to show the model’s accuracy. Fig. 2 is shown (a) the actual slice for the test set-01, (b) the segmented image for the test set-01, and (c) the ground truth for the test set-01 slice. Whereas (d) HGG test set-02 actual slice, (e) segmented image from test set-02, and (f) ground truth for the test set-02 slice. The proposed model was evaluated using a that took a few sample slices from the dataset to test the model. Therefore, a few visible results obtained after evaluation are shown in Fig. 2. Both HGG and LGG volume test datasets were used to evaluate the proposed model. The BRATS 2018 dataset was labeled data from an experienced radiologist, and the visual results showed the best performance as seen in the ground truths.
Fig. 3 shows the HGG volume test set-03 pictorial results in which (a) HGG test set-03 is for an actual slice, (b) segmented image, and (c) ground truth for the given slice.
Results obtained to evaluate the LGG volumes test set are shown in Fig. 4. Which shows (a) the LGG test set actual slice, (b) segmented image obtained from the slice, (c) ground truth, and whereas shows other sample slice results in (d) test set actual slice, (e) segmented image and (f) ground truth for the second slice.
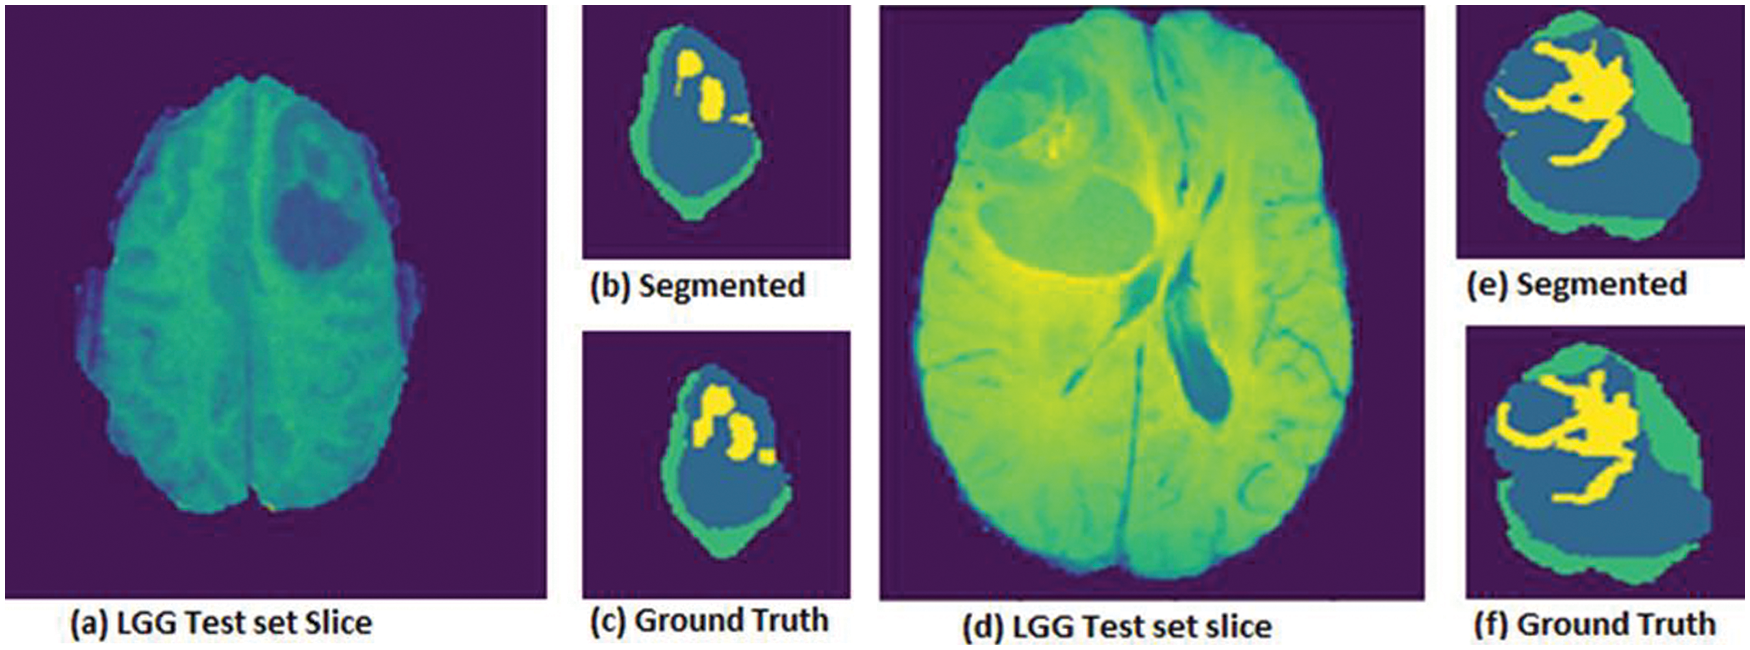
Figure 4: LGG Volumes for (a) test set-01 Slice, (b) segmented image test set, (c) ground truth image test set, whereas another slice (d) LGG test set slice, (e) segmented image test set, (f) ground truth image test set
DSC & DSC loss functions are commonly used to check the model’s accuracy. DSC is used primarily for medical imaging analysis and to evaluate the models for medical imaging. The DSC formula is shown in Eq. (1), given below.
Here are cardinalities for the two sets represented by |X| and |Y| in which the east set shows their elements [28]. Applying this equation can get the overlap values for the resulting image with the ground truth images. Which gives us the values the images overlap with each other.
The graph for the DSC loss is shown in Fig. 5, in which the training and validation datasets model loss is shown. DSC training and validation datasets decrease as the number of epochs increases. At the start of the epochs, the DSC values were maximum, and as the number of epochs increased, the dice values went down. It means the proposed model is best and gives good results.
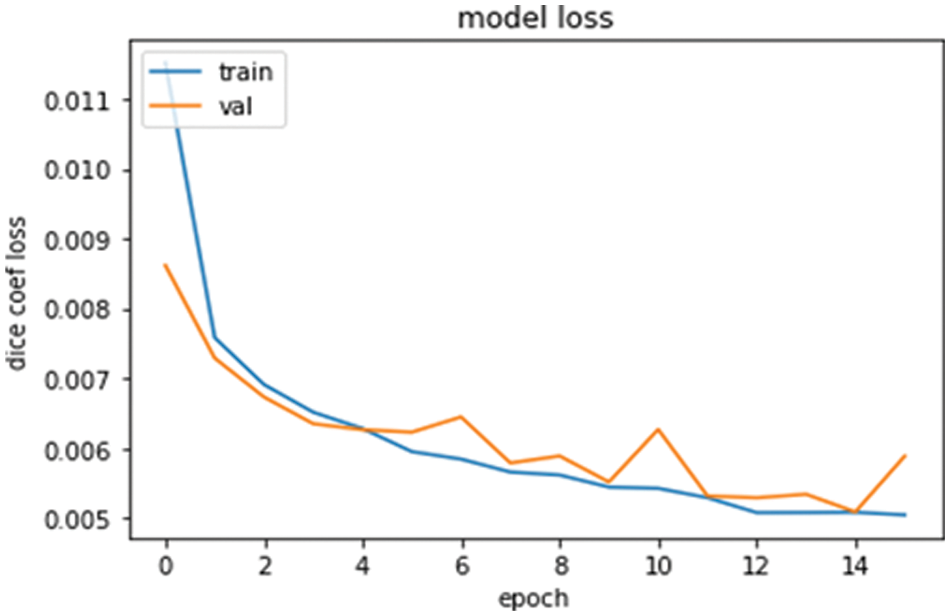
Figure 5: Model loss graph for training and validations data with DSC and epoch
The model score graph in Fig. 6 shows the DSC value against the training and validation datasets. The DSC values are going best by increasing the number of epochs. The graph is very clear about the model’s accuracy and can say it is very near to the actual results [29]. Increasing the number of epochs is going to increase the DSC values.
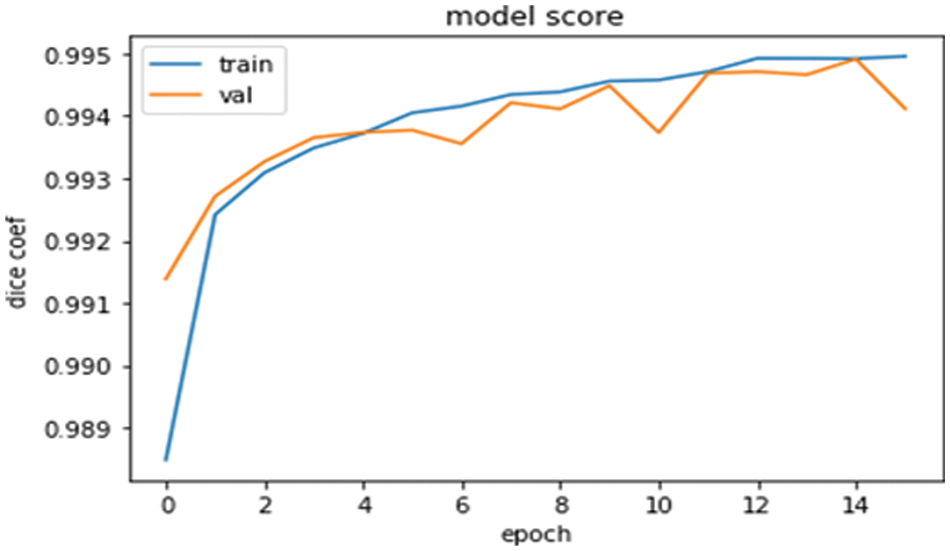
Figure 6: Model score graph for the training and validations data with DSC and epoch
The proposed model outperformed the brain tumor segmentation in the state-of-the-art dataset BRATS 2018. The DSC values for the HGG and LGG volumes test sets are shown in Table 1. Divide the dataset for training, validation, and testing. The testing sets are used here to check the model’s accuracy and get outperformed results, as shown in Table 1.
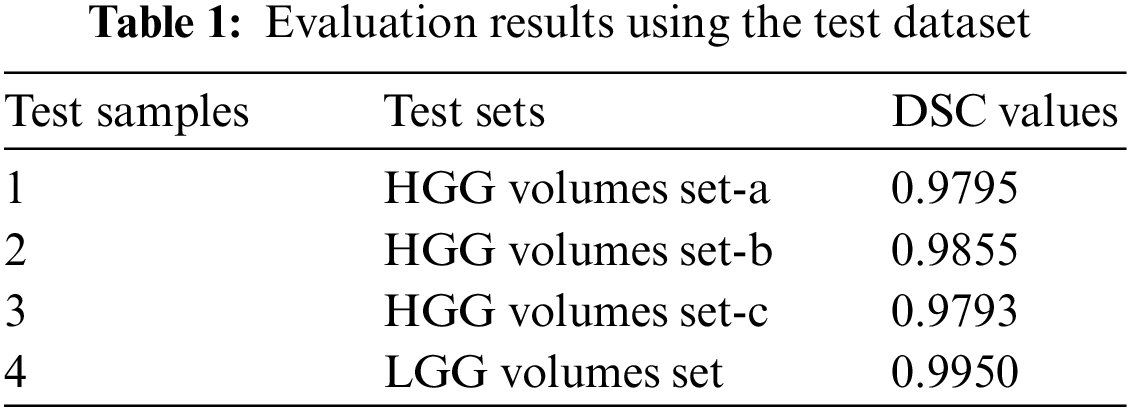
After performing various experiments, this model got the best value for DSC for both HGG and LGG volumes. The HGG and LGG volumes used for the testing had max DSC values of 0.9855 and 0.9950, respectively. These are proofs of the proposed model.
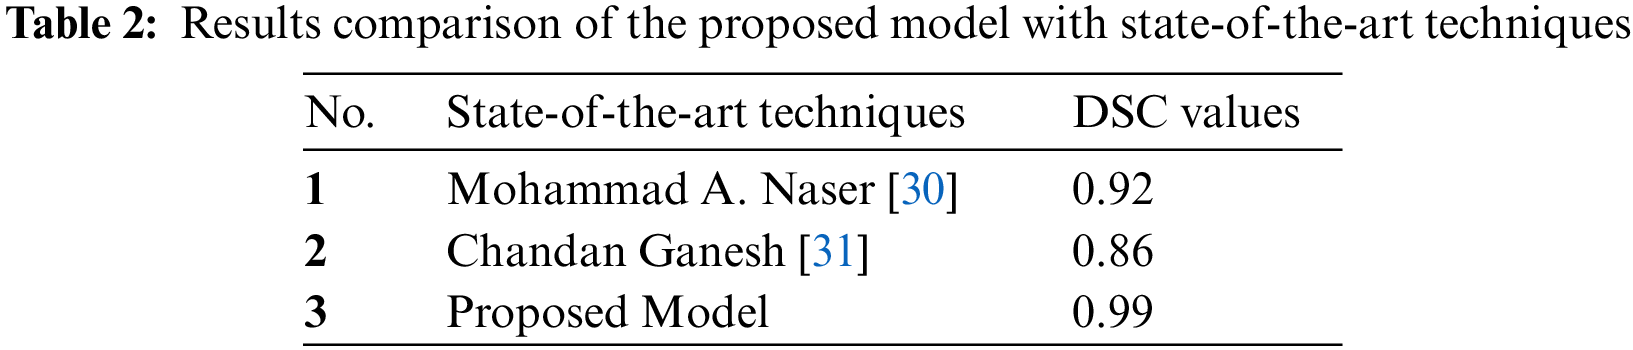
4.4 Comparison with State-of-the-art Techniques
The proposed model was compared with state-of-the-art techniques. Under the same circumstances and dataset used for these techniques, it evaluates the proposed model using MICCAI BRATS dataset as a whole and the results as shown in Table 2. DSC values are clearly shown and compared. The proposed model has better values than the state-of-the-art techniques. The proposed model was compared with DSC values [30], strategies applied in the state-of-the-art methods in the given papers, and dataset volumes were used for the model evaluation.
The problem statement points have been resolved to develop the proposed model, and the challenge of getting the three-label tumours from the MRI has been performed with the best DSC values for HGG and LGG volumes.
The proposed model can accurately determine the size and structure of the tumor in MRI. The DSC values in Tables 1, 2, and pictorial results Figs. 2–4 show that the proposed model outperforms the BRATS dataset.
The proposed model outperformed brain tumor segmentation. This model used the state-of-the-art dataset BRATS 2018. Some pre-processing steps are performed, passing the prepared dataset to the deep learning model for segmentation [31]. DSC value is better after applying it to the test dataset. The accurate tumour can be seen according to the problem statement shown in Figs. 2 and 3. The test data results for the proposed model are shown in Table 1. All the three labels for the tumour can be seen in Figs. 2 and 3 against the ground truths.
The proposed model fulfilled all the mentioned requirements in the problem statement and challenge to solve the tumor segmentation in the brain MRI. It can use various other datasets like BRATS or other real-time datasets to improve the model scalability in future work. Therefore, it is concluded that the proposed model fulfils the requirements as it performs automatically for many datasets. It can segment out accurately the tumour size as given in the ground truths. The DSC values show that the proposed model has the best results with the maximum value obtained by test sets.
The proposed model targets significant challenges such as tumor size, shape area, and tumor appearance in MRI images. This research study suggested the model with a deep learning approach improved ‘layers’ network U-Net algorithm. First, apply primary pre-processing techniques to utilize the large volume dataset. The proposed model adds Dynamic Convolution Layers in the improved U-Net algorithm for segmentation and classification. The proposed model was evaluated using BRATS 2018 training for the whole dataset. The proposed model outperforms the HGG and LGG volumes and has shown results in statistics and visuals.
The proposed model suggested the solution for accurate brain tumor segmentation in MRI. BRATS 2018 challenge open-source dataset used for the evaluation of proposed performance. The improved layered architecture of the deep learning U-Net model outperformed the dynamic convolutional layers able to identify the tumourous region in the MRI. The accurate size of the tumor in MRI was detected during tumor segmentation, and the tumor’s shape was determined according to the manual annotation of the ground truth images by experienced radiologists. In real-time, the proposed model can segment the tumor in MRI for large volume patients.
Accurately brain tumor segmentation for the MRI in which different features effects differently the segmentation results. The proposed model was developed to compute the large volume of the MRI dataset and accurately segment it. This proposed model applied some pre-processing techniques to store and process a large amount of data. This model used the U-Net with additional layers, giving the MRI high-dimension outputs. Furthermore, the Dice Coefficient values show that the proposed system has excellent results with maximum values obtained from the test datasets. The purpose was to accurately address the tumor’s localization and segment the tumorous area. Compared with the already developed techniques, the approach segments the tumorous area with excellent dice values. The proposed system suggested a solution by introducing pre-processing methods for a large volume of data.
Pre-processing steps were performed to make the NumPy array for further data processing. The proposed model used the BRATS 2018 dataset for evaluation. Accurate tumor segmentation can be seen in Figs. 2 and 3. These figures represent segmented tumor results for the HGG volumes. Fig. 4 the visual effects for the LGG volumes. The test data results for the proposed model in dice values are shown in Table 1. Dice values were obtained using the BRATS 2018 dataset, which shows the best results for HGG and LGG volumes. This proposed model outperformed as compared to the state-of-the-art methods for brain tumor segmentation.
Acknowledgement: The authors, therefore, gratefully acknowledge the authors technical and financial support.
Funding Statement: The authors received no funding for this research.
Conflicts of Interest: The authors declare they have no conflicts of interest to report regarding the present study.
References
1. O. Tandel, G. S. Biswas, M. Kakde, O. G. Tiwari, A. Suri et al., “A review on a deep learning perspective in brain cancer classification,” Cancers, vol. 11, no. 1, pp. 111, 2019. [Google Scholar]
2. D. Burgo, L. Saenz, R. M. Hernández, G. Orive and J. L. Pedraz, “Nanotherapeutic approaches for brain cancer management,” Nanomedicine Nanotechnology Biology and Medicine, vol. 10, no. 5, pp. 905–919, 2014. [Google Scholar]
3. M. Anwar, F. Masud, R. A. Butt, S. M. Idrus, M. N. Ahmad et al., “Traffic priority-aware medical data dissemination scheme for IoT based WBASN healthcare applications,” Computers, Materials & Continua, vol. 71, no. 3, pp. 4443–4456, 2022. [Google Scholar]
4. T. Arti, S. Shilpa and P. Millie, “Brain tumor segmentation and classification from magnetic resonance images review of selected methods from 2014 to 2019,” Pattern Recognition Letters, vol. 131, no. 1, pp. 244–260, 2020. [Google Scholar]
5. B. H. Menze, A. Jakab, S. Bauer, K. Farahani, J. Kirby et al., “The multimodal brain tumor image segmentation benchmark (brats),” IEEE Transactions on Medical Imaging, vol. 34, no. 10, pp. 1993–2024, 2015. [Google Scholar]
6. R. Saouli, M. Akil and R. Kachouri, “Fully automatic brain tumor segmentation using end-to-end incremental deep neural networks in MRI images,” Computer Methods and Programs in Biomedicine, vol. 166, no. 1, pp. 39–49, 2018. [Google Scholar]
7. F. Shaffer and J. P. Ginsberg, “An overview of heart rate variability metrics and norms,” Frontiers in Public Health, vol. 5, no. 1, pp. 1–17, 2017. [Google Scholar]
8. C. Hao, Q. Zhiguang, D. Yi, T. Lan and Q. Zhen, “Brain tumor segmentation with deep convolutional symmetric neural network,” Neurocomputing, vol. 392, no. 1, pp. 305–313, 2020. [Google Scholar]
9. L. T. Car, A. Soong, B. M. Kyaw, K. L. Chua, N. L. Beer et al., “Health professions digital education on clinical practice guidelines: A systematic review by digital health education collaboration,” BMC Medicine, vol. 17, no. 1, pp. 1–16, 2019. [Google Scholar]
10. A. H. Majid, M. Anwar and M. W. Ashraf, “Classified structures and cryptanalysis of Wg-7, Wg-8 and Wg-16 stream ciphers,” Technical Journal, vol. 23, no. 2, pp. 50–55, 2018. [Google Scholar]
11. M. Mehmood, E. Ayub, F. Ahmad, M. Alruwaili, Z. A. Alrowaili et al., “Machine learning enabled early detection of breast cancer by structural analysis of mammograms,” Computers, Materials and Continua, vol. 67, no. 1, pp. 641–657, 2021. [Google Scholar]
12. S. Mohammadreza, G. Yang, T. Lambrou, N. Allinson, T. L. Jones et al., “Automated brain tumour detection and segmentation using superpixel-based extremely randomized trees in flair MRI,” International Journal of Computer Assisted Radiology and Surgery, vol. 12, no. 2, pp. 183–203, 2017. [Google Scholar]
13. Z. U. Rehman, S. S. Naqvi, T. M. Khan, M. A. Khan and T. Bashir, “Fully automated multi-parametric brain tumour segmentation using superpixel based classification,” Expert Systems with Applications, vol. 118, no. 1, pp. 598–613, 2019. [Google Scholar]
14. M. Malik, M. W. Iqbal, S. K. Shahzad, M. T. Mushtaq, M. R. Naqvi et al., “Determination of COVID-19 patients using machine learning algorithms,” Intelligent Automation and Soft Computing, vol. 31, no. 1, pp. 207–222, 2022. [Google Scholar]
15. M. A. khan, L. U. Ikram, A. Rehman, M. Ishaq, M. Sharif et al., “Brain tumor detection and classification a framework of marker-based watershed algorithm and multilevel priority features selection,” Microscopy Research and Technique, vol. 82, no. 6, pp. 909–922, 2019. [Google Scholar]
16. H. Byale, G. M. Lingaraju and S. Sivasubramanian, “Automatic segmentation and classification of brain tumor using machine learning techniques,” International Journal of Applied Engineering Research, vol. 13, no. 14, pp. 11686–11692, 2018. [Google Scholar]
17. Z. U. Rehman, S. S. Naqvi, T. M. Khan, M. A. Khan and T. Bashir, “Fully automated multi-parametric brain tumour segmentation using superpixel based classification,” Expert Systems with Applications, vol. 118, no. 1, pp. 598–613, 2019. [Google Scholar]
18. N. Nooshin, K. Miroslav and Nabizadeh, “Brain tumors detection and segmentation in mr images gabor wavelet vs. statistical features,” Computers and Electrical Engineering, vol. 45, no. 1, pp. 286–301, 2017. [Google Scholar]
19. E. Arif, S. K. Shahzad, R. Mustafa, M. A. Jaffar and M. W. Iqbal, “Deep neural networks for gun detection in public surveillance,” Intelligent Automation and Soft Computing, vol. 32, no. 2, pp. 909–922, 2022. [Google Scholar]
20. P. G. Rajan and C. Sundar, “Brain tumor detection and segmentation by intensity adjustment,” Journal of Medical Systems, vol. 43, no. 8, pp. 1–3, 2019. [Google Scholar]
21. M. Anwar, A. H. Abdullah, A. Altameem, K. N. Qureshi, F. Masud et al., “Green communication for wireless body area networks: Energy aware link efficient routing approach,” Sensors, vol. 18, no. 10, pp. 3237, 2018. [Google Scholar]
22. K. Ejaz, M. S. Rahim, U. I. Bajwa, H. Chaudhry, A. Rehman et al., “Hybrid segmentation method with confidence region detection for tumor identification,” IEEE Access, vol. 9, no. 1, pp. 35256–35278, 2020. [Google Scholar]
23. M. Ghaffari, A. Sowmya and R. Oliver, “Automated brain tumor segmentation using multimodal brain scans a survey based on models submitted to the brats 2012–2018 challenges,” IEEE Reviews in Biomedical Engineering, vol. 13, no. 1, pp. 156–168, 2019. [Google Scholar]
24. D. Ahmed, M. W. Iqbal, S. K. Shahzad, M. R. Naqvi and F. Muneer, “Smart health architecture integration model,” in Proc. 1st Int. Conf. on Healthcare Computing Systems and Technologies (CHEST), Birjand, Iran, pp. 1–7, 2019. [Google Scholar]
25. M. Anwar, A. H. Abdullah, R. R. Saedudin, F. Masud and F. Ullah, “CAMP: Congestion avoidance and mitigation protocol for wireless body area networks,” International Journal of Integrated Engineering, vol. 10, no. 6, pp. 59–65, 2018. [Google Scholar]
26. X. Liu, Z. Deng and Y. Yang, “Recent progress in semantic image segmentation,” Artificial Intelligence Review, vol. 52, no. 2, pp. 1089–1106, 2019. [Google Scholar]
27. Z. X. Zhao, Y. Wu, G. Song, Z. Li, Y. Zhang et al., “A deep learning model integrating FCNNs and CRFs for brain tumor segmentation,” Medical Image Analysis, vol. 43, no. 1, pp. 98–111, 2018. [Google Scholar]
28. M. Anwar, A. H. Abdullah, K. N. Qureshi and A. H. Majid, “Wireless body area networks for healthcare applications: An overview,” Telkomnika, vol. 15, no. 3, pp. 1088–1095, 2017. [Google Scholar]
29. T. Magadza and S. Viriri, “Deep learning for brain tumor segmentation: A survey of state-of-the-art,” Journal of Imaging, vol. 7, no. 2, pp. 119, 2021. [Google Scholar]
30. M. A. Naser and M. J. Deen, “Brain tumor segmentation and grading of lower-grade glioma using deep learning in MRI images,” Computers in Biology and Medicine, vol. 121, no. 1, pp. 103758, 2020. [Google Scholar]
31. C. G. B. Yogananda, B. R. Shah, M. V. Jahromi, S. S. Nalawade, G. K. Murugesan et al., “A fully automated deep learning network for brain tumor segmentation,” Tomography, vol. 6, no. 1, pp. 186–193, 2020. [Google Scholar]
Cite This Article
 Copyright © 2023 The Author(s). Published by Tech Science Press.
This work is licensed under a Creative Commons Attribution 4.0 International License , which permits unrestricted use, distribution, and reproduction in any medium, provided the original work is properly cited.
 Downloads
 Citation Tools