
 Submit a Paper
 Propose a Special lssue
 Open Access
ARTICLE

Chaotic Flower Pollination with Deep Learning Based COVID-19 Classification Model
1 Department of Information Technology, Manipal Institute of Technology Bengaluru, Manipal Academy of Higher Education, Manipal, India
2 Department of Medical Equipment Technology, College of Applied Medical Sciences, Majmaah University, Al Majmaah, 11952, Saudi Arabia
3 Public Health Department, College of Applied Medical Sciences, Majmaah University, Al Majmaah, 11952, Saudi Arabia
4 Department of Computing Technologies, College of Engineering and Technology, Faculty of Engineering and Technology, SRM Institute of Science and Technology, Kattankulathur, 603203, Tamilnadu, India
5 Medical Instrumentation Techniques Engineering Department, Al-Mustaqbal University College, Babylon, Iraq
6 College of Technical Engineering, The Islamic University, Najaf, Iraq
7 College of Information Technology, Imam Ja’afar Al-Sadiq University, Al-Muthanna, 66002, Iraq
* Corresponding Author: Ahmed Alkhayyat. Email:
Computers, Materials & Continua 2023, 74(3), 6195-6212. https://doi.org/10.32604/cmc.2023.033252
Received 12 June 2022; Accepted 12 October 2022; Issue published 28 December 2022
 View Full Text
 Download PDF
Abstract
The Coronavirus Disease (COVID-19) pandemic has exposed the vulnerabilities of medical services across the globe, especially in underdeveloped nations. In the aftermath of the COVID-19 outbreak, a strong demand exists for developing novel computer-assisted diagnostic tools to execute rapid and cost-effective screenings in locations where many screenings cannot be executed using conventional methods. Medical imaging has become a crucial component in the disease diagnosis process, whereas X-rays and Computed Tomography (CT) scan imaging are employed in a deep network to diagnose the diseases. In general, four steps are followed in image-based diagnostics and disease classification processes by making use of the neural networks, such as network training, feature extraction, model performance testing and optimal feature selection. The current research article devises a Chaotic Flower Pollination Algorithm with a Deep Learning-Driven Fusion (CFPA-DLDF) approach for detecting and classifying COVID-19. The presented CFPA-DLDF model is developed by integrating two DL models to recognize COVID-19 in medical images. Initially, the proposed CFPA-DLDF technique employs the Gabor Filtering (GF) approach to pre-process the input images. In addition, a weighted voting-based ensemble model is employed for feature extraction, in which both VGG-19 and the MixNet models are included. Finally, the CFPA with Recurrent Neural Network (RNN) model is utilized for classification, showing the work’s novelty. A comparative analysis was conducted to demonstrate the enhanced performance of the proposed CFPA-DLDF model, and the results established the supremacy of the proposed CFPA-DLDF model over recent approaches.Keywords
Chest X-ray imaging is one of the promising techniques used in both diagnosis and the monitoring of several lung diseases such as pneumonia, tuberculosis, hernia infiltration and atelectasis [1,2]. COVID-19, a manifestation of lung infection and upper respiratory tract, was initially identified in Wuhan city, China, in late 2019. It majorly affects the airways and lungs of the infected individuals [3]. This deadly virus spread across the globe quickly and was announced as a pandemic by the World Health Organization (WHO). The number of cases and the resultant deaths have been increasing day-by-day since early 2020. Chest X-ray images are highly helpful in the prognosis of COVID-19 and detecting the impact caused by the disease upon the lung tissues. Subsequently, chest X-ray imaging has become a first-stage technique in detecting Coronavirus Disease (COVID-19) infection [4].
In automating processes like disease diagnosis and classification, the Computer-Aided Diagnosis (CAD) system offers important solutions to healthcare professionals and researchers in terms of detection and confirmation of the presence of coronavirus disease using novel classification techniques [5,6]. In this background, the CAD system has become an important domain of research. In COVID-19 disease diagnosis research, the CAD system uses Deep Learning (DL) or Machine Learning (ML) methods to evaluate all forms of a patient’s data, including their clinical data images and forecast their disease conditions. This assessment method enhances the outcomes of the diagnostic procedures and assists the medical professionals in the decision-making process, which in turn enhances the prognosis as well [7]. Hence, the CAD mechanism is considered a powerful tool for radiotherapists to improve diagnostic approaches like chest radiographs, Computed Tomography (CT) scan and so on. Both DL and ML approaches were originally launched for the development of expert systems since these techniques play an important role in health care management, especially in the deployment of clinical decision support mechanisms [8]. These techniques not only support the classification of the diseases like muscle diseases, breast cancer, pneumonia and tuberculosis but are also helpful in the detection, diagnosis and classification of Coronavirus Disease (COVID-19) [9]. Further, DL and ML techniques are evolving technologies in the healthcare domain since these techniques are capable of producing highly-accurate prediction results, which is an important contribution to the healthcare automation process [10]. But, it is challenging to select the most appropriate DL or ML strategy since numerous strategies have been proposed and validated earlier, while most of the techniques render effectual results in the diagnosis of Coronavirus Disease (COVID-19).
Kumar et al. [11] presented a structure that collects small volumes of data from diverse sources (i.e., clinics) and trains the global DL method using a blockchain-related federated learning process. Blockchain (BC) technology validates the data, whereas the federated learning method trains the method worldwide. It helps in conserving the privacy of the organization. Initially, the authors presented a data normalization method to cover the heterogeneity of the data since it was collected from different hospitals using distinct forms of Computed Tomography (CT) scanners. Followed by the Capsule Network-related classification and segmentation were employed in the detection of Coronavirus Disease (COVID-19). Finally, a technique was devised to provide joint training to a global method with the help of BC technology and achieve federated learning during privacy preservation. In the study conducted earlier [12], the researchers proposed the MobileNet-V2 and VGG16 models using RMSprop and ADAM optimizers, respectively, for automatic detection of the Coronavirus Disease (COVID-19) from chest X-ray images and its differentiation from the rest of the pneumonia diseases. Afterwards, the efficacy of the suggested method was improved by applying both Transfer Learning (TL) as well as data augmentation methods. These methods were utilized to address the overfitting issues.
Vaid et al. [13] devised a Deep Learning (DL) method to increase the accuracy of the reported cases and predict the disease using chest X-ray scan images. This method was developed based on the Convolutional Neural Networks (CNNs) method for detecting the disease and its categorization based on structural abnormalities. These structural abnormalities are the key entities that can reveal the hidden forms of Coronavirus Disease (COVID-19). So, a TL method was executed to recognize the presence of the disease in the chest anterior-posterior radiographs of the patients. In literature [14], a precise and effective DL CNN-related ensemble method was proposed using the DL technique. This study, 2,022 pneumonia cases were considered, whereas 5,863 normal chest X-ray images were collected from online resources and earlier publications. To improve the detection accuracy, both contrast enhancement and image normalization techniques were applied to produce high-quality images during the pre-processing stage itself. In the study conducted earlier [15], the authors mainly concentrated on the part of image processing or speech signals to detect the presence of Coronavirus Disease (COVID-19).
The current research article devises a Chaotic Flower Pollination Algorithm with a Deep Learning Driven Fusion (CFPA-DLDF) approach for detecting and classifying Coronavirus Disease (COVID-19). The presented CFPA-DLDF model is developed by integrating two DL models to identify the Coronavirus Disease (COVID-19) from the medical images. Initially, the proposed CFPA-DLDF technique employs the Gabor Filtering (GF) approach to pre-process the input images. In addition, a weighted voting-based ensemble model is employed for feature extraction in which both VGG-19 and MixNet models are included. Finally, the CFPA with Recurrent Neural Network (RNN) model is utilized for classification, which shows the novelty of the work. To demonstrate the enhanced performance of the proposed CFPA-DLDF model, a comparative study was conducted, and the results were discussed under different measures.
The rest of the paper is organized as follows. Section 2 discusses the proposed model, Section 3 details the performance validation of the model and Section 4 draws the conclusion for the study.
In the current study, a novel CFPA-DLDF technique has been developed for detection and the classification of Coronavirus Disease (COVID-19). The presented CFPA-DLDF model is developed by integrating two DL models to recognize the Coronavirus Disease (COVID-19) from the medical images. Initially, the proposed CFPA-DLDF technique exploits the GF approach to pre-process the input images. In addition, a weighted voting-based ensemble model is employed for feature extraction in which both VGG-19 and MixNet models are included. Finally, the CFPA model is utilized with the RNN model for classification, which shows the novelty of the work. Fig. 1 shows the block diagram of the CFPA-DLDF approach.
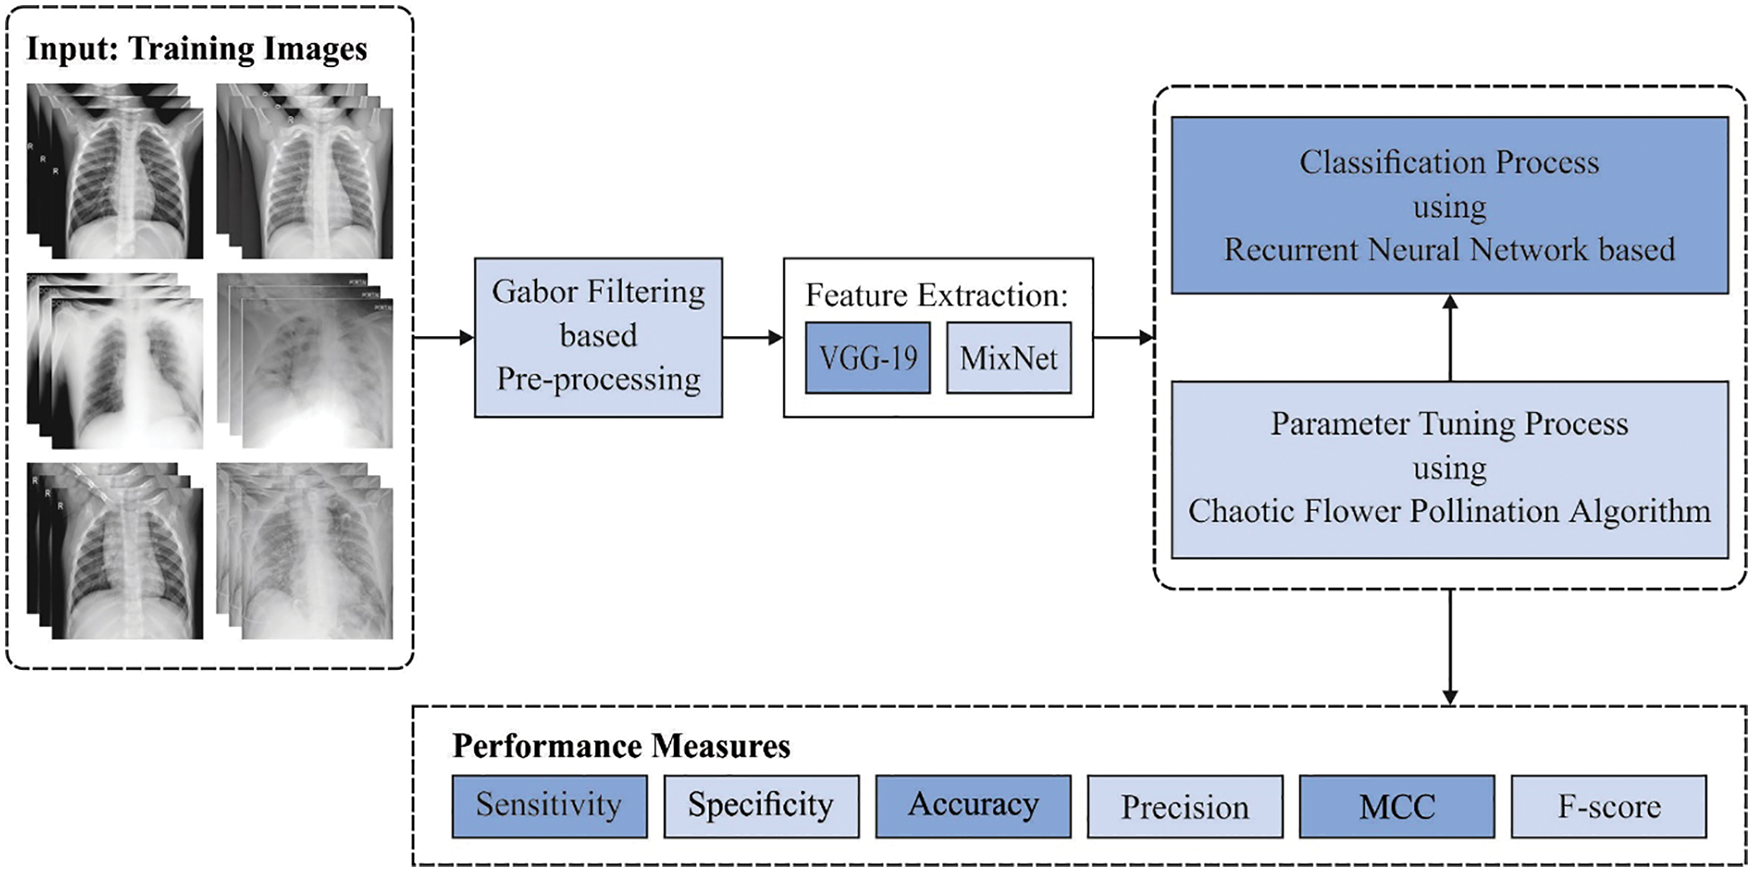
Figure 1: Block diagram of the CFPA-DLDF approach
Initially, the CFPA-DLDF technique exploits the GF approach to pre-process the input image. GF, a bandpass filter, is a successful technique commonly applied in machine vision and image processing applications [16]. A two-dimensional GF is a complex sinusoidal grating that is modulated with the help of two-dimensional Gaussian envelope. The two dimensional coordinates are
Here,
At this point,
2.2 Fusion Based Feature Extraction
A weighted voting-based ensemble model is employed for feature extraction in which both VGG-19 and MixNet models are improved. In this weighted voting-based ensemble mechanism, a DL model is incorporated, and the maximal outcome is selected through weighted-voting mechanism. The voting method is trained by each vector, after which a ten-fold cross validation accuracy is estimated with the help of a Fitness Function (FF). Assuming that n number of classes and D base classification models are fixed for voting, the prediction class
In Eq. (5),
CNN is the most commonly-used deep neural network technique in evaluating visual images. It is composed of neurons with learned biases and weights. Furthermore, it also contains hidden output and input layers. In a feedforward neural network, the middle layer is named as the hidden layer, whereas in the CNN method, the hidden layer is used for the implementation of the convolution layer. The CNN method has two primary models, as briefed herewith.
• Feature extraction or hidden layer: The network performs a sequence of pooling and convolution processes when a feature is identified.
• Classification: The full connection layer serves as a classification layer on top of the extracted feature by allocating a likelihood for the predicted objects.
VGG remains a novel component in CNN method after AlexNet [17]. VGG was originally conceived and developed in the name of ‘Visual Geometry Group’ at Oxford. The major involvement of VGG is to demonstrate that localisation or classification performance gets enhanced by increasing the depth of the CNN technique instead of utilizing it only in small receptive fields. VGG19 is a CNN method and has a total of 19 layers as briefed herewith.
• It has a fixed input size of 224 * 224. For an RGB image, the input can be transformed to 224 * 224 * 3. Here, two 224 values denote the height and the weight, respectively, whereas ‘3’ corresponds to the RGB channel.
• A kernel of 3 * 3 using a stride size of 1 pixel.
• A max pooling of 2 * 2-pixel window using a stride of 2.
• A Rectified Linear Unit (ReLU) for nonlinearity operation (the preceding modes utilize sigmoid or tanh).
• It has a tree FC layer in which the two initial layers have a size of 4096, whereas the final layer has 1,000 channels that are class-counted in ImageNet datasets.
• The layer comprises a Softmax function.
CNN model, developed on the basis of traditional convolution operation, is challenging to apply in real-time scenarios. This is attributed to the presence of numerous parameters in it with complex calculations. A sequence of lightweight convolution operators is presented to increase the accuracy of the model. Depthwise separable convolutional layer is the commonly-applied lightweight convolution operator [18]. It can be divided into pointwise- and depthwise-convolutions. Initially, it convolutes a single channel at a time using a convolution kernel sized at 3. Next, it makes use of a feature map with 1 × 1 convolution kernel. Given that N
The parameters, included in a depth-wise separable convolution operation, are shown below.
The computation, included in the traditional convolution operation, is given herewith.
The computation, included in a depth-wise separable convolution operation, is described herewith.
The ratio of the two operations is given below.
A depth-wise separable convolution employs a comparable size of 3 × 3 convolution kernels in the computation model; but, a network with large convolution kernels such as 5 × 5 or 7 × 7 confirms that a large convolution kernel enhances both accuracy as well as efficiency of the module. But the experiment demonstrates that it is rare to achieve a large and a better convolution kernel; at the same time, a large convolution kernel can reduce the accuracy of the model. Now, the MDConv splits the input channel sized M into C groups. Then, it convolves each and every group with kernels of dissimilar sizes. The depth-wise separable convolutions split the M-sized input channel into M groups after which the convolution calculation is performed for every group with a comparable kernel size.
2.3 RNN-Based Image Classification
In this study, the RNN technique is utilized for the purpose of classification [19]. A basic RNN structure, as given in Fig. 2, has a hidden layer, an output layer and an input layer. Assume a sequential sample of length,
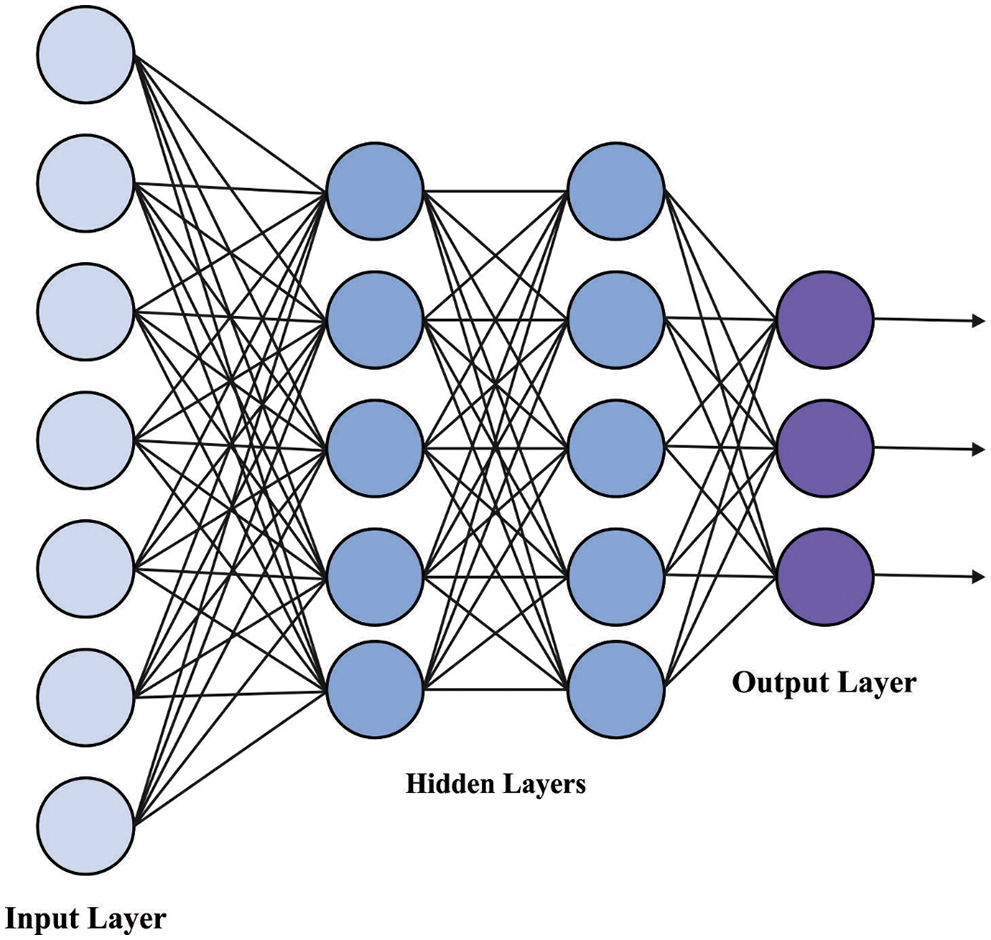
Figure 2: Framework of the RNN model
Here,
2.4 CFPA Based Hyperparameter Tuning
The CFPA model is used to fine-tune the hyperparameters [20–24] involved in the RNN model. It is a modified metaheuristic approach that was improved by adapting a major concept from FPA. The FPA model was initially developed as a simulation of natural processes [25]. The CFPA model has two major evolutionary phases namely, local and global pollination. Unlike the former approach, i.e., the novel FPA which uses the data of the finest individual from the existing generation, the presented algorithm considers the information of the entire population. The global pollination is mathematically expressed as given herewith.
In Eq. (14), the
In this equation, the standard gamma function is represented by
In the equations given above,
At the time of global pollination, the CFPA approach applies the dataset of the existing population. Here,
In Eq. (20),
The aim of this amendment is to increase the global search process that is crucial for localizing the situation of the optimum solution. It minimizes the possibility of the ‘bad’ outcomes that are produced by randomly-initialized poor solutions and broadens the search scale of the proposed algorithm. Having been exaggerated by flower constancy and local pollination, the updated individual process is given below.
In Eq. (23)
The presented model was experimentally validated using a dataset with 6,448 samples under two classes namely, COVID and healthy and the dataset details are shown in Table 1.

Fig. 3 portrays the confusion matrices generated by the proposed CFPA-DLDF model with distinct training (TR) and testing (TS) datasets. On 70% of TR data, the proposed CFPA-DLDF model categorized 2,203 samples under COVID class and 2,255 samples under healthy class. Also, on 30% of TS data, the CFPA-DLDF approach classified 955 samples under COVID class and 952 samples under healthy class. In addition, on 20% of TS data, the presented CFPA-DLDF system recognized 651 samples under COVID class and 628 samples under healthy class respectively.
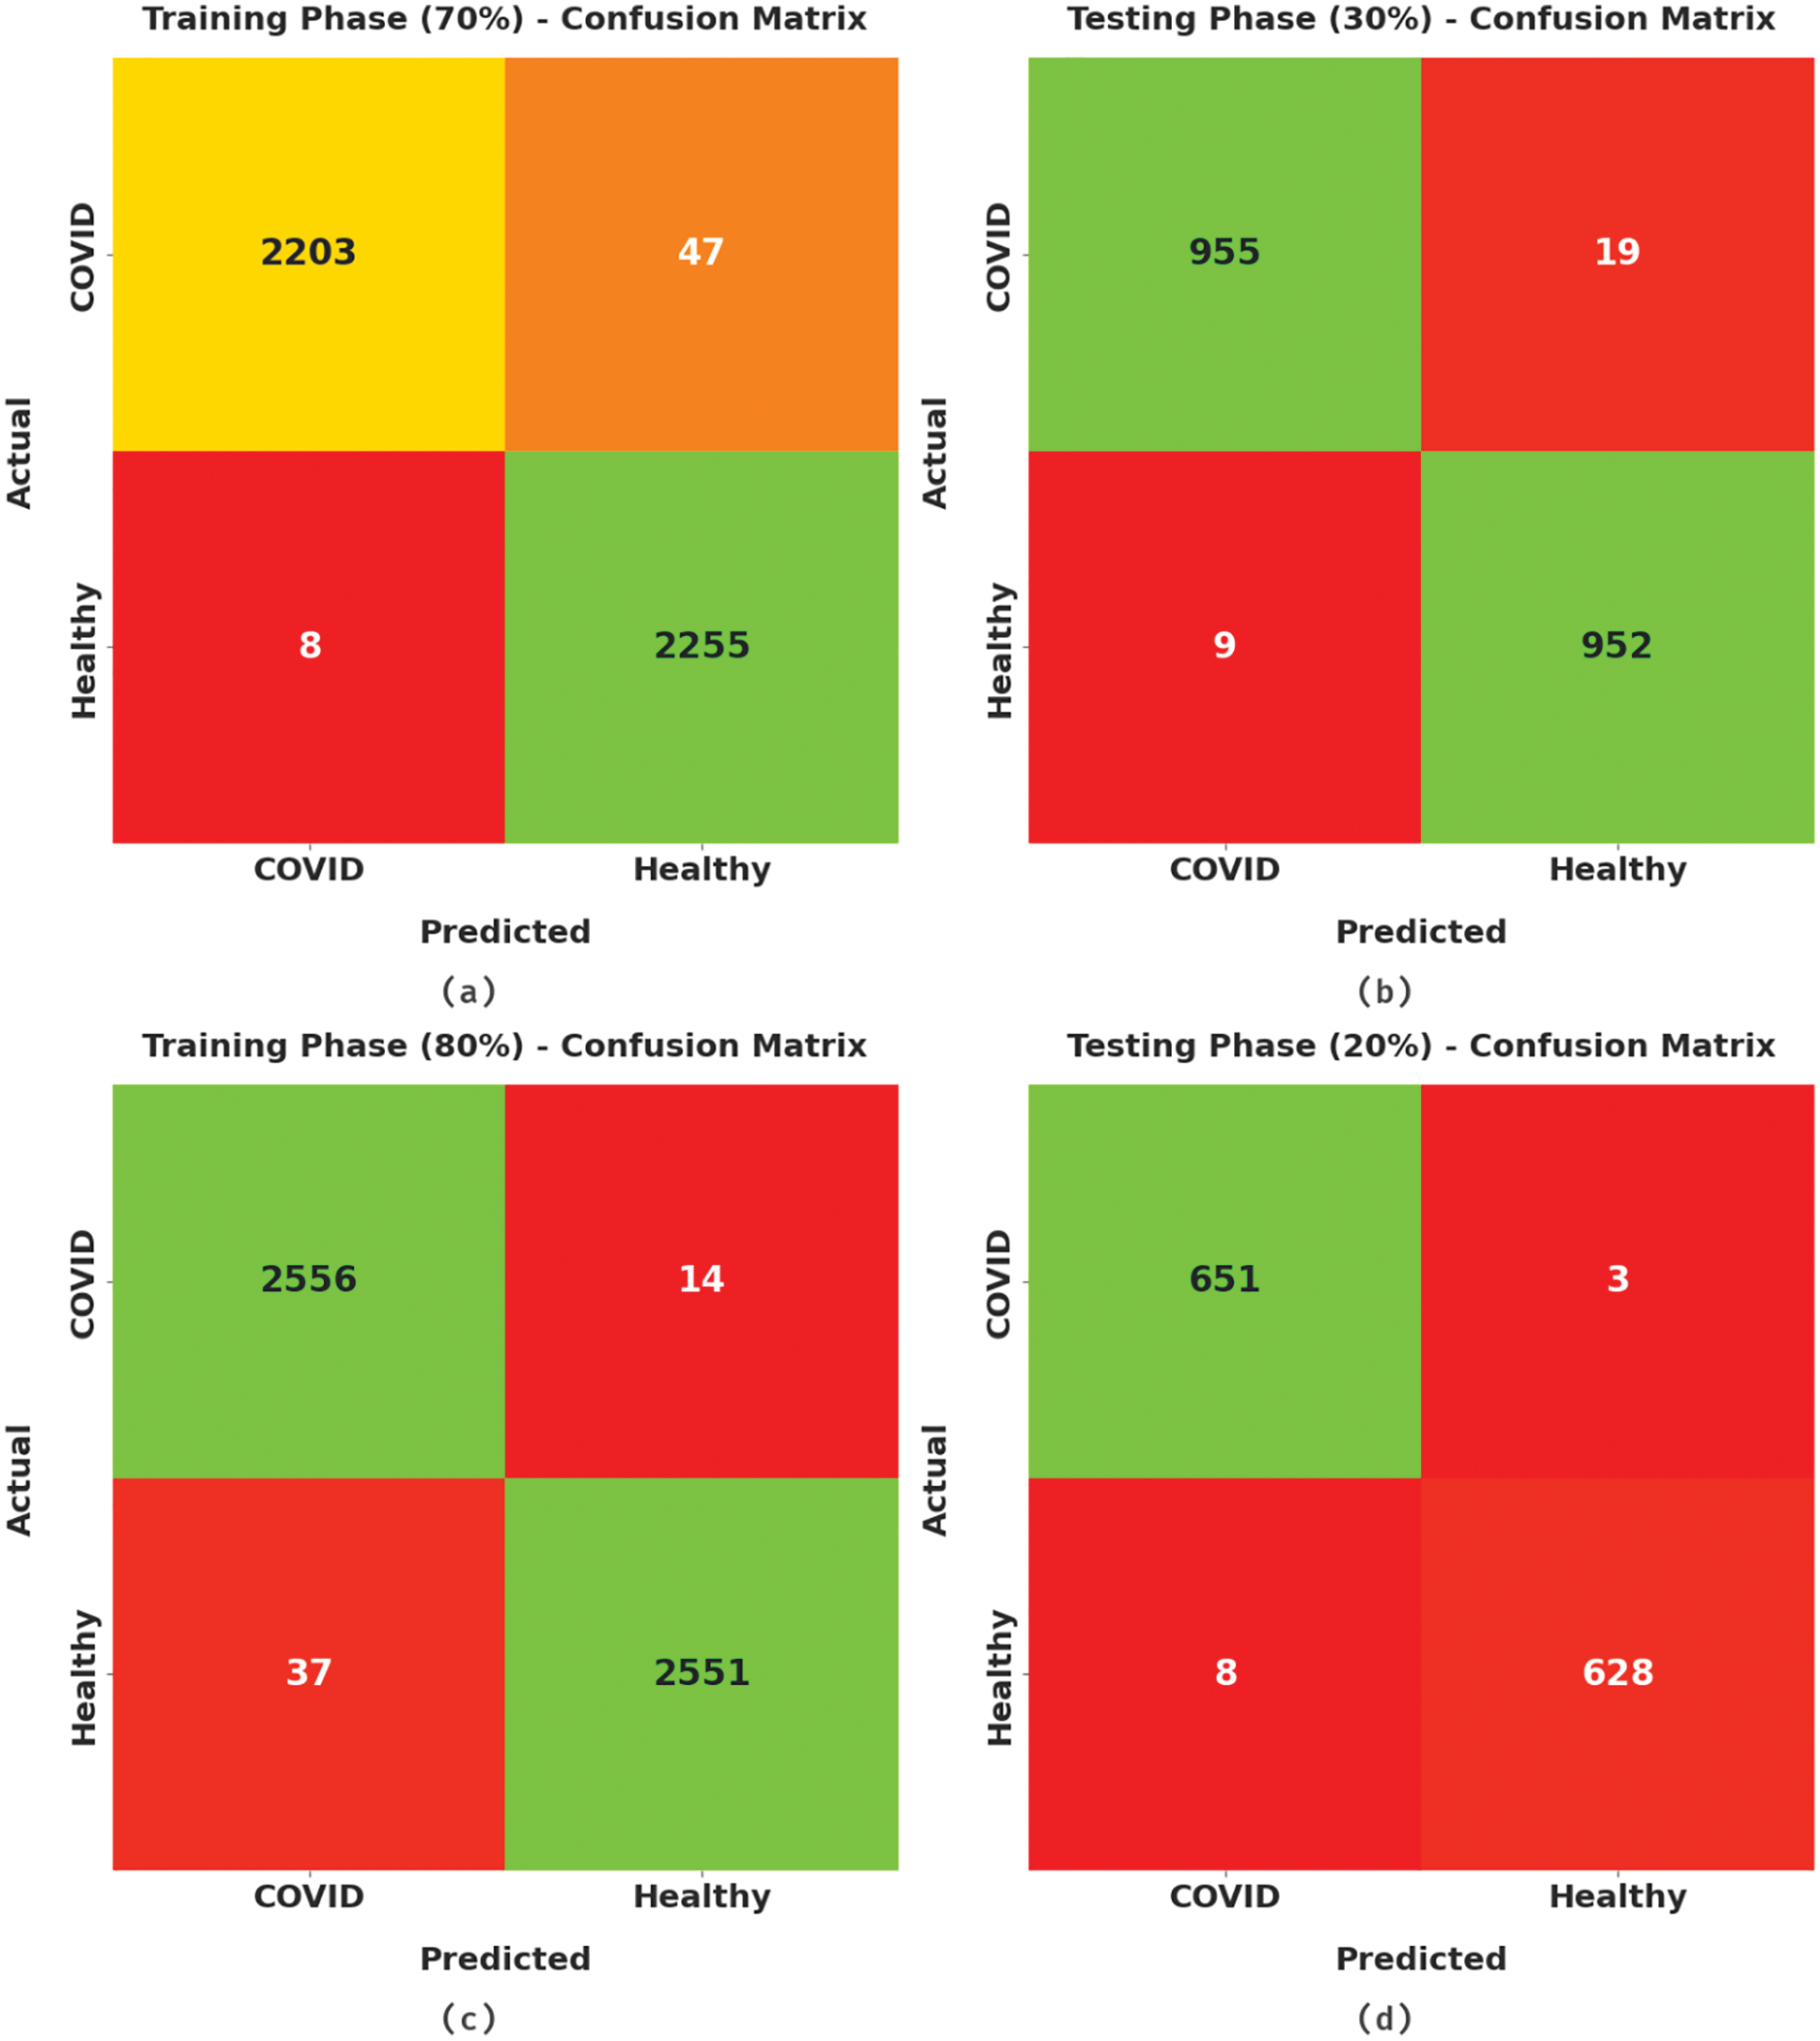
Figure 3: Confusion matrices of CFPA-DLDF approach (a) 70% of TR data, (b) 30% of TS data, (c) 80% of TR data, and (d) 20% of TS data
Table 2 and Fig. 4 provide a detailed overview on the classification outcomes achieved by the CFPA-DLDF model using 70% TR data and 30% TS data. The results imply that the proposed CFPA-DLDF model achieved improved outcomes. For instance, with 70% of TR data, the proposed CFPA-DLDF model reached an average
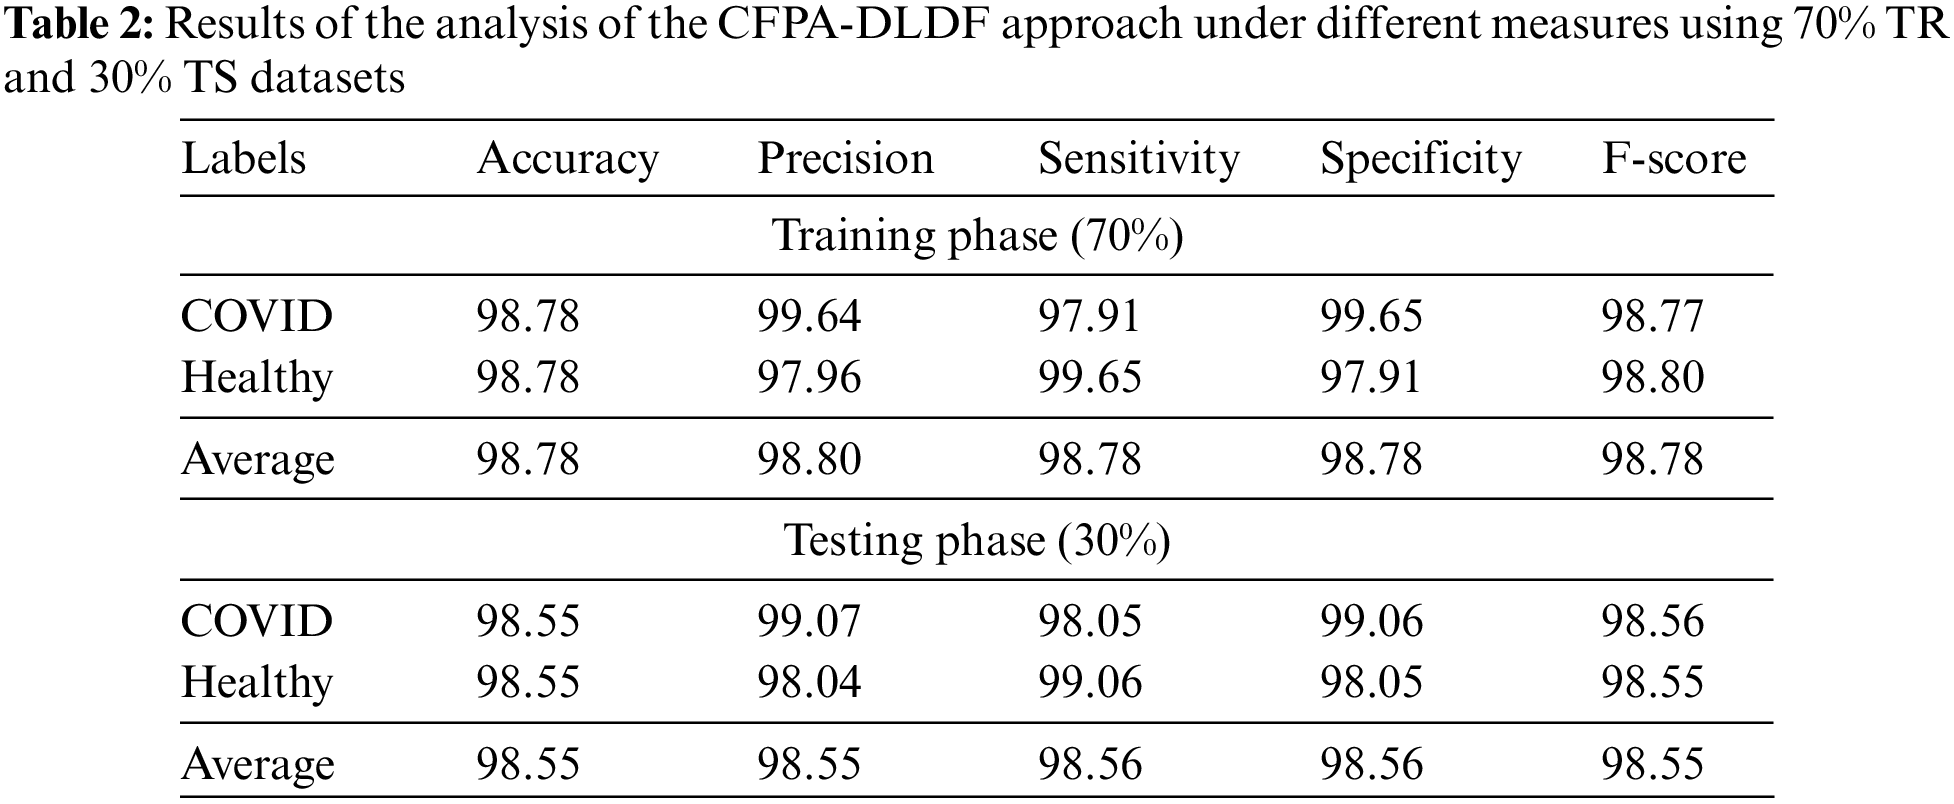
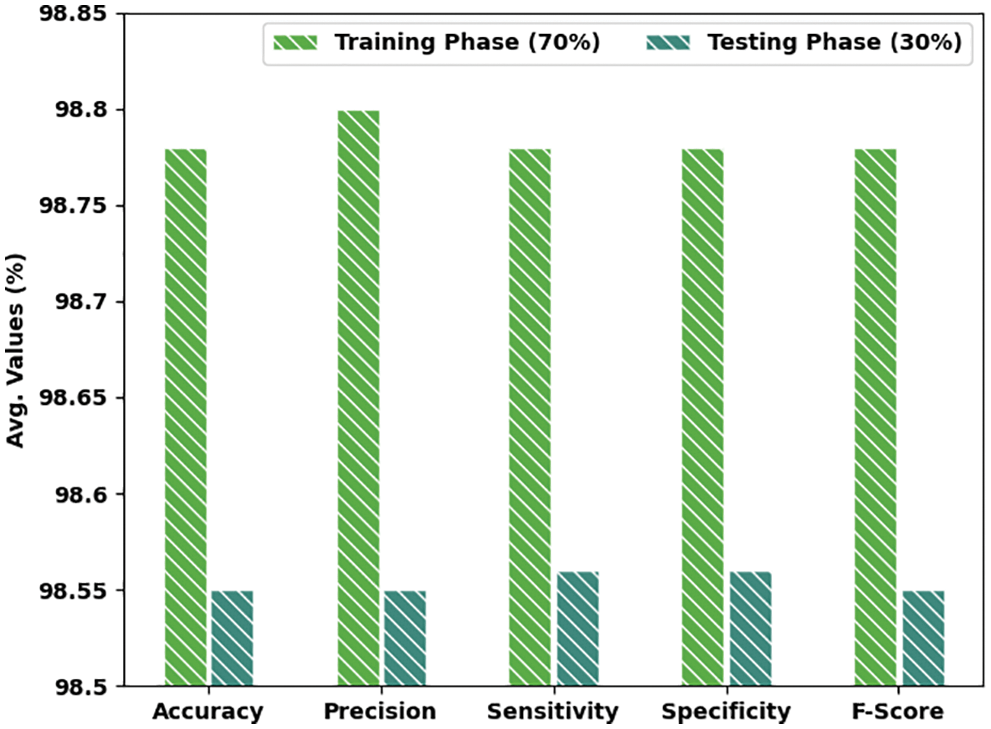
Figure 4: Average analysis results of the CFPA-DLDF approach under 70% TR and 30% TS datasets
Table 3 and Fig. 5 present a brief overview on the classification outcomes accomplished by the proposed CFPA-DLDF method on 80% TR data and 20% TS datasets. The results infer that the presented CFPA-DLDF technique achieved enhanced results. For example, with 80% TR data, the CFPA-DLDF approach achieved an average

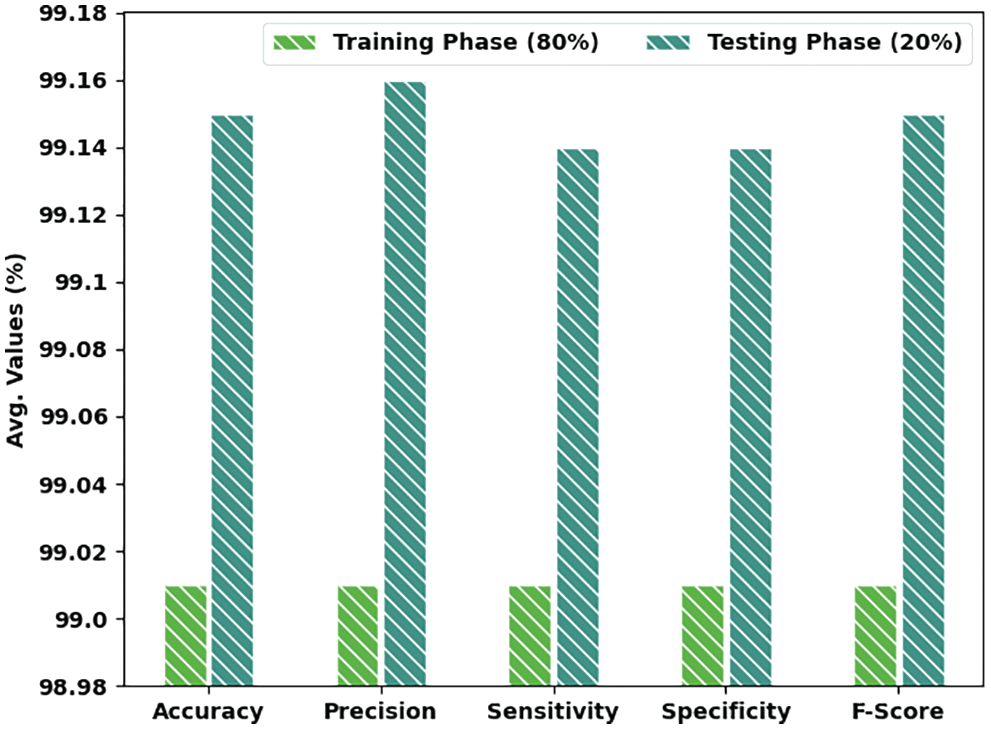
Figure 5: Average analysis results of the CFPA-DLDF approach under 80% TR and 20% TS datasets
Both Training Accuracy (TA) and Validation Accuracy (VA) values, acquired by the proposed CFPA-DLDF approach on test dataset, are illustrated in Fig. 6. The experimental outcomes infer that the proposed CFPA-DLDF method reached the maximum TA and VA values whereas VA values were higher than the TA values.
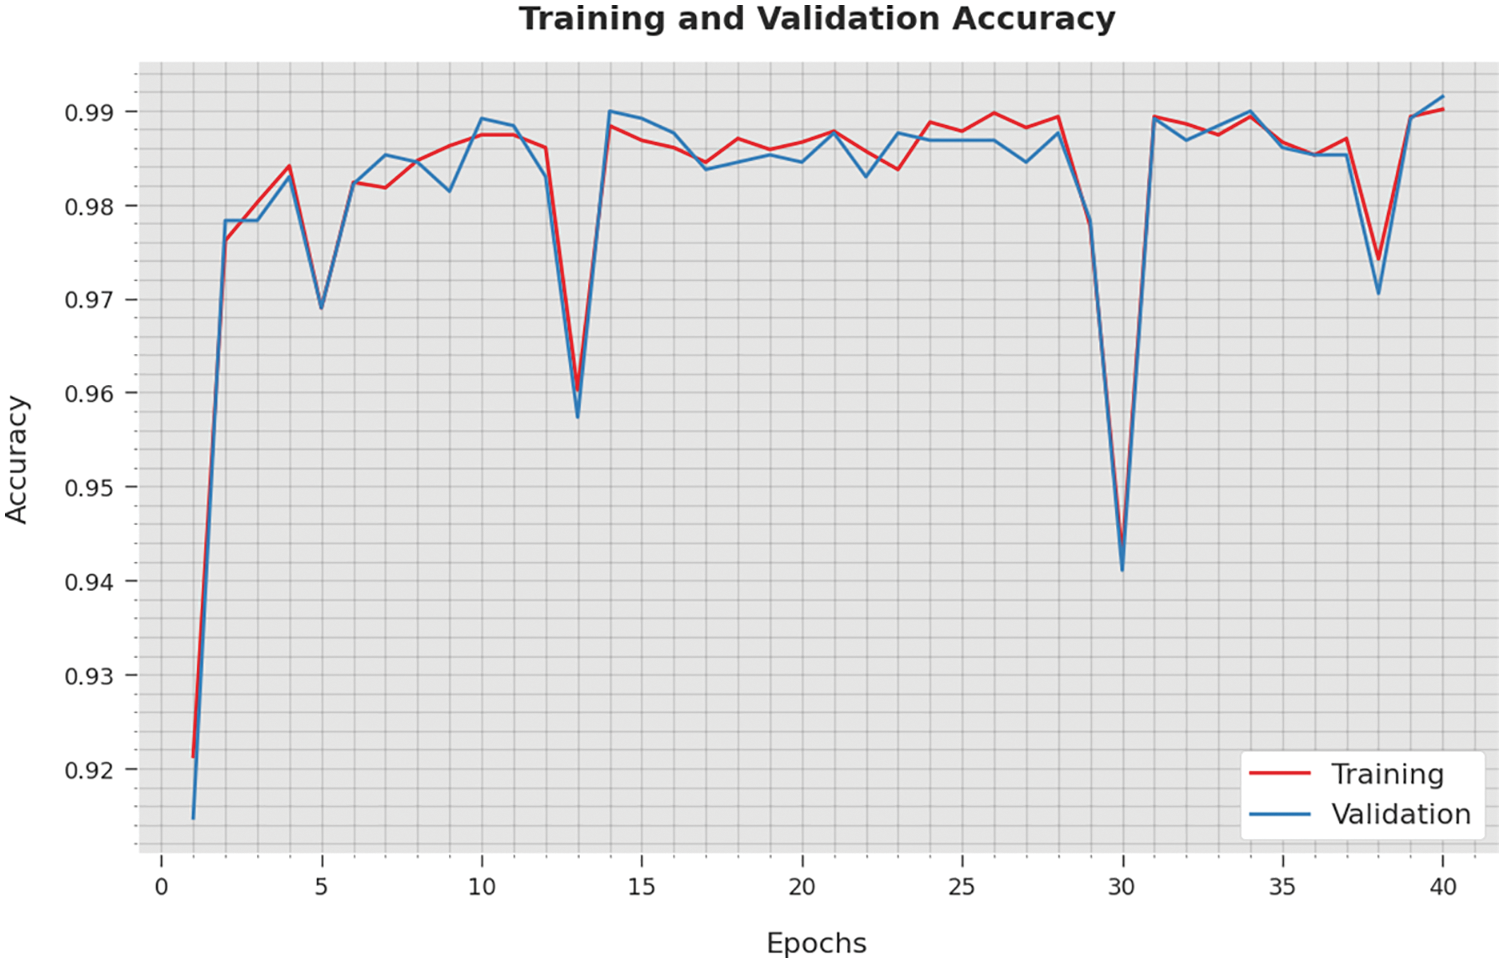
Figure 6: TA and VA analyses results of the CFPA-DLDF method
Both Training Loss (TL) and Validation Loss (VL) values, attained by the proposed CFPA-DLDF method on test dataset, are showcased in Fig. 7. The experimental outcomes infer that the proposed CFPA-DLDF algorithm achieved the minimal TL and VL values whereas VL values were lower than the TL values.
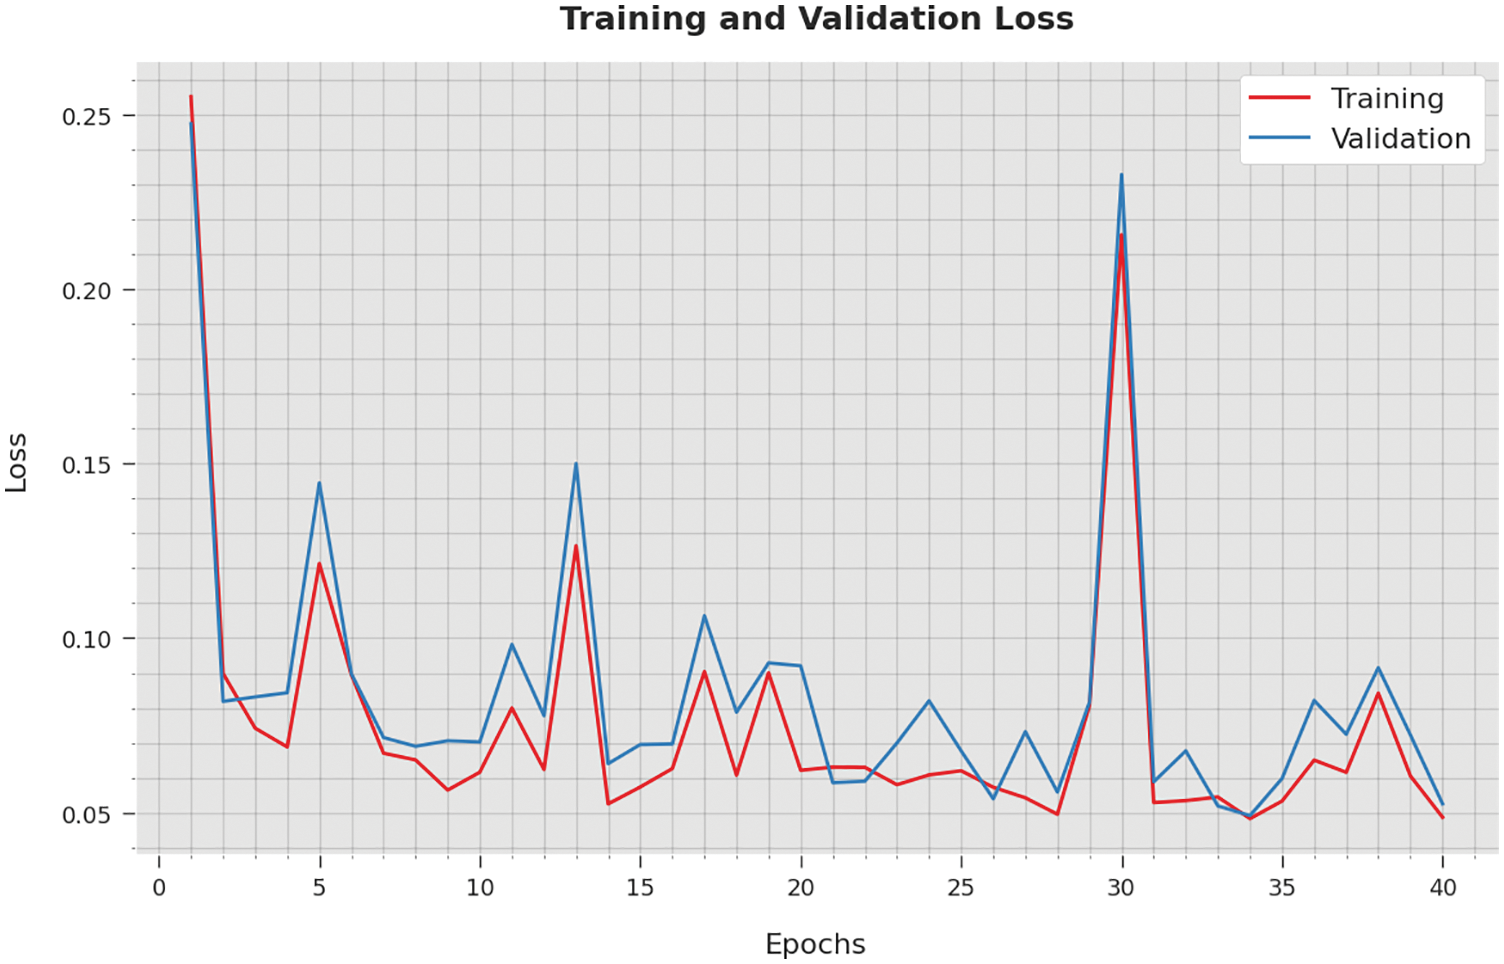
Figure 7: TL and VL analyses results of the CFPA-DLDF method
A clear precision-recall analysis was conducted upon the CFPA-DLDF technique using the test dataset and the results are displayed in Fig. 8. The figure infers that the proposed CFPA-DLDF algorithm achieved enhanced precision-recall values under all the classes.
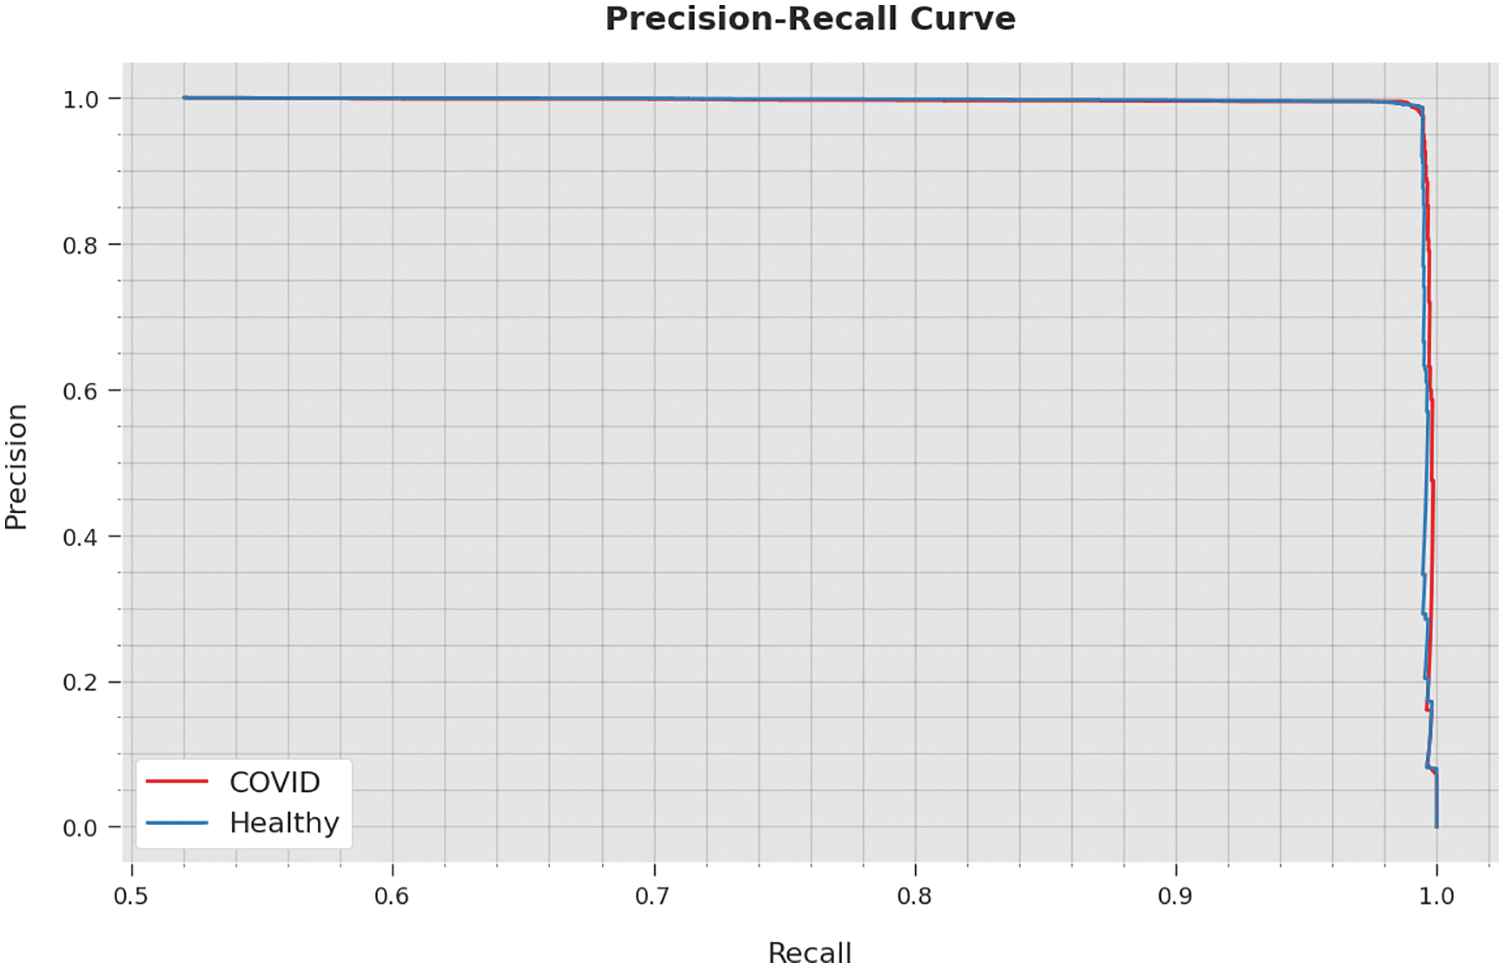
Figure 8: Precision-recall curve analysis results of the CFPA-DLDF method
A brief Receiver Operating Characteristic (ROC) scrutiny analysis was conducted upon the CFPA-DLDF methodology using the test dataset and the results are illustrated in Fig. 9. The results indicate that the proposed CFPA-DLDF method exhibited its ability in categorized the dataset under distinct classes.
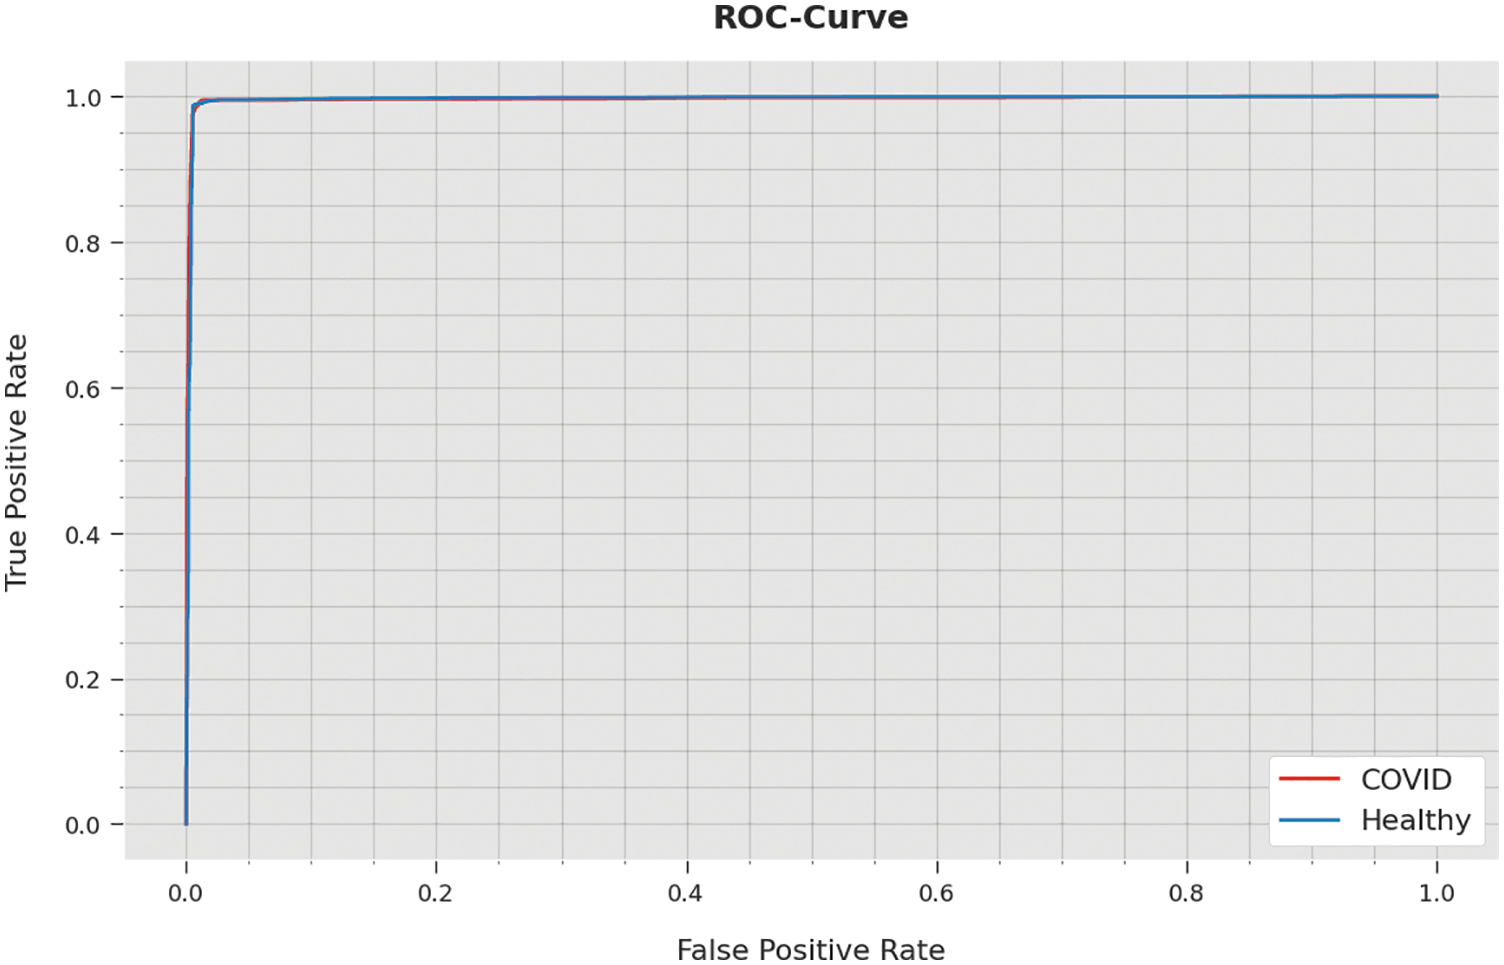
Figure 9: ROC curve analysis results of the CFPA-DLDF method
Table 4 demonstrates the overall comparative study results accomplished by the proposed CFPA-DLDF model and other recent models.
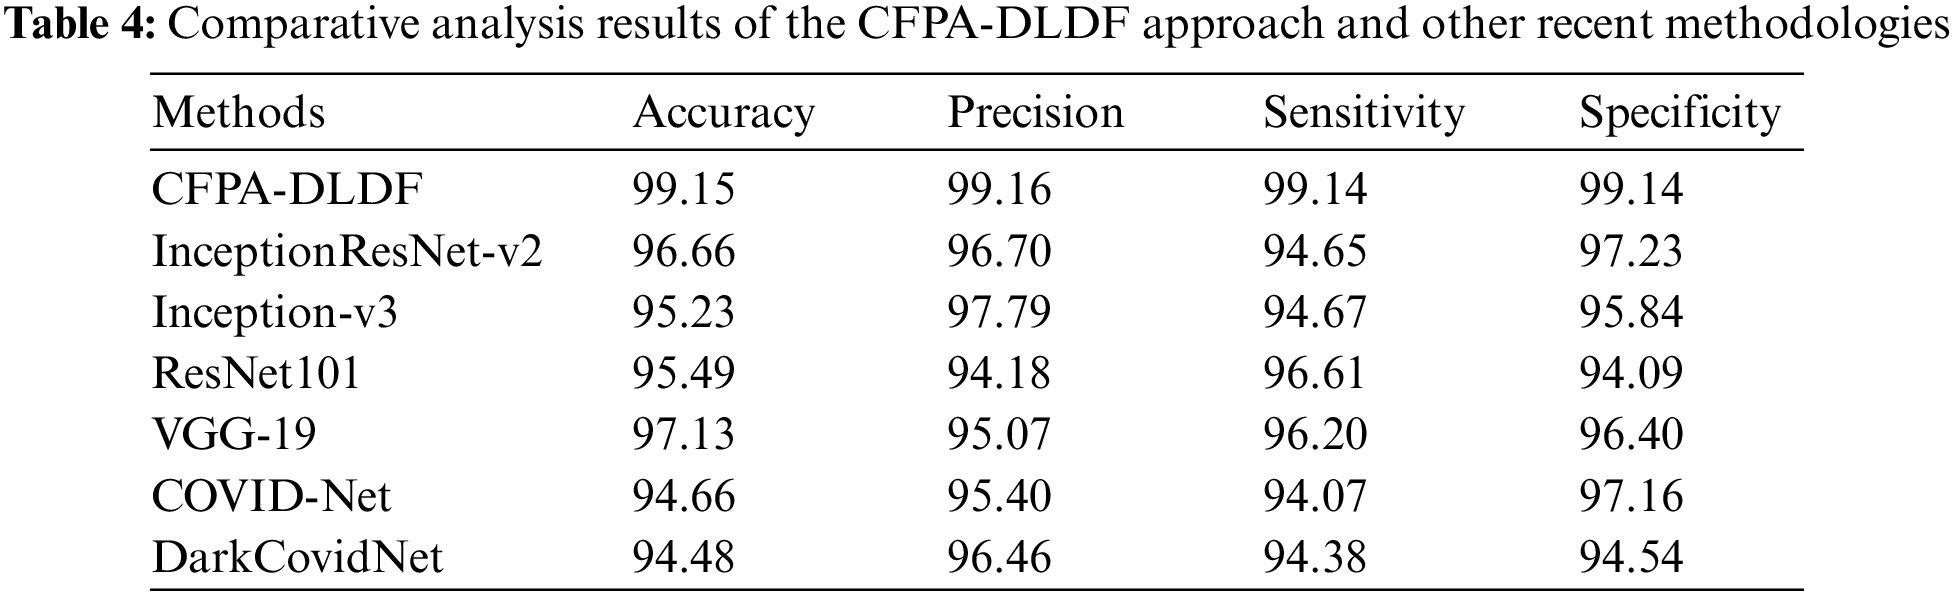
Fig. 10 demonstrates the comparison study results achieved by the proposed CFPA-DLDF model and other existing models in terms of
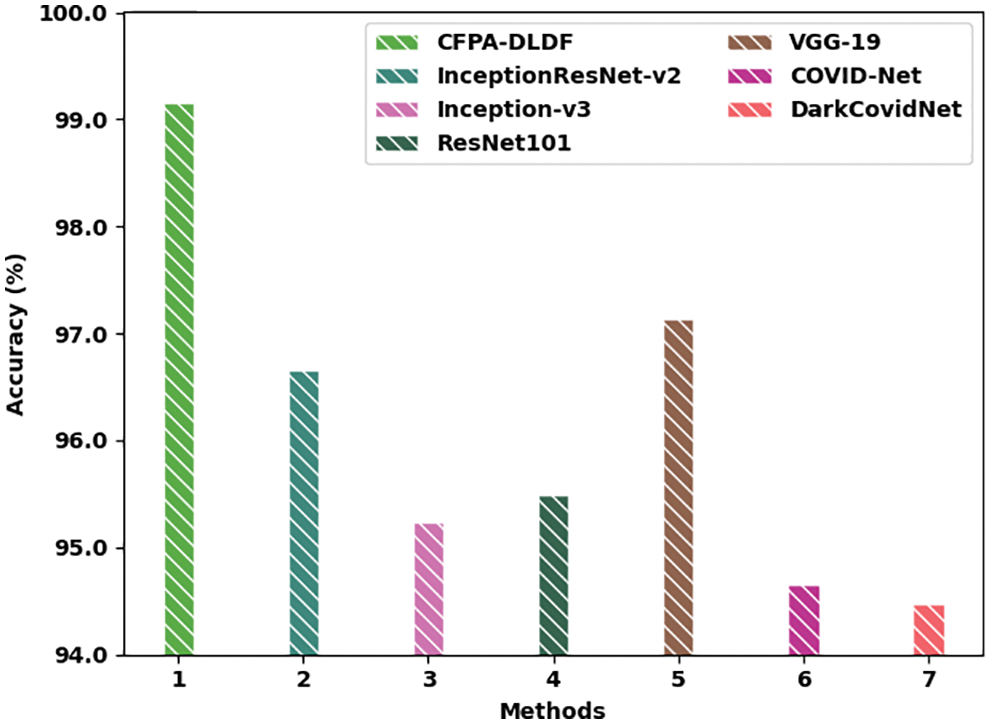
Figure 10:
Fig. 11 signifies the comparative analysis outcomes accomplished by the proposed CFPA-DLDF method and other existing models in terms of
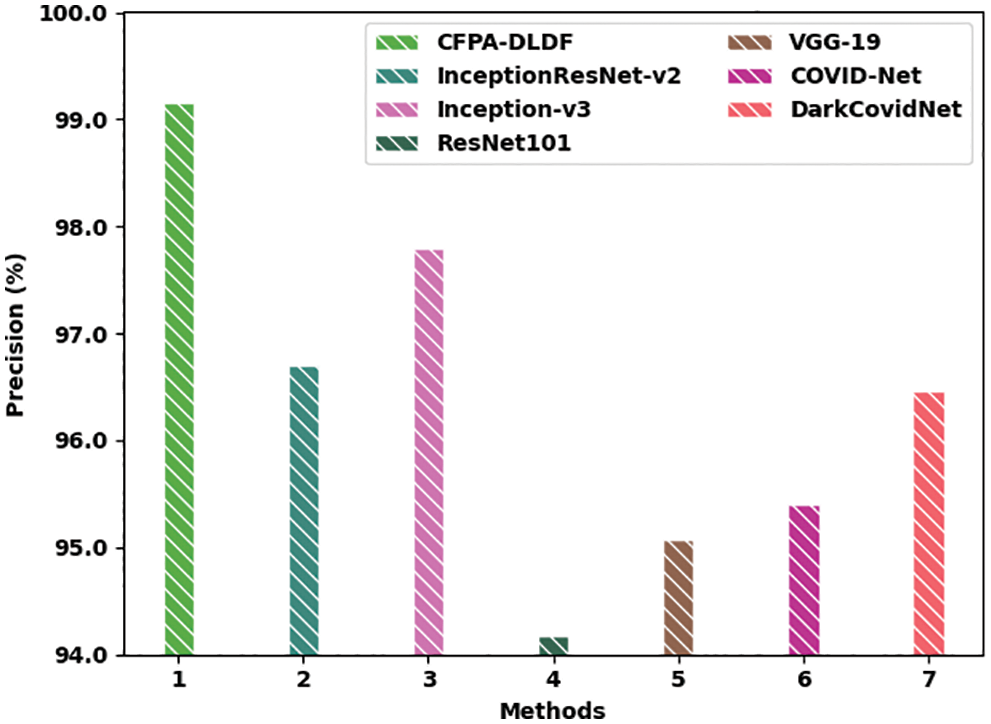
Figure 11:
Fig. 12 illustrates the detailed inspection outcomes of the proposed CFPA-DLDF technique and other existing models in terms of
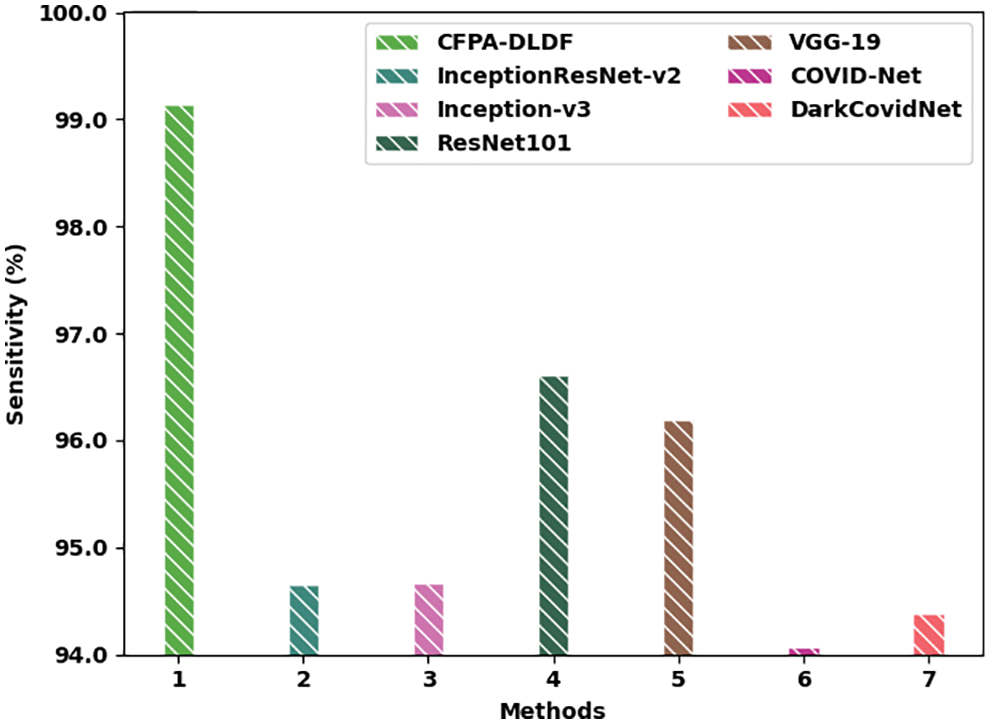
Figure 12:
Fig. 13 shows the results of the comparison analysis conducted between the proposed CFPA-DLDF method and other existing models in terms of
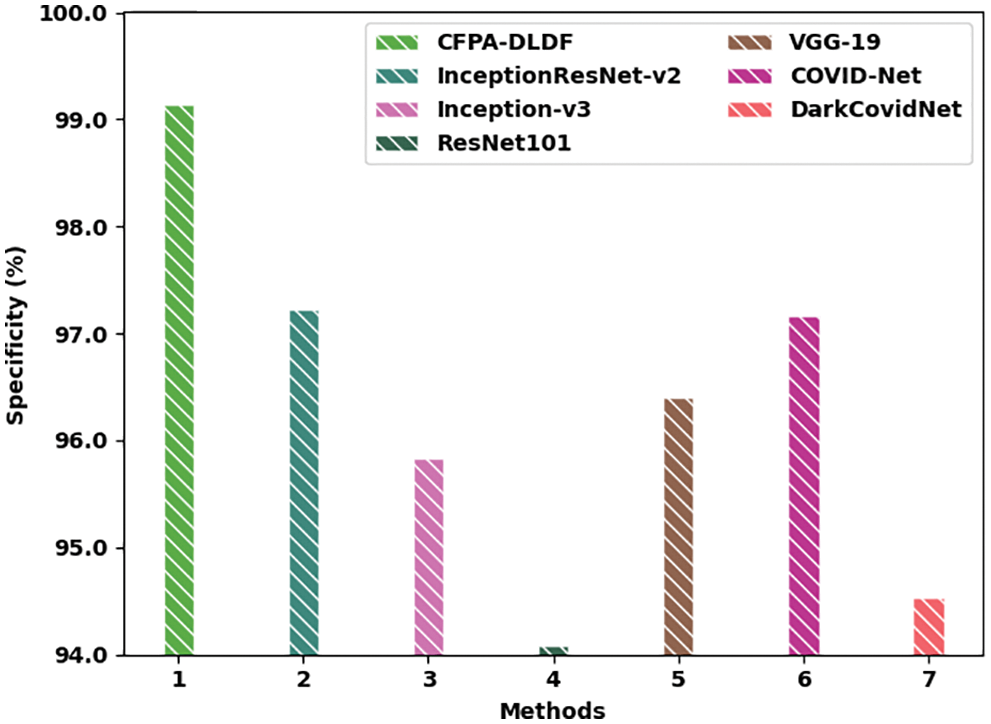
Figure 13:
In this work, a novel CFPA-DLDF technique has been developed for detection and the classification of the Coronavirus Disease (COVID-19). The presented CFPA-DLDF model is developed by integrating two DL models to recognize the Coronavirus Disease (COVID-19) from the medical images. Initially, the proposed CFPA-DLDF technique exploits the GF approach to pre-process the input image. In addition, a weighted voting-based ensemble model is deployed as a feature extractor in which both VGG-19 and MixNet models are included. Finally, the CFPA is utilized with RNN model for the purpose of classification, which shows the novelty of the work. To demonstrate the enhanced performance of the proposed CFPA-DLDF model, a comparative study was conducted and the results established the supremacy of the proposed CFPA-DLDF model over recent approaches. In the future, the performance of the CFPA-DLDF model can be improved with the help of contrast improvement approaches.
Funding Statement: The authors received no specific funding for this study.
Conflicts of Interest: The authors declare that they have no conflicts of interest to report regarding the present study.
References
1. G. Jain, D. Mittal, D. Thakur and M. K. Mittal, “A deep learning approach to detect COVID-19 coronavirus with X-ray images,” Biocybernetics and Biomedical Engineering, vol. 40, no. 4, pp. 1391–1405, 2020. [Google Scholar]
2. A. Rehman, T. Saba, U. Tariq and N. Ayesha, “Deep learning-based COVID-19 detection using CT and x-ray images: Current analytics and comparisons,” IT Professional, vol. 23, no. 3, pp. 63–68, 2021. [Google Scholar]
3. D. Brinati, A. Campagner, D. Ferrari, M. Locatelli, G. Banfi et al., “Detection of COVID-19 infection from routine blood exams with machine learning: A feasibility study,” Journal of Medical Systems, vol. 44, no. 8, pp. 135, 2020. [Google Scholar]
4. A. Rehman, M. A. Iqbal, H. Xing and I. Ahmed, “COVID-19 detection empowered with machine learning and deep learning techniques: A systematic review,” Applied Sciences, vol. 11, no. 8, pp. 3414, 2021. [Google Scholar]
5. M. Roberts, D. Driggs, M. Thorpe, J. Gilbey, M. Yeung et al., “Common pitfalls and recommendations for using machine learning to detect and prognosticate for COVID-19 using chest radiographs and CT scans,” Nature Machine Intelligence, vol. 3, no. 3, pp. 199–217, 2021. [Google Scholar]
6. F. Saiz and I. Barandiaran, “COVID-19 detection in chest x-ray images using a deep learning approach,” International Journal of Interactive Multimedia and Artificial Intelligence, vol. 6, no. 2, pp. 1–4, 2020. [Google Scholar]
7. M. A. Salam, S. Taha and M. Ramadan, “COVID-19 detection using federated machine learning,” PLoS One, vol. 16, no. 6, pp. e0252573, 2021. [Google Scholar]
8. S. Akter, F. M. J. M. Shamrat, S. Chakraborty, A. Karim and S. Azam, “COVID-19 detection using deep learning algorithm on chest x-ray images,” Biology, vol. 10, no. 11, pp. 1174, 2021. [Google Scholar]
9. T. Zebin and S. Rezvy, “COVID-19 detection and disease progression visualization: Deep learning on chest X-rays for classification and coarse localization,” Applied Intelligence, vol. 51, no. 2, pp. 1010–1021, 2021. [Google Scholar]
10. J. I. Z. Chen, “Design of accurate classification of COVID-19 disease in x-ray images using deep learning approach,” Journal of ISMAC, vol. 2, no. 2, pp. 132–148, 2021. [Google Scholar]
11. R. Kumar, A. A. Khan, J. Kumar, N. A. Golilarz, S. Zhang et al., “Blockchain-federated-learning and deep learning models for COVID-19 detection using CT imaging,” IEEE Sensors Journal, vol. 21, no. 14, pp. 16301–16314, 2021. [Google Scholar]
12. H. Swapnarekha, H. S. Behera, D. Roy, S. Das and J. Nayak, “Competitive deep learning methods for COVID-19 detection using x-ray images,” Journal of the Institution of Engineers (IndiaSeries B, vol. 102, no. 6, pp. 1177–1190, 2021. [Google Scholar]
13. S. Vaid, R. Kalantar and M. Bhandari, “Deep learning COVID-19 detection bias: Accuracy through artificial intelligence,” International Orthopaedics (SICOT), vol. 44, no. 8, pp. 1539–1542, 2020. [Google Scholar]
14. P. Bhardwaj and A. Kaur, “A novel and efficient deep learning approach for COVID -19 detection using X-ray imaging modality,” International Journal of Imaging Systems and Technology, vol. 31, no. 4, pp. 1775–1791, 2021. [Google Scholar]
15. A. B. Nassif, I. Shahin, M. Bader, A. Hassan and N. Werghi, “COVID-19 detection systems using deep-learning algorithms based on speech and image data,” Mathematics, vol. 10, no. 4, pp. 564, 2022. [Google Scholar]
16. P. Malaca, L. F. Rocha, D. Gomes, J. Silva and G. Veiga, “Online inspection system based on machine learning techniques: Real case study of fabric textures classification for the automotive industry,” Journal of Intelligent Manufacturing, vol. 30, no. 1, pp. 351–361, 2019. [Google Scholar]
17. A. R. Khan, S. Khan, M. Harouni, R. Abbasi, S. Iqbal et al., “Brain tumor segmentation using K-means clustering and deep learning with synthetic data augmentation for classification,” Microscopy Research and Technique, vol. 84, no. 7, pp. 1389–1399, 2021. [Google Scholar]
18. E. Amrutha, S. Arivazhagan and W. S. L. Jebarani, “MixNet: A robust mixture of convolutional neural networks as feature extractors to detect stego images created by content-adaptive steganography,” Neural Processing Letters, vol. 54, no. 2, pp. 853–870, 2022. [Google Scholar]
19. M. A. Khan, “HCRNNIDS: Hybrid convolutional recurrent neural network-based network intrusion detection system,” Processes, vol. 9, no. 5, pp. 834, 2021. [Google Scholar]
20. K. Shankar, E. Perumal, M. Elhoseny, F. Taher, B. B. Gupta et al., “Synergic deep learning for smart health diagnosis of COVID-19 for connected living and smart cities,” ACM Transactions on Internet Technology, vol. 22, no. 3, pp. 16: 1–14, 2022. [Google Scholar]
21. K. Shankar, E. Perumal, V. G. Díaz, P. Tiwari, D. Gupta et al., “An optimal cascaded recurrent neural network for intelligent COVID-19 detection using chest X-ray images,” Applied Soft Computing, vol. 113, Part A, pp. 1–13, 2021. [Google Scholar]
22. M. Y. Sikkandar, B. A. Alrasheadi, N. B. Prakash, G. R. Hemalakshmi, A. Mohanarathinam et al., “Deep learning based an automated skin lesion segmentation and intelligent classification model,” Journal of Ambient Intelligence and Humanized Computing, vol. 12, no. 3, pp. 3245–55, 2021. [Google Scholar]
23. K. Shankar, E. Perumal, P. Tiwari, M. Shorfuzzaman and D. Gupta, “Deep learning and evolutionary intelligence with fusion-based feature extraction for detection of COVID-19 from chest X-ray images,” Multimedia Systems, 2021. https://doi.org/10.1007/s00530-021-00800-x. [Google Scholar]
24. K. Shankar, Y. Zhang, Y. Liu, L. Wu and C. H. Chen, “Hyperparameter tuning deep learning for diabetic retinopathy fundus image classification,” IEEE Access, vol. 8, pp. 118164–118173, 2020. [Google Scholar]
25. D. Potnuru, K. A. Mary and C. S. Babu, “Experimental implementation of flower pollination algorithm for speed controller of a BLDC motor,” Ain Shams Engineering Journal, vol. 10, no. 2, pp. 287–295, 2019. [Google Scholar]
Cite This Article
 Copyright © 2023 The Author(s). Published by Tech Science Press.
This work is licensed under a Creative Commons Attribution 4.0 International License , which permits unrestricted use, distribution, and reproduction in any medium, provided the original work is properly cited.
 Downloads
 Citation Tools