
 Submit a Paper
 Propose a Special lssue
 Open Access
ARTICLE

Detecting Tuberculosis from Vietnamese X-Ray Imaging Using Transfer Learning Approach
1 Institute of Information Technology–Vietnam Academy of Science and Technology, Hanoi, 10072, Vietnam
2 Lac Hong University, Bien Hoa, Dong Nai, 76120, Vietnam
3 Hanoi University of Industry, Hanoi, 11915, Vietnam
* Corresponding Author: Do Nang Toan. Email:
Computers, Materials & Continua 2023, 74(3), 5001-5016. https://doi.org/10.32604/cmc.2023.033429
Received 16 June 2022; Accepted 28 September 2022; Issue published 28 December 2022
 View Full Text
 Download PDF
Abstract
Deep learning created a sharp rise in the development of autonomous image recognition systems, especially in the case of the medical field. Among lung problems, tuberculosis, caused by a bacterium called Mycobacterium tuberculosis, is a dangerous disease because of its infection and damage. When an infected person coughs or sneezes, tiny droplets can bring pathogens to others through inhaling. Tuberculosis mainly damages the lungs, but it also affects any part of the body. Moreover, during the period of the COVID-19 (coronavirus disease 2019) pandemic, the access to tuberculosis diagnosis and treatment has become more difficult, so early and simple detection of tuberculosis has been more and more important. In our study, we focused on tuberculosis diagnosis by using the chest X-ray image, the essential input for the radiologist’s profession, and researched the effectiveness of the transfer learning approach in the case study of Vietnamese chest X-ray images. We proposed four strategies to clarify our hypothesis in different ways of applying transfer learning and different training set types. We also prepared a Vietnamese X-ray image dataset with the support of the VRPACS team to provide the basis for training and testing deep learning models. Our experiments were carried out by applying three different architectures, Alexnet, Resnet, and Densenet, on international, Vietnamese, and combined X-ray image datasets. After training, all models were verified on a pure Vietnamese X-rays set. The results show that transfer learning is suitable in the case study of Vietnamese chest X-ray images with high evaluating metrics in terms of AUC (Area under the Receiver Operating Characteristic Curve), sensitivity, specificity, and accuracy. In the best strategy, most of the scores were more than 0.93, and all AUCs were more than 0.98.Keywords
According to the World Health Organization Global tuberculosis report 2021 [1], although some remarkable achievements have been achieved in the fight against tuberculosis in recent years, tuberculosis still remains to be one of the major public health problems globally. The COVID-19 pandemic has impacted significantly progress in providing essential tuberculosis services and reducing the tuberculosis burden. On the one hand, the most obvious outcome is a huge global drop in the number of people diagnosed newly. The number decreased from 7.1 million in 2019 to 5.8 million in 2020, an 18% reduction back to the level of 2012. But on the other hand, the difficulty in access to tuberculosis diagnosis and treatment has brought a considerable rise in tuberculosis deaths. There are 1.3 million tuberculosis deaths among the HIV-negative community (HIV - human immunodeficiency virus), meaning a rise from 1.2 million in 2019, and there are also an additional 214,000 among HIV-positive people comparing 209,000 in 2019. According to World Health Organization data released on World Tuberculosis Day 2022 [2], there are more than 4100 people die from tuberculosis and nearly 30 000 people get tuberculosis disease every day. Depending on the condition of the disease as well as early or late detection, different tuberculosis treatment regimens can be applied [3], such as a 4-month Rifapentine-moxifloxacin tuberculosis Treatment Regimen, a 6- or 9-month RIPE tuberculosis Treatment Regimen. These impacts require strong actions to stop and reverse. One of them is the improvement in tuberculosis diagnosis and screening methods.
One type of imaging commonly used in the diagnosis of pulmonary tuberculosis is a chest radiograph. On chest X-ray images, lesions will have different distortions depending on the type of tuberculosis or the advanced stage of the disease. Chest X-ray data is rather sensitive, so it can be widely used to screen for pulmonary tuberculosis.
In Vietnam, the government has been some attempts to prevent and lead to removing tuberculosis. One of them is the Vietnam National Tuberculosis Control Program. In 2020, the United States Agency for International Development and the Vietnam National Tuberculosis Program [4] scaled-up deployment of the Double X strategy for tuberculosis identification, towards the goal of ending tuberculosis in 2030. In Double X, the chest X-ray image is the important indicator to diagnose tuberculosis, and Double X aims to chest X-rays and GeneXpert. In this paper, our proposed study also focuses on processing chest X-ray images.
There have been several research findings on tuberculosis diagnosis using traditional machine learning models, as described in Table. 1. In 2011, Erhan et al. [5] used traditional multilayer neural networks combined with genetic algorithms to diagnose tuberculosis with the patients’ epicrisis reports have been taken from Diyarbakir Chest Disease Hospital. Also in 2011, Dongardive et al. published the diagnosis of pulmonary tuberculosis with the Identification tree model using data from 250 patients from the T.B Hospital Group, Mumbai [6]. Data in Dongardive’s study were collected from five different medical examinations which are preliminary, blood, urine, sputum, and biochemistry. Another result is the work of Yahiaoui et al. [7] with the application of a support vector machine for samples of 38 attributes described in the patient discharge report. Group data of 50 patients and 100 healthy individuals were obtained from a hospital in the city of Diyarbakir, a city located in the south of Turkey.
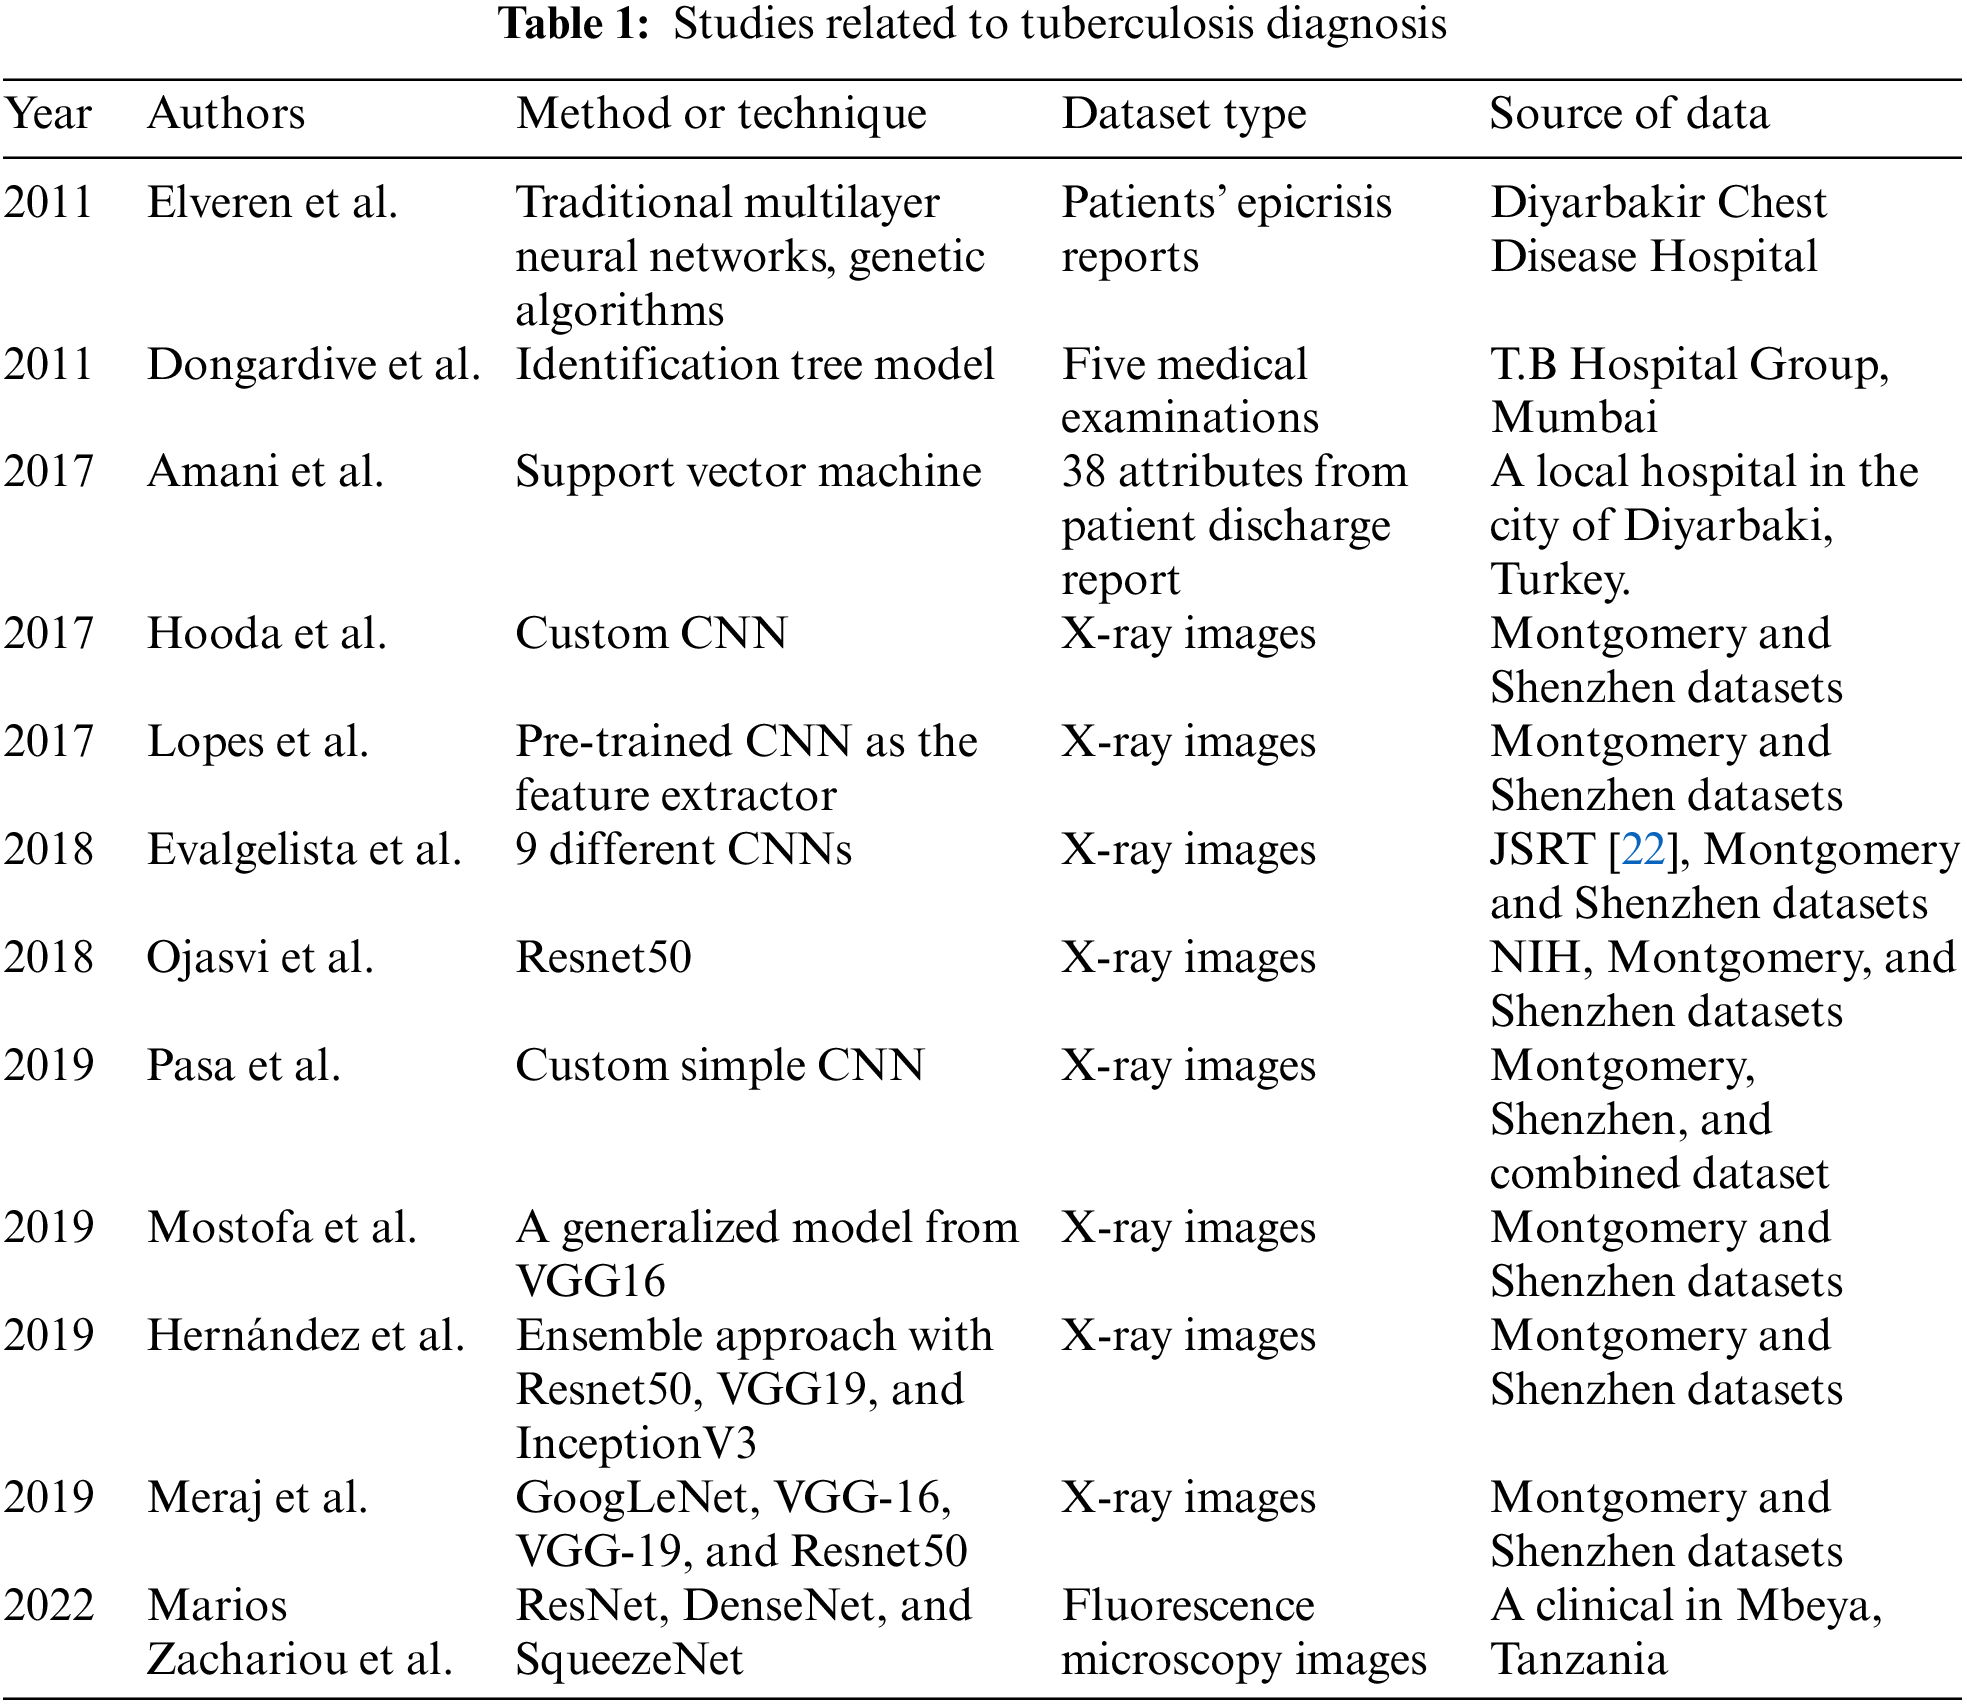
There were several studies using deep learning methods for monitoring tuberculosis, as described in Table. 1. In 2017, Hooda et al. [8] presented a convolution neural network (CNN) designed with 7 convolutional layers followed by 3 fully connected layers. This architecture experimented on Montgomery and Shenzhen datasets [9] and achieved 82.09% validation accuracy. Also in 2017, Lopes et al. [10] introduced three proposals for applying pre-trained CNN as the feature extractor. Similarly, results were produced by using Montgomery and Shenzhen datasets and gained a maximum accuracy rate of 0.847 and AUC of 0.926. In 2018, Evalgelista et al. [11] had a report about using 9 different architectures with public medical datasets and comprise real-world examples from patients. The highest performance in this experiment was 88.76%. Yadav et al. [12] used Resnet50 [13] to classify X-ray images of potential Tuberculosis patients and achieved a 94.89% accuracy. In their paper, the authors worked with the NIH (National Institutes of Health) dataset [14], Montgomery, and Shenzhen datasets. In 2019, Pasa et al. [15] dealt with this problem with a simple CNN having only about 230,000 parameters. The authors performed a 5-fold cross-validation study on each of three datasets (Montgomery, Shenzhen, and combined dataset) and reached 0.811, 0.9, and 0.925 in the AUC score. In the same year, Ahsan et al. [16] developed a generalized model which transferred learning from VGG16 [17], and also used Chest X-ray images from Montgomery and Shenzhen datasets. Their results achieved 80% accuracy without applying augmentation and 81.25% with having augmentation. Also in 2019, Hernández et al. [18] proposed a framework using an ensemble approach. By combining Resnet50 [13], VGG19 [17], and InceptionV3 [19], the best model was found with an overall accuracy of 85% and no false positives. Meraj et al. [20] also used four CNN models such as GoogLeNet [19], VGG-16, VGG-19, and Resnet50 in their study with Montgomery and Shenzhen datasets. In 2022, Zachariou et al. [21] introduced an automatic pipeline to rapidly detect Mycobacterium tuberculosis using sputum samples in fluorescence microscopy images. In short, deep learning technology has been used for analyzing mycobacterium tuberculosis disease in various studies, and it proved its role in different data set types, such as X-ray images, or fluorescence microscopy images.
Most deep learning methods require a large enough dataset, and this is clearly not a requirement that can be easily solved. In the context of our research, we need to find deep learning models that can classify X-ray images of Vietnamese people effectively to diagnose pulmonary tuberculosis. Medical data is often restricted by the privacy and security of hospitals, and even with access to hospital data, it is difficult to obtain a large enough amount of well-annotated data. To solve these problems, the paper chooses a transfer learning approach, which has made significant breakthroughs in many deep learning applications, especially the problem of diagnosing diseases from medical images [23,24].
Our study is put in the Vietnamese patient data context. This research provides a state-of-the-art solution to diagnose pulmonary tuberculosis in the Vietnamese X-Ray imaging dataset, which is collected from a Vietnamese local hospital with the help of VRPACS [25]. Then we design different strategies to build the autonomous classification system with different models using the transfer learning approach. Finally, we analyze the effect of each strategy on the Vietnamese imaging dataset and selection of the best model which is fit for our task. In detail, the major contributions of our paper are as follows:
1. We prepare a ready-to-use Vietnamese X-ray image dataset.
2. We design different transfer learning strategies for the training models.
3. We analyze the effect of each strategy on the Vietnamese imaging dataset to clarify the best solution.
The rest of the paper is discussed as follows: Section 2 provides the model background for the proposed system. Section 3 presents the methodology. Section 4 discusses the result and evaluation of the proposed study. Lastly, Section 5 concludes this study.
The proposed study requires some CNN models. In our experiments, we chose Alexnet, Resnet, and Densenet, which have been popular architectures and applied successfully in many studies.
In 2012, Alex et al proposed their network, which was the famous CNN architecture that completed the Image Net Large Scale Visual Recognition Challenge 2012 [26] with excellent results. In detail, this network achieved a top-5 error of 15.3% and was far ahead of the group runner-up, which achieved 26.2%. From that, Alexnet became popular in the image recognition field. The design of Alexnet is described in Fig. 1. In detail, Alexnet includes five convolution layers and three fully connected layers. At the end of sequence layers, the authors put a softmax function to produce 1000 probabilities of 1000 classes. An input image is filtered by the first convolutional layer with 96 kernels of size 11 × 11 × 3, the second convolutional layer with 256 kernels of size 5 × 5 × 48, the third convolutional layer with 384 kernels of size 3 × 3 × 256, the fourth convolutional layer with 384 kernels of size 3 × 3 × 192, and the fifth convolutional layer with 256 kernels of size 3 × 3 × 192. Lastly, preprocessed data is fed to the fully-connected layers.
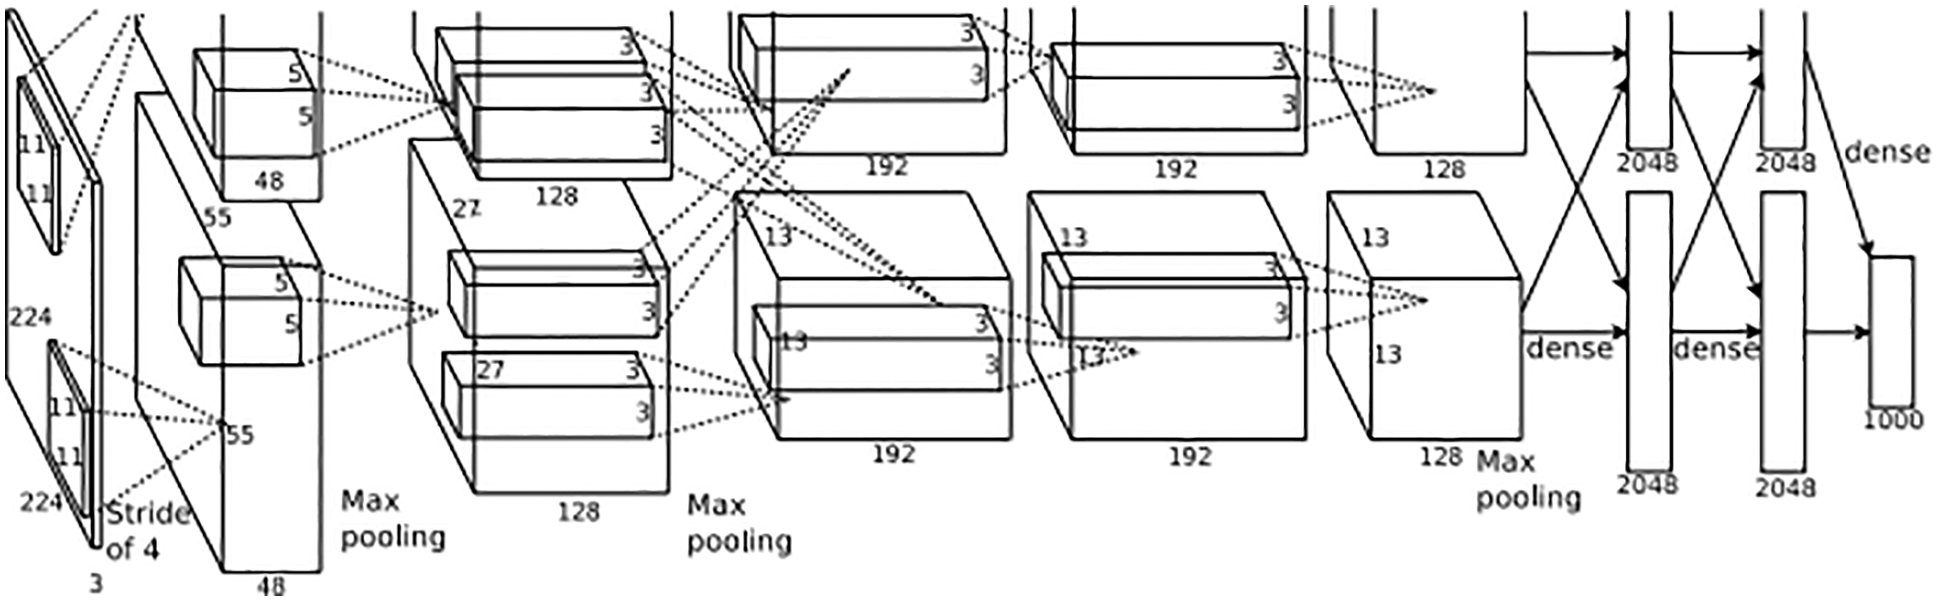
Figure 1: The design of Alexnet [26]
Alexnet was applied to the medical images in the research of Nawaz et al. [27] with the classification of breast cancer histology images. Another is Hosny et al. study [28] in 2019. The authors also tried to classify skin lesions automatically using transfer learning and augmentation.
In 2016, Residual Network [13] was presented by Kaiming He et al with the idea of a way to train deep neural networks. Their result won the Image Net Large Scale Visual Recognition Challenge 2015 with a 3.57% error on the classification task. Fastly, this CNN has become popular with deep learning researchers and developed variants, such as Resnet18, Resnet34, Resnet50, Resnet101, Resnet152. The number following name presents the number of layers. Resnet is designed to solve the vanishing gradient problem, which occurs when networks become deeper. The authors implemented “shortcut connections” in Residual Block, which is described in Fig. 2, to perform identity mapping.
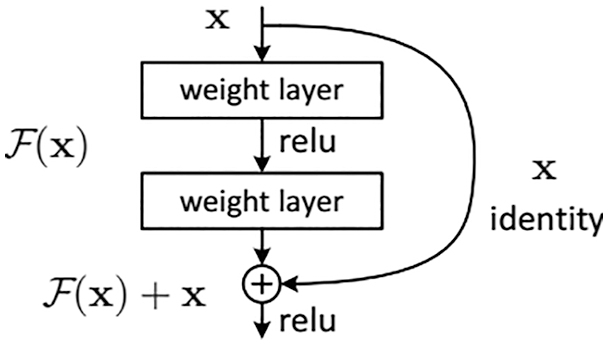
Figure 2: Residual block [13]
Resnet is widely used in image classification problems as well as in medical problems. Some studies on X-ray images are [12,18,20,29,30] for the classification of tuberculosis, pneumonia, and pulmonary nodule. In the study, we chose the Resnet34 and Resnet50 versions for our experiments.
DenseNet is a convolutional neural network that links densely between layers which was proposed by Gao Huang et al. in 2017 [31]. In the design as described in Fig. 3, the authors use Dense Blocks to perform the connection task. In terms of solving the vanishing gradient problem, Densenet and Resnet are rather similar to each other.
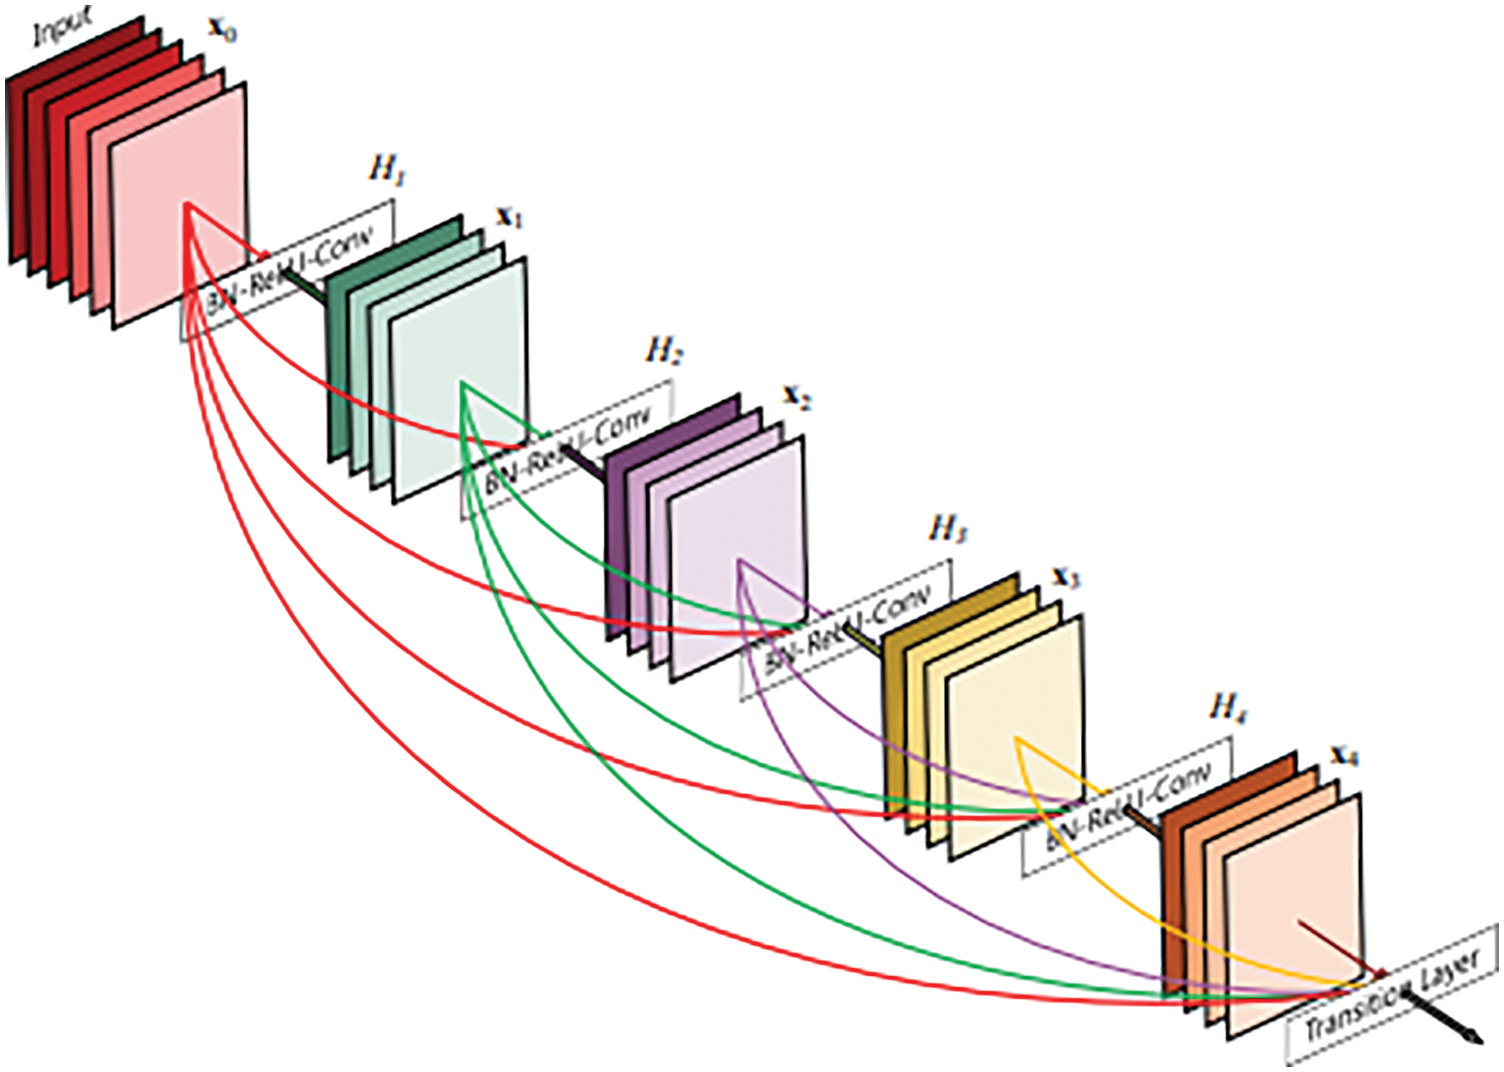
Figure 3: A 5-layer dense block [31]
Densenet was one of the deep learning architectures which applied successfully on X-ray images with some studies such as [32] for COVID-19 and [33] for pneumonia. In the study, we chose the Densenet121 version for our experiments.
Our work focuses on Vietnamese patients, so we need to prepare a Vietnamese X-ray images dataset for training and testing tasks. We named it VRTB dataset. In the study, all Vietnamese X-ray images were collected in a Vietnamese local hospital by using VRPACS software [25].
In detail, the patient needs to wear simple clothes with no metal equipment. After that, he stands against the plate and holds his arms up or to the sides. Before delivering to us, all private information has been removed. The DICOM (Digital Imaging and Communications in Medicine) images have only pixel data. For image resolution, the size of each dimension is in the range [2320,3072].
Images were annotated with tuberculosis state before they could be used for research. Although there are some medical signs of tuberculosis in the chest X-ray image, such as nodule, pleural effusion, infiltration, etc., we need only a binary state for each image. Therefore, one image would be marked as the “tuberculosis” state or the “normal” state.
With the help of the VRPACS team, we prepared the VRTB dataset with 2000 well-annotated chest X-ray images. Among the dataset, there are 1000 images having the “tuberculosis” state, and 1000 images having the “normal” state, which are described in Table 2.
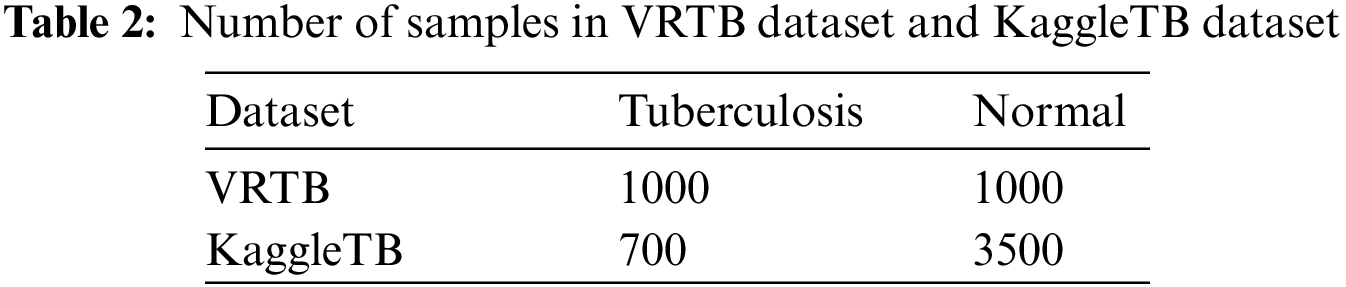
KaggleTB is a dataset published on the Kaggle platform by Rahman et al. [34]. The full dataset from the authors includes 7000 images and the numbers of tuberculosis and normal labels are the same. The authors collected X-ray images from some sources such as the National Library of Medicine in the United State with the Montgomery and Shenzhen datasets [9], the National Institute of Allergy and Infectious Diseases in Belarus, the National Institute of Allergy and Infectious Diseases Portal, and RSNA (Radiological Society of North America) Pneumonia Detection Challenge. in this dataset, there are 2800 tuberculosis images can be downloaded from the National Institute of Allergy and Infectious Diseases Portal after signing an agreement, and everyone can download remained images directly, including 700 tuberculosis X-ray images and 3500 normal X-ray images.
In the study, we only used 4200 images which can be downloaded directly from the Kaggle platform. This data was used for training task at every strategy. By using this dataset, we have tuberculosis data from international patients. In Fig. 4, the label distributions of VRTB dataset and KaggleTB dataset are described.
Figure 4: Labels distribution of VRTB dataset (left) and KaggleTB dataset (right)
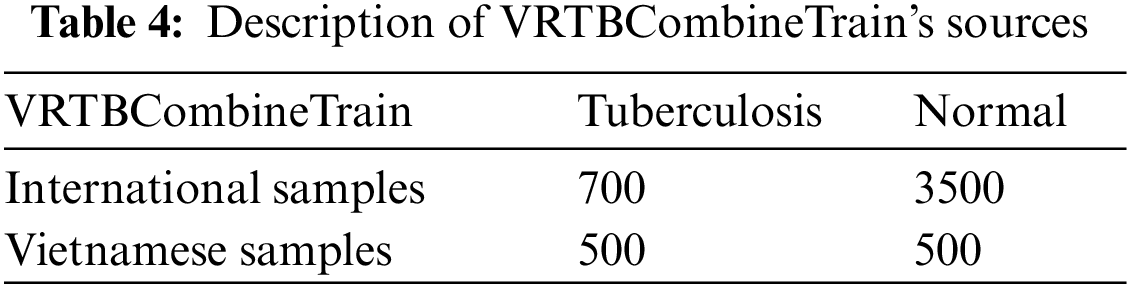
Based on the VRTB dataset and Kaggle dataset, we set up VRTBTest and VRTBCombineTrain datasets for experiments, which are described in Table 3.
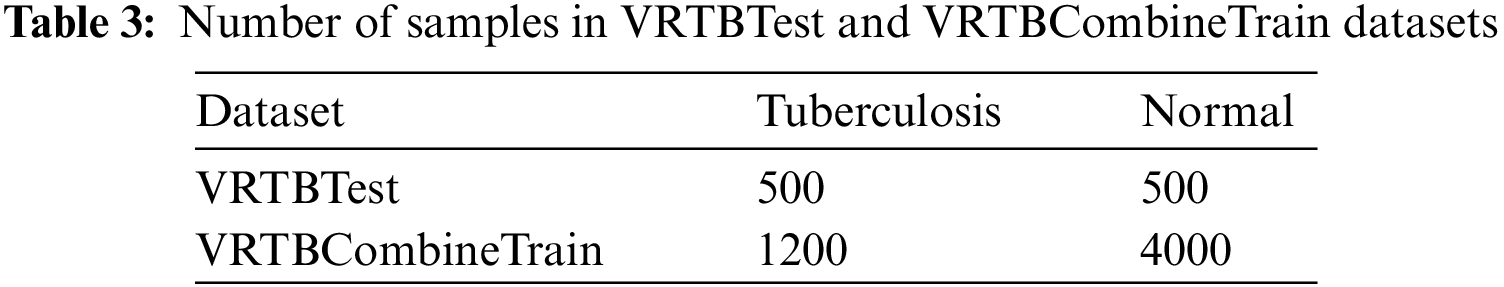
Our study aims to evaluate the effectiveness of different transfer learning strategies for Vietnamese patient data. To do that, on the one hand, all models need to be verified on a Vietnamese X-ray image testing set, VRTBTest. In the paper, we created a 1000 Vietnamese X-ray images testing set balancing tuberculosis samples and normal samples. Therefore, each label had 500 images in VRTBTest.
On the other hand, we also designed VRTBCombineTrain, a training set containing both international data and Vietnamese data. In Fig. 5, the label distributions of VRTBTest and VRTBCombineTrain datasets are described. By learning from VRTBCombineTrain, the model would be optimized by all global and local samples. This is the key idea for analyzing the influence of Vietnamese training samples on the result of deep learning models testing on VRTBTest. VRTBCombineTrain dataset is constructed from the Kaggle dataset and a part of the VRTB dataset. The detail of VRTBCombineTrain dataset is in Table. 4:
Figure 5: Labels distribution of VRTBTest and VRTBCombineTrain datasets
In the study, we constructed experiment strategies into 4 cases: direct training on KaggleTB dataset, transfer learning from ImageNet and training on KaggleTB dataset, direct training from VRTBCombineTrain dataset, and transfer learning from ImageNet and training on VRTBCombineTrain dataset. After that, the evaluation scores of the experiments would point to the value of transfer learning corresponding to different datasets. All datasets for learning are imbalanced. Numbers of Normal and Tuberculosis labels in KaggleTB are 3500 and 700 respectively, and there figures in VRTBCombineTrain are 4000 and 1200. In general, the imbalance is the factor impacting the performance of models and so does in the paper’s experimental context in particular.
In practice, from VRTB framework in Fig. 6, four strategies would focus on the training dataset and initializing parameters. The effect of transfer learning would be presented by options of initializing parameters stage, and the effect of using Vietnamese data would be presented by options of the training dataset.
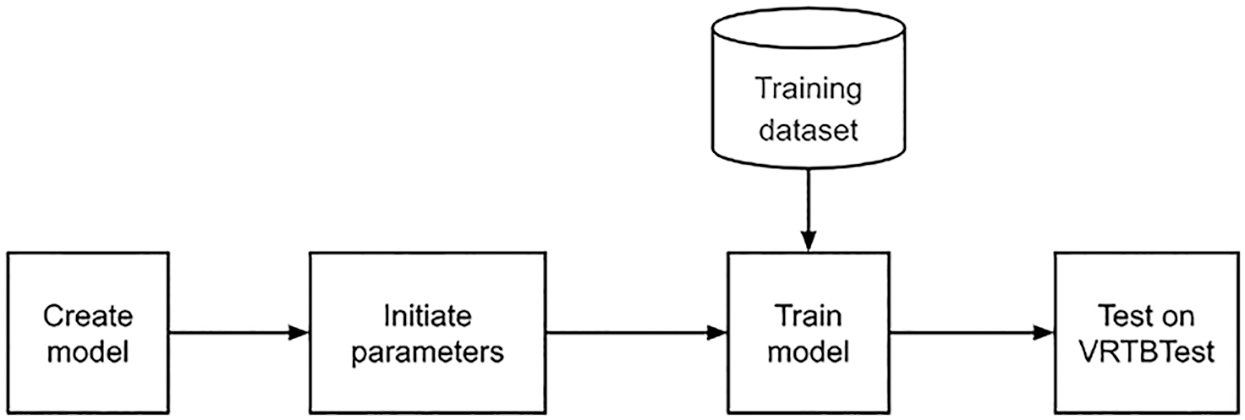
Figure 6: VRTB framework
3.2.1 Strategy 1: Direct Training on KaggleTB
Firstly, we tried to train a model directly on KaggleTB dataset without transfer learning as described in Fig. 7. All initial parameters were generated randomly. This experiment had two features: no transfer learning and using only international data. By measuring on VRTBTest dataset, the Vietnamese X-ray image set, the testing quality should be the lowest in all experiment.
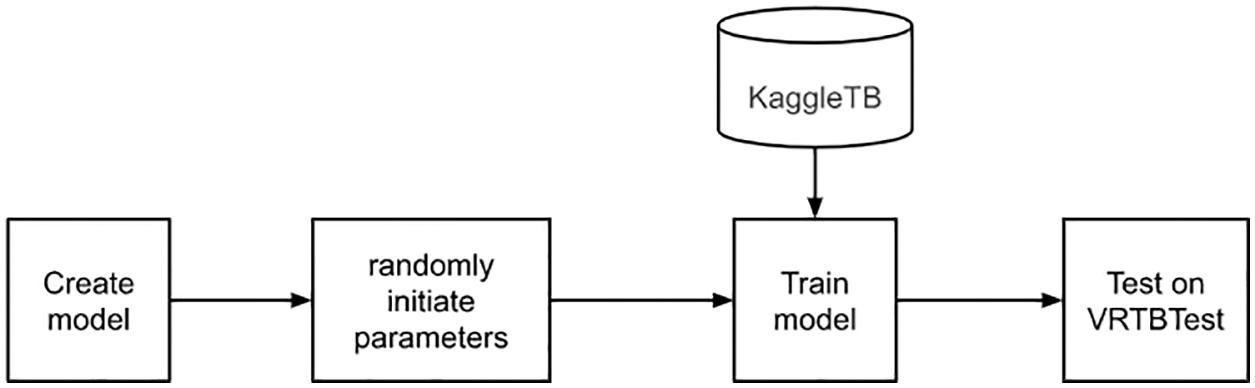
Figure 7: Direct training on KaggleTB flowchart
3.2.2 Strategy 2: Transfer Learning from ImageNet and Training on KaggleTB
Secondly, we would learn a model which had weighted from ImageNet as described in Fig. 8. Similar to the first experiment, the training set is KaggleTB dataset. The features are transfer learning and using only international data. The result in there should be higher than the first experiment because of applying the transfer learning approach. The weighted model has been downloaded from the Pytorch library [35].
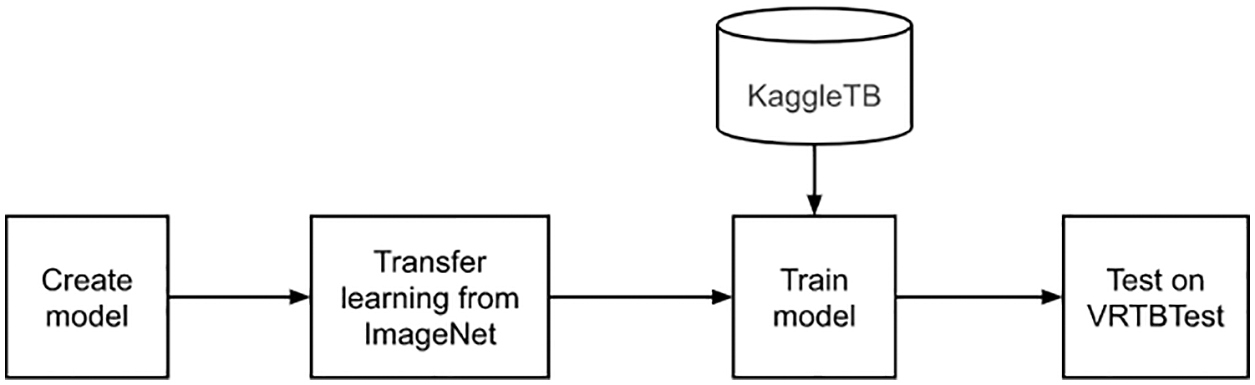
Figure 8: Transfer learning from ImageNet and training on KaggleTB flowchart
3.2.3 Strategy 3: Direct Training from VRTBCombineTrain Dataset
Next, a model was trained directly on the VRTBCombineTrain dataset, with no transfer learning as described in Fig. 9. We also initiated model parameters randomly. In this case, the resulting model was learned with both international and Vietnamese samples, so we expected that its scores would be better than the results in the first experiment.
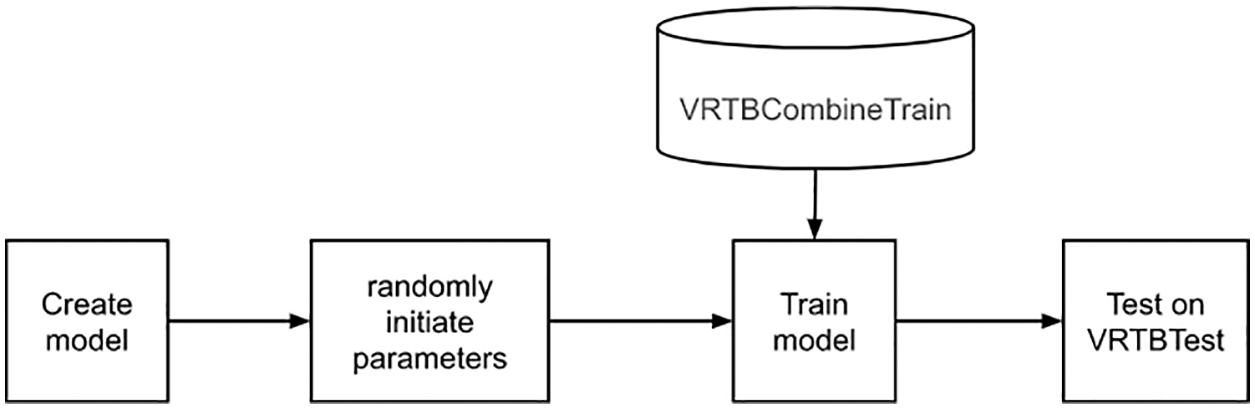
Figure 9: Direct training from VRTBCombineTrain dataset flowchart
3.2.4 Strategy 4: Transfer Learning from ImageNet and Training on VRTBCombineTrain Dataset
Lastly, this is the experiment using transfer learning and have combined training set as described in Fig. 10. Similar to the second experiment, the weighted model has been downloaded from the Pytorch library. Moreover, the model would be optimized with both international and Vietnamese data, so this experiment should bring the best quality among the four experiment options.
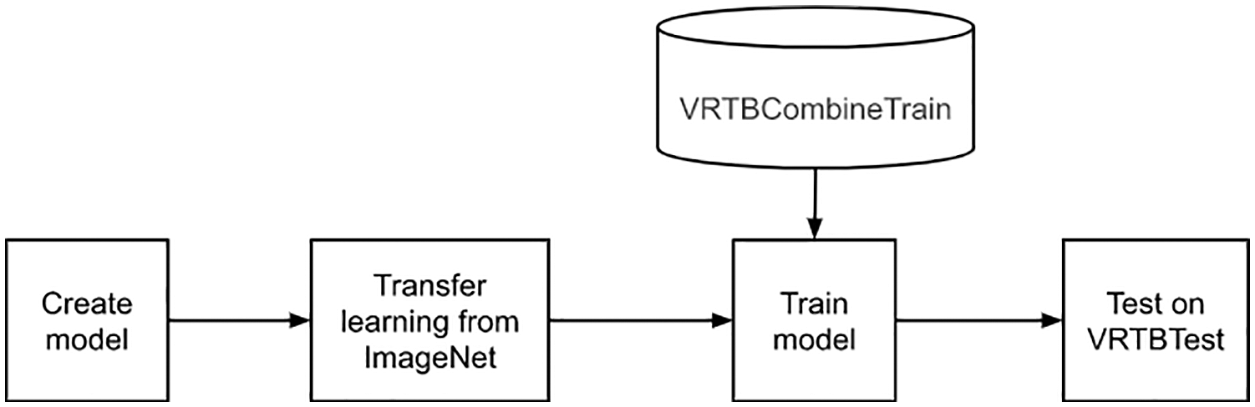
Figure 10: Transfer learning from ImageNet and training on VRTBCombineTrain dataset flowchart
Researching the diagnostic quality of one model is estimating the agreement between a predicted value and reference standard. In our study, we have a patient series that had well-annotated in their disease states. These are the references for comparing with results from our proposed model. In general, a patient case will be assigned to "normal" or "tuberculosis".
In medical studies, doctors highly recommend using sensitivity and specificity scores. Sensitivity aims to present the rate of people who are correctly diagnosed as sick among the whole people really having the target condition. And in contrast, specificity refers to the proportion of people who are identified as healthy among the whole people really not having the target condition. In our context, the target condition is tuberculosis.
These scores are produced by combining predicted values and references. In detail, we have a 2 × 2 table, also called a confusion matrix. In this matrix, there are four scalars presented: True Positive (TP), False Positive (FP), True Negative (TN), and False Negative (FN).
From the confusion matrix, there are two scalars calculated: True Positive Rate (TPR) and False Positive Rate (FPR).
From the confusion matrix, there is also a simple score that is used widely and can be calculated. This is the accuracy.
Another score used in the proposed study is AUC. It stands for the area under receiver operating characteristic (ROC) curve, the graph presenting the relation between TPR and FPR over a different threshold set. AUC is a score measuring the overall quality of one binary classifier. This scalar is 0.5 corresponding to a random classifier, and the other interesting value is the maximum value. It equals 1 and presents the performance of the perfect classifier. Illustrations of the confusion matrix and AUC are described in Fig. 11.
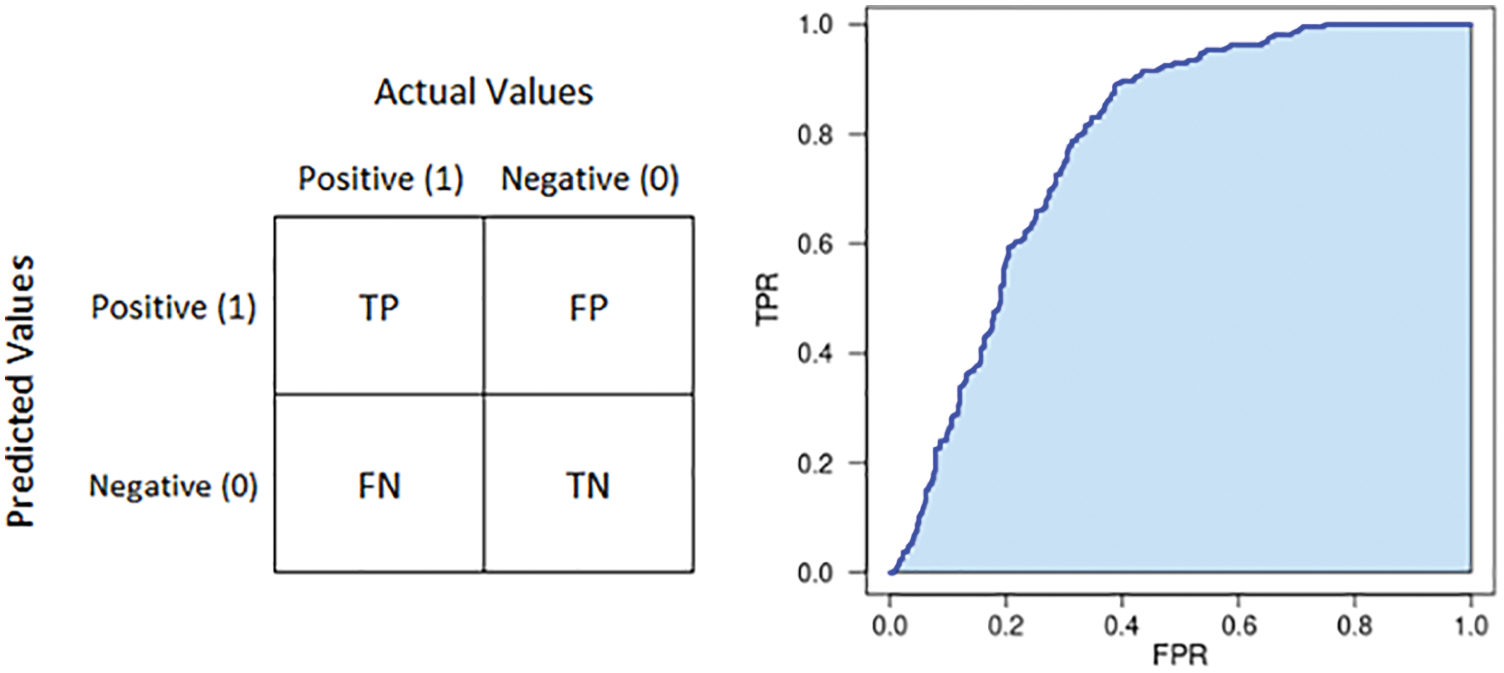
Figure 11: Illustration of confusion matrix (left) and AUC (right)
This section discusses the results obtained from our experiments. All datasets for learning, KaggleTB and VRTBCombineTrain, would be split by 80:20 into a training set and a validation set as material for the training phase. The optimization process would be stopped based on the score measured from the validation set. In all experiments, we used the accuracy score as an indicator for stopping the training process. Then, the trained model would be evaluated on the VRTBTest dataset. At that time, we could discuss the effectiveness of each strategy.
To practice experiments, we use an Ubuntu deep learning server. The configuration of this machine is NVIDIA GeForce RTX 3080 with 10 GB memory, 64 GB RAM, and 1TB Hard Disk memory. To implement deep learning functions, our program was built on top of Pytorch library.
For each strategy, we tried to train and test 3 models: Resnet34, Alexnet, and Densenet121. In general, we calculated the average of each metrics from 3 models as in Table. 5.
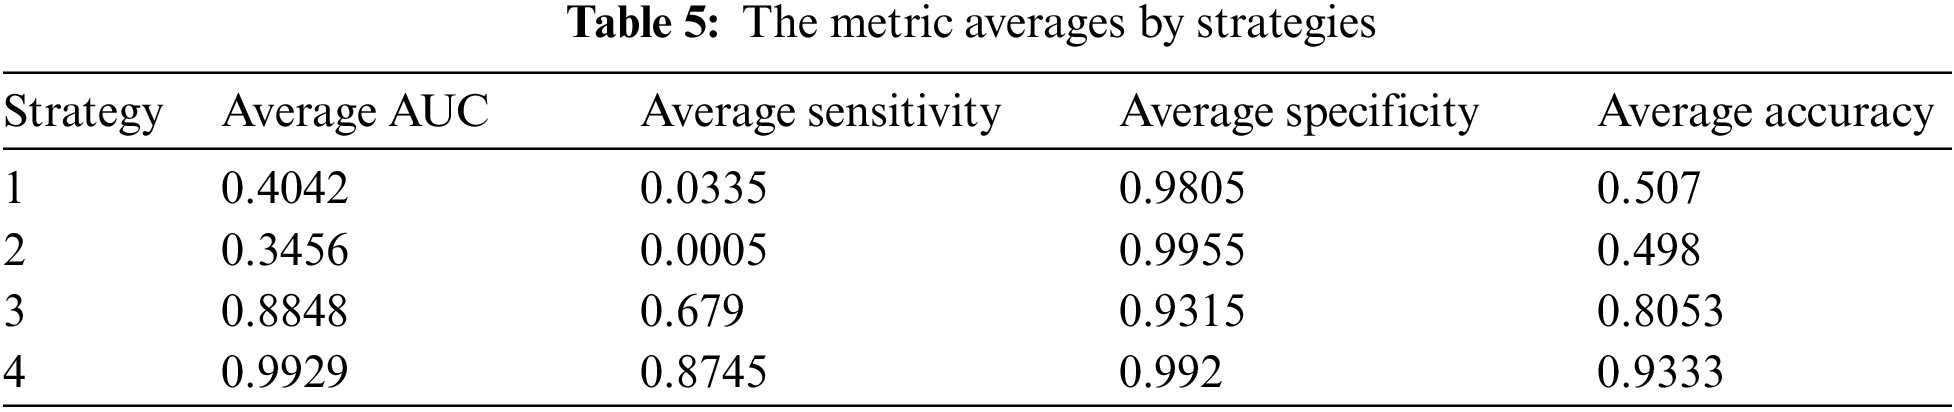
As presented in section 3.2, experiment strategies were designed with different options of using the transfer learning approach and training dataset. In detail, the quality of strategy 4 should be the highest because of using transfer learning with the combined training set. The output metrics pointed out our hypothesis was correct with almost strategy 4’s metric averages over 0.9.
We can see in the table that the best result belongs to strategy 4, and it’s consistent with the initial opinion presented in section 3.2.4. Results in strategies 1 and 2 are quite similar, and both of them are not good. Their average accuracies are approximate 0.5, and the average sensitivities are near 0. To discuss more detail, we focus on true positive, true negative, false positive, and false negative scores as below.
In Fig. 12, the pie charts give information about how different amount proportions of the four outcome types. In these two cases, false negative and true negative comprised nearly 100% of the total. It means the models trained in strategy 1 and 2 response negative answers for almost samples in VRTBTest. Results might come from the effect of the imbalanced training datasets or the difference between the distributions of Vietnamese data and international data. As presented above, both strategies 1 and 2 had KaggleTB, the international training set, and VRTBTest, the Vietnamese testing set. They also were trained on the imbalanced dataset with a proportion rate of 5:1 (3500:700). To clarify this problem, we go to the case of strategies 3 and 4 as described in Fig. 13.
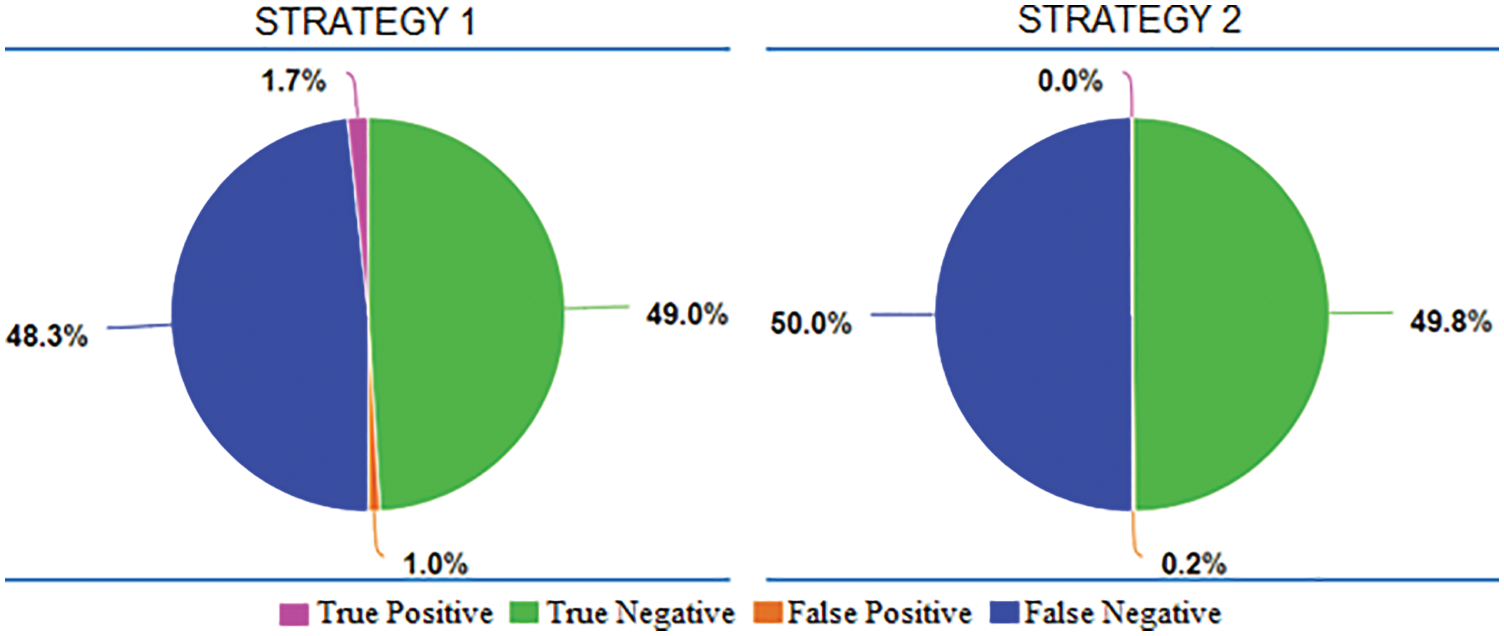
Figure 12: The proportions of average True Positive, average True Negative, average False Positive, and average False Negative in Strategy 1 and Strategy 2
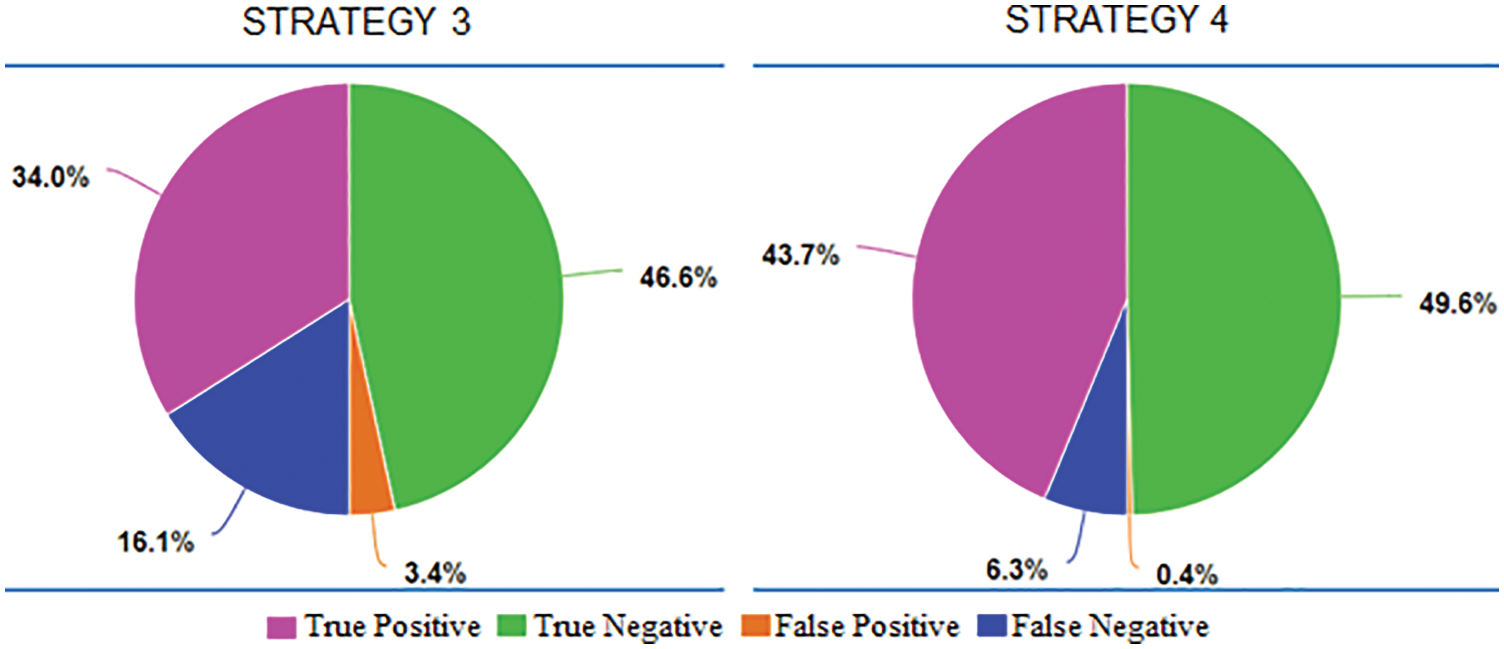
Figure 13: The proportions of average True Positive, average True Negative, average False Positive, and average False Negative in Strategy 3 and Strategy 4
VRTBCombineTrain, the training set was used in both strategies 3 and 4, is also imbalanced though the imbalanced rate is smaller than KaggleTB. The label rate in it is 4000:1200, approximately 3.333. Another important factor is VRTBCombineTrain including Vietnamese X-ray images, and it makes the distributions of the training set and the testing set become more similar. In two pie charts, what stands out is that the majority of output results are true positive and true negative. It points out that almost the VRTBTest dataset was classified correctly. So, we can see obviously the role of Vietnamese data appearance in the training dataset.
In more detail, we analyze the effectiveness of transfer learning by comparing the average of evaluating metrics between strategies 3 and 4 as described in Fig. 14. Overall, all scores in strategy 4 are higher than in strategy 3. From strategy 3 to 4, the rise in the average AUC was from 0.8848 to 0.9929, the average sensitivity was from 0.679 to 0.8745, the average specificity was from 0.9315 to 0.992, and the average accuracy was from 0.8053 to 0.9333. In the experimental context, the advantage of transfer learning was shown clearly.
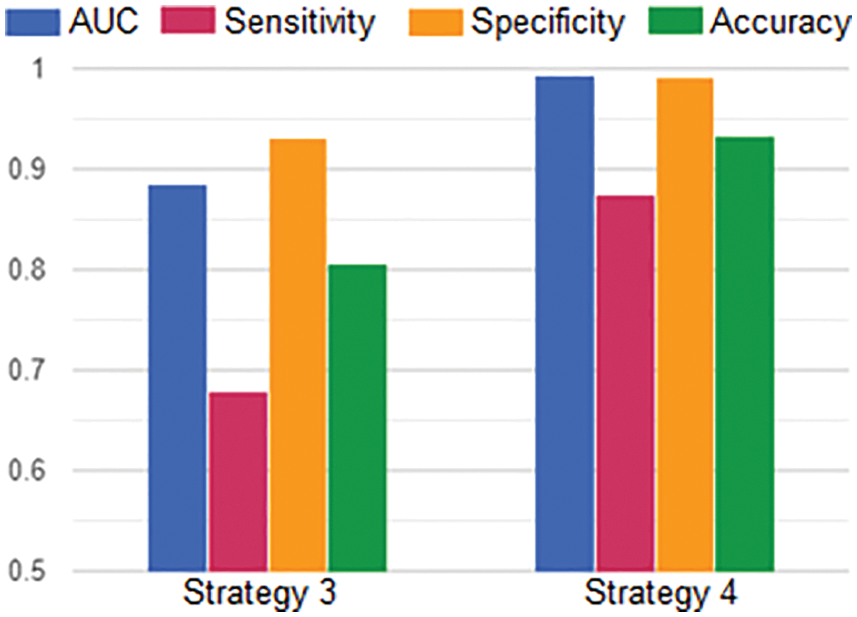
Figure 14: The averages of AUC, Sensitivity, Specificity and Accuracy in Strategy 3 and Strategy 4
Lastly, we discuss how different the performance of models in strategy 4. As presented in Fig. 15, we tried Resnet50, Resnet34, Alexnet, and Densenet121. Although there were some differences in measures, all models achieved rather good figures. The best model was Resnet50 which had all scores higher than 0.93. In common, there were only four scalars less than 0.9, and most of the scalars were more than 0.93. All AUCs were more than 0.98. Therefore, these models are both good candidates for continuing studying when we will be expanding the Vietnamese X-rays dataset in the future.
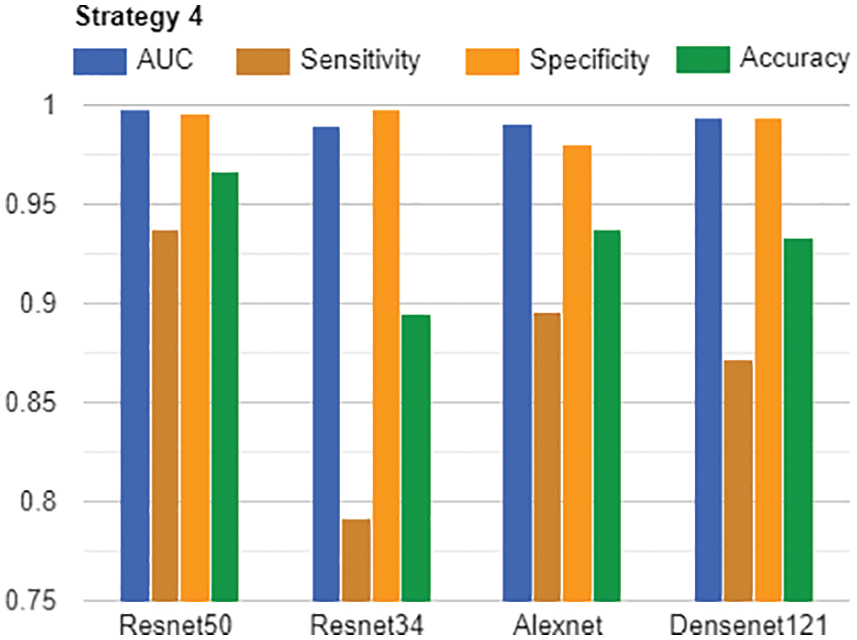
Figure 15: AUC, Sensitivity, Specificity and Accuracy of all models in Strategy 4
In this paper, we focused on the influence of the transfer learning approach and the role of Vietnamese training data in testing Vietnamese X-ray images for tuberculosis classification. In this study, we used data collected in the Vietnamese hospital combined with the international data, the Kaggle dataset All study’s results gave information about how we should design experiments and build the tuberculosis classification application with Vietnamese X-ray images. Although we achieved good testing AUC, accuracy, sensitivity, and specificity, there is a lot of work needed to do to make an out-of-box product for tuberculosis diagnosis in the healthcare industry. This study also aims to create the base to create autonomous diagnosis systems for the data scientist, radiologist, and healthcare staff. In this study, we saw the importance of Vietnamese data in the training phase, so collecting more and more data would be our vital task. By applying transfer learning, some popular deep learning models also prove the ability with high evaluating scores. So, transfer learning is a suitable approach for developing a diagnosis system by requiring less training time and providing highly accurate results in small medical datasets.
Funding Statement: This research is funded by the project KC-4.0.14/19-25 “Research on building a support system for diagnosis and prediction geo-spatial epidemiology of pulmonary tuberculosis by chest X-Ray images in Vietnam”.
Conflicts of Interest: The authors declare that they have no conflicts of interest to report regarding the present study.
References
1. World Health Organization, “Global tuberculosis report 2021,” 2021. [Online]. Available: https://apps.who.int/iris/handle/10665/346387. [Google Scholar]
2. World Health Organization, “World Tuberculosis Day 2022,” 2022. [Online]. Available: https://www.who.int/campaigns/world-tb-day/2022. [Google Scholar]
3. U.S. Department of Health & Human Services, “Treatment for TB Disease,” 2022. [Online]. Available: https://www.cdc.gov/tb/topic/treatment/tbdisease.htm. [Google Scholar]
4. The National Tuberculosis Program Partners with USAID to Implement a New Strategy to End TB in Vietnam (2020. [Online]. Available: https://vn.usembassy.gov/the-national-tuberculosis-tb-program-partners-with-usaid-to-implement-a-new-strategy-to-end-tb-in-vietnam. [Google Scholar]
5. E. Erhan and N. Yumuşak, “Tuberculosis disease diagnosis using artificial neural network trained with genetic algorithm,” Journal of Medical Systems, vol. 35, no. 3, pp. 329–332, 2011. [Google Scholar]
6. J. Dongardive, A. Xavier, K. Jain and S. Abraham, “Classification and rule-based approach to diagnose pulmonary tuberculosis,” in Int. Conf. on Advances in Computing and Communications, Berlin, Heidelberg, Springer, pp. 328–339, 2011. [Google Scholar]
7. A. Yahiaoui, O. Er and N. Yumusak, “A new method of automatic recognition for tuberculosis disease diagnosis using support vector machines,” Biomedical Research, vol. 28, no. 9, pp. 4208–4212, 2017. [Google Scholar]
8. R. Hooda, S. Sofat, S. Kaur, A. Mittal and F. Meriaudeau, “Deep-learning: A potential method for tuberculosis detection using chest radiography,” in Proc. of the IEEE Conf. on Signal Image Process, Kuching, Malaysia, pp. 497–502, 2017. [Google Scholar]
9. S. Jaeger, S. Candemir, S. Antani, Y. J. Wang, P. Lu et al., “Two public chest X-ray datasets for computer-aided screening of pulmonary diseases,” Quantitative Imaging in Medicine and Surgery, vol. 4, no. 6, pp. 475, 2014. [Google Scholar]
10. U. K. Lopes and J. F. Valiati, “Pre-trained convolutional neural networks as feature extractors for tuberculosis detection,” Computers in Biology and Medicine, vol. 89, pp. 135–143, 2017. [Google Scholar]
11. L. G. C. Evalgelista and E. B. Guedes, “Computer-aided tuberculosis detection from chest X-ray images with convolutional neural networks,” in Anais do XV Encontro Nacional de Inteligência Artificial e Computacional, São Paulo, Brasil, pp. 518–527, 2018. [Google Scholar]
12. O. Yadav, K. Passi and C. K. Jain, “Using deep learning to classify X-ray images of potential tuberculosis patients,” in 2018 IEEE Int. Conf. on Bioinformatics and Biomedicine, Madrid, Spain, pp. 2368–2375, 2018. [Google Scholar]
13. K. He, X. Zhang, S. Ren and J. Sun, “Deep residual learning for image recognition,” in Proc. of the IEEE Conf. on Computer Vision and Pattern Recognition, Las Vegas, NV, USA, 2016. [Google Scholar]
14. X. Wang, Y. Peng, L. Lu, Z. Lu, M. Bagheri et al., “Chestx-ray8: Hospital-scale chest x-ray database and benchmarks on weakly-supervised classification and localization of common thorax diseases,” in Proc. of the IEEE Conf. on Computer Vision and Pattern Recognition, Honolulu, HI, USA, pp. 2097–2106, 2017. [Google Scholar]
15. F. Pasa, V. Golkov, F. Pfeiffer, D. Cremers and D. Pfeiffer, “Efficient deep network architectures for fast chest X-ray tuberculosis screening and visualization,” Scientific Reports, vol. 9, no. 1, pp. 1–9, 2019. [Google Scholar]
16. M. Ahsan, R. Gomes and A. Denton, “Application of a convolutional neural network using transfer learning for tuberculosis detection,” in 2019 IEEE Int. Conf. on Electro Information Technology, Brookings, SD, USA, pp. 427–433, 2019. [Google Scholar]
17. K. Simonyan and A. Zisserman, “Very deep convolutional networks for large-scale image recognition,” arXiv preprint arXiv:1409.1556, 2014. [Google Scholar]
18. A. Hernández, Á. Panizo and D. Camacho, “An ensemble algorithm based on deep learning for tuberculosis classification,” in Int. Conf. on Intelligent Data Engineering and Automated Learning, Manchester, United Kingdom, pp. 145–154, 2019. [Google Scholar]
19. C. Szegedy, V. Vanhoucke, S. Ioffe and J. Shlens, “Rethinking the inception architecture for computer vision,” in Proc. of the IEEE Conf. on Computer Vision and Pattern Recognition, Las Vegas, NV, USA, pp. 2818–2826, 2016. [Google Scholar]
20. S. S. Meraj, R. Yaakob, A. Azman, S. N. Rum, A. Shahrel et al., “Detection of pulmonary tuberculosis manifestation in chest X-rays using different convolutional neural network (CNN) models,” International Journal of Engineering and Advanced Technology (IJEAT), vol. 9, no. 1, pp. 2270–2275, 2019. [Google Scholar]
21. M. Zachariou, O. Arandjelovic, W. Sabiiti, B. Mtafya and D. Sloan, “Tuberculosis bacteria detection and counting in fluorescence microscopy images using a multi-stage deep learning pipeline,” Information-An International Interdisciplinary Journal, vol. 13, no. 2, pp. 96, 2022. [Google Scholar]
22. J. Shiraishi, S. Katsuragawa, J. Ikezoe, T. Matsumoto, T. Kobayashi et al., “Development of a digital image database for chest radiographs with and without a lung nodule: Receiver operating characteristic analysis of radiologists’ detection of pulmonary nodules,” American Journal of Roentgenology, vol. 174, no. 1, pp. 71–74, 2000. [Google Scholar]
23. C. Le Van, V. Puri, N. Thanh Thao and D. Le, “Detecting lumbar implant and diagnosing scoliosis from vietnamese X-ray imaging using the pre-trained API models and transfer learning,” Computers, Materials & Continua, vol. 66, no. 1, pp. 17–33, 2021. [Google Scholar]
24. M. Raghu, C. Zhang, J. Kleinberg and S. Bengio, “Transfusion: Understanding transfer learning for medical imaging,” Advances in Neural Information Processing Systems, vol. 32, pp. 3347–3357, 2019. [Google Scholar]
25. VRPACS Software, 2022. [Online]. Available: http://vnpacs.vn. [Google Scholar]
26. A. Krizhevsky, I. Sutskever and G. E. Hinton, “Imagenet classification with deep convolutional neural networks,” in Proc. of the 25th Int. Conf. on Neural Information Processing Systems, Lake Tahoe, Nevada, pp. 1097–1105, 2012. [Google Scholar]
27. W. Nawaz, S. Ahmed, A. Tahir and H. A. Khan, “Classification of breast cancer histology images using alexnet,” in Int. Conf. Image Analysis and Recognition, Cham, Springer, pp. 869–876, 2018. [Google Scholar]
28. K. M. Hosny, M. A. Kassem and M. M. Foaud, “Classification of skin lesions using transfer learning and augmentation with Alex-net,” PloS One, vol. 14, no. 5, pp. e0217293, 2019. [Google Scholar]
29. P. O. Hemantkumar, R. Lodha, M. Bajoria and R. Sujatha, “Pneumonia detection using deep learning architectures,” Journal of Computational and Theoretical Nanoscience, vol. 17, no. 12, pp. 5535–5542, 2020. [Google Scholar]
30. C. Tong, B. Liang, Q. Su, M. Yu, J. Hu et al., “Pulmonary nodule classification based on heterogeneous features learning,” IEEE Journal on Selected Areas in Communications, vol. 39, no. 2, pp. 574–581, 2020. [Google Scholar]
31. G. Huang, Z. Liu, L. Van Der Maaten and K. Q. Weinberger, “Densely connected convolutional networks,” in Proc. of the IEEE Conf. on Computer Vision and Pattern Recognition, Honolulu, HI, USA. pp. 4700–4708, 2017. [Google Scholar]
32. S. Albahli, N. Ayub and M. Shiraz, “Coronavirus disease (COVID-19) detection using X-ray images and enhanced DenseNet,” Applied Soft Computing, vol. 110, no. 6, pp. 107645, 2021. [Google Scholar]
33. P. Rajpurkar, J. Irvin, K. Zhu, B. Yang, H. Mehta et al., “Chexnet: Radiologist-level pneumonia detection on chest x-rays with deep learning,” arXiv preprint arXiv: 1711. 05225, 2017. [Google Scholar]
34. T. Rahman, A. Khandakar, M. A. Kadir, K. R. Islam, K. F. Islam et al., “Reliable tuberculosis detection using chest X-ray with deep learning, segmentation and visualization,” IEEE Access, vol. 8, pp. 191586–191601, 2020. [Google Scholar]
35. Pytorch library (2016. [Online]. Available: https://pytorch.org. [Google Scholar]
Cite This Article
 Copyright © 2023 The Author(s). Published by Tech Science Press.
This work is licensed under a Creative Commons Attribution 4.0 International License , which permits unrestricted use, distribution, and reproduction in any medium, provided the original work is properly cited.
 Downloads
 Citation Tools