
 Submit a Paper
 Propose a Special lssue
 Open Access
ARTICLE

Functional Nonparametric Predictions in Food Industry Using Near-Infrared Spectroscopy Measurement
1 Department of Mathematics, College of Science, King Khalid University, Abha, 62529, Saudi Arabia
2 Statistical Research and Studies Support Unit, King Khalid University, Abha, 62529, Saudi Arabia
3 Laboratory of Statistics and Stochastic Processes University of Djillali Liabes BP 89, Sidi Bel Abbes, 22000, Algeria
4 Medical Faculty, Djillali Liabes University BP 89, Sidi Bel Abbes, 22000, Algeria
* Corresponding Author: Ibrahim M. Almanjahie. Email:
Computers, Materials & Continua 2023, 74(3), 6307-6319. https://doi.org/10.32604/cmc.2023.033441
Received 16 June 2022; Accepted 08 September 2022; Issue published 28 December 2022
 View Full Text
 Download PDF
Abstract
Functional statistics is a new technique for dealing with data that can be viewed as curves or images. Parallel to this approach, the Near-Infrared Reflectance (NIR) spectroscopy methodology has been used in modern chemistry as a rapid, low-cost, and exact means of assessing an object’s chemical properties. In this research, we investigate the quality of corn and cookie dough by analyzing the spectroscopic technique using certain cutting-edge statistical models. By analyzing spectral data and applying functional models to it, we could predict the chemical components of corn and cookie dough. Kernel Functional Classical Estimation (KFCE), Kernel Functional Quantile Estimation (KFQE), Kernel Functional Expectile Estimation (KFEE), Semi-Partial Linear Functional Classical Estimation (SPLFCE), Semi-Partial Linear Functional Quantile Estimation (SPLFQE), and Semi-Partial Linear Functional Expectile Estimation (SPLFEE) are models used to accurately estimate the different quantities present in Corn and Cookie dough. The selection of these functional models is based on their ability to construct a forecast region with a high level of confidence. We demonstrate that the considered models outperform traditional models such as the partial least-squares regression and the principal component regression in terms of prediction accuracy. Furthermore, we show that the proposed models are more robust than competing models such as SPLFQE and SPLFEE in the sense that data heterogeneity has no effect on their efficiency.Keywords
As a rapid, easy, and non-destructive approach, NIR spectroscopy is commonly used for the quantitative examination of high dimension samples in a variety of disciplines, including the environment, pharmaceutical analysis, fuels, and foods [1–4]. However, because of background noise and overlapping bands, chemometrics must be used to build a suitable model to relate the intrinsic relationship between spectra and a specific component concentration [5–7]. As a result, multivariate calibrations are gaining popularity in quantitative NIR spectroscopy analysis.
On the other hand, thanks to increased storage capabilities that allow massive data to be recorded, a tremendous revolution in computer development has occurred over the last two decades. This technological advancement has aided the development of the statistical branch devoted to functional data analysis (FDA), both in terms of theoretical and methodological advancements as well as the diversification of application domains. As a result, strategies for treating observations as functional random elements have been devised. In this context, we provide some definitions that can be utilized to correct the terminology. To begin with, remember that a functional random variable is essentially a random variable with values in the space of potentially infinite dimension denoted by [8]. For example, this functional space may be a space of functions, linear operators, and so on; and the fact that these observations are intended to correspond to such a space is the domain’s main source of difficulty.
Regression models the relationship between a functional (or scalar) response and a functional (or scalar) regression component. The plague of dimension, however, is a drawback to these techniques (where the speed of convergence of the estimators is a decreasing function of the dimension of the covariates). The research of the nonlinear regression model in this situation is significantly more recent than that of the linear case. Indeed, [9] obtained the initial results; the authors were interested in a nonparametric estimate of the mode of distribution of a functional variable satisfying a fractal criterion. When the observations are independent and identically distributed, [10] established the almost complete convergence of a kernel estimator of the regression function under the same conditions. However, these methods suffer from the curse of dimensionality (when analyzing a high number of covariates, where the speed of convergence of the estimators decreases as the dimension of the covariates increases). To overcome this issue, semi-parametric models, which provide a compromise between a nonparametric model and a fully parametric model, were studied. Their key advantage over nonparametric regression is faster estimator convergence.
The partial linear model is one of the most popular semi-parametric models in this literature. Reference [11] who created a semi-functional partial linear regression model, were the first to introduce this approach to the FDA. They developed estimators for each model component (parametric and nonparametric) and demonstrated their asymptotic characteristics. In addition, [12] used the model to forecast functional time series. Furthermore, using cross-validation and Bayesian techniques, [13,14] proposed and investigated bandwidth selections. Reference [15] suggested a k-nearest-neighbors (k-NN) approach and obtained the asymptotic performances of k-NN estimators, whereas [16] investigated a semi-functional partly linear regression model with random responses. Reference [17] investigated semi-functional partial linear regression for spatial data and obtained asymptotic normality of the parametric component as well as probability convergence with the rate of the nonparametric component.
The downside of classical regression, according to another section, is that the regression function estimation is sensitive to outliers and may be incorrect in some instances, such as when the distribution is multimodal or extremely asymmetric. This lack of robustness can be addressed by forecasting using conditional quantiles, as examined by [18,19]. Unfortunately, these conditional models are not always satisfactory and are difficult to calculate due to the non-continuous loss function; Its high sensitivity to extreme values, in particular.
It is possible to combine the concepts of least squares regression with conditional quantiles to create a new measure of risk known as expectile. The conditional expectile has been widely investigated, with pioneering works in [20,21].
The main goal of this study is to forecast various chemical components using a functional Near-Infrared Reflectance (NIR) spectroscopic approach and some recent statistical models based on functional kernel estimation and semi-partial linear functional processes. Corn and cookie dough are examples of NIR spectroscopy datasets used in this investigation. In particular, for this type of data, we propose six models: KFCE, KFQE, KFEE, SPLFCE, SPLFQE, and SPLFEE.
The remainder of the paper is as follows. We detail the materials and methods, including collected samples based on spectrometry and chemometric analysis in Section 2. We also introduce the modern statistical models we used for the analyses in the same section. The results and discussion of this study are presented in Section 3. Finally, we conclude our study in Section 4.
This study made use of two tiny NIR spectral datasets. In addition to NIR spectra and moisture, oil, protein, and starch levels, 80 corn samples were analyzed using three spectrometers. There are two methods employed in this study: NIR spectrometer mp6 and protein content.
The second set of datasets examined here is the results of an experiment to assess the feasibility of using NIR spectroscopy to determine the composition of biscuit dough bits from 72 cookie dough samples (formed but unbaked biscuits) for possible online implementation. (See [23] for a detailed description of the experiment.) In a simpler term, two similar sample sets were created, with the standard recipe being changed to provide a wide range for each of the four ingredients under investigation: fat, sucrose, dry flour, and water. Each dough piece has its own NIR reflectance spectrum.
The original spectral data set consists of 700 points taken in 2 nm steps from 1100 to 2498 nm. The absorption
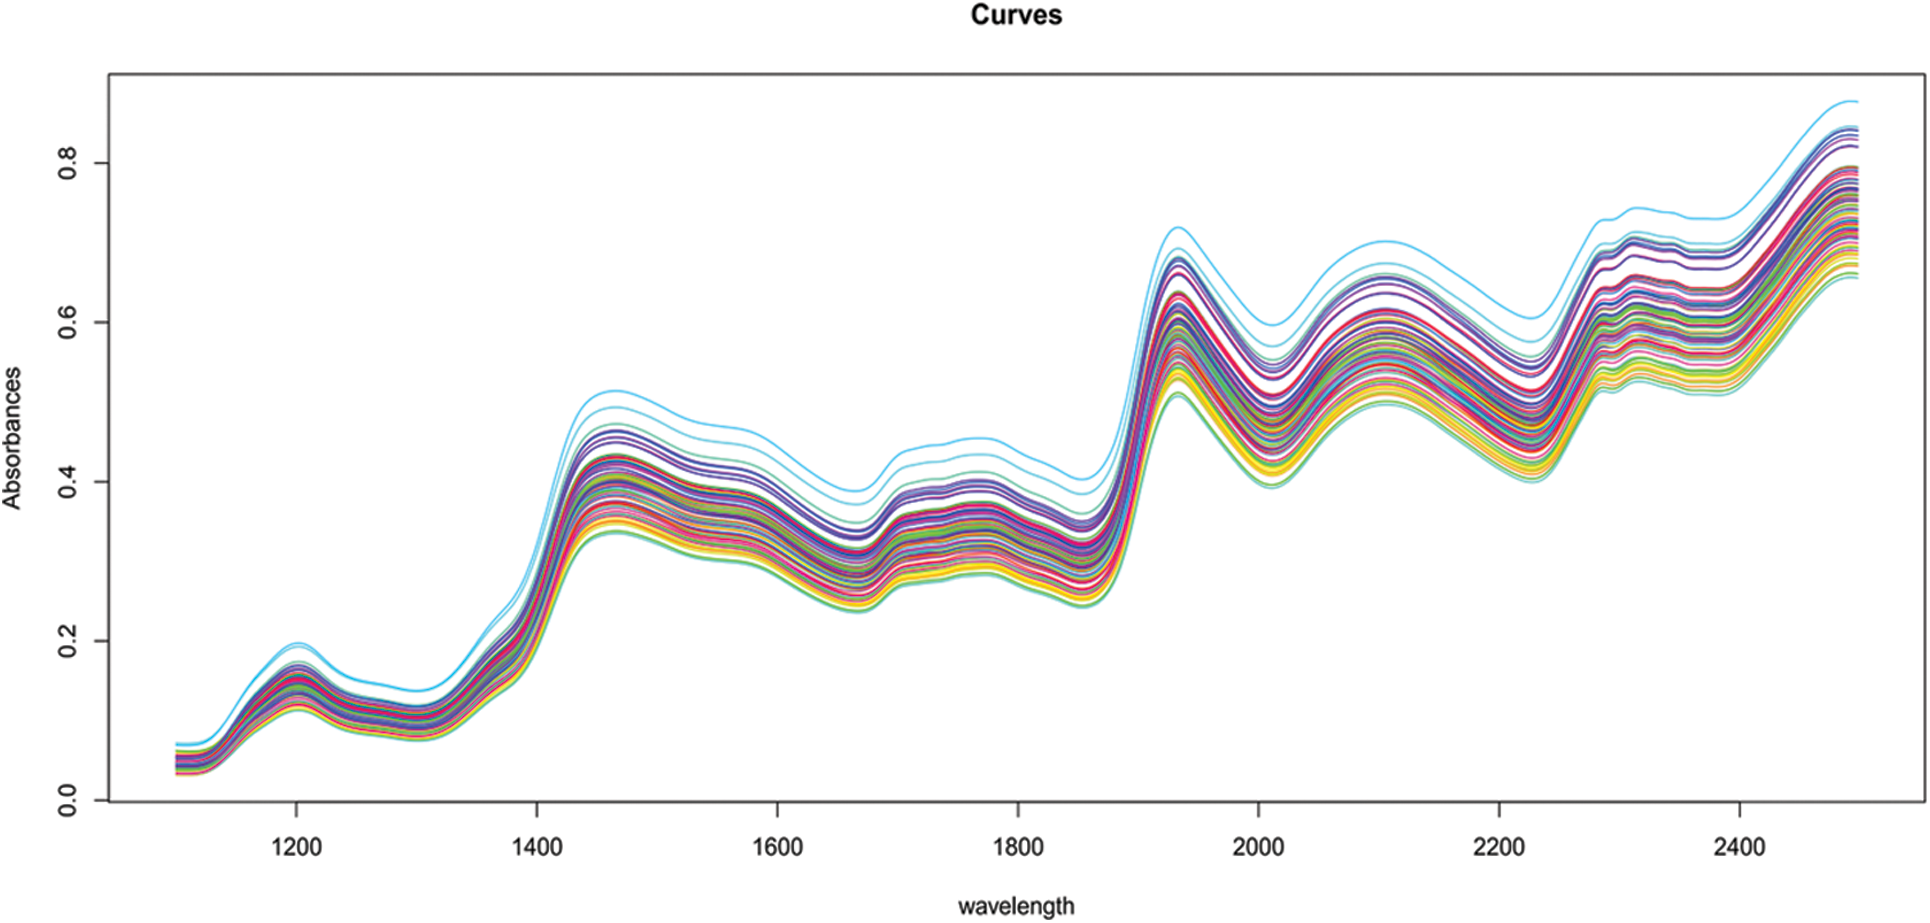
Figure 1: Corn 80 samples of near-infrared spectra
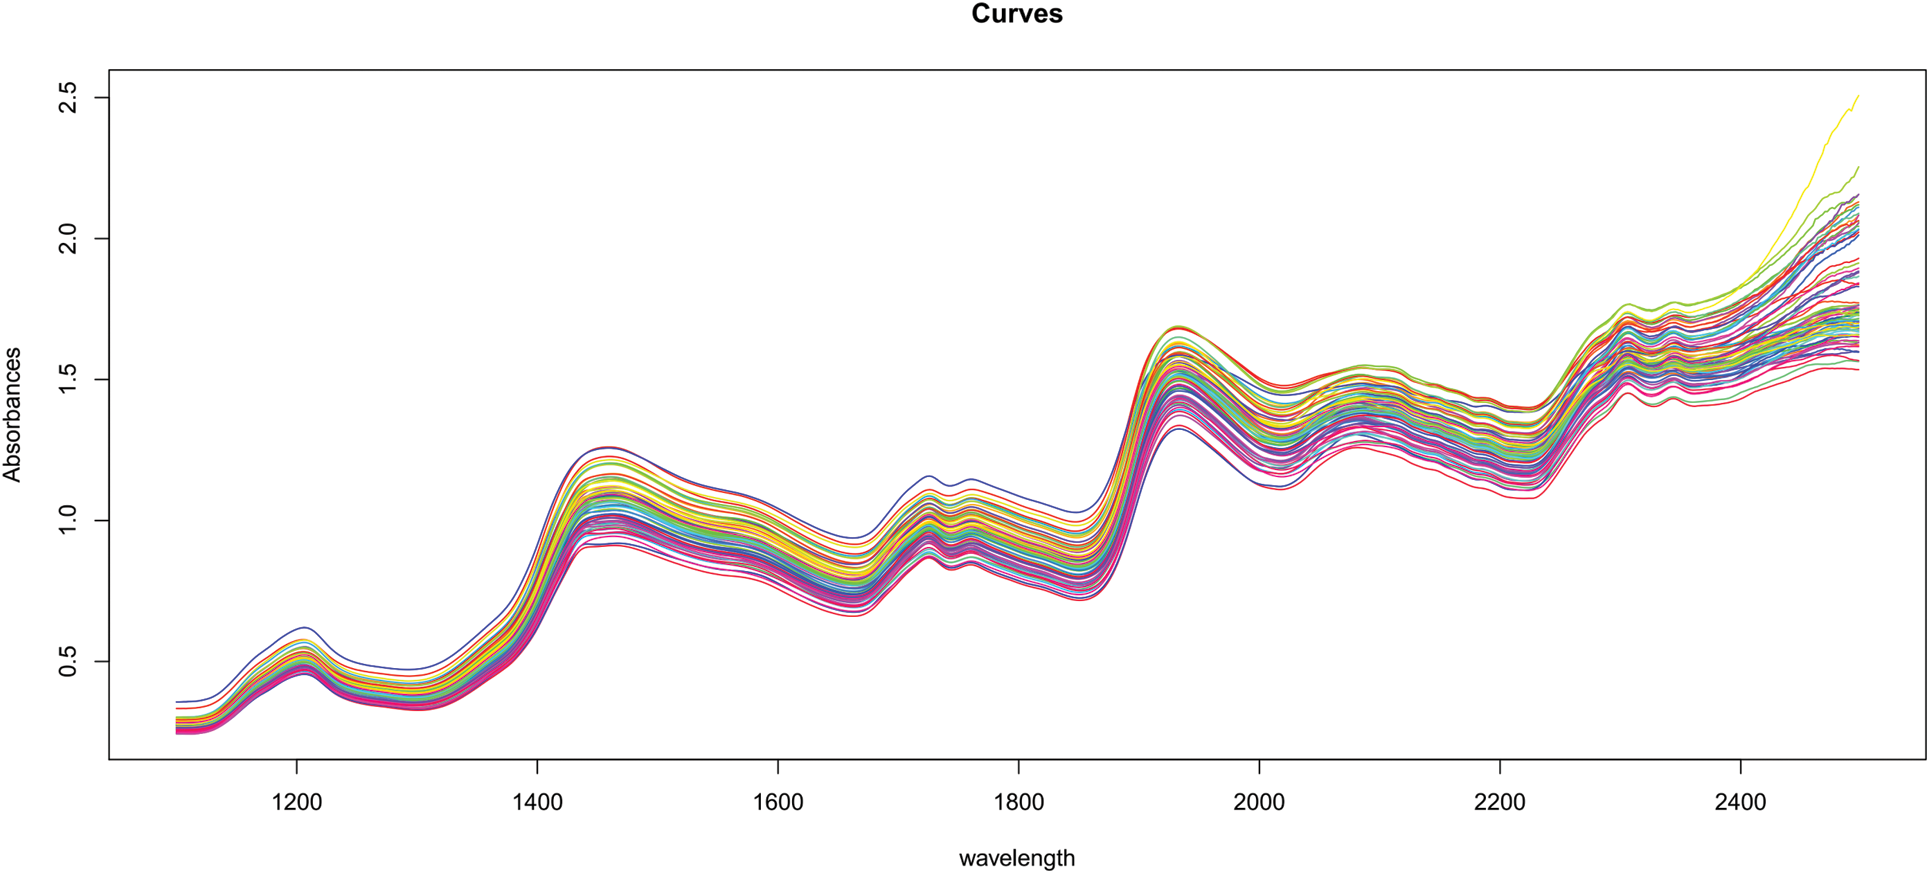
Figure 2: 72 samples of near-infrared spectra from cookie dough
It is obvious that all of these curves, even if observed at discrete places, have a continuum character. This continuous property is referred to as functional data. Figs. 1 and 2 illustrate a typical set of such data for the food business.
In chemometrics, functions–such as absorbance or emission spectra provided for food samples–are frequently employed to determine the concentration of specific components. Using spectra is often far less expensive than other types of chemical analysis.
The objective is to create an equation that predicts response values Y from the spectral data X and vectorial parameter Z for future samples where Y is unknown but X and Z can be measured economically and promptly. Which we assume that those variables are linked by the following regression formula,
where the response variable Y is consider to be the protein content for the corn datasets and the percentage of fat content for the cookie dough datasets from the corresponding contents
In this section, we will concentrate on regression models such that
The main objective of this study is to show and explore various methods for modeling nonlinear relationships in datasets comprising functional data. A scalar response to functional and vectorial explanatory variables is a specific example that we focus on here. Using both traditional and robust methods, we will propose two approaches: functional nonparametric regression and semi-functional partial linear regression.
Ferraty et al. [8] were the first to investigate nonparametric estimation of functional regression (see also [24]). They estimated this statistical model using the Nadaraya-Watson method. Specifically, the function
It follows that
with K is a kernel function,
In robust regressions, risk (or loss) measures such as quantile and expectile have been utilized. Quantile and expectile can characterize the entire distribution of a random variable, and there is no missing information, which decreases the sensitivity of the quantile (or expectile) to noise and outliers. Despite their variations in structure, quantiles and expectiles have similar qualities. A combination of least squares and conditional quantiles is used to create the expectile regression, which combines the advantages of both models. In order to build this regression models, one must solve the following problem:
with
for both
This last regression is an alternative semi-parametric regression which takes into consideration the vectorial variable Z, introduced by [11]. It is defined as following
where
with
and
This final regression is a semi-parametric alternative to the least regression approach. It has only been considered recently in functional statistics by [19]. Our estimators are as follows:
for both SPLFQE and SPLFEE models, where
Stage 1:
We obtain initial estimators of
Stage 2:
Stage 3:
The final estimate of
we conclude our study in Section 4.
There is a strong correlation between the estimation accuracy of all the models listed above and the selection of the semi-metric
In this prediction problem, the smoothing parameter
with
where, for all i in
When the original data set is split into 100 equal parts, the Mean Square Error (MSE) values can be computed and their distribution can be seen using a beanplot. Finally, for all datasets, the testing sample
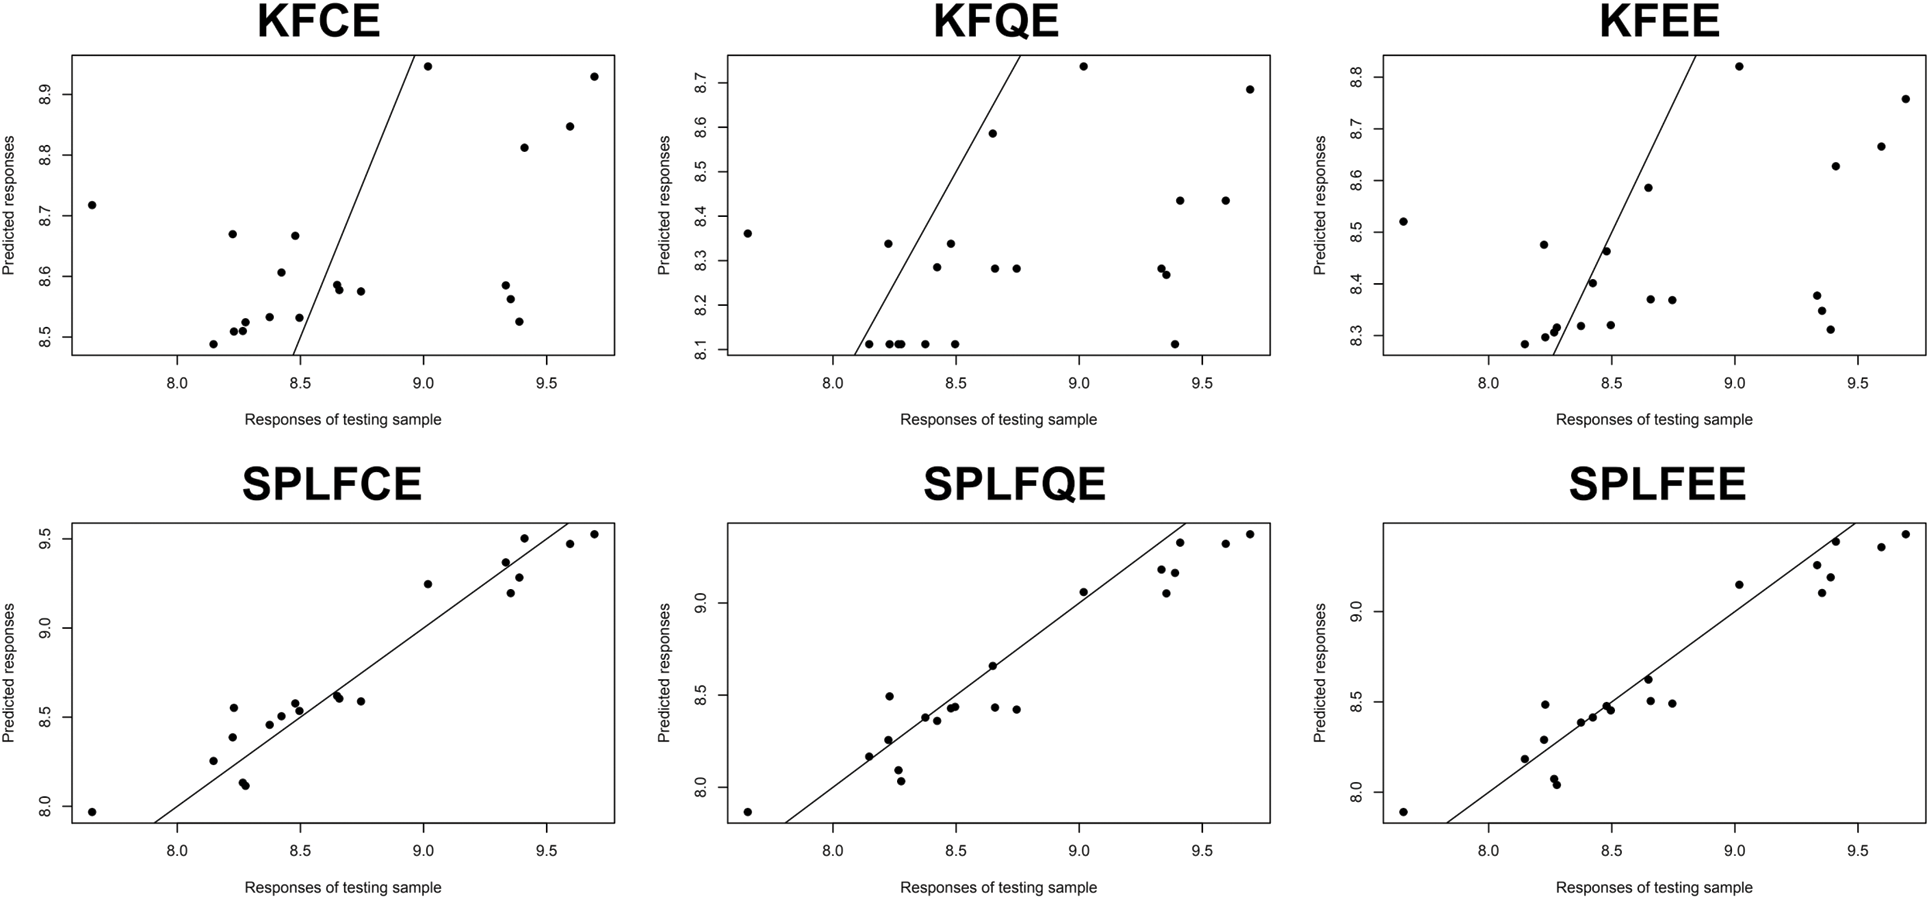
Figure 3: Predictive performance: Corn datasets
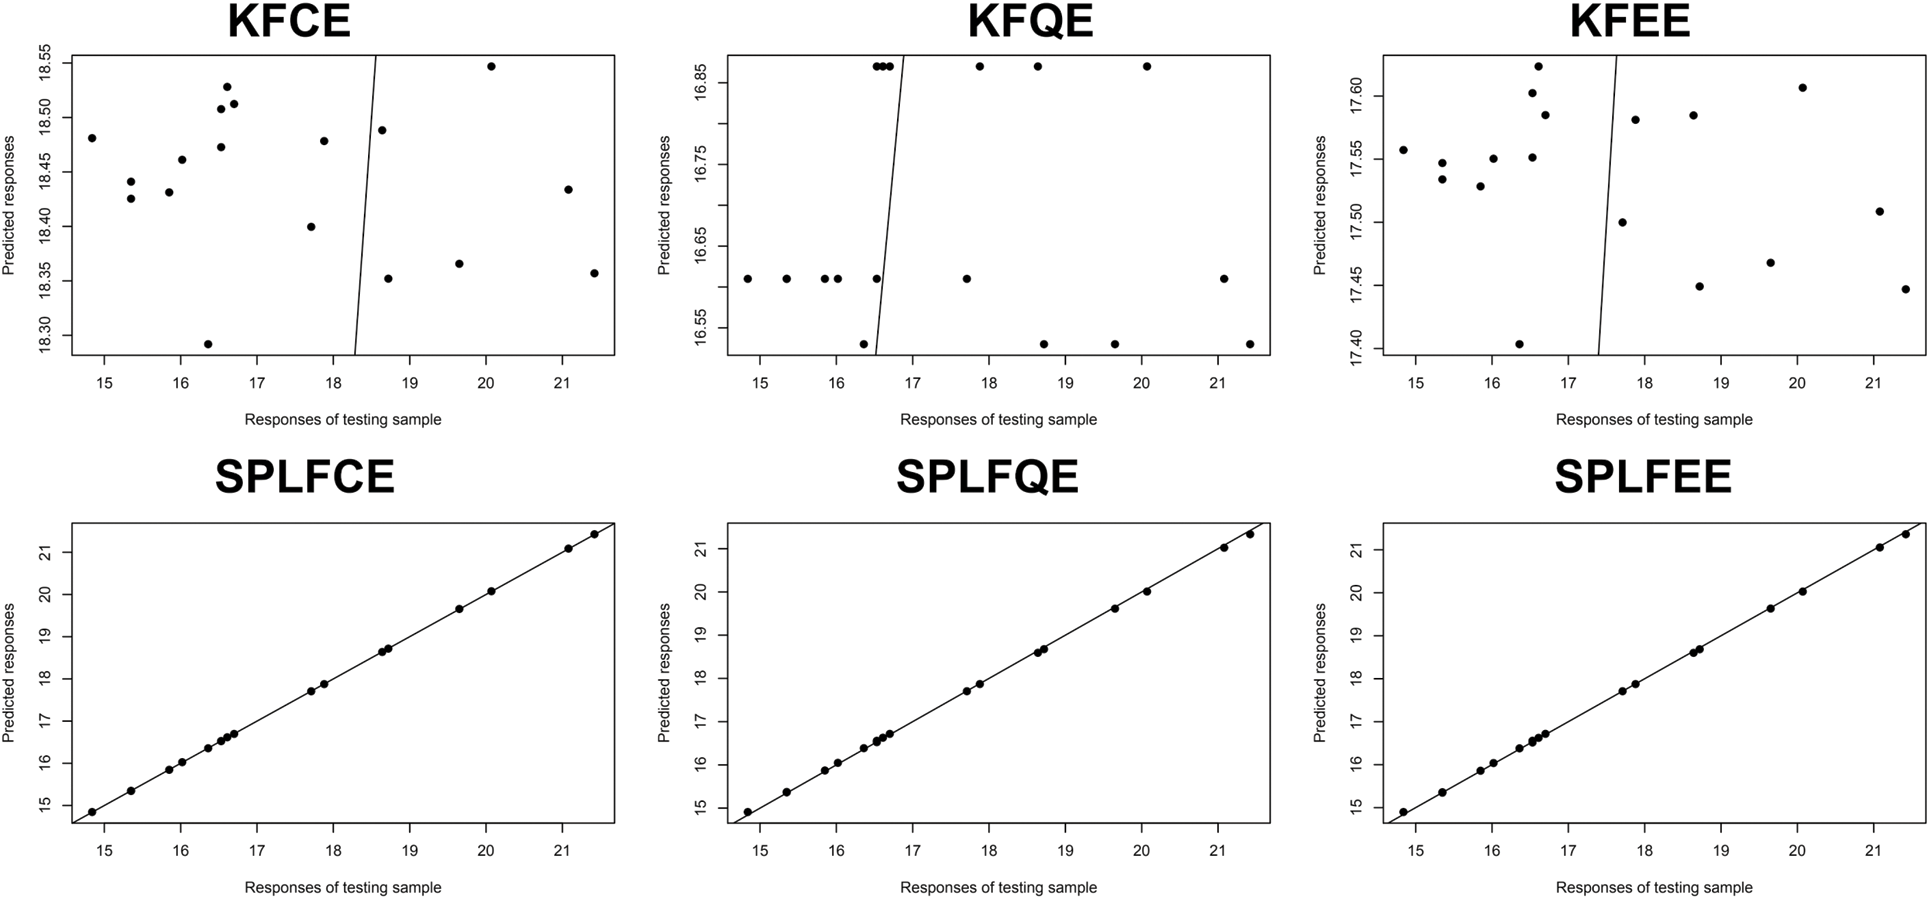
Figure 4: Predictive performance: Cookie dough datasets
Figs. 3 and 4 display the response variable prediction produced from the testing sample: the observed values vs. the projected values. They show that there is a significant benefit across semi-partial linear functional models when compared to kernel functional models. The semi-partial linear functional model for classical, quantile, and expectile regression outperforms the kernel functional model for classical, quantile, and expectile regression.
Figs. 5 and 6 show the mean squared error (MSE) of the predictions, respectively, as shown in the bean-plots. The results of a comparison between the classical (SPLFKE, SPLFQE, SPLFEE) and semi-partial (KFCE, KFQE, KFEE) methods of predicting the shape of spectrum curves show that the latter models perform better.
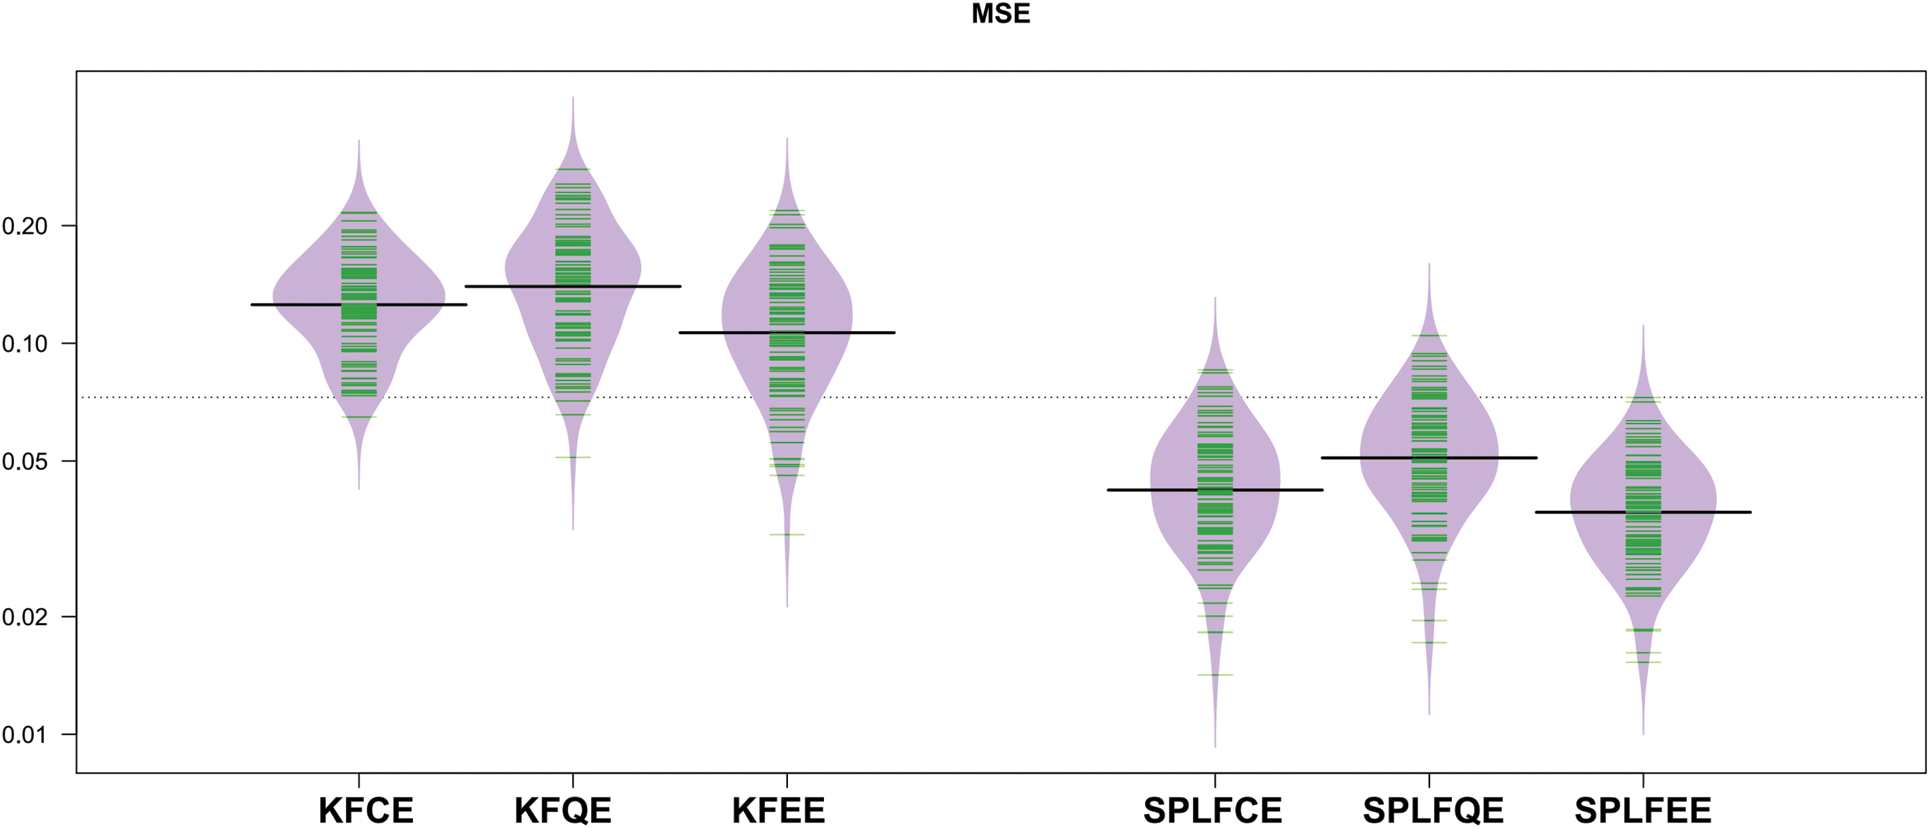
Figure 5: Bean-plots of the
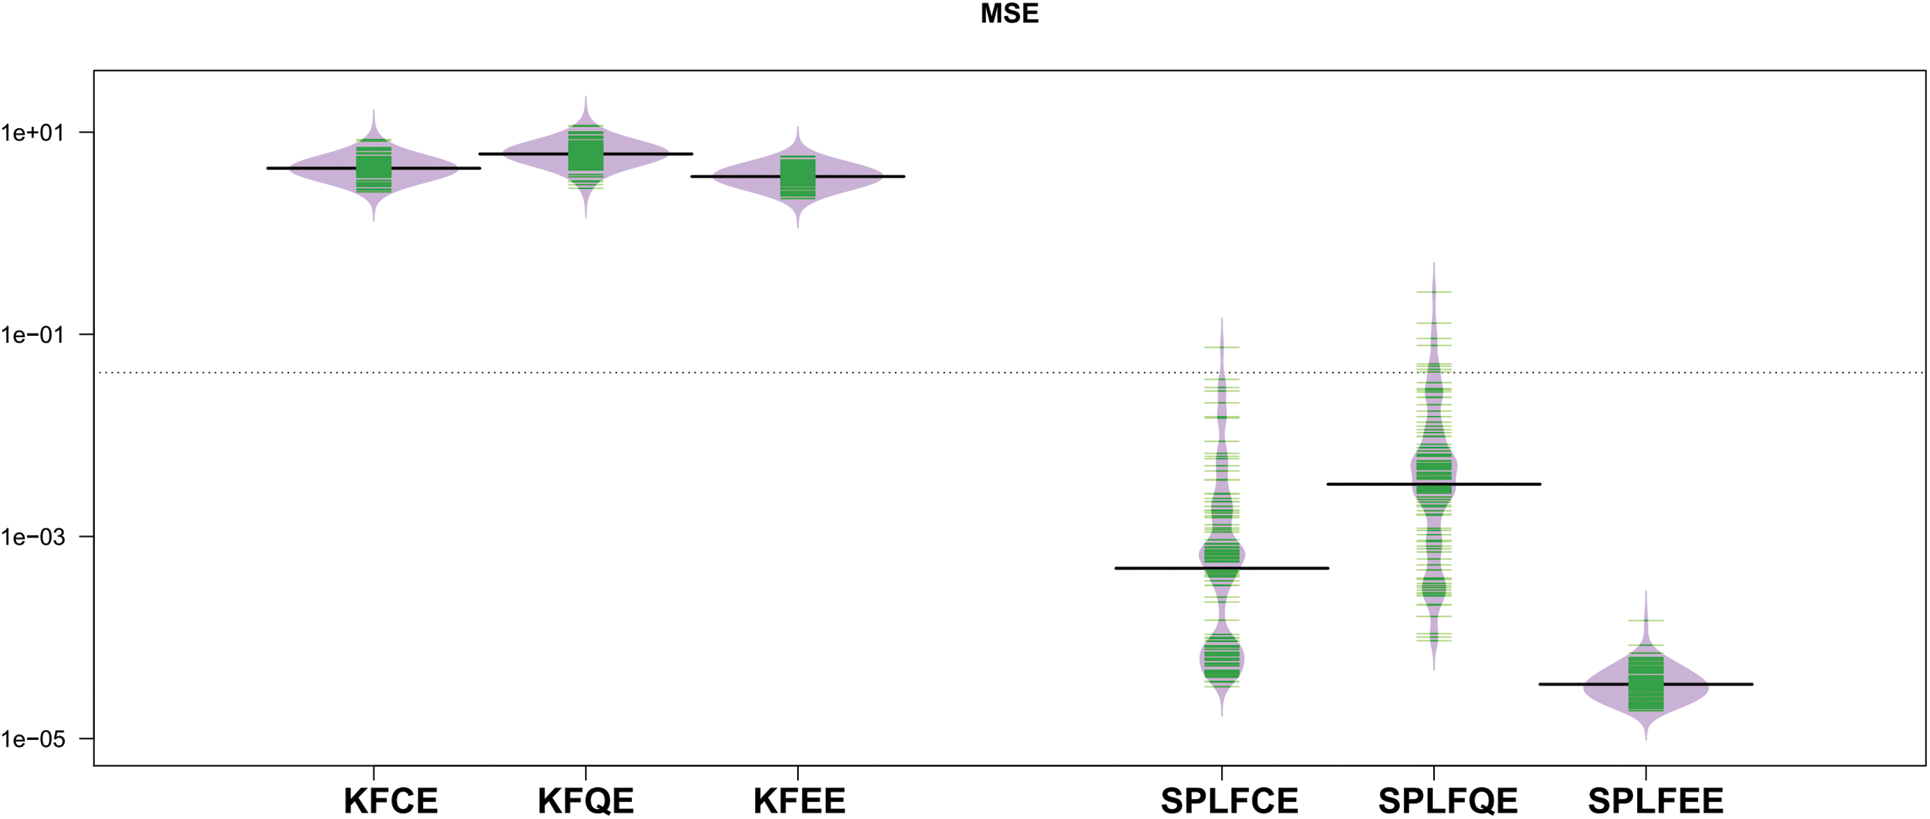
Figure 6: Bean-plots of the
The MSE values for the two semi-partial linear functional models, SPLFCE, SPLFQE, and SPLFEE, are reasonably stable and less when compared to the kernel functional models, KFCE, KFQE, and KFEE. Although the performance of the studied models varies, the variability of the MSE for the three proposed models is relatively stable for the semi-partial linear functional for classical, quantile, and expectile regression models as compared to the kernel functional for classical, quantile, and expectile regression models.
It is worth mentioning that the functional semi-parametric regression approach includes a distance measure
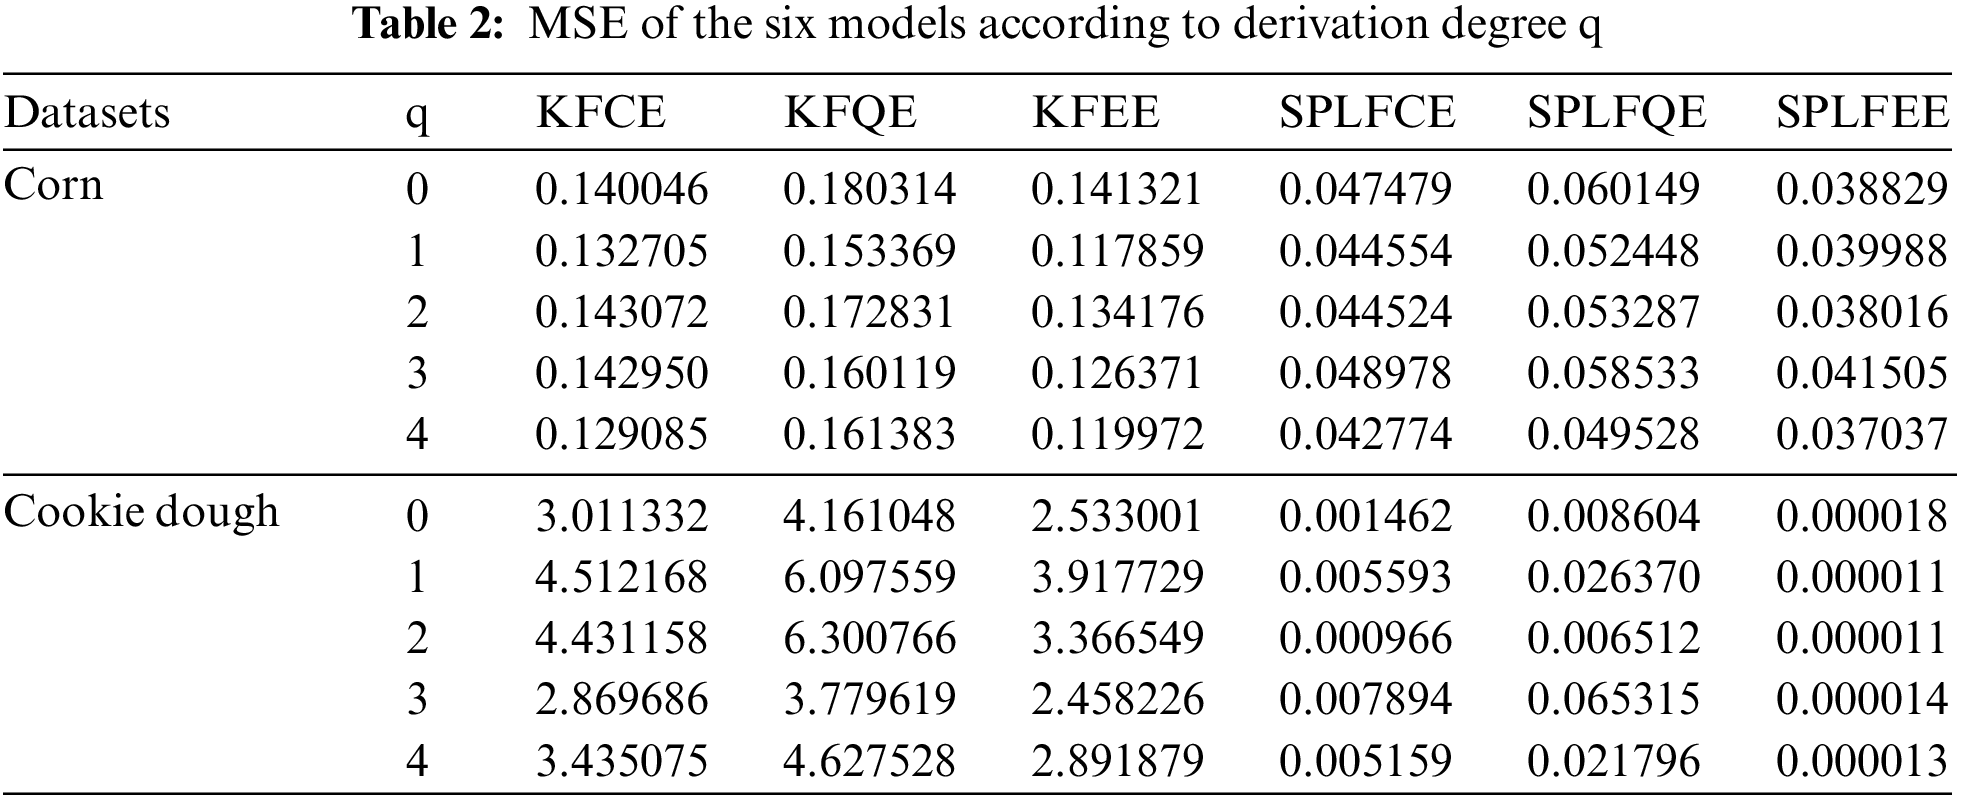
The previous three regression models appear to have done well and have a reasonable level of accuracy for this prediction task. On the other hand, the performance of the analyzed models varies according to the input vectorial variable Z. The MSE errors are summarized in Table 3.
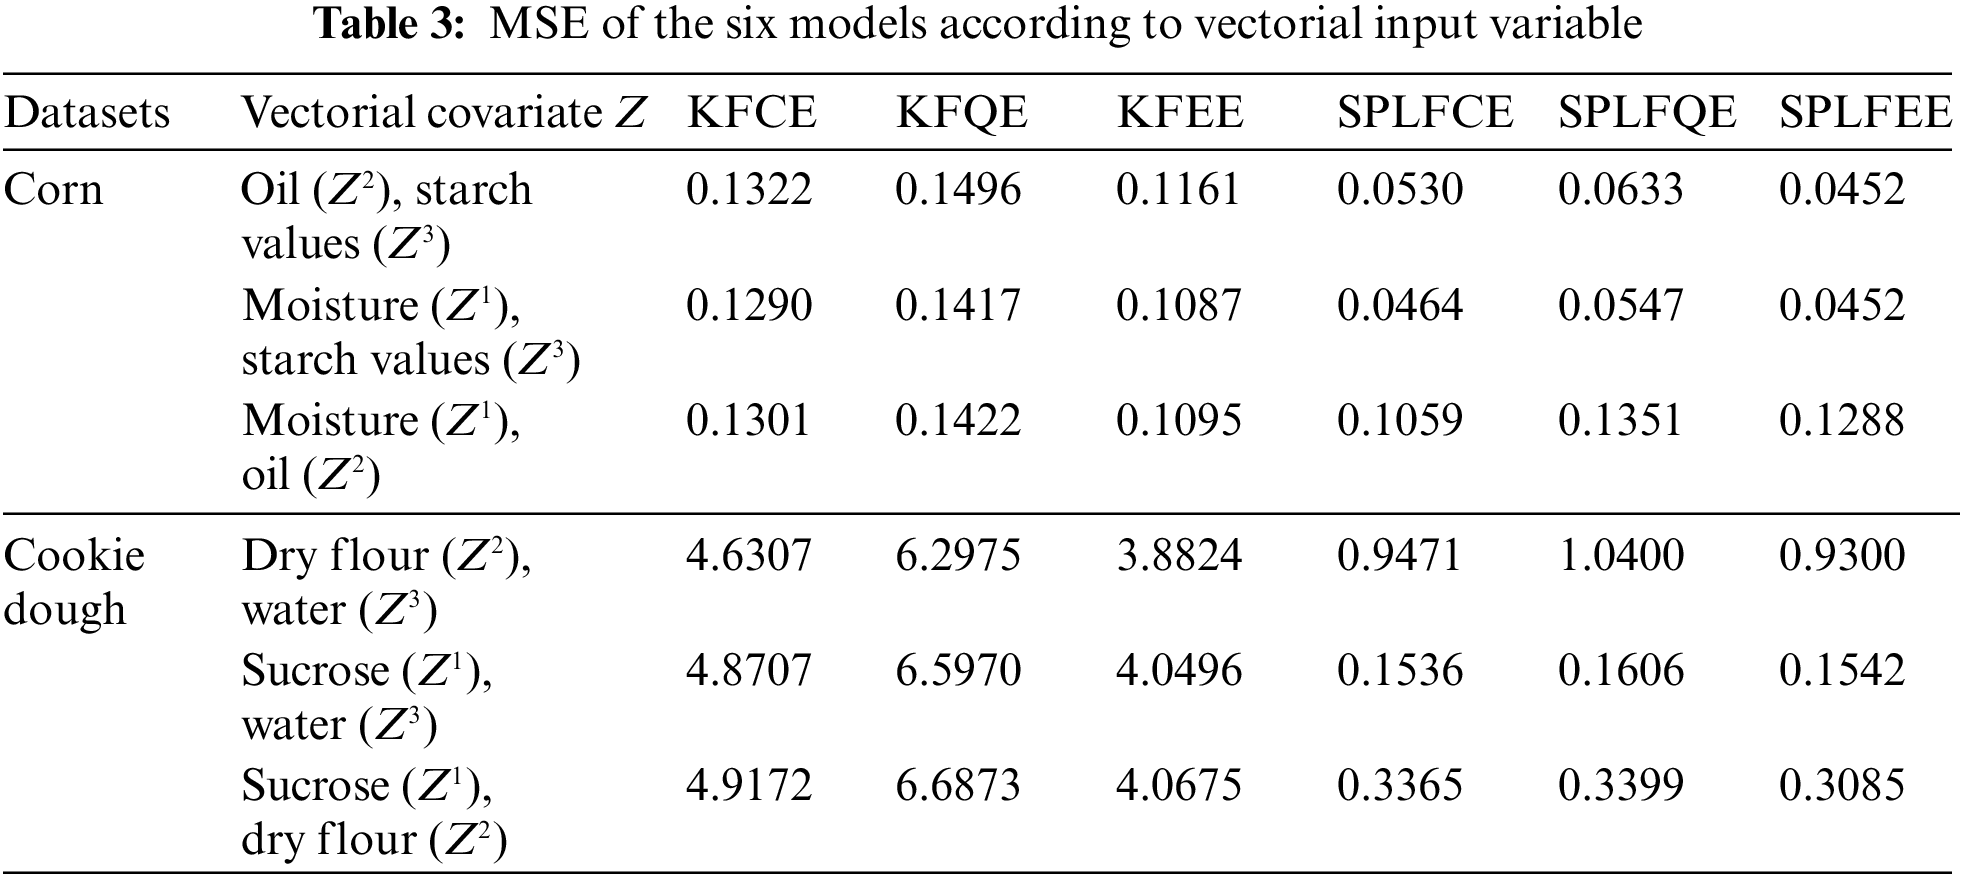
Table 3 show that the values of MSE are relatively more significant for the six proposed models, namely KFCE, KFQE, KFEE, SPLFCE, SPLFQE, and SPLFEE, in the absence of moisture
KFCE, KFQE, KFEE, SPLFCE, SPLFQE, and SPLFEE were examined and used to multivariate calibration of two small NIR spectral datasets in nonparametric functional and semi-partial linear functional statistics (80 observations of corn dataset and 72 observations of Cookie dough dataset). Protein and fat levels were measured and ranged between
The comparison of both prediction plots in Figs. 3 and 4 show that the SPLFCE, SPLFQE, and SPLFEE procedures outperform the KFCE, KFQE, and KFEE approaches. As illustrated in Figs. 5–6 and Table 3, the SPLFCE, SPLFQE, and SPLFEE models, respectively, are the best models (with a small MSE). In particular, semi-partial linear functional models with moisture quantities for corn datasets and water for cookie dough produce the best results. To the contrary, the results in Table 2 show that using semi-metrics significantly increases predictive performance with the same sample size.
Modern statistics approaches for predicting scalar responses given functional variables are examined in this paper. Corn and cookie dough quality can be predicted using cutting-edge statistical models, such as the spectroscopic approach. By contrast to traditional methods which result in data loss following transformation, the presented models do not suffer from this problem.
This work extends the multidimensional framework by setting the response variable in a dimensional space. The comparison of the generated estimator when there are outlier’s outputs is an important natural issue that we would be treating and that has not been considered in this work (see, for example, [17] and [26]). This research combines contemporary chemistry techniques with recent developments in mathematical statistics to produce effective prediction processes that use the entire curves as regressors. This research is conclusive. We may say that such a combination is economically advantageous, as well as more adaptable, resilient, and speedy. New statistical methods have been compared to traditional analytical methods as a quick and reliable alternative. For food analysis, those methods have become increasingly common in the last decade. A list of references can be found here (e.g., [27]).
Acknowledgement: The authors extend their appreciation to the Deanship of Scientific Research at King Khalid University for funding this work.
Data Availability: The corn and cookie dough data sets that used in this paper are, respectively, available at http://software.eigenvector.com/Data/Corn/index.html and https://rdrr.io/cran/ppls/man/cookie.html.
Funding Statement: This work is funded by the Deanship of Scientific Research at King Khalid University for funding this work through Large Groups Project under grant number RGP. 2/132/43.
Conflicts of Interest: The authors declare that they have no conflicts of interest to report regarding the present study.
References
1. J. H. Qu, D. Liu, J. H. Cheng, D. W. Sun, J. Ma et al., “Applications of near-infrared spectroscopy in food safety evaluation and control: A review of recent research advances,” Critical Reviews in Food Science and Nutrition, vol. 55, pp. 1939–1954, 2015. [Google Scholar]
2. D. Pan, G. Crull, S. Yin and J. Grosso, “Low level drug product API form analysis–avalide tablet NIR quantitative method development and robustness challenges,” Journal of Pharmaceutical and Biomedical Analysis, vol. 89, pp. 268–275, 2014. [Google Scholar]
3. A. O’Reilly, R. Coffey, A. Gowen and E. Cummins, “Evaluation of near-infrared chemical imaging for the prediction of surface water quality parameters,” International Journal of Environmental Analytical Chemistry, vol. 95, pp. 403–418, 2015. [Google Scholar]
4. J. M. Harnly, P. B. Harrington, L. L. Botros, J. Jablonski, C. Chang et al., “Characterization of near-infrared spectral variance in the authentication of skim and nonfat dry milk powder collection using ANOVA-PCA, pooled-ANOVA, and partial least-squares regression,” Journal of Agricultural and Food Chemistry, vol. 62, pp. 8060–8067, 2014. [Google Scholar]
5. P. Tong, Y. Du, K. Zheng, T. Wu and J. Wang, “Improvement of NIR model by fractional order Savitzky–Golay derivation (FOSGD) coupled with wavelength selection,” Chemometrics and Intelligent Laboratory Systems, vol. 143, pp. 40–48, 2015. [Google Scholar]
6. X. Shao, X. Bian, J. Liu, M. Zhang and W. Cai, “Multivariate calibration methods in near infrared spectroscopic analysis,” Analytical Methods, vol. 2, pp. 1662–1666, 2010. [Google Scholar]
7. U. Thissen, B. Üstün, W. J. Melssen and L. M. Buydens, “Multivariate calibration with least-squares support vector machines,” Analytical Chemistry, vol. 76, pp. 3099–3105, 2004. [Google Scholar]
8. F. Ferraty and P. Vieu, “Nonparametric functional data analysis: Theory and practice,” in Springer Series in Statistics, 2006. [Google Scholar]
9. T. Gasser, P. Hall and B. Presnell, “Nonparametric estimation of the mode of a distribution of random curves,” Journal of the Royal Statistical Society: Series B (Statistical Methodology), vol. 60, pp. 681–691, 1998. [Google Scholar]
10. F. Ferraty and P. Vieu, “Dimension fractale et estimation de la régression dans des espaces vectoriels semi-normés,” Comptes Rendus de L’Académie des Sciences-Series I-Mathematics, vol. 330, pp. 139–142, 2000. [Google Scholar]
11. G. Aneiros-Pérez and P. Vieu, “Semi-functional partial linear regression,” Statistics & Probability Letters, vol. 76, pp. 1102–1110, 2006. [Google Scholar]
12. G. Aneiros-Perez and P. Vieu, “Nonparametric time series prediction: A semi-functional partial linear modeling,” Journal of Multivariate Analysis, vol. 99, pp. 834–857, 2008. [Google Scholar]
13. G. Aneiros-Pérez and P. Vieu, “Automatic estimation procedure in partial linear model with functional data,” Statistical Papers, vol. 52, pp. 751–771, 2011. [Google Scholar]
14. H. L. Shang, “Bayesian bandwidth estimation for a semi-functional partial linear regression model with unknown error density,” Computational Statistics, vol. 29, pp. 829–848, 2014. [Google Scholar]
15. N. Ling and P. Vieu, “On semiparametric regression in functional data analysis,” in Wiley Interdisciplinary Reviews: Computational Statistics, Wiley Online Library, pp. e1538, 2021. [Google Scholar]
16. N. Ling, R. Kan, P. Vieu and S. Meng, “Semi-functional partially linear regression model with responses missing at random,” Metrika, vol. 82, pp. 39–70, 2019. [Google Scholar]
17. M. Benallou, M. K. Attouch, T. Benchikh and O. Fetitah, “Asymptotic results of semi-functional partial linear regression estimate under functional spatial dependency,” Communications in Statistics-Theory and Methods, vol. 51, pp. 1–21, 2021. [Google Scholar]
18. A. Laksaci, M. Lemdani and E. Ould-Saïd, “A generalized L1-approach for a kernel estimator of conditional quantile with functional regressors: Consistency and asymptotic normality,” Statistics & Probability Letters, vol. 79, pp. 1065–1073, 2009. [Google Scholar]
19. H. Ding, Z. Lu, J. Zhang and R. Zhang, “Semi-functional partial linear quantile regression,” Statistics & Probability Letters, vol. 142, pp. 92–101, 2018. [Google Scholar]
20. C. Kuan, J. Yeh and Y. Hsu, “Assessing value at risk with CARE, the conditional autoregressive expectile models,” Journal of Econometrics, vol. 150, pp. 261–270, 2009. [Google Scholar]
21. W. Ehm, T. Gneiting, A. Jordan and F. Krüger, “Of quantiles and expectiles: Consistent scoring functions, choquet representations and forecast rankings,” Journal of the Royal Statistical Society: Series B: Statistical Methodology, vol. 78, pp. 505–562, 2016. [Google Scholar]
22. X. Bian, S. Li, X. Shao and P. Liu, “Variable space boosting partial least squares for multivariate calibration of near-infrared spectroscopy,” Chemometrics and Intelligent Laboratory Systems, vol. 158, pp. 174–179, 2016. [Google Scholar]
23. P. Brown, T. Fearn and M. Vannucci, “Bayesian wavelet regression on curves with application to a spectroscopic calibration problem,” Journal of the American Statistical Association, vol. 96, pp. 398–408, 2001. [Google Scholar]
24. F. Ferraty, A. Laksaci, A. Tadj and P. Vieu, “Rate of uniform consistency for nonparametric estimates with functional variables,” Journal of Statistical Planning and Inference, vol. 140, pp. 335–352, 2010. [Google Scholar]
25. M. Mohammedi, S. Bouzebda and A. Laksaci, “The consistency and asymptotic normality of the kernel type expectile regression estimator for functional data,” Journal of Multivariate Analysis, vol. 181, pp. 104673, 2021. [Google Scholar]
26. G. Boente and A. Vahnovan, “Robust estimators in semi-functional partial linear regression models,” Journal of Multivariate Analysis, vol. 154, pp. 59–84, 2017. [Google Scholar]
27. I. Almanjahi, Z. Chiker-El-Mezouar, A. Laksaci and M. Rachdi, “kNN local linear estimation of the conditional cumulative distribution function: Dependent functional data case,” C. R. Math. Acad. Sci. Paris, vol. 356, pp. 1036–1039, 2018. [Google Scholar]
Cite This Article
 Copyright © 2023 The Author(s). Published by Tech Science Press.
This work is licensed under a Creative Commons Attribution 4.0 International License , which permits unrestricted use, distribution, and reproduction in any medium, provided the original work is properly cited.
 Downloads
 Citation Tools