
 Submit a Paper
 Propose a Special lssue
 Open Access
ARTICLE

New Trends in Fuzzy Modeling Through Numerical Techniques
1 Department of Mathematics, College of Sciences, King Khalid University, Abha, 61413, Saudi Arabia
2 Department of Mathematics, Faculty of Sciences and Technology, University of Central Punjab, Lahore, Pakistan
3 Department of Mathematics, School of Science, University of Management and Technology, Lahore, Pakistan
4 Department of Automation, Biomechanics and Mechatronics, Lodz University of Technology, 1/15 Stefanowskiego St., 90-924, Lodz, Poland
5 Department of Mathematics and Statistics, University of Lahore, Lahore, Pakistan
6 Department of Mathematics, Govt. Maulana Zafar Ali Khan Graduate College Wazirabad, Punjab Higher Education Department (PHED), Lahore, 54000, Pakistan
7 Institute of Machine Tools and Production Engineering, Lodz University of Technology, Poland
8 Department of Mathematics, College of Science, Taif University, P. O. Box, 11099, Taif, 21944, Saudi Arabia
* Corresponding Author: Fazal Dayan. Email:
Computers, Materials & Continua 2023, 74(3), 6371-6388. https://doi.org/10.32604/cmc.2023.033553
Received 20 June 2022; Accepted 02 September 2022; Issue published 28 December 2022
 View Full Text
 Download PDF
Abstract
Amoebiasis is a parasitic intestinal infection caused by the highly pathogenic amoeba Entamoeba histolytica. It is spread through person-to-person contact or by eating or drinking food or water contaminated with feces. Its transmission rate depends on the number of cysts present in the environment. The traditional models assumed a homogeneous and contradictory transmission with reality. The heterogeneity of its transmission rate is a significant factor when modeling disease dynamics. The heterogeneity of disease transmission can be described mathematically by introducing fuzzy theory. In this context, a fuzzy SEIR Amoebiasis disease model is considered in this study. The equilibrium analysis and reproductive number are studied with fuzziness. Two numerical schemes forward Euler method and a nonstandard finite difference (NSFD) approach, are developed for the learned model, and the results of numerical simulations are presented. The numerical and simulation results reveal that the proposed NSFD method provides an adequate representation of the dynamics of the disease despite the uncertainty and heterogeneity. Moreover, the obtained method generates plausible predictions that regulators can use to support decision-making to design and develop control strategies.Keywords
The protozoan Entamoeba histolytica causes amoebiasis disease, and it is the second leading cause of protozoan death in the world after malaria [1]. About 50 million people worldwide are infected with this disease, and 0.1 million die yearly [2]. It is a severe public health problem in China and some regions of Latin America, Asia, and Africa. Schaudinn introduced the name Entamoeba histolytica in 1903 for the ability of the parasite to cause tissue lysis [3]. Amoebiasis transfers directly through human-to-human contact or indirectly by eating or drinking food or water contaminated with feces. Its transmission through sexual contact, particularly among homosexual men, may also occur [4,5]. Mature cysts of the Entamoeba histolytica can survive a few weeks in soil, 12 days in a relaxed, moist environment, and 30 days in water for reinfection. They can be kept alive at temperatures below 50°C and above 400°C [6]. The cyst is the infectious, nonmotile form of the parasite that is excised as it progresses through the gastrointestinal tract. Generally, the incubation period is 2 to 4 weeks, but it can last a few months or a few years [7]. Amoebiasis remains a severe health problem in developing countries where health infrastructure and health education are inadequate. Immigration and increased international population movements have had an impact on the occurrence of the disease.
Mathematical modeling has played a vital role in better understanding the behavior of infectious diseases. Chitnis et al. proposed a mathematical model of malaria spread in human and mosquito populations [8]. Niger et al. also studied the malaria model involving three stages of immunity and a backward bifurcation [9]. Many other researchers also studied a malaria model to describe its spread [10–14]. Arif et al. studied a stochastic epidemic model [15]. A stochastic dengue model was checked by Shatanawi et al. [16]. Noor et al. developed a stochastic model to study the Covid 19 dynamics [17]. Yu et al. looked at Covid 19 with a delay factor [18]. Fahmy formulated a boundary element method (BEM) to solve a nonlinear space-time problem of dual-phase-lag fractional bioheat transfer during electromagnetic radiation [19]. Abodayeh et al. studied a vector-borne plant disease model in deterministic and stochastic senses [20].
Most existing mathematical models of disease dynamics are crisp and precise, while many real-world situations are neither crisp nor deterministic. Therefore, these models cannot accurately describe conditions. The idea of the fuzzy set was introduced by Zadeh [21], who assigns each set member a value representing its degree of membership. Considering a fuzzy set representing recovery from infection, we can assign values from 0 to 1. That statement need not be accurate or false when someone says someone is recovering from a disease. The degree to which this recovered person belongs to that population group may be valid. The membership level of 0 indicates low recovery, 0.5 medium recoveries, and one high recovery after infection.
Fuzzy sets and fuzzy logic have been widely used to solve real-world problems in engineering, medicine, economics, and many other fields where human decision-making is critical through evaluation and reasoning [22–26]. Researchers have also used the theory in epidemiology. Barros et al. presented an SI model using fuzzy theory [27]. Torres et al. proposed multiresolution and fuzzy systems to represent cases of dengue and severe dengue, respectively, in Colombia [28]. The obtained results were compared with traditional fuzzy methods. Mondal et al. proposed an SIS model with a treatment control in fuzzy transmission [29]. Li et al. proposed a fuzzy SEIR model and confidence index theory to describe the dynamics of coronavirus disease [30]. Chen et al. proposed a new approach to handle the high-dimensional uncertain SIR model [31]. Abdy et al. presented a SIR model having fuzzy parameters to describe the COVID-19 dynamics [32]. Allehiany et al. studied a fuzzy SIR model by developing Euler, RK-4, and NSFD methods, respectively [33].
Fuzzy reproduction number (FRN) was also studied. The idea of the NSFD scheme was proposed by Mickens [34]. Many researchers have used the theory to solve the system of differential equations [35–38], to mention a few. Dayan et al. constructed an NSFD scheme to solve a SEIQR model describing COVID-19 [39]. Adak et al. studied an SIS model with treatment control using fuzzy numbers [40]. For example, many other researchers also used fuzzy theory to study disease dynamics. Reliable solutions are needed when it comes to issues related to human health. Uncertainties arise due to the variable nature of the parameters used in the mathematical models, as these parameters depend on the virus load of the disease. The virus load is not the same for all individuals in the population for many reasons, such as different age groups, levels of resistance, other habits, customs, etc. Due to these differences, models capable of dealing with these problems are needed. Fuzzy theory is a valuable tool for studying issues that contain uncertainties. With this in mind, the Euler and NSFD schemes for the studied model are developed in a fuzzy way to gain a broader understanding of the disease.
The development, accomplishment, and numerical analysis of the first-order explicit numerical technique with NSFD in a fuzzy environment, especially with fuzzy parameters, is the novelty of the current work. To our knowledge, the model under study has not been analyzed before in NSFD and fuzzy senses in the literature, and this is the first study of this model in this sense.
The remaining paper is designed as we started with a fuzzy SEIR model, and mathematical analysis of the model is presented. The following section contains the formulation of the forward Euler and NSFD mathematical techniques and their simulation results. The final section of the article concludes it.
2 Fuzzy SEIR Model of Amoebiasis Disease
We considered the fuzzy SEIR model describing the dynamics of Amoebiasis disease as follows.
The corresponding fuzzy SEIR model can be written as
where
The death rate
The recovery rate
where
Case 1: When
Case 2: When
Case 3: When
The points
2.2 The Fuzzy Basic Reproductive Number
The reproductive number
Case 1: When
Case 2: When
Case 3: When
The basic reproduction number
The expected value of a TFN
Now by using Eqs. (17) and (18), we find
The sensitivity of a variable is defined as [43]
We find sensitivity of the
These results show that
Forward Euler scheme for the system (5)–(8) is
Case 1: When
Case 2: When
Case 3: When
The numerical simulations for the forward Euler’s method are given below for a certain period of time.
The subpopulations for case 1 at DFE are shown in Fig. 1. The results show a convergence at
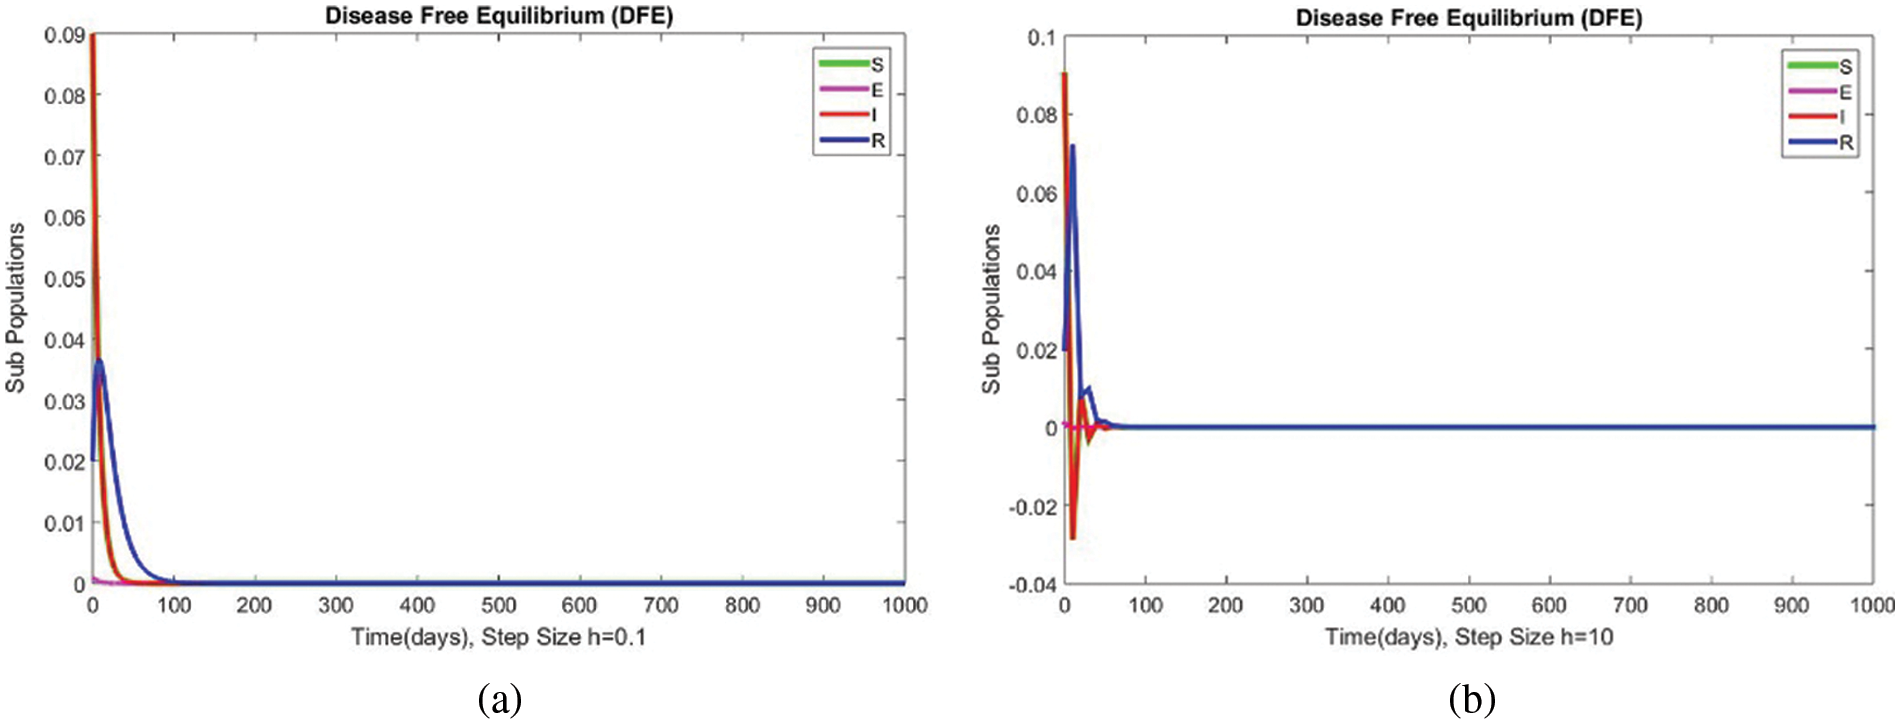
Figure 1: The portion of subpopulations for case 1 at different step sizes
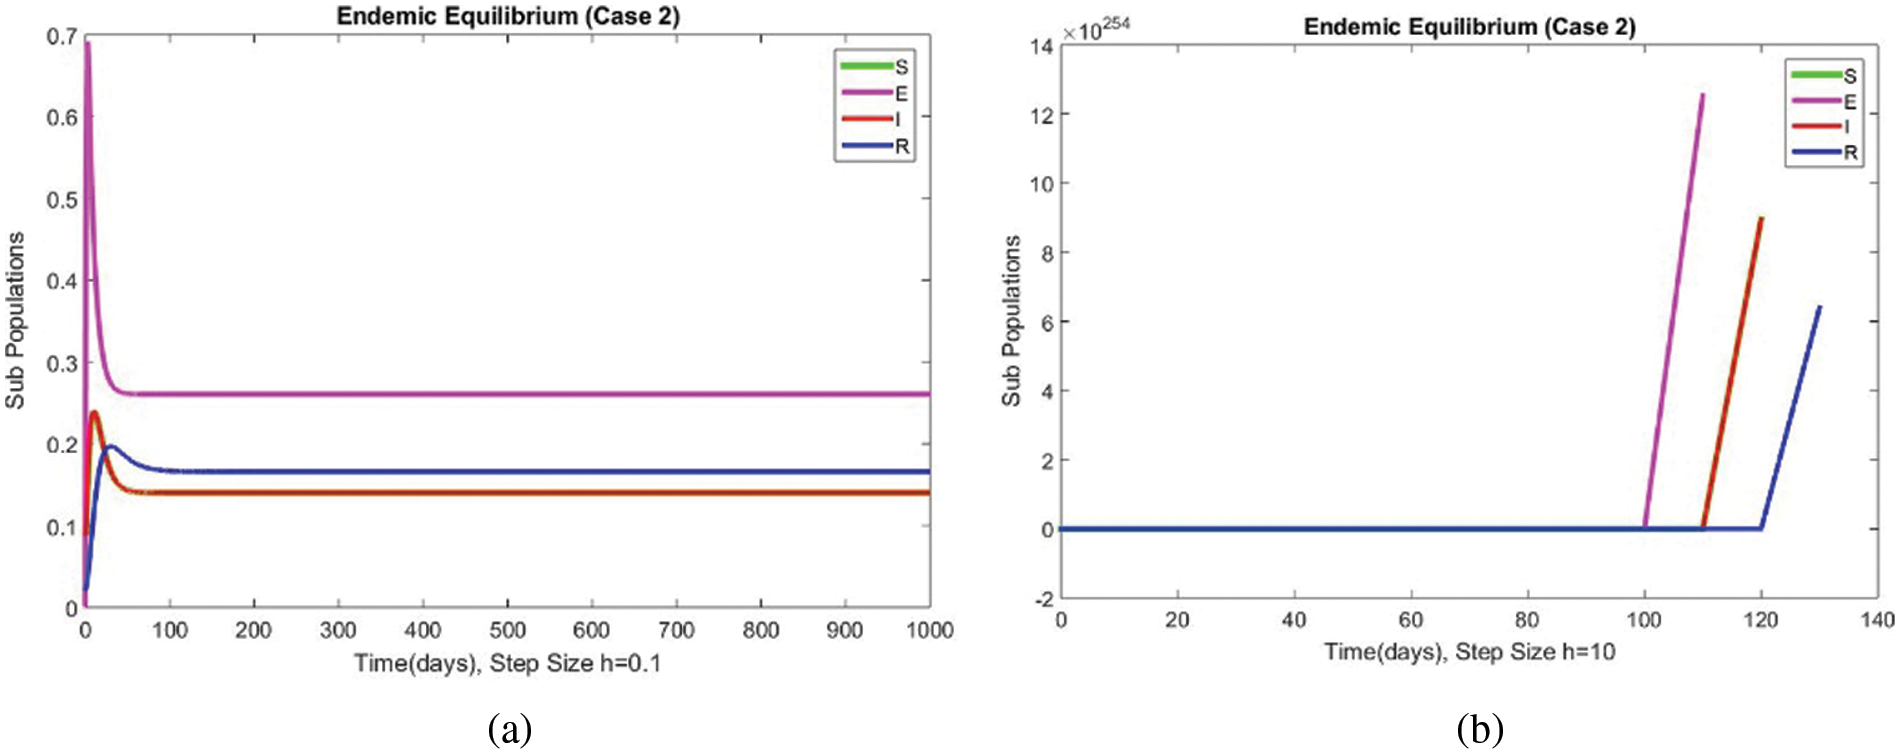
Figure 2: The portion of subpopulations for case 2 at different step sizes
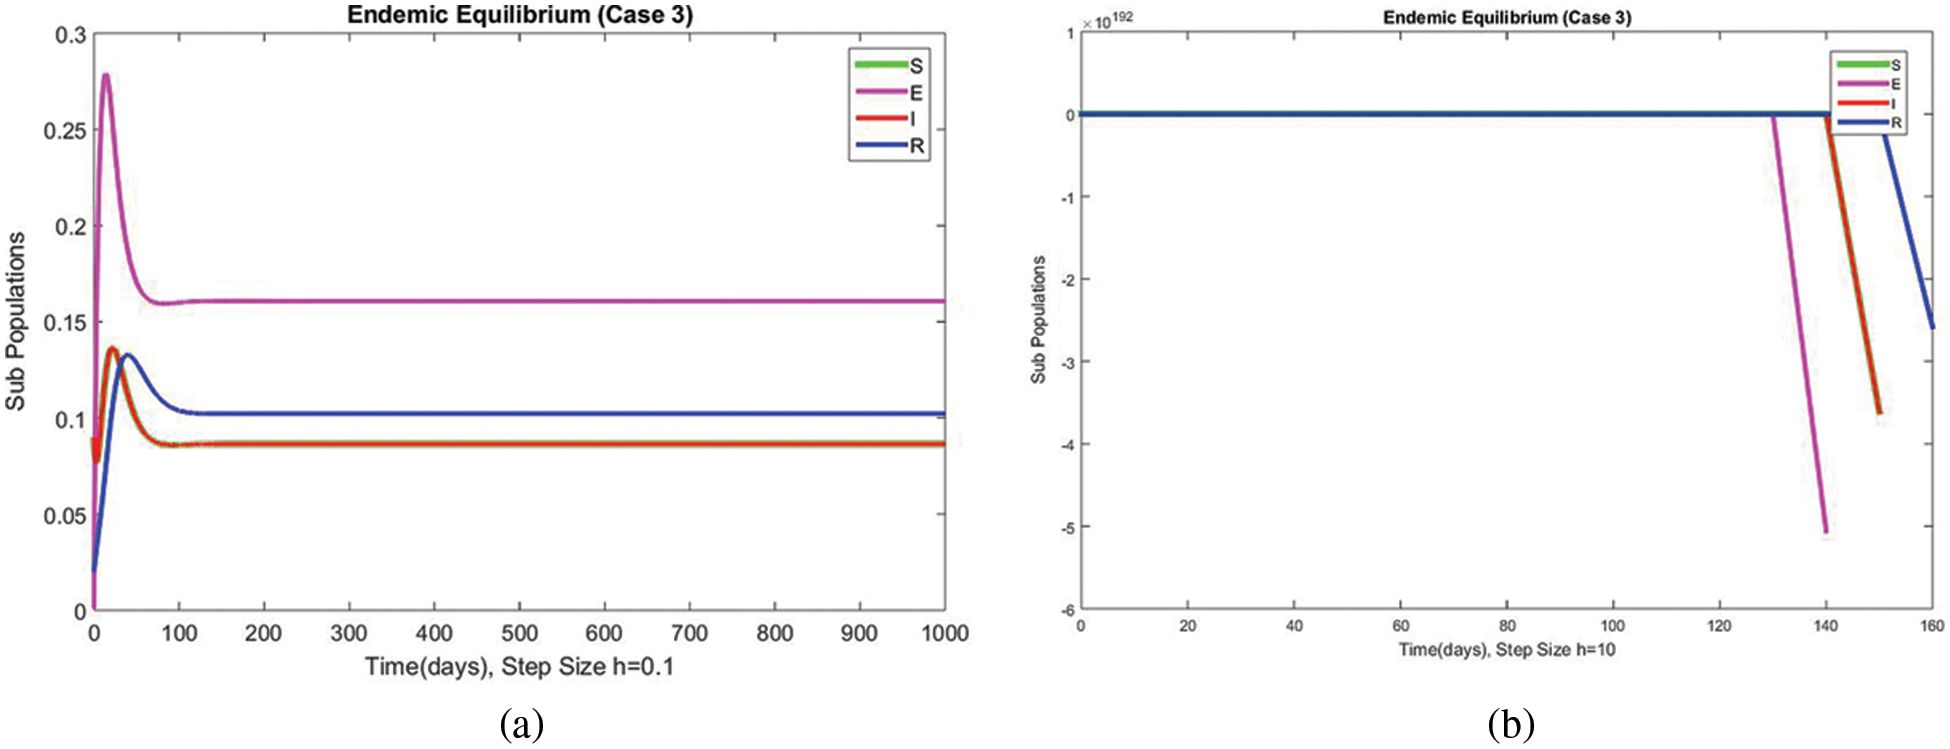
Figure 3: The portion of subpopulations for case 3 at different step sizes
In the following sub-section, we will develop another numerical scheme to overcome these issues and get stable solutions for the studied model.
3.2 Nonstandard Finite Difference (NSFD) Scheme
NSFD scheme for the system (5)–(8) is
Case 1: When
In Fig. 4, the compartment S is shown at minimal and considerable time step values, respectively, at the DFE. In both cases, the results are positive and converge to the same equilibrium points. Convergence and positivity are the core features of the epidemic models, and our proposed method possesses both qualities in this case. Fig. 5 represents the second compartment of the studied model at the DFE. The results are drawn for the time step sizes
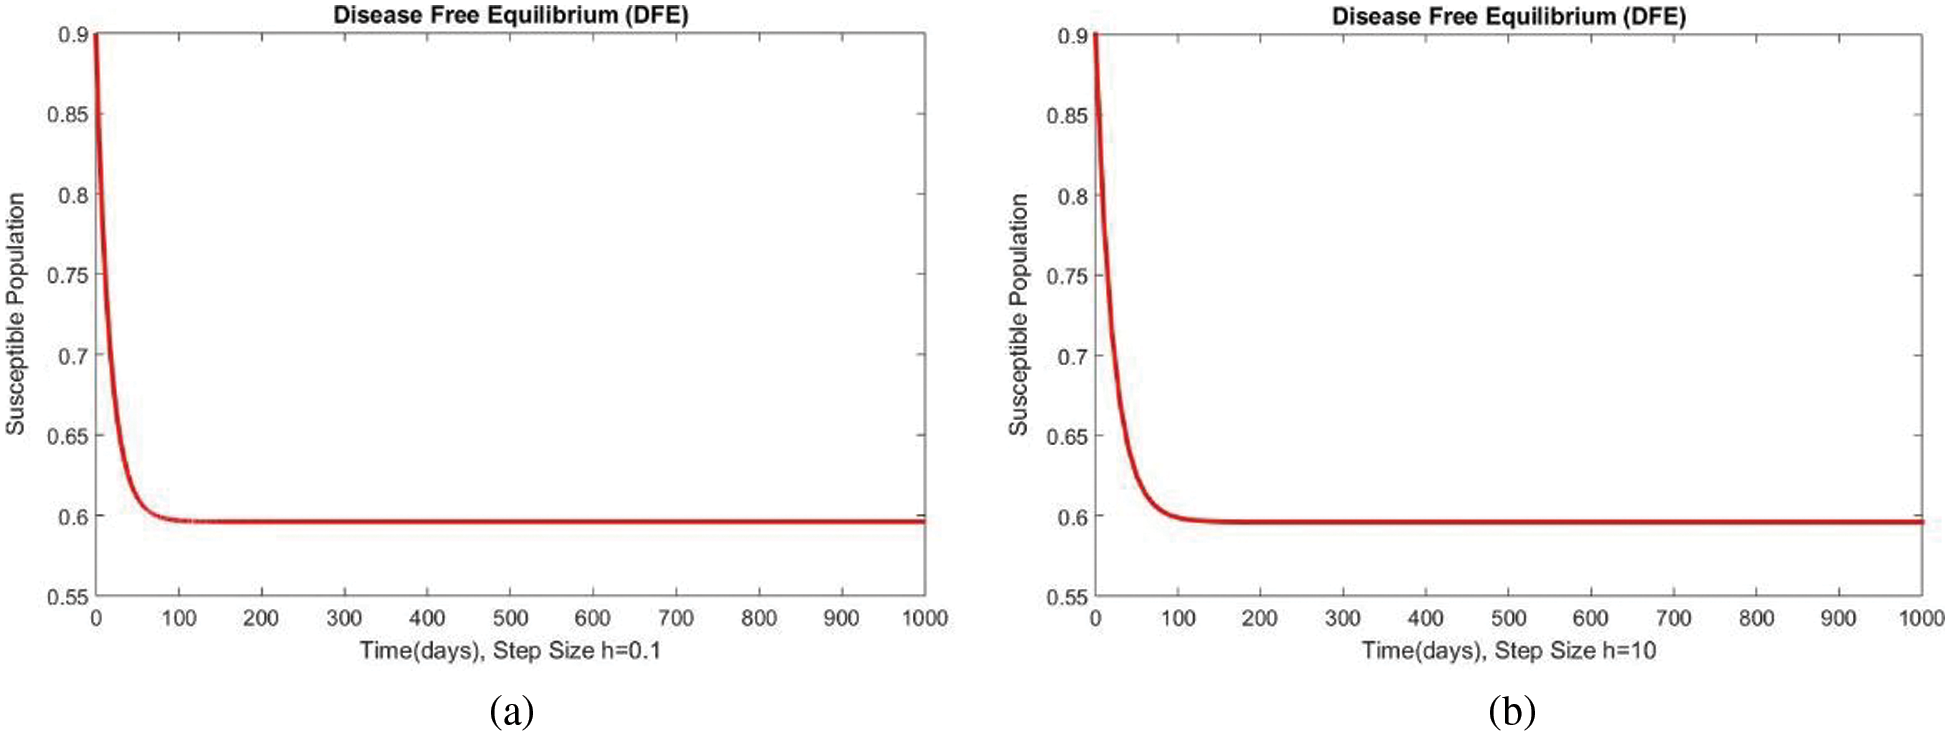
Figure 4: The portion of susceptible populations for case 1 at different step sizes
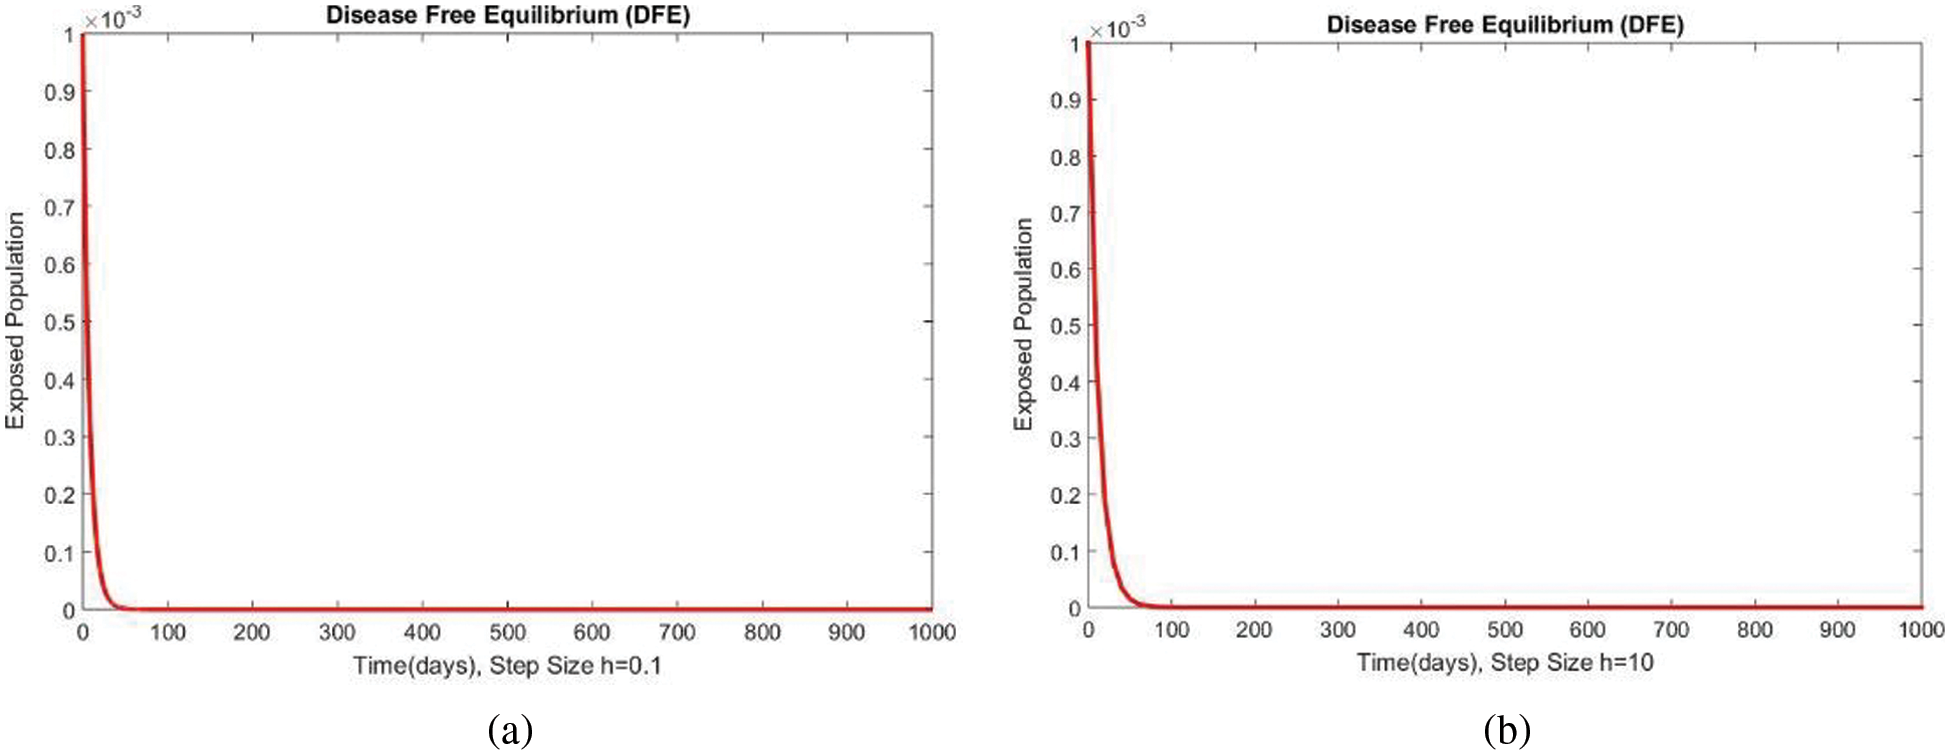
Figure 5: The portion of exposed populations for case 1 at different step sizes
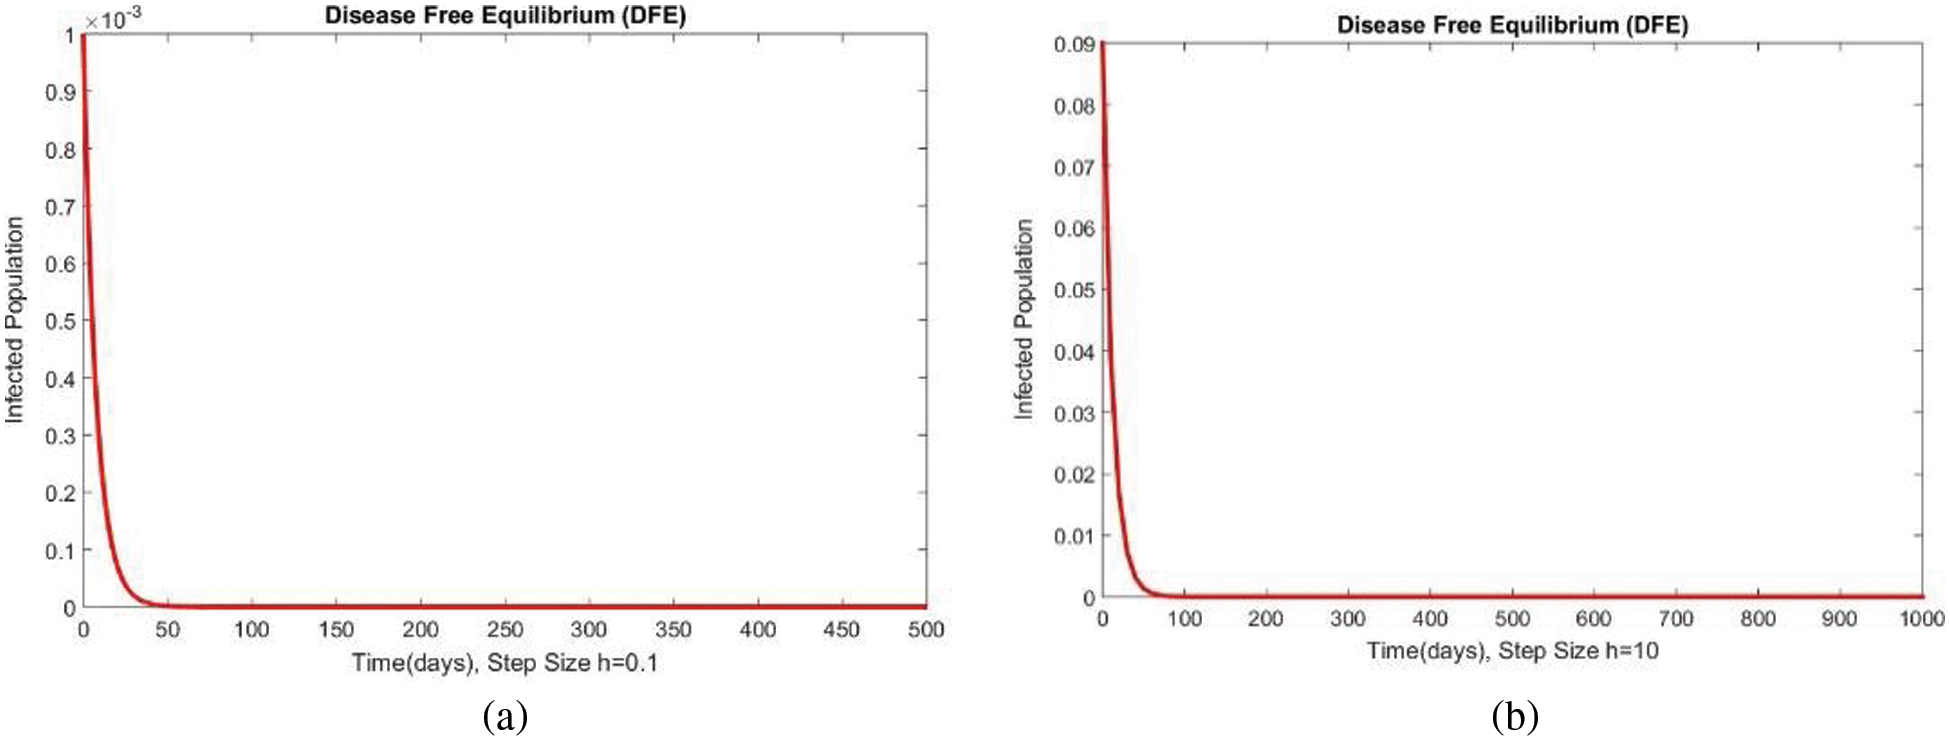
Figure 6: The portion of infected populations for case 1 at different step sizes
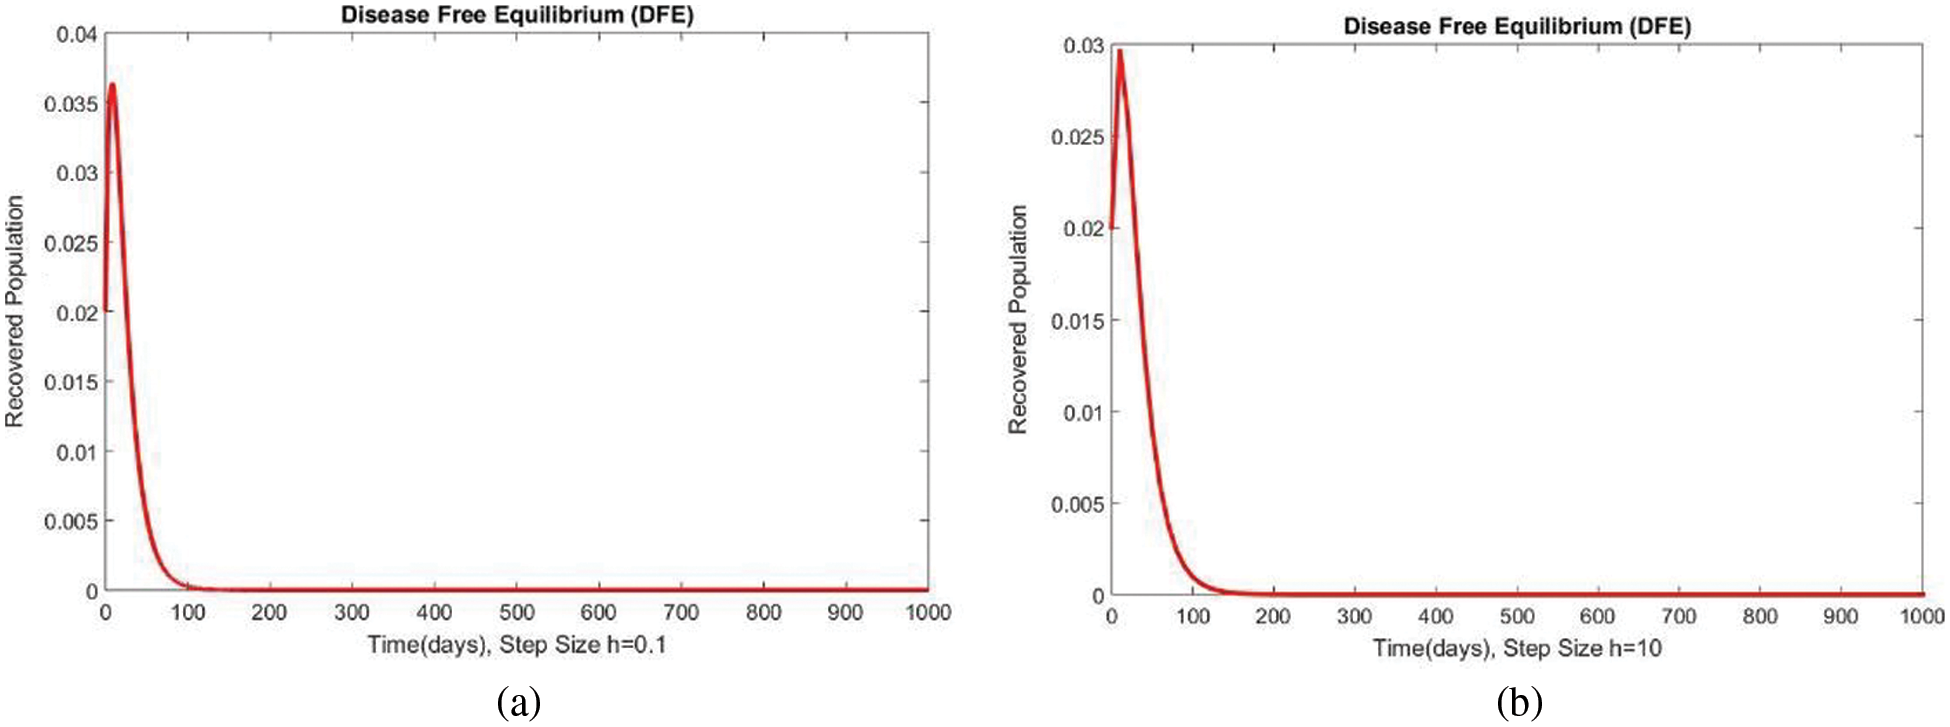
Figure 7: The portion of recovered populations for case 1 at different step sizes
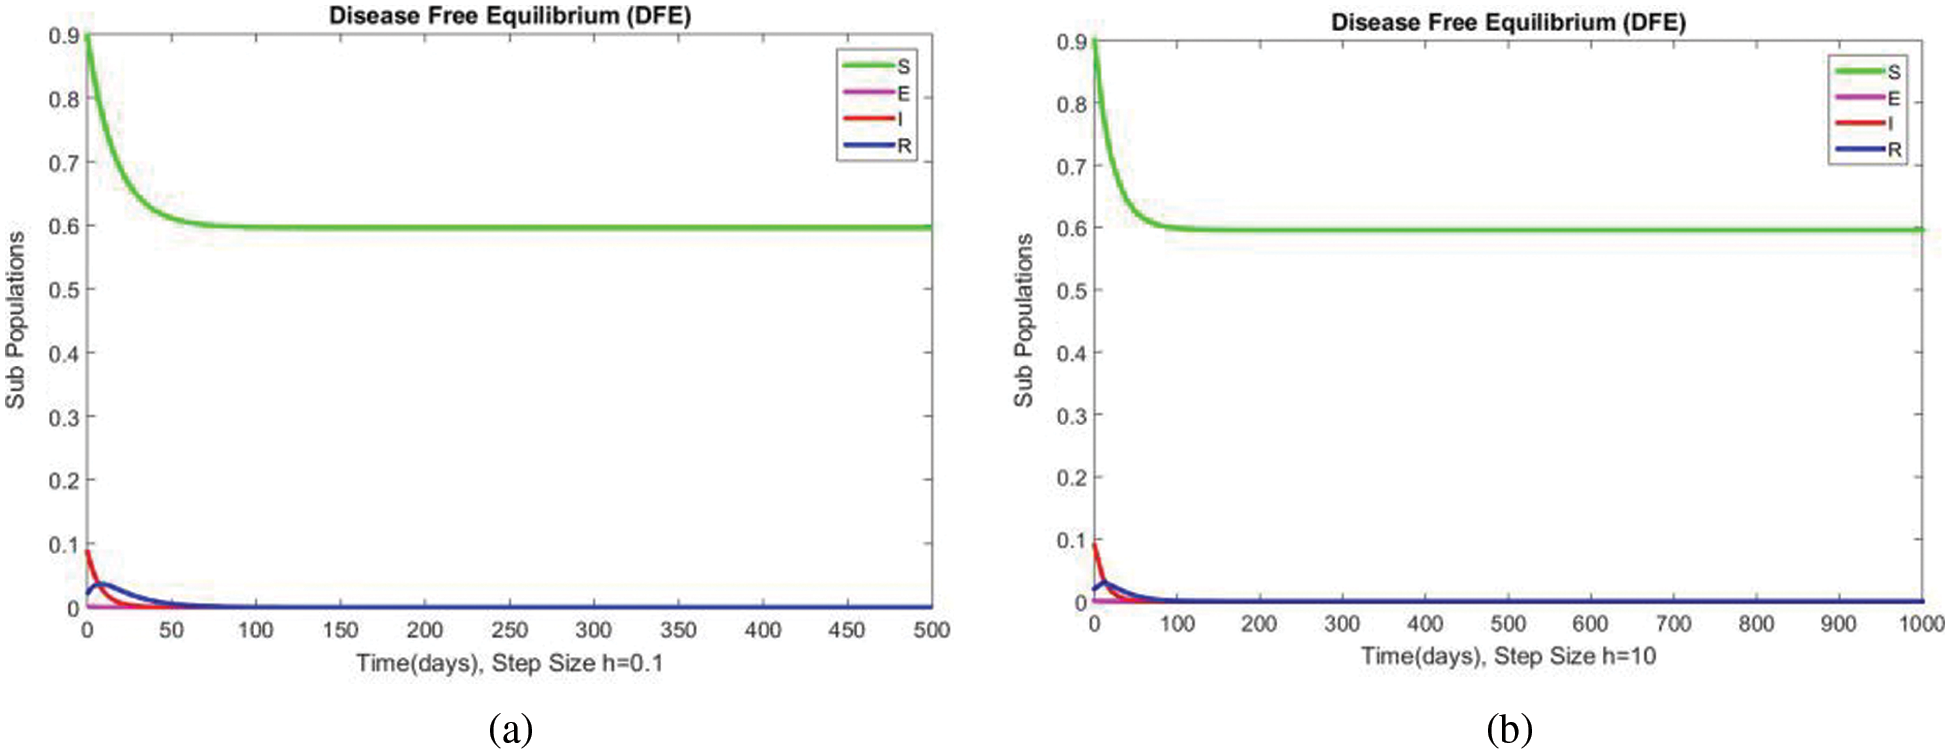
Figure 8: The portion of subpopulations for case 1 at different step sizes
Case 2: When
Figs. 9 and 10 show the results of the exposed and infected compartments, respectively, at the EE for case 2. The graphs reflect a converging behavior at a small and a significant time step size, respectively. The subpopulations at EE for case 2 are shown in Fig. 11. Convergence to the same steady state points is reflected in the above graphs. From this behavior, we conclude that the disease spread procedure at the first EE point, i.e., case 2, can be studied using our proposed method.
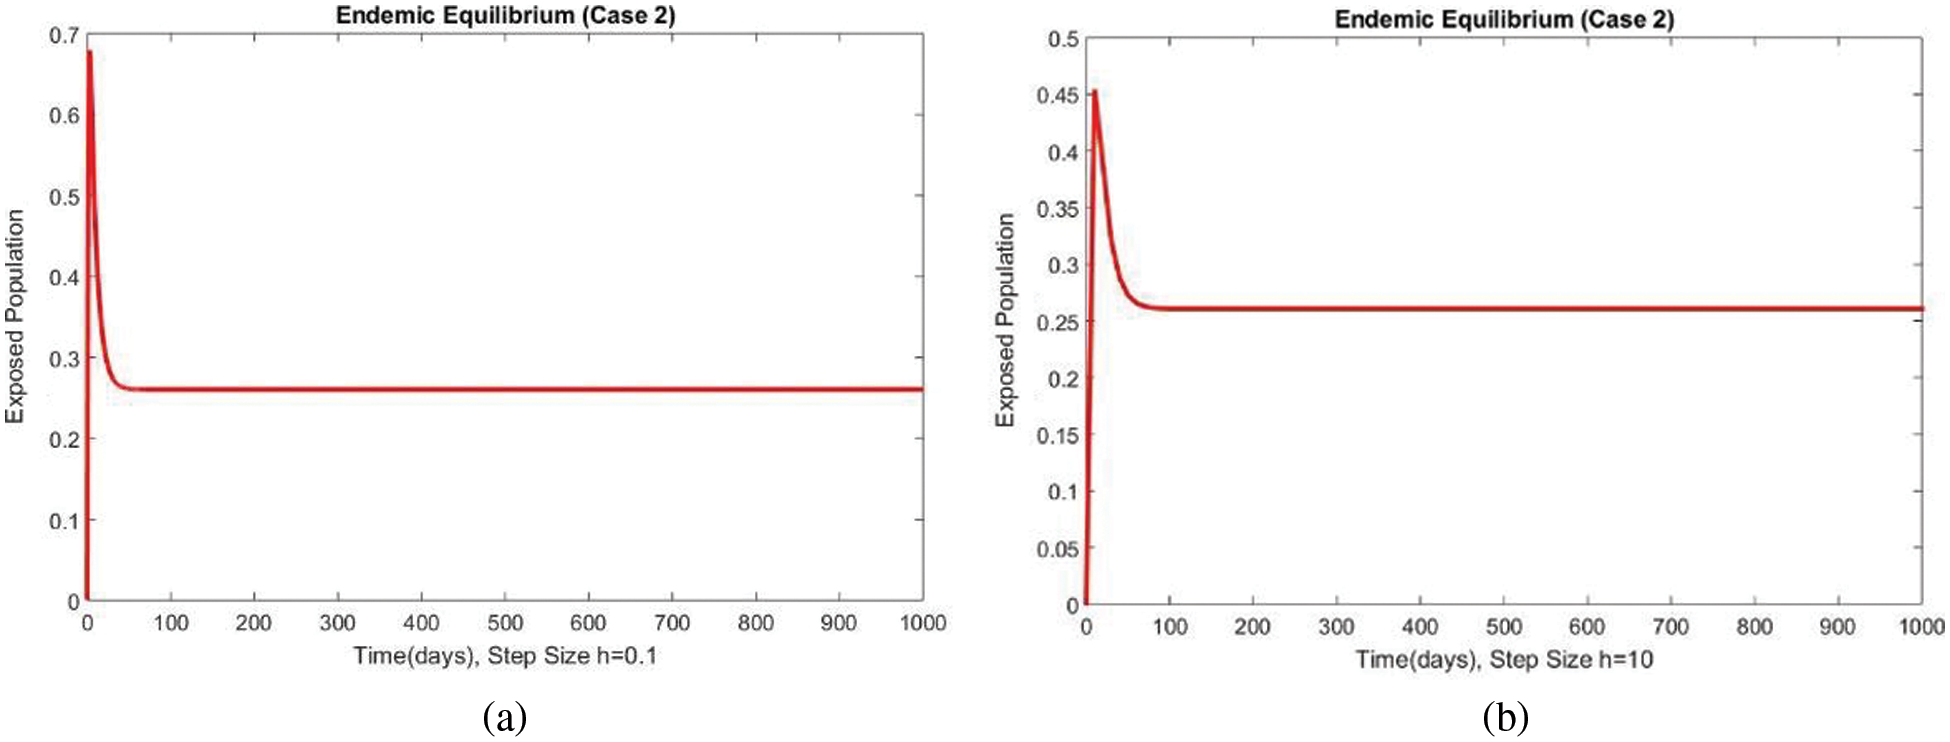
Figure 9: The portion of exposed populations for case 2 at different step sizes
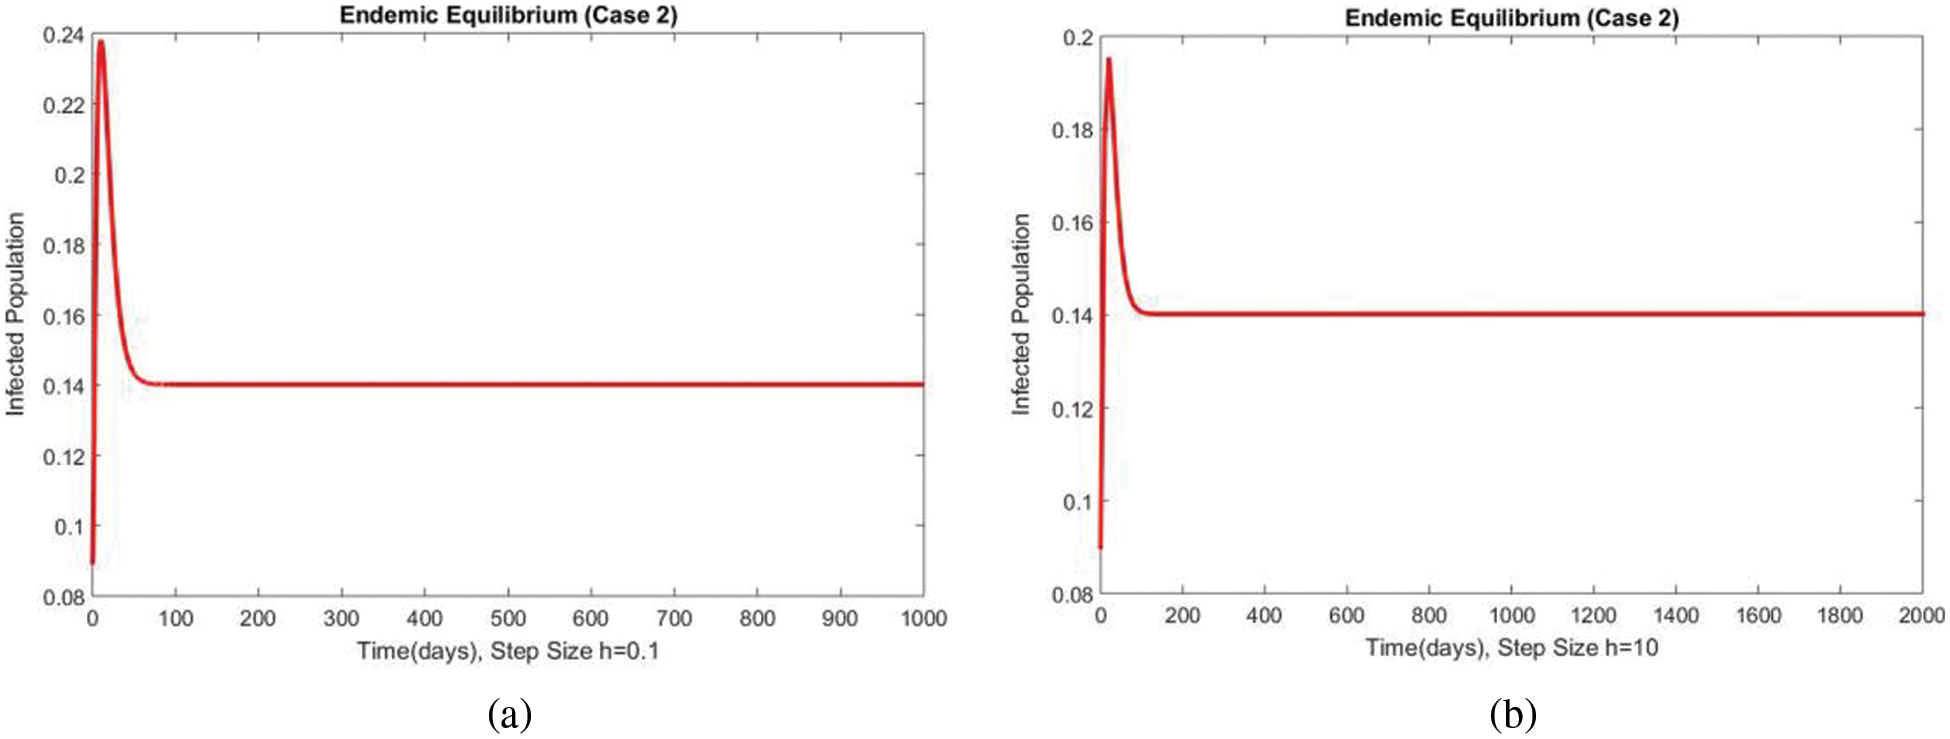
Figure 10: The portion of subpopulations for case 2 at different step sizes
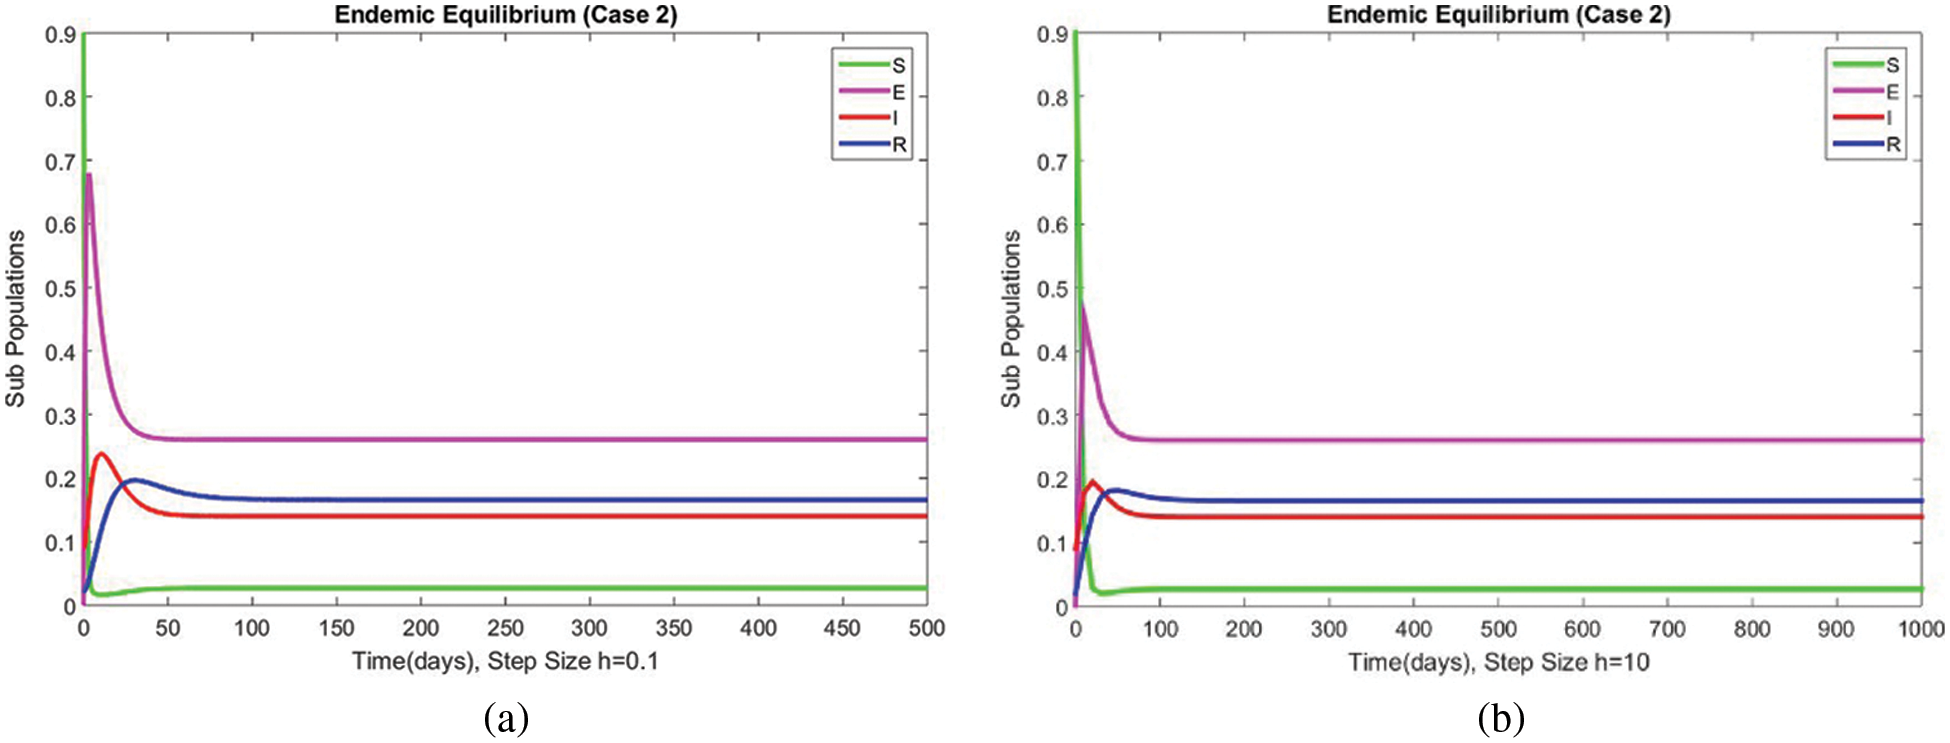
Figure 11: The portion of subpopulations for case 2 at different step sizes
Case 3: When
The graphical behaviors of the exposed and infected compartments are shown in Figs. 12 and 13, respectively, for case 3 at the EE. Convergence to the actual equilibrium points can easily be seen in these graphs. Fig. 14 shows the subpopulations at the EE for case 3. It can be seen that all compartments are converging to the same steady state. From the above numerical experiments, it is easy to conclude that the proposed numerical approach combines unconditionally even for large time step values. Further, it can be supposed that the proposed scheme can be considered a suitable tool to study the spread of amoebiasis in the human population.
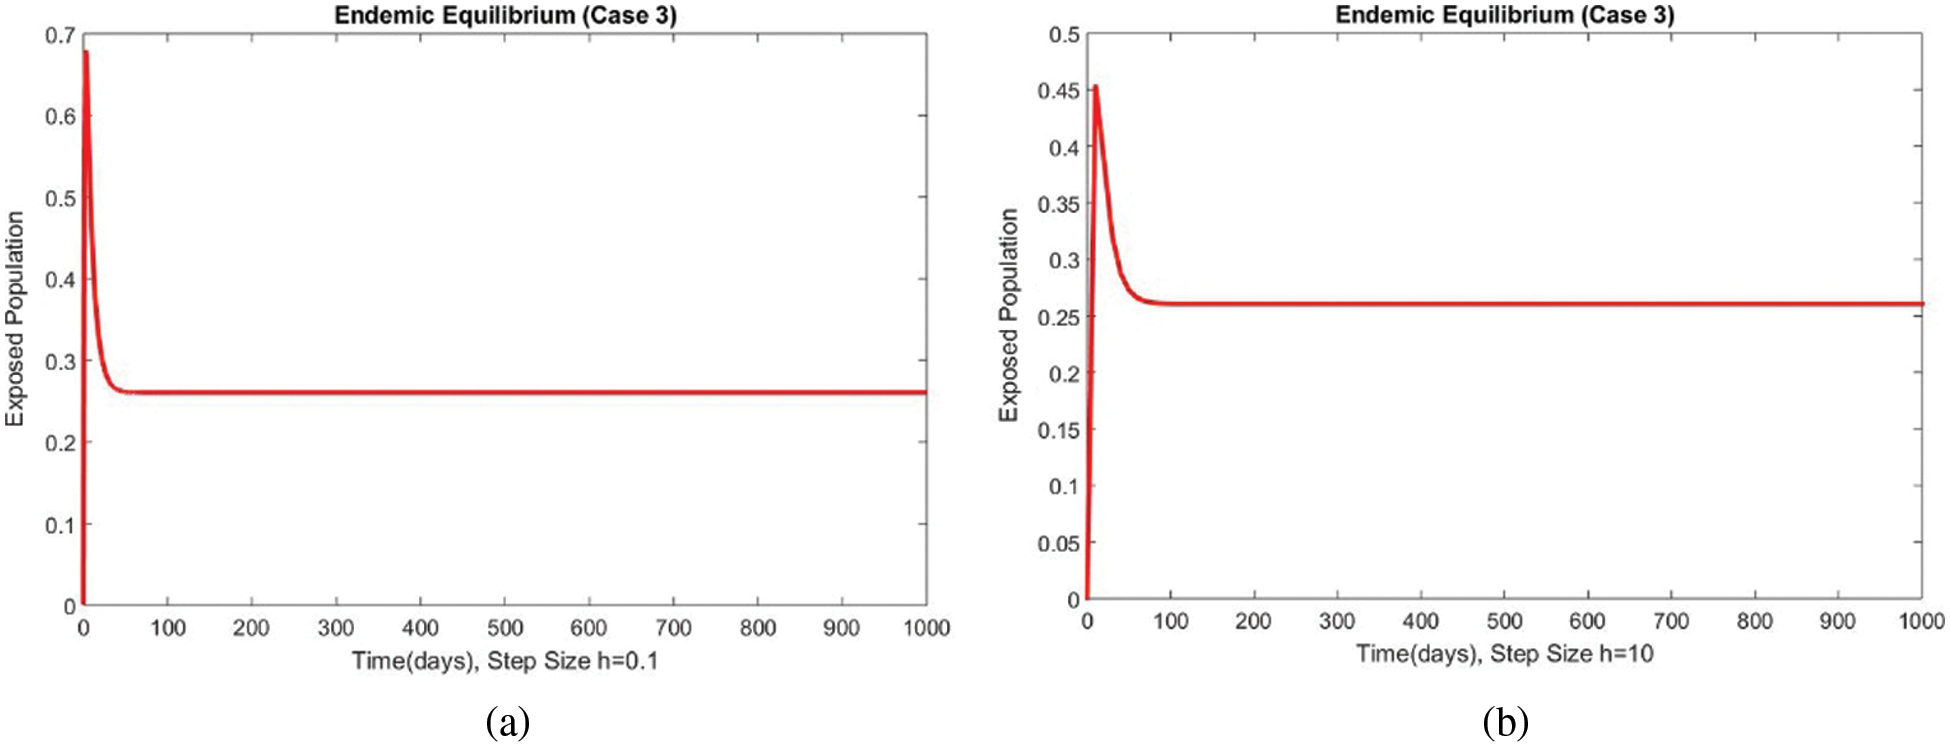
Figure 12: The portion of exposed populations for case 3 at different step sizes
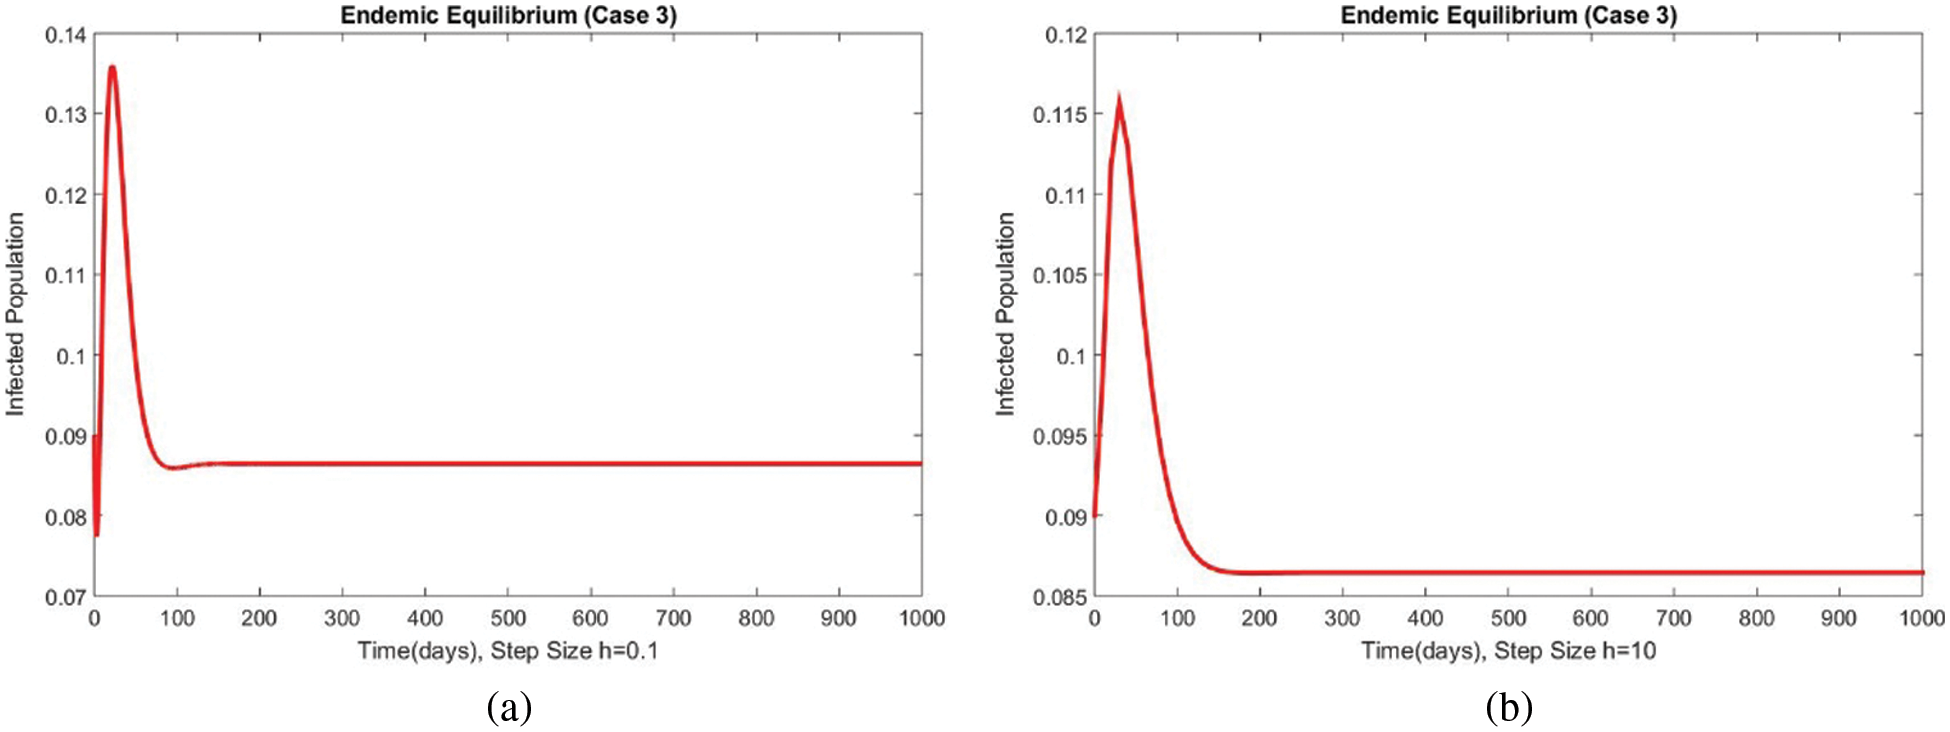
Figure 13: The portion of infected populations for case 3 at different step sizes
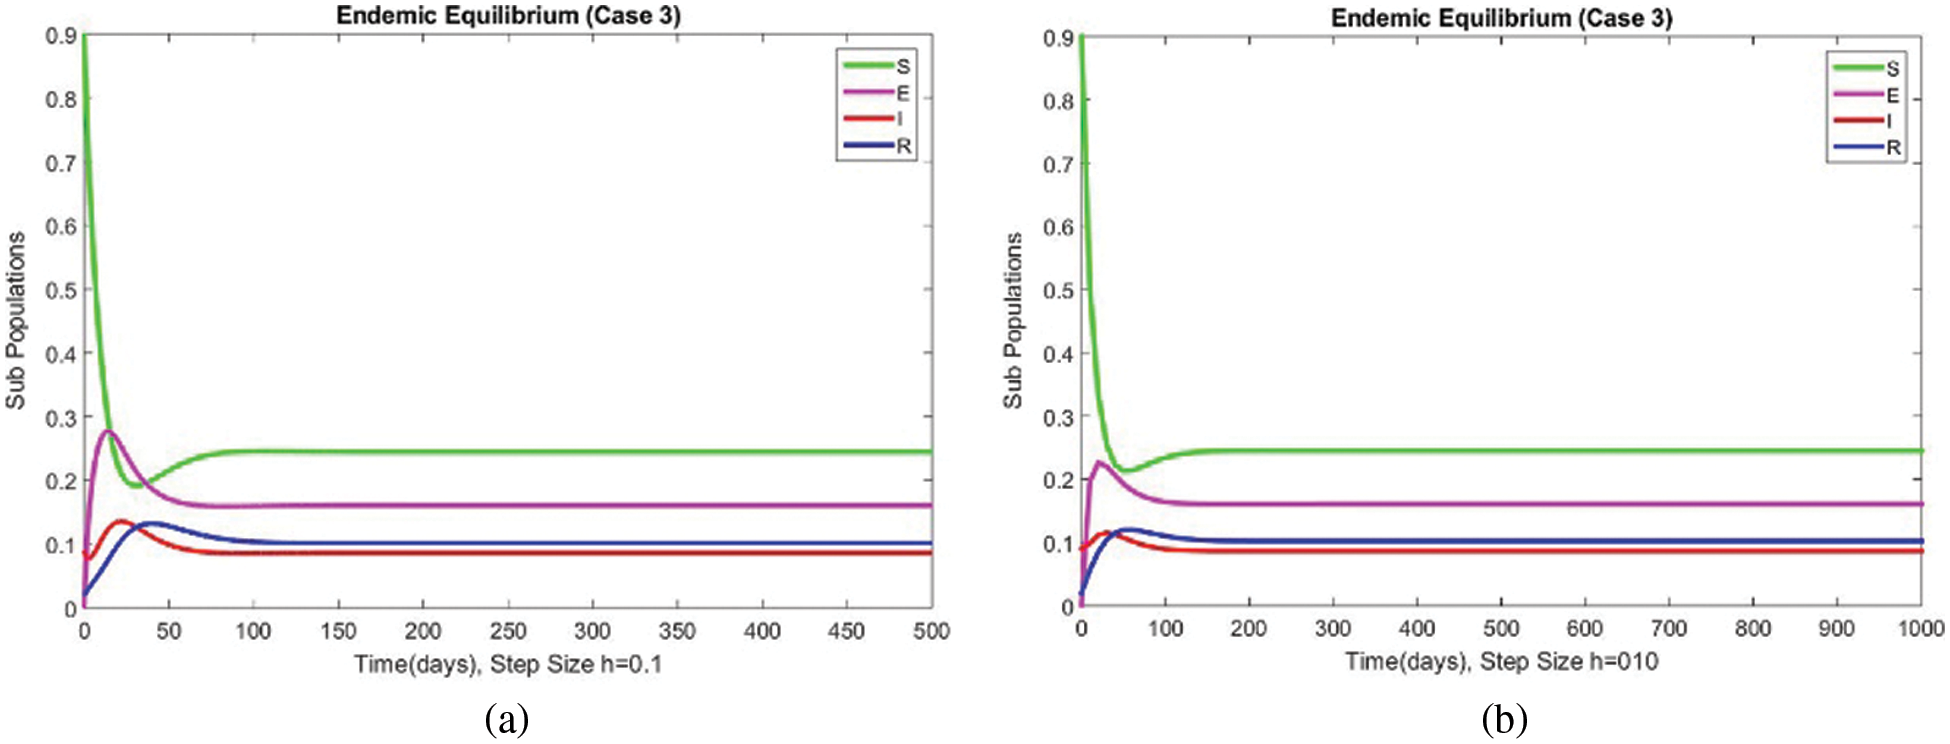
Figure 14: The portion of subpopulations for case 3 at different step sizes
3.3 Convergence of the NSFD Scheme
Let
The Jacobian matrix corresponding to the system (52)–(55) is
Jacobian at the DFE is
Eigenvalues of the above jacobian matrix are
This article studies a fuzzy-based model to investigate the dynamics of Amoebiasis infection in humans. The principal objective of this study was to construct and execute a numerical and mathematical model for a better understanding of the dynamics of the disease. We discussed the model’s equilibrium analysis, reproductive number, and sensitivity. For the solution of the studied model, firstly, we developed the forward Euler method and then focused on the formulation of the NSFD scheme. The simulation results reveal that the forward Euler method cannot generate convergent and non-harmful solutions for a considerable value of the time step size.
In contrast, the proposed method produces convergent and positive solutions and is consistent, dynamically, and positively bounded. The exciting feature of the simulation results is the consistency of the graphs’ overall step sizes since many classical methods like Euler, RK-4, Euler’s stochastic, and RK-4 stochastic do not preserve them at large step sizes [44,45]. The fuzzy modeling approach is a reliable and efficient technique to handle the uncertainty in the model. It can be used to study the dynamics of amoebiasis diseases in the human population. The method developed in this work can be extended to delayed, stochastic, and fractional models in fuzzy environments. The idea can also be implemented in machine learning problems [47]. We analyzed the model of the spread of the amoebiasis virus for a general class of parameters taken from the scientific literature in this study. The execution of these findings on real-time data is our future research plan as presented in [47–49].
Acknowledgement: Thanks to our families and colleagues who supported us morally. The authors extend their appreciation to the Deanship of Scientific Research at King Khalid University for funding this work through Large Groups” (Project under Grant Number (RGP.2/116/43)).
Funding Statement: The authors received no specific funding for this study.
Conflicts of Interest: The authors declare that they have no conflicts of interest to report regarding the present study.
References
1. S. L. Stanley, “Amoebiasis,” The Lancet, vol. 361, no. 9362, pp. 1025–1034, 2003. [Google Scholar]
2. G. Choudhuri and M. Rangan, “Amebic infection in humans,” Indian Journal of Gastroenterology, vol. 31, no. 4, pp. 153–162, 2012. [Google Scholar]
3. A. E. Pinilla, M. C. Lopez and D. F. Viasus, “Historia del protozoo entamoeba histolytica,” Revista Médica de Chile, vol. 136, no. 1, pp. 118–124, 2008. [Google Scholar]
4. D. Stark, S. J. van Hal, G. Matthews, J. Harkness and D. Marriott, “Invasive amebiasis in men who have sex with men, Australia,” Emerging Infectious Diseases, vol. 14, no. 7, pp. 1141–1143, 2008. [Google Scholar]
5. I. E. Salit, K. Khairnar, K. Gough and D. R. Pillai, “A possible cluster of sexually transmitted entamoeba histolytica: Genetic analysis of a highly virulent strain,” Clinical Infectious Diseases, vol. 49, no. 3, pp. 346–353, 2009. [Google Scholar]
6. A. Samie, A. ElBakri and R. AbuOdeh, “Amoebiasis in the tropics: Epidemiology and pathogenesis,” in Current Topics in Tropical Medicine in Tech, London, UK, chapter 14, pp. 201–226, 2012. [Online]. Available:https://www.intechopen.com/books/825 [Google Scholar]
7. C. Xim’enez, P. Mor’an, L. Rojas, A. Valadez and A. G’omez, “Reassessment of the epidemiology of amebiasis: State of the art,” Infection, Genetics and Evolution, vol. 9, no. 6, pp. 1023–1032, 2009. [Google Scholar]
8. N. Chitnis, J. M. Cushing and J. M. Hyman, “Bifurcation analysis of a mathematical model for malaria transmission,” SIAM Journal on Applied Mathematics, vol. 67, no. 1, pp. 24–45, 2006. [Google Scholar]
9. A. M. Niger and A. B. Gumel, “Mathematical analysis of the role of repeated exposure on malaria transmission dynamics,” Differential Equations and Dynamical Systems, vol. 16, no. 3, pp. 251–287, 2008. [Google Scholar]
10. T. Smith, N. Maire, A. Ross, M. Penny, N. Chitnis et al., “Towards a comprehensive simulation model of malaria epidemiology and control,” Parasitology, vol. 135, no. 13, pp. 1507–1516, 2008. [Google Scholar]
11. A. L. Port, G. Cottrell, C. Dechavanne, V. Briand, A. Bouraima et al., “Prevention of malaria during pregnancy: Assessing the effect of the distribution of IPTp through the national policy in Benin,” American Journal of Tropical Medicine and Hygiene, vol. 84, no. 2, pp. 270–275, 2011. [Google Scholar]
12. F. B. Agusto, N. Marcus and K. O. Okosun, “Application of optimal control to the epidemiology of malaria,” Electronic Journal of Differential Equations, vol. 8, no. 1, pp. 1–22, 2012. [Google Scholar]
13. B. N. Kim, K. Nah, C. Chu, S. U. Ryu, Y. H. Kang et al., “Optimal control strategy of plasmodium vivax malaria transmission in Korea,” Osong Public Health and Research Perspectives, vol. 3, no. 3, pp. 128–136, 2012. [Google Scholar]
14. K. O. Okosun, O. Rachid and N. Marcus, “Optimal control strategies and cost-effectiveness analysis of a malaria model,” Biosystems, vol. 111, no. 2, pp. 83–101, 2013. [Google Scholar]
15. M. S. Arif, A. Raza, K. Abodayeh, M. Rafiq and A. Nazeer, “A numerical efficient technique for the solution of susceptible infected recovered epidemic model,” Computer Modeling in Engineering and Sciences, vol. 124, no. 2, pp. 477–491, 2020. [Google Scholar]
16. W. Shatanawi, A. Raza, M. S. Arif, M. Rafiq, M. Bibi et al., “Essential features preserving dynamics of stochastic dengue model,” Computer Modeling in Engineering and Sciences, vol. 126, no. 1, pp. 201–215, 2021. [Google Scholar]
17. M. A. Noor, A. Raza, M. S. Arif, M. Rafiq, K. S. Nisar et al., “Nonstandard computational analysis of the stochastic COVID-19 pandemic model: An application of computational biology,” Alexandria Engineering Journal, vol. 61, no. 1, pp. 619–630, 2021. [Google Scholar]
18. Z. Yu, R. Arif, M. A. Fahmy and A. Sohail, “Self-organizing maps for the parametric analysis of COVID-19 SEIRS delayed model,” Chaos, Solitons & Fractals, vol. 150, pp. 111202, 2021. [Google Scholar]
19. M. A. Fahmy, “A new boundary element algorithm for a general solution of nonlinear space-time fractional dual-phase-lag bio-heat transfer problems during electromagnetic radiation,” Case Studies in Thermal Engineering, vol. 25, pp. 100918, 2021. [Google Scholar]
20. K. Abodayeh, A. Raza, M. S. Arif, M. Rafiq, M. Bibi et al., “Numerical analysis of stochastic vector-borne plant disease model,” Computers, Materials and Continua, vol. 63, no. 1, pp. 65–83, 2020. [Google Scholar]
21. L. A. Zadeh, “Fuzzy sets,” Information Control, vol. 8, no. 1, pp. 338–353, 1965. [Google Scholar]
22. T. W. Liao, “A fuzzy multicriteria decision-making method for material selection,” Journal of Manufacturing Systems, vol. 15, no. 1, pp. 1–12, 1996. [Google Scholar]
23. J. H. T. Bates and M. P. Young, “Applying fuzzy logic to medical decision making in the intensive care unit,” American Journal of Respiratory and Critical Care Medicine, vol. 167, no. 7, pp. 948–952, 2003. [Google Scholar]
24. N. Fenton and W. Wang, “Risk and confidence analysis for fuzzy multicriteria decision making,” Knowledge-Based Systems, vol. 19, no. 6, pp. 430–437, 2006. [Google Scholar]
25. C. H. Yeh and Y. H. Chang, “Modeling subjective evaluation for fuzzy group multicriteria decision making,” European Journal of Operational Research, vol. 194, no. 2, pp. 464–473, 2009. [Google Scholar]
26. M. Saeed, U. Ali, J. Ali and F. Dayan, “Fuzzy soft relative method and its application in decision making problem,” Proceedings of the Pakistan Academy of Sciences, vol. 57, no. 1, pp. 21–30, 2020. [Google Scholar]
27. L. D. Barros, M. F. Leite and R. C. Bassanezi, “The SI epidemiological models with a fuzzy transmission parameter,” Computers & Mathematics with Applications, vol. 45, no. 10, pp. 1619–1628, 2003. [Google Scholar]
28. C. Torres, S. Barguil, M. Melgarejo and A. Olarte, “Fuzzy model identification of dengue epidemic in Colombia based on multiresolution analysis,” Artificial Intelligence in Medicine, vol. 60, no. 1, pp. 41, 2014. [Google Scholar]
29. P. K. Mondal, S. Jana, P. Haldar and T. K. Kar, “Dynamical behavior of an epidemic model in a fuzzy transmission,” International Journal of Uncertainty, Fuzziness and Knowledge-Based Systems, vol. 23, no. 5, pp. 651–665, 2015. [Google Scholar]
30. C. Li, J. Huang, Y. H. Chen and H. Zhao, “A fuzzy susceptible-exposed-infected-recovered model based on the confidence index,” International Journal of Fuzzy Systems, vol. 23, no. 1, pp. 907–917, 2021. [Google Scholar]
31. X. Chen, J. Li, C. Xiao and P. Yang, “Numerical solution and parameter estimation for uncertain SIR model with application to COVID-19,” Fuzzy Optimization and Decision Making, vol. 20, no. 2, pp. 189–208, 2021. [Google Scholar]
32. M. Abdy, S. Side, S. Annas, W. Nur and W. Sanusi, “An SIR epidemic model for COVID-19 spread with fuzzy parameter: The case of Indonesia,” Advances in Difference Equations, vol. 105, no. 2021, pp. 1–17, 2021. [Google Scholar]
33. F. M. Allehiany, F. Dayan, F. F. Al-Harbi, N. Althobaiti, N. Ahmed et al., “Bio-inspired numerical analysis of COVID-19 with fuzzy parameters,” Computers, Materials & Continua, vol. 72, no. 2, pp. 3213–3229, 2022. [Google Scholar]
34. R. E. Mickens, “A fundamental principle for constructing nonstandard finite difference schemes for differential equations,” Journal of Difference Equations and Applications, vol. 11, no. 2, pp. 645–653, 2005. [Google Scholar]
35. J. Cresson and F. Pierret, “Nonstandard finite difference schemes preserving dynamical properties,” Journal of Computational and Applied Mathematics, vol. 303, no. 2, pp. 15–30, 2016. [Google Scholar]
36. M. Naveed, M. Rafiq, A. Raza, N. Ahmed, I. Khan et al., “Mathematical analysis of novel coronavirus (2019-nCov) delay pandemic model,” Computers, Materials & Continua, vol. 64, no. 3, pp. 1401–1414, 2020. [Google Scholar]
37. W. Shatanawi, A. Raza, M. S. Arif, K. Abodayeh, M. Rafiq et al., “An effective numerical method for the solution of a stochastic coronavirus (2019-nCOVID) pandemic model,” Computers, Materials & Continua, vol. 66, no. 2, pp. 1121–1137, 2021. [Google Scholar]
38. N. Shahid, D. Baleanu, N. Ahmed, T. S. Shaikh, A. Raza et al., “Optimality of solution with numerical investigation for coronavirus epidemic model,” Computers, Materials & Continua, vol. 67, no. 2, pp. 1713–1728, 2021. [Google Scholar]
39. F. Dayan, N. Ahmed, M. Rafiq, A. Akgül, A. Raza et al., “Construction and numerical analysis of a fuzzy nonstandard computational method for the solution of an SEIQR model of COVID-19 dynamics,” AIMS Mathematics, vol. 7, no. 5, pp. 8449–8470, 2022. [Google Scholar]
40. S. Adak and S. Jana, “Dynamical behavior of an epidemic model with fuzzy transmission and fuzzy treatment control,” Journal of Applied Mathematics and Computing, vol. 68, no. 3, pp. 1929–1948, 2022. [Google Scholar]
41. L. C. Barros, R. Z. G. Oliveira, M. B. F. Leite and R. C. Bassanezi, “Epidemiological models of directly transmitted diseases: An approach via fuzzy sets theory,” International Journal of Uncertainty, Fuzziness and Knowledge-Based Systems, vol. 22, no. 5, pp. 769–781, 2014. [Google Scholar]
42. R. Verma, S. P. Tiwari and R. K. Upadhyay, “Fuzzy modeling for the spread of influenza virus and its possible control,” Computational Ecology and Software, vol. 8, no. 1, pp. 32–45, 2018. [Google Scholar]
43. P. V. Driessche and J. Watmough, “Reproduction numbers and sub-threshold endemic equilibria for compartmental models of disease transmission,” Mathematical Biosciences, vol. 180, no. 1, pp. 29–48, 2002. [Google Scholar]
44. Y. T. Mangongo, J. D. K. Bukweli and J. D. B. Kampempe, “Fuzzy global stability analysis of the dynamics of malaria with fuzzy transmission and recovery rates,” American Journal of Operations Research, vol. 11, no. 6, pp. 257–282, 2021. [Google Scholar]
45. N. Chitnis, J. M. Hyman and M. D. Cushing, “Determining important parameters in the spread of malaria through the sensitivity analysis of a mathematical model,” Bulletin of Mathematical Biology, vol. 70, no. 5, pp. 1272–1296, 2008. [Google Scholar]
46. M. S. Arif, A. Raza, W. Shatanawi, M. Rafiq and M. Bibi, “A stochastic numerical analysis for computer virus model with vertical transmission over the internet,” Computers, Materials Continua, vol. 61, no. 3, pp. 1025–1043, 2019. [Google Scholar]
47. G. Bhuju, G. R. Phaijoo and D. B. Gurung, “Fuzzy approach analyzing SEIR-SEI dengue dynamics,” BioMed. Research International, vol. 20, no. 1, pp. 1–15, 2020. [Google Scholar]
48. S. C. Mpeshe, “Fuzzy SEIR epidemic model of amoebiasis infection in human,” Advances in Fuzzy Systems, vol. 22, no. 1, pp. 1–14, 2022. [Google Scholar]
49. S. K. Yadav and Y. Akhter, “Statistical modeling for the prediction of infectious disease dissemination with special reference to COVID-19 spread,” Frontiers in Public Health, vol. 680, no. 1, pp. 1–20, 2021. [Google Scholar]
Cite This Article
 Copyright © 2023 The Author(s). Published by Tech Science Press.
This work is licensed under a Creative Commons Attribution 4.0 International License , which permits unrestricted use, distribution, and reproduction in any medium, provided the original work is properly cited.
 Downloads
 Citation Tools