
 Submit a Paper
 Propose a Special lssue
 Open Access
ARTICLE

Identification of Anomaly Scenes in Videos Using Graph Neural Networks
1 Department of Software Engineering, Lahore Garrison University, Lahore, 54000, Pakistan
2 School of Business, Skyline University College, Sharjah, UAE
3 Al-Madinah International University–Faculty of Computer and Information Technology, Kuala Lumpur, Malaysia
4 College of Computer and Information Systems, Islamic University of Madinah, Madinah, Kingdom of Saudi Arabia
5 School of IT, Skyline University College, Sharjah, UAE
6 Faculty of Engineering, Computing and Science (FECS)-Swinburne University of Technology, Sarawak
7 Department of General Education, Skyline University College, University City of Sharjah, UAE
8 Department of Computer Science, Lahore Garrison University, Lahore, 54000, Pakistan
* Corresponding Author: Waqas Nawaz. Email:
Computers, Materials & Continua 2023, 74(3), 5417-5430. https://doi.org/10.32604/cmc.2023.033590
Received 21 June 2022; Accepted 22 September 2022; Issue published 28 December 2022
 View Full Text
 Download PDF
Abstract
Generally, conventional methods for anomaly detection rely on clustering, proximity, or classification. With the massive growth in surveillance videos, outliers or anomalies find ingenious ways to obscure themselves in the network and make conventional techniques inefficient. This research explores the structure of Graph neural networks (GNNs) that generalize deep learning frameworks to graph-structured data. Every node in the graph structure is labeled and anomalies, represented by unlabeled nodes, are predicted by performing random walks on the node-based graph structures. Due to their strong learning abilities, GNNs gained popularity in various domains such as natural language processing, social network analytics and healthcare. Anomaly detection is a challenging task in computer vision but the proposed algorithm using GNNs efficiently performs the identification of anomalies. The Graph-based deep learning networks are designed to predict unknown objects and outliers. In our case, they detect unusual objects in the form of malicious nodes. The edges between nodes represent a relationship of nodes among each other. In case of anomaly, such as the bike rider in Pedestrians data, the rider node has a negative value for the edge and it is identified as an anomaly. The encoding and decoding layers are crucial for determining how statistical measurements affect anomaly identification and for correcting the graph path to the best possible outcome. Results show that the proposed framework is a step ahead of the traditional approaches in detecting unusual activities, which shows a huge potential in automatically monitoring surveillance videos. Performing autonomous monitoring of CCTV, crime control and damage or destruction by a group of people or crowd can be identified and alarms may be triggered in unusual activities in streets or public places. The suggested GNN model improves accuracy by 4% for the Pedestrian 2 dataset and 12% for the Pedestrian 1 dataset compared to a few state-of-the-art techniques.Keywords
Identifying anomalies using video streams is a challenging task and an active research area. A number of techniques are used for detecting abnormal situations in public places using surveillance cameras. Video processing techniques are used to check the abnormality in video segments. Detecting abnormal events is a very difficult due to the variation of moving objects and shapes of different sizes [1].
In surveillance, cameras provide a huge amount of video and audio data. Furthermore, studies showed that in manual monitoring, up to 60% of the objective events can be missed when there are ten or more displays on the wall [2]. Moreover, after only 20 min of focus, most of the surveillance operators become un-attentive and their alertness drops to well below acceptable levels [3]. This can result in prospective security lapses, especially during peak hours or late hours of the night. One possible solution is the development of automated systems for surveillance that can be trained on normal activities and generate an alarm whenever there is any irregular event or anomaly that may lead to a security breach [4]. Anomaly detection is similar to the recognition of an irregular event. It can be defined as a spatial-temporal recognition problem, considering that the event to be recognized is not present in the training phase [5]. In the context of video surveillance systems, anomalies are formed by rare shapes such as bikers, skaters, and small carts in a video sequence that contains free walks by persons in an outdoor environment. Security cameras are generally installed in places where there are more chances of security breaches. The high alert places are railway and bus stations, airports, shopping malls, schools, colleges and universities. Moreover, video surveillance is also popular in private places such as house premises, shops and playing grounds. The cameras are installed in different places and locations to identify suspicious behaviour. Furthermore, efficient monitoring helps in avoiding potential threats and damages to public properties. A number of automated activities and applications are currently used for surveillance that contains face recognition, pedestrian movement and poses estimation for humans. There are numerous datasets for different recognition purposes. In the proposed framework, the USCD dataset, published by the University of California, San Diego has been employed in lieu of two main reasons. Firstly, the images within this dataset have an optimum size; secondly, it is compatible with surveillance capabilities. The cameras in the UCSD dataset capture information about the pedestrians walking towards and away from a central point.
A second camera is orthogonal to the first one that collects the side view information. Therefore, the motion of a person is captured using two separate cameras. In the recent past, handcrafted features were very popular to detect anomalies. The introduction of deep learning techniques has revolutionized computer vision applications. The latest advancements in big data analysis and graphical processing unit (GPU) computing have provided a chance to apply end-to-end learning for irregularity recognition. Deep GNN was not intensively explored in the past, especially for surveillance purposes, as it requires huge data sets for training and needs massive computation power to achieve an acceptable performance.
In the proposed framework, spatiotemporal features are extracted from long video sequences using the Graphical neural network and Long short-term memory (LSTM) techniques. There are two main advantages of the LSTM network. First, feature representation is learned efficiently from the training data and second, it contains both spatial and temporal information. An anomaly is a data point far from the mean and behaves differently from other data points in a dataset [6]. In other words, the frames in the video sequences that do not follow the normal pattern and contain abrupt deviations with unexpected behaviour can be categorized as an anomaly [7]. In Fig. 1, data from the internet and the user’s archive is processed to detect anomalies in the sequence of frames. Firstly, preprocessing is applied to remove noise and blur from the input images. In the next stage, the spatiotemporal staked autoencoder is used to train the model on normal sequences. The redundant images are ignored and the main algorithm using GNN with autoencoders is employed that detects anomalies as unusual activities in a sequence of frames. Finally, an alarm is triggered whenever an anomaly is detected. There are different types of anomalies in a daily life routine such as criminal abnormalities, accidents and traffic violation acts, etc. The first step for detecting anomalies contains a few preprocessing algorithms such as noise reduction, image resizing, background subtraction and basic filtering techniques. The next process is extracting features and patterns from the preprocessed data. To extract the texture in videos, feature modelling is generally used. The probability for the texture can be computed that shows normal or abnormal behaviour [8]. The final step contains activity recognition based on the extracted features and patterns. For classification, machine learning algorithms such as support vector machine (SVM), Naïve Bayes and Regression Trees are used [9]. Machine learning techniques provide an efficient solution to detect anomalies, however, state-of-the-art deep learning algorithms, outperform conventional machine learning techniques. In Fig. 2, an abnormal data point (cyclist) for the pedestrian data is identified and highlighted in red colour.
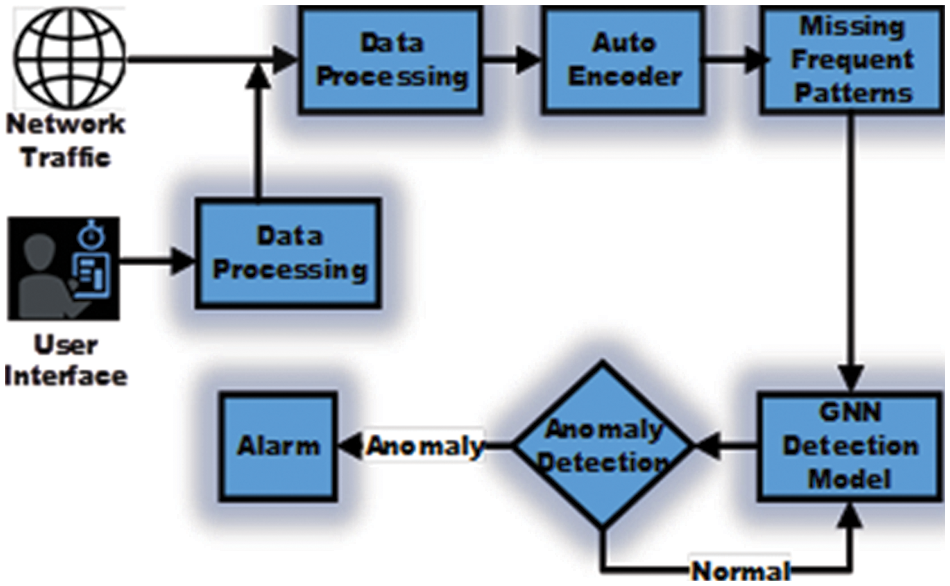
Figure 1: Block diagram showing the various modules that process data from the internet to detect an anomaly

Figure 2: Abnormalities for the pedestrian data are shown in red color for two consecutive frames
The anomalous public behaviour in a high-density situation can pose great hazards to public safety. There is a high demand of an automated and accurate system to detect anomalies. Surveillance cameras play an important role in detecting and recognising individual persons or objects to monitor any doubtful activities in public. Surveillance cameras offer a fundamental technology that provides higher-level applications for detecting and analysing various events. Numerous events happen in public places that require a video surveillance system. One of the main applications of a surveillance system is to robustly identify an anomaly. There are many existing techniques and collected works that claim to learn the irregular actions of a person in the scene, but many challenges are still there that need to be addressed. The 2D filters that are used in the handcrafted approaches cover only the spatial information. In conventional techniques, the feature extraction process is the fundamental step for irregular incident recognitions. The attributes and texture play a vital role in any irregularity detection.
The proposed research aims to analyse the performance of GNN using deep learning algorithms and to design and develop a robust application for anomaly recognitions. Two modes of anomaly recognitions are considered for authenticating such performance on a dataset: a spatiotemporal stacked frame auto-encoder, and a spatiotemporal auto-encoder with Graphical Neural Network. In this work, the graph structure of a pedestrian network is constructed where spatiotemporal convolutional blocks capture the spatial and temporal information. In the proposed model, the pedestrian network is represented as a graph where people are nodes, their relations are edges and its positive or negative values represent a weighted adjacency matrix. The negative value for edges determines anomalies. To detect anomalies in the graph, conventional techniques for anomaly detection usually do not perform up to the mark. The anomalous behaviour can be efficiently represented by a graph-based structure where outliers can be identified by computing a few statistical parameters. Therefore, a graph-based approach is proposed in this research to find out these anomalies. The main objective of the work is to validate the graph neural network to extract discriminative properties of anomalies. In the input stream, surveillance videos show normal patterns such as walking and running and a few anomalous instances (using skateboards etc.) are also present. Normal and abnormal behaviour is classified with the help of GNN. The expected outcomes of the proposed research are as follows.
• The abnormal scenes in a specific area can be monitored and automatic alarms can be generated in case of any suspicious activities.
• In sports such as football matches, the discipline of the crowd can be maintained using automatic monitoring with the help of cameras.
• In sports stadiums, the intensity and popularity of the event can be identified as noticed by the rhythmic movement of the crowd.
• On national day celebrations, the behaviour and discipline of the masses can be monitored.
• In religious occasions, any abnormal activity of a group of people can be detected, and relevant strategies to counter the effect can be designed.
Recently, there has been tremendous progress for graph-based data mining techniques, especially spatial and temporal graphs, which received more attention than other algorithms [10]. Most of the work has been performed on finding parameters from the structure of graphs, however, only a few studies have focussed on anomaly detection. Various surveys [11,12] have presented numerous approaches for detecting anomalies. In a few basic techniques, statistical methods are used which find deviations from common statistical properties such as mean, median, mode, and quantile ratios. In other techniques, artificial intelligence (AI)-based approaches such as SVM, clustering techniques and K-nearest neighbour (KNN) are used to identify anomalies. Several Bayesian network algorithms have also been employed for computing anomalies by pairing communication data. An anomaly is also represented by abnormality, exception or an outlier that shows unusual behaviour. The initial impetus has been performed by Gori et al. in 2005 when the term GNN was used for the first time [13]. Further studies were conducted by Wang et al. in 2016 for extensions in the initial model [14]. Borja et al. adopted a similar approach to GNN and used spectral graph convolutions for outliers’ detection [15].
Konečný et al. [16] used SVM to identify vehicles in the pedestrian area using data points captured by laser scans. Video frames contain the data points of successive laser scans. The machine learning algorithm, SVM, successfully detected moving objects with high speed. The data was captured from a laser scanner instead of using a video camera. Hasan et al. [17] have proposed a method for detecting video abnormalities using trajectory similarity analysis. In this work, the authors extracted frames from videos and performed a few pre-processing steps such as noise removal and background subtraction. The algorithm used similarities of the multidimensional sequence pairs and recognized irregular trajectory motion in surveillance videos. The Hidden Marko Model (HMM) was used for training and the learning algorithm was retrained for the sequence of discrete symbols using an Expectation-Maximization (EM) model. This method was used for anomaly detection in both indoor and outdoor surveillance videos. Bouindour et al. [18] have developed a technique of generative neural networks consisting of two neural networks, a Stacked Fully Connected Variational Auto Encoder (SFVAE) and a Skip Graphical Variational Auto Encoder (SGVAE). Both SFVAE and SGVAE are effective and efficient generative networks and they are used for detecting local as well as global abnormal events. A public dataset was used for anomaly detection in both GNN. Hao et al. [19] have presented a technique for abnormal event recognition in a video stream by using a Histogram of Optical Flow Orientation (HOFO). The technique is based on a frame descriptor and performs nonlinear classification. The KNN was used to classify the data into a normal or abnormal class. All of the above-listed techniques are summarized in Table 1.

Sultani et al. [20] have proposed a technique for real-world anomaly recognition in videos by using the multiple instance learning (MIL) algorithm. In the presented algorithm, a bag denotes a set of video frames and an instance represents a temporal video segment. A fully connected neural network using a gradient loss function extracts 3D features and positive and negative bags are used for computing ranking losses. The UCF crime dataset was used in the proposed MIL technique. Pennisi et al. [21] have introduced a new method for online recognition of irregular video events using a spatial-temporal graphical neural network. They used a pre-trained 3D residual graphical network to extract spatial-temporal features and used SVM to classify the vectors. The above-cited learning techniques for anomaly detection are tabulated in Table 2.

Wang et al. [22] have developed a method for effective crowd anomaly detection using spatiotemporal texture analysis. One proposed technique was spatial-temporal texture (STT) extraction for recognizing effective video texture. The Gabor filtering technique used entropy for anomaly detection. In the second method, Grey Level Co-occurrence Matrix (GLCM) model was used to recognize signature values which were calculated from the neighbourhoods of pixels for each region of the interest. Iqbal et al. [23] have suggested a method for online and real-time crowd behaviour recognition in video sequences. At the macro level, the global features were extracted for the crowd. The entire crowd was considered as a single entity. In the second technique, using an object-based method, the anomaly was detected at the local level, for example, a single person was entering a restricted area. The two important metrics, entropy and temporal occupation variation were considered for detecting irregular crowd behaviours.
Li et al. [24] have introduced a Gaussian Mixture Model (GMM) for spatiotemporal texture modelling for real-time anomaly recognition. The method used UCSD and UMN datasets for detecting abnormality in the videos. The wavelet transform was used for extracting the STT features in each frame and for processing by the GMM which is a statistical method for identifying the abnormality. Using the Histogram of oriented gradients (HOG), Khan et al. [25] have detected anomalies in the UCSD, UMN, Avenue and PETS datasets. In this method, the crowd was represented by the pixel movement and changes in the motion were recorded. Xie et al. [26] used Histogram of Optical Flow (HOF) and HOG for video gesture recognition. The authors in [27] have proposed multimedia transmission schemes for cognitive radio networks. Saleem et al. [28] have proposed an efficient temporal mean shift for activity recognition in videos. The technique is more beneficial for the detection of the spatiotemporal region. The features were extracted from cubic slices. The discussed techniques are briefly presented in Table 3.

In comparison to state-of-the-art techniques, the proposed GNN based anomaly detection framework uses the same popular dataset of USCD as was employed in most of the research work. However, the model to identify anomalies is unique in the proposed research and to the best of our knowledge, not a single study to detect anomaly is carried out that employs GNN. Compared to other techniques, the increase in accuracy levels favours our proposed notion to represent the pedestrian network as nodes and their relationships as edges. A significant improvement in the performance validates the central idea of the proposed model.
The UCSD Anomaly detection dataset is publicly available. The dataset was collected using a specific angle in the pedestrian walkways. In normal situations, the videos contain pedestrians who are walking and strolling in the walkway. Irregularity occurs when any non-pedestrian enters the walkway. In an anomaly, a biker or skaters enter the walkways. A wheelchair is also considered an anomaly in a different scene. The dataset is divided into two subsets and each video contains different clips [29]. The video segment contains 200 frames in each clip of the video which is almost 6 to 7 s of time duration. The following steps are involved in the proposed model.
• Node embedding is performed such that similar nodes in the graph are embedded close to each other.
• Anomalies such as skateboards are distant from normal nodes and the edges are negatively valued.
• A random walk on the graph detects distant nodes.
• Supervised training is used for node classification into normal and abnormal nodes.
The training set consists of 34 video sequences whereas 6 video sequences are used in the testing sample. In pedestrian 1, the video sequences contain groups of people walking and the camera is capturing the side view. In Fig. 3, a person with skating shoes is considered an anomaly and similarly, the cyclist has also marked an anomaly in the situation where free walking is considered as a normal behaviour. In the pedestrian 2 data, people are walking parallel to the mounted cameras. This data contains 16 training sequences for training whereas 12 sequences are used in testing. In each video frame, the ground truth annotation contains a binary bounding box per frame, showing the presence of an anomaly. Furthermore, a subset of 10 frames for peds1 and 12 frames for peds2 are marked with manually created pixel-level binary masks, which identify the regions of interest that are anomalies in our case [30].
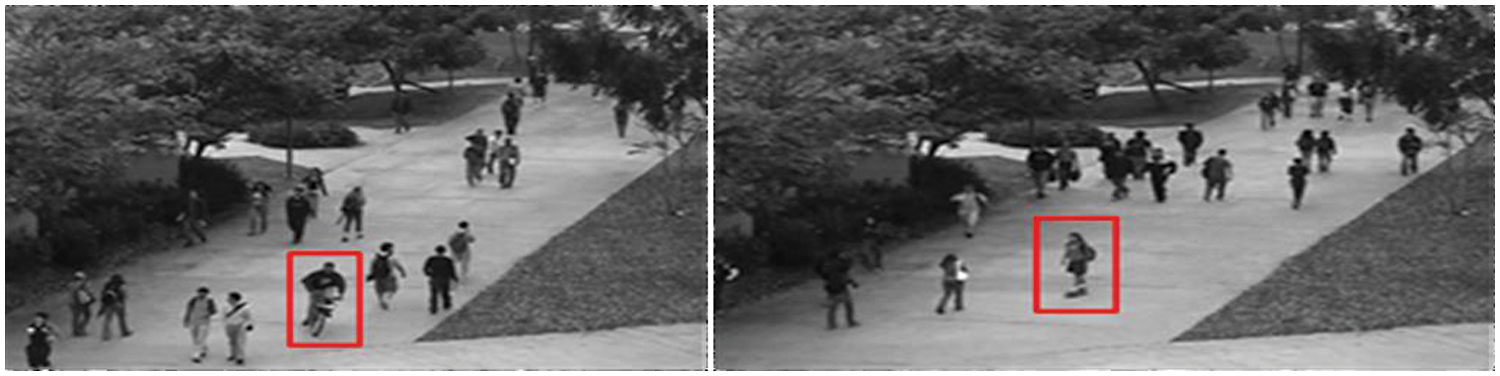
Figure 3: The red bounding box presents anomalies in the pedestrian data
Deep learning is a subclass of machine learning that processes data and makes patterns for use in decision-making. There are various models in deep learning and the GNN is one of the popular and more efficient technique. The GNN is an advanced technique for recognizing deep features more accurately and efficiently. Machine learning is able to solve a problem by the learning experience. The machine learning model incorporates training data [31]. The fully trained model is able to perform correct and accurate predictions. The machine learning techniques can learn from the observations so that they can find instructions and patterns in data. Supervised, reinforcement and unsupervised learning are the basic three types of machine learning techniques. Supervised machine learning methods can perform better than unsupervised techniques to recognize abnormality. Fully labelled training and testing data is used to classify normal and abnormal video sequences.
Furthermore, by incorporating test data, robust classification of sequences can be performed. In Fig. 4, the framework for GNN architecture is presented. The video sequence is mapped to the graphical layers of the proposed system. The dropout layers reduce the dimensions of input parameters. The labels are assigned in the fully connected layer and as shown in Fig. 4, anomaly frames are represented by long horizontal lines. The nodes or points represent pedestrians, whereas edges in various colours show the relationship among nodes such as walking speed. Outliers in Fig. 3 (cycle and skateboard) are displayed as long horizontal bars in the architecture diagram of Fig. 4.

Figure 4: Architecture diagram for graphical neural network
Reinforcement learning suffers variations from supervised learning. In supervised learning the training data have specific labels, so the labels are provided in the training whereas in reinforcement learning, the data is limited and without proper labelling. Hence, the reinforcement agent learns from the environment and performs the classification task. Using a limited dataset, it is trained on rewards and penalties [32]. In the unsupervised algorithm, there is no need to train the model, so labelling is not required for each segment and pixel value [33]. There is even no difference between training and testing data. The training data consists of a few abnormal video clips; most segments are normal. Deep learning techniques consist of deep layers where feature extraction and classification are not separately performed as in machine learning techniques [34]. The proposed model is divided into two sub-models. One is a spatiotemporal staked frame auto-encoder and the other is a spatiotemporal auto-encoder with Graphical Neural Network.
The training set contains only normal events whereas the testing data contains both normal and abnormal events. The training video clips are used to train the GNN and the testing data is used to predict the anomalies. The videos are converted into frames before applying several preprocessing steps. The resolution of each frame is 100 × 100. All input images are resized for the same resolution and a spatial-temporal volume (STV) is generated that contains 10 frames. The next step is extracting spatiotemporal texture, features and patterns using the proposed techniques. One is a spatiotemporal staked frame auto-encoder for learning the temporal regularity of every video frame and another is a spatiotemporal Graphical auto-encoder with LSTM. The auto-encoder consists of the encoder and decoder for learning temporal patterns of the encoded spatial structures. The encoder consists of three graphical layers and the decoder consists of two pooling layers. The classifiers are used to predict the anomaly score using predetermined thresholding values. If the score is above the level of the threshold, then an alarm is triggered. The proposed graphical neural network contains several neurons in hidden layers, whereas the output layer uses a single neuron to predict an anomaly.
The UCSD dataset is used for testing and evaluation of the proposed methodology. In the first step, sequences of videos have been converted into frames for preprocessing and feature extraction. In Fig. 5, the proposed algorithm is described as follows. In Fig. 5a the original frame is presented and in Fig. 5b, the reconstructed image is presented after performing the pre-processing stage. In Fig. 5c background subtraction is performed and in Fig. 5d the anomaly is computed by placing a red colour bounding box over the computed anomaly.
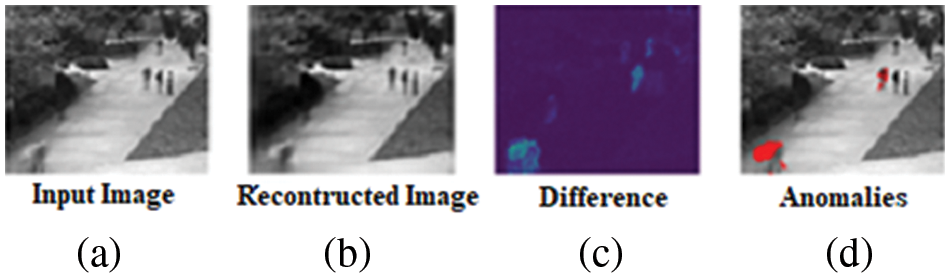
Figure 5: (a) Data frame (b) Its enhanced image (c) The differentiated image (d) Red marks show anomalies
The proposed technique contains a spatial features collector and a pair of temporal encoder/decoder that learns the temporal feature of the input volume. The proposed model is trained on video blocks with only normal segments. The model performs with low values of the reconstruction error. Each testing input video volume produces a reconstruction error, but only those videos are marked with abnormal events that cross the predefined threshold. If the value crosses the threshold limit, it is considered an abnormal event; if it is below the threshold limit, it is represented as normal events. Our system is able to efficiently recognize the irregular occasions that occurs. In the preprocessing step, raw UCSD ped1 and UCSD ped2 data is aligned with the origin and a transformed input video frame is formed for the model. All videos are converted into frames and resized to 100 × 100. In the next stage, STV is constructed by collecting all the converted frames. Each video volume contains 10 consecutive frames as the model in [35] is followed. In the test data, four frames in the pedestrian data represent an anomaly for those who use assistance while walking as they do not practice free walking.
The proposed technique contains two models, one is a spatial auto-encoder used for learning sequences from spatial constructions of all segments. The second is the temporal Graphical encoder-decoder with LSTM that is used for learning temporal texture and patterns of the encoded spatial constructions. The spatiotemporal staked frame auto-encoder has two Graphical and de-Graphical layers [36] whereas in the C-LSTM, the temporal encoder contains three layers. Graphical layers are used for object detection, while LSTM technique is used in time-series modelling and sequential learning. GNN is well-suited for spatiotemporal feature learning [37]. In Fig. 6, using the proposed algorithm, skaters, a vehicle and persons on bicycles are detected as anomalies and highlighted in red color. The Graph auto-encoder is trained with a loss function, it makes pixel-by-pixel learning between the input and reconstructed image. This stage often introduces blurriness in the processed images.

Figure 6: A sequence of frames in the pedestrian data showing anomaly in red colour
A Graph network learns estimations of the filters during the training procedure [38]. Convolution shows the important relationship between pixels by learning features using small squares of input data. The convolution operation performs dot product between filters and region of inputs. We assume n × n square input layer and m × m filter, the output layers are sized (n − m + 1) × (n − m + 1). The GNN can learn the value of these filters which are used in the training procedure. In our case the spatial encoder uses three Graphical layers, the first layer uses 512 filters and kernel size is 15 × 15. The second layer uses 256 filters and the kernel size is 4 × 4. The 3rd layer uses 128 filters and the kernel size is 3 × 3. The spatial encoder used 2 Max pool layers. The channels are used in de-graphical layers of 556, 512 and 10 rows, respectively and the kernel size is 3, 4 and 15 respectively. RNN [39] works simply like a feed-forward network, and its output image’s estimations depend on the input image. The equal error rate (EER) is determined when the false positive rate equals to the false negative rate. The training model is used to reduce the input volume reconstruction error. Our proposed model uses the Adam optimizer that considers the situation’s role as the learning rate depends upon the updated history of the model’s weight. The minimum patch size is 64 and each training video volume is trained for a maximum 50 epochs. The rebuilding loss of authentication data is reduced after 10 consecutive epochs. A hyperbolic curve is selected for the activation purpose of the spatial auto-encoder. The classification accuracy is comparable with the existing literature as the proposed GNN outperforms other techniques [40].
The proposed model uses a graphical auto-encoder based on the generative model that contains a decoder and an encoder. The loss function of the trained model is used to reconstruct images. The model’s validity is endorsed if the reconstruction error is less than the threshold. If the error exceeds the specified threshold, it shows the over-fitting phenomenon. In our experiments, a dense layer auto-encoder is used where all layers are fully connected. Performance parameters such as accuracy in Eq. (2), sensitivity in Eq. (3), specificity in Eq. (1), and area under the curve (AUC) in Eq. (4) are computed for the authentication of the proposed technique. The visual and parametric outcomes of the proposed technique are compared with the existing methods. The performance parameters for the proposed method are computed as,
• True-Positive (TP): The video segmented result is 1 and the anomaly is present in the video frame.
• False-Negative (FN): The video segmented result is 0 and the anomaly is present in the video frame.
• True-Negative (TN): the video segmented result is 0 and the anomaly is absent in the video sample.
• False-positive (FP): the video segmented result is 1 and the anomaly is absent in the video sample.
In Table 4, quality metrics in the form of accuracy, sensitivity and specificity are presented, showing the proposed algorithm’s superior performance. The accuracy shows the precision of the model. The sensitivity value shows that 89.5% anomalies are correctly detected whereas 88% of non-anomalous scenes are also correctly identified. The model performs with a 10% error rate that shows that it fails to detect 10% of anomalies. This is a significant performance improvement compared to other state-of-the-art techniques.

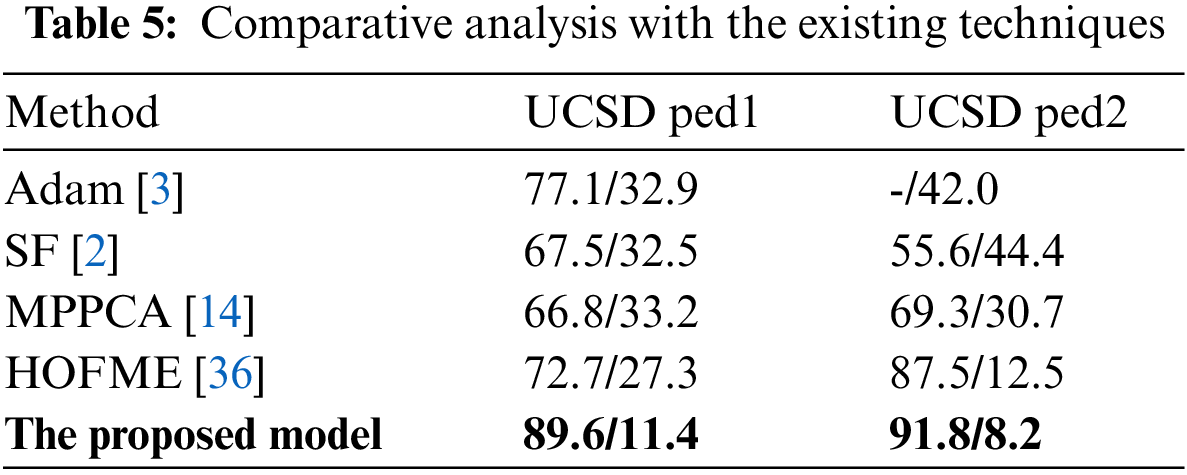
The quantitative analysis of Receiver operating characteristic (ROC) has been used in various studies and the comparison of the performance of the proposed method with a few states of art techniques is presented in Table 5. It shows the comparison of the area under the ROC curve and the Equal error rate (EER) for a number of popular techniques. Accuracy levels are 72.7% and 87.5% for UCSD dataset 1 and UCSD dataset 2, respectively. The proposed algorithm achieves 89.6% area under the curve whereas EER is only 11.4%. Our proposed model employed video sequences and achieved an error rate of 11%, an improvement of 20% over the basic Principal Component Analysis (PCA) technique. It proves that employing GNN for anomaly detection outperforms all the other techniques, as evidenced by ERR, which is significantly lesser than all previous studies. Graph neural network computes the neighbourhood dependencies of nodes in graph structures and achieves an enhanced performance than its counterpart algorithms.
The proposed research develops a GNN model for detection of anomalies in the surveillance videos dataset. The technique employs an autoencoder that has two main subclasses. One is a spatiotemporal staked frame autoencoder that is used to capture temporal regularity in videos. The second class uses a spatiotemporal autoencoder with graphical layers. The proposed GNN performs inference to forecast graph parameters by learning how to embed the neighbourhood of a node. In a GNN network, nodes are defined by their neighbours and edges, so if there is an anomalous node, it is predicted by its negative edge values in comparison to its neighbourhood nodes. The model captures the graph structure for the pedestrian data and assigns positive edge values to the people who are walking. Anomalies such as skating boards and motorbikes are identified with a very limited connection with other nodes. The proposed method’s statistical quality metrics and graphical outcomes are computed and compared with the existing techniques. The technique is trained and tested on the UCSD dataset showing superiority in performance than other state of the art techniques. In the future, an extended version of the proposed technique would use 3D evaluation of anomaly detection in surveillance videos. Furthermore, to minimize false alarms, human feedback will be used and surveys will be conducted. The scope of our study is limited, and the available data is not enough to generalize the observations. Also in future, the recurrent graph neural network with zero-shot learning will be employed to predict anomalies and the model will be extended to identify the violent behaviour of crowds.
Acknowledgement: Thank you to our coworkers for their moral and technical assistance.
Funding Statement: The authors received no specific funding for this study.
Conflicts of Interest: The authors declare that they have no conflicts of interest to report regarding the present study.
References
1. M. Aqeel, K. B. Khan, M. A. Azam, M. H. Ghouri, H. R. Khalid et al., “Detection of anomaly in videos using convolutional autoencoder and generative adversarial network model,” in Proc. IEEE 23rd Int. Multitopic Conf. (INMIC), Bahawalpur, Pakistan, no. 3, pp. 1–6, 2020. [Google Scholar]
2. F. V. Wyk, Y. Wang, A. Khojandi and N. Masoud, “Real-time sensor anomaly detection and identification in automated vehicles,” IEEE Transactions on Intelligent Transportation Systems, vol. 21, no. 3, pp. 1264–1276, 2020. [Google Scholar]
3. H. Chaudhry, M. S. Rahim, T. Saba and A. Rehman, “Crowd detection and counting using a static and dynamic platform: State of the art,” International Journal of Computational Vision and Robotics, vol. 9, no. 3, pp. 228–259, 2019. [Google Scholar]
4. A. Kuppa, S. Grzonkowski, M. R. Asghar and N. A. Le-Khac, “Finding rats in cats: Detecting stealthy attacks using group anomaly detection,” in 18th IEEE Int. Conf. on Trust, Security and Privacy in Computing and Communications (IEEE TrustCom-19), Rotorua, New Zealand, no. 21, pp. 442–449, 2019. [Google Scholar]
5. Y. Hao, J. Wang, Y. Liu, Z. Xu and J. Fan, “Extracting spatiotemporal texture signatures for crowd abnormality detection,” in 23rd Int. Conf. on Automation & Computing: University of Huddersfield, Huddersfield, UK, no. 3, pp. 20–30, 2017. [Google Scholar]
6. Y. Zhou, S. Yan and T. S. Huang, “Detecting anomaly in videos from trajectory similarity analysis,” IEEE Access, vol. 2, no. 1, pp. 1087–1090, 2007. [Google Scholar]
7. V. Mahadevan, W. Li, V. Bhalodia and N. Vasconcelos, “Anomaly detection in crowded scenes,” in Proc. of the IEEE Computer Society Conf. on Computer Vision and Pattern Recognition, USA, vol. 1, pp. 1975–1981, 2010. [Google Scholar]
8. X. Hu, Y. Huang, Q. Duan, W. Ci, J. Dai et al., “Abnormal event detection in crowded scenes using histogram of oriented contextual gradient descriptor,” EURASIP Journal on Advances in Signal Processing, vol. 2, no. 1, pp. 1260–1270, 2018. [Google Scholar]
9. D. Chakraborty, V. Narayanan and A. Ghosh, “Integration of deep feature extraction and ensemble learning for outlier detection,” Pattern Recognition, vol. 89, pp. 161–171, 2019. [Google Scholar]
10. D. Baig, T. Alyas, M. Hamid, M. Saleem, S. Malik et al., “Bit rate reduction in cloud gaming using object detection technique,” Computers, Materials & Continua, vol. 68, no. 3, pp. 3653–3669, 2021. [Google Scholar]
11. G. Sreenu and M. A. Saleem Durai, “Intelligent video surveillance: A review through deep learning techniques for crowd analysis,” Journal of Big Data, vol. 6, no. 1, pp. 1–27, 2019. [Google Scholar]
12. D. Kim, H. Yang and S. Cho, “Squeezed graphical GNN for unsupervised anomaly detection in edge device industrial internet of things,” in Proc. Int. Conf. on Information and Computer Technologies, USA, no. 3, pp. 67–71, 2018. [Google Scholar]
13. Z. Fang, F. Fei, Y. Fang, C. Lee, N. Xiong et al., “Abnormal event detection in crowded scenes based on deep learning,” Multimedia Tools and Applications, vol. 75, no. 22, pp. 14617–14639, 2016. [Google Scholar]
14. T. Wang, M. Qiao, Z. Lin, C. Li, H. Snoussi et al. “Generative neural networks for anomaly detection in crowded scenes,” IEEE Transactions on Information Forensics and Security, vol. 14, no. 5, pp. 1390–1399, 2019. [Google Scholar]
15. L. F. Borja, M. Saval-Calvo and J. Azorin-Lopez, “A short review of deep learning methods for understanding group and crowd activities,” in Proc. of Int. Joint Conf. on Neural Networks. Int. Joint Conf. on Neural Networks, USA, no. 5, pp. 1–8, 2018. [Google Scholar]
16. J. Konečný and M. Hagara, “One-shot-learning gesture recognition using HOG-HOF features,” Journal of Machine Learning Research, vol. 15, pp. 2513–2532, 2014. [Google Scholar]
17. M. Hasan, J. Choi, J. Neumann, A. K. Roy-Chowdhury, and L. S. Davis, “Learning temporal regularity in video sequences,” in Proc. of the IEEE Computer Society Conf. on Computer Vision and Pattern Recognition, USA, no. 3, pp. 733–742, 2016. [Google Scholar]
18. S. Bouindour, H. Snoussi, M. M. Hittawe, N. Tazi and T. Wang, “An on-line and adaptive method for detecting abnormal events in videos using spatiotemporal ConvNet,” Application Science, vol. 9, no. 4, pp. 1–17, 2019. [Google Scholar]
19. Y. Hao, Z. J. Xu, Y. Liu, J. Wang, and J. L. Fan, “Effective crowd anomaly detection through spatiotemporal texture analysis,” International Journal of Automation and Computing, vol. 16, no. 1, pp. 27–39, 2019. [Google Scholar]
20. W. Sultani, C. Chen and M. Shah, “Real-world anomaly detection in surveillance videos,” in Proc. IEEE Computer Society Conf. on Computer Vision and Pattern Recognition, USA, no. 3, pp. 6479–6488, 2018. [Google Scholar]
21. A. Pennisi, D. D. Bloisi and L. Iocchi, “Online real-time crowd behavior detection in video sequences,” Computer Vision and Image Understanding, vol. 144, pp. 166–176, 2016. [Google Scholar]
22. J. Wang and Z. Xu, “Spatiotemporal texture modelling for real time crowd anomaly detection,” Computer Vision and Image Understanding, vol. 144, pp. 177–187, 2016. [Google Scholar]
23. N. Iqbal, S. Abbas, M. A. Khan, T. Alyas, A. Fatima et al., “An RGB image cipher using chaotic systems, 15-puzzle problem and DNA computing,” IEEE Access, vol. 7, pp. 174051–174071, 2019. [Google Scholar]
24. W. Li, V. Mahadevan and N. Vasconcelos, “Anomaly detection and localization in crowded scenes,” IEEE Transactions on Pattern Analysis and Machine Intelligence, vol. 36, no. 1, pp. 18–32, 2014. [Google Scholar]
25. M. A. Khan, S. Saqib, T. Alyas, A. rehman, Y. Saeed et al., “Effective demand forecasting model using business intelligence empowered with machine learning,” IEEE Access, vol. 8, pp. 116013–116023, 2020. [Google Scholar]
26. S. Xie, X. Zhang and J. Cai, “Video crowd detection and abnormal behavior model detection based on machine learning method,” Neural Computer Application, vol. 31, pp. 175–184, 2019. [Google Scholar]
27. Z. Ebrahimpour, W. Wan, O. Cervantes, T. Luo and H. Ullah, “Comparison of main approaches for extracting behavior features from crowd flow analysis,” ISPRS International Journal of Geo-Information, vol. 8, no. 10, pp. 1–20, 2019. [Google Scholar]
28. M. A. Saleem, M. Aamir, R. Ibrahim, N. Senan and T. Alyas, “An optimized convolution neural network architecture for paddy disease classification,” Computers, Materials & Continua, vol. 71, no. 3, pp. 6053–6067, 2022. [Google Scholar]
29. M. Xu, X. Yu, D. Chen, C. Wu, and Y. Jiang, “An efficient anomaly detection system for crowded scenes using GNNs,” Application Science, vol. 9, no. 16, pp. 1–16, 2019. [Google Scholar]
30. P. Liu, H. Wang, Y. Luo and Y. Du, “Online graphical network tracking via spatio-temporal context,” Journal of Computer Research and Development, vol. 55, no. 12, pp. 2785–2793, 2018. [Google Scholar]
31. S. Wang, R. Clark, H. Wen, and N. Trigoni, “DeepVO: Towards end-to-end visual odometry with deep recurrent graphical neural networks,” Proc. -ICRA-IEEE Robotics and Automation Society, vol. 17, pp. 2043–2050, 2017. [Google Scholar]
32. M. Munir, S. Ahmed, A. Dengeli and S. Ahmed, “Deepant: A deep learning approach for unsupervised anomaly detection in time series,” IEEE Access, vol. 1, no. 2, pp. 1270–1280, 2019. [Google Scholar]
33. H. Li and S. Misra, “Long short-term memory and GNN with graphical neural networks for generating NMR T2 distributions,” Geoscience and Remote Sensing Letters, vol. 16, no. 2, pp. 192–195, 2019. [Google Scholar]
34. F. Galip, M. H. Sharif, M. Caputcu and S. Uyaver, “Recognition of objects from laser scanned data points using SVM,” in Proc. of Int. Conf. on Multimedia and Image Processing (ICMIP), China, no. 1, pp. 28–35, 2016. [Google Scholar]
35. A. A. Nagra, T. Alyas, M. Hamid, N. Tabassum and A. Ahmad, “Training a feedforward neural network using hybrid gravitational search algorithm with dynamic multiswarm particle swarm optimization,” Biomed Research International, vol. 2022, pp. 1–10, 2022. [Google Scholar]
36. D. Nghia1, S. Kim1, V. L. Cuong and H. J. Lee, “Anomalous trajectory detection in surveillance systems using pedestrian and surrounding information,” IEIE Transactions on Smart Processing and Computing, vol. 5, no. 4, pp. 256–266, 2016. [Google Scholar]
37. K. Masood and M. Al Ghamdi, “Modeling mental stress using a deep learning framework,” IEEE Access, vol. 7, no. 1, pp. 68446–68454, 2019. [Google Scholar]
38. C. Chahla, H. Snoussi, L. Merghem and M. Esseghir, “A deep learning approach for anomaly detection and prediction in power consumption data,” IEEE Access, vol. 13, no. 1, pp. 1633–1651, 2020. [Google Scholar]
39. C. Yin, S. Zhang, J. Wang and N. N. Xion, “Anomaly detection based on convolutional recurrent autoencoder for IoT time series,” IEEE Transactions on Systems, Man, and Cybernetics: Systems, vol. 1, pp. 1–11, 2020. [Google Scholar]
40. W. Yao, Z. Zeng, C. Lian and H. Tang, “Pixel-wise regression using u-net and its application on pan sharpening,” Neurocomputing, vol. 3, no. 12, pp. 364–371, 2018. [Google Scholar]
Cite This Article
 Copyright © 2023 The Author(s). Published by Tech Science Press.
This work is licensed under a Creative Commons Attribution 4.0 International License , which permits unrestricted use, distribution, and reproduction in any medium, provided the original work is properly cited.
 Downloads
 Citation Tools