
 Submit a Paper
 Propose a Special lssue
 Open Access
ARTICLE

Sparrow Search Optimization with Transfer Learning-Based Crowd Density Classification
1 Department of Management Information Systems, Faculty of Economics and Administration, King Abdulaziz University, Jeddah, 21589, Saudi Arabia
2 School of Math, Comp. Sc. and Engg, Department of Electrical and Electronic Engg., London, UK
3 Department of Marketing, Faculty of Economics and Administration, King Abdulaziz University, Jeddah, 21589, Saudi Arabia
4 Department of Business Administration, Faculty of Economics and Administration, King Abdulaziz University, Jeddah, 21589, Saudi Arabia
* Corresponding Author: Mohammad Yamin. Email:
Computers, Materials & Continua 2023, 74(3), 4965-4981. https://doi.org/10.32604/cmc.2023.033705
Received 25 June 2022; Accepted 15 September 2022; Issue published 28 December 2022
 View Full Text
 Download PDF
Abstract
Due to the rapid increase in urbanization and population, crowd gatherings are frequently observed in the form of concerts, political, and religious meetings. HAJJ is one of the well-known crowding events that takes place every year in Makkah, Saudi Arabia. Crowd density estimation and crowd monitoring are significant research areas in Artificial Intelligence (AI) applications. The current research study develops a new Sparrow Search Optimization with Deep Transfer Learning based Crowd Density Detection and Classification (SSODTL-CD2C) model. The presented SSODTL-CD2C technique majorly focuses on the identification and classification of crowd densities. To attain this, SSODTL-CD2C technique exploits Oppositional Salp Swarm Optimization Algorithm (OSSA) with EfficientNet model to derive the feature vectors. At the same time, Stacked Sparse Auto Encoder (SSAE) model is utilized for the classification of crowd densities. Finally, SSO algorithm is employed for optimal fine-tuning of the parameters involved in SSAE mechanism. The performance of the proposed SSODTL-CD2C technique was validated using a dataset with four different kinds of crowd densities. The obtained results demonstrated that the proposed SSODTL-CD2C methodology accomplished an excellent crowd classification performance with a maximum accuracy of 93.25%. So, the proposed method will be highly helpful in managing HAJJ and other crowded events.Keywords
Automatic examination of severely-congested and distinct varieties of crowded scenes is a difficult task to accomplish due to which the domain has received significant interest among image processing and computer vision communities. The exponential rise in the global population in recent times, especially in urban regions, paved the way for highly-congested crowds. This unprecedented growth in crowd gatherings poses serious public safety and health issues [1]. Crowd examination and monitoring is a vital processes in public areas in order to provide a safe environment to the public. In recent years, various crowd disasters have occurred owing to the absence of crowd control management. Although crowds comprise of separate individuals, everyone has their own aims and behavioral patterns. The nature of the crowds and their distinct features are commonly interpreted to get cooperative characteristics that can be commonly defined [2,3]. Crowd data like density and flow are vital factors in handling, designing, and managing public places such as political gatherings, temples, etc. [4]. In recent times, the crowd examination domain has concentrated on the development of task-oriented systems that carry out processes like crowd density estimation, crowd counting, anomaly detection, etc. It is reported that the learning of correlated processes, concurrently, can enhance separate task efficiency [5,6].
The existing mass density estimation algorithm [7] that depends upon regression is not precise for 20–50 people gatherings. In certain outdoor scenes like streets and flyovers, crowd density should be mastered. The algorithm can offer data on abnormal crowd flow and crowd distribution on a timely basis [8]. Crowd density assessment, for sparse scenes, is a significant topic and is challenging to accomplish. A Convolution Neural Network (CNN) is nothing but a plain Neural Network (NN) but consists of receptive fields or neurons that possess learnable biases and weights [9]. Every receptive field receives a batch input and implements a convolutional function, after which the outcome is fed into a non-linearity function [10].
Zhu et al. [11] proposed a solution for crowd density estimation problems in sparse or dense conditions. The proposed method has two contributions to the research community; (i) Classification Activation Map (CAM) approach is followed that can offer personal place data and guide in the creation of a whole density map from the last phase (ii) and a network termed ‘Patch Scale Discriminant Regression Network (PSDR)’ can be utilized to validate the model. In order to provide input crowd images, the proposed algorithm separates the images into patches and sends those image patches, of various density levels, to distinct regression systems in order to obtain the equivalent density map. Fitwi et al. [12] examined a new solution that evaluates interpersonal distance between a couple of dynamic human objects, in the region employed with dynamic density, and the crowd with the help of an edge camera.
Saleem et al. [13] presented a computationally economical and fine-tuned ensemble regression-based Machine Learning (ML) approach to estimate the crowd density. The proposed approach extracted various texture-based features like Grey Level Co-occurrence Matrix (GLCM), Local Binary Patterns (LBP), and Histogram Of Gradients (HOG) and structural features like perimeter of the pixels and its location. Ding et al. [14] examined a new encoding-decoding CNN that combines the feature map with either encoder or decoder sub-networks to generate a further reasonable density map and estimate the count of people accurately. The proposed model has the ability to establish a novel estimation approach called Patch Absolute Error (PAE) which can measure the accuracy of the density maps. In literature [15], a novel testing process was proposed based on the Features from the Accelerated Segment Test (FAST) technique to detect the crowd features using aerial images captured from different camera locations and directions.
Though HAJJ is a regular and well-organized event, thousands of people perished in HAJJ stampedes too, like other crowded events. Indeed, crowded event managers around the globe are continuously looking for technology-driven improved management of crowded events. HAJJ normally attracts about 2.5 million pilgrims to Makkah, Saudi Arabia. It also comprises of a set of highly complex rituals that require en masse participation of all the pilgrims in tight deadlines. For example, all the pilgrims are required to travel from Makkah to Arafat valley which is about 20 km away, and return on the same day. It is extremely challenging to organize transportation facilities for 2.5 million people, for the upward and downward journeys on the same day. Further, all the pilgrims are expected to take part in some other similar activities on the same day or in daylight period. Hectic activities and frequent movement of people en masse caused stampedes and other hazards, historically. So, the current research work outcomes will be highly helpful in addressing some of the issues faced by HAJJ pilgrims and participants of other such crowded events. More information on HAJJ and related issues can be found in literature.
The current research study develops a new Sparrow Search Optimization with Deep Transfer Learning based Crowd Density Detection and Classification (SSODTL-CD2C) methodology. The presented SSODTL-CD2C technique exploits the Oppositional Salp Swarm Optimization algorithm (OSSA) with EfficientNet model to derive the feature vectors. At the same time, Stacked Sparse Auto Encoder (SSAE) model is utilized for the classification of crowd densities. Finally, the SSO algorithm is employed for optimal fine-tuning of the parameters involved in the SSAE mechanism. The performance of the proposed SSODTL-CD2C system was validated using a dataset with four different kinds of crowd densities. In short, the contributions of the current study are summarized herewith.
• An intelligent SSODTL-CD2C model consisting of EfficientNet, OSSA-based hyperparameter tuning, and SSO with SSAE classification is presented. To the best of the authors’ knowledge, no studies published earlier presented SSODTL-CD2C model
• A novel OSSA-based hyperparameter selection technique is introduced in this study by integrating the concepts of OBL and SSA.
• SSO algorithm is used to optimize the parameters involved in SSAE model using cross-validation. This process helps in increasing the predictive outcomes of the proposed model for unseen data.
In this study, a novel SSODTL-CD2C methodology has been proposed for the identification and classification of crowd densities. Primarily, the proposed SSODTL-CD2C approach exploits OSSA with EfficientNet model to derive the feature vectors. Followed by, SSAE mechanism is utilized for the classification of crowd densities. Eventually, SSO mechanism is employed for optimal fine-tuning of the parameters related to SSAE model. Fig. 1 demonstrates the overall processes involved in SSODTL-CD2C approach.
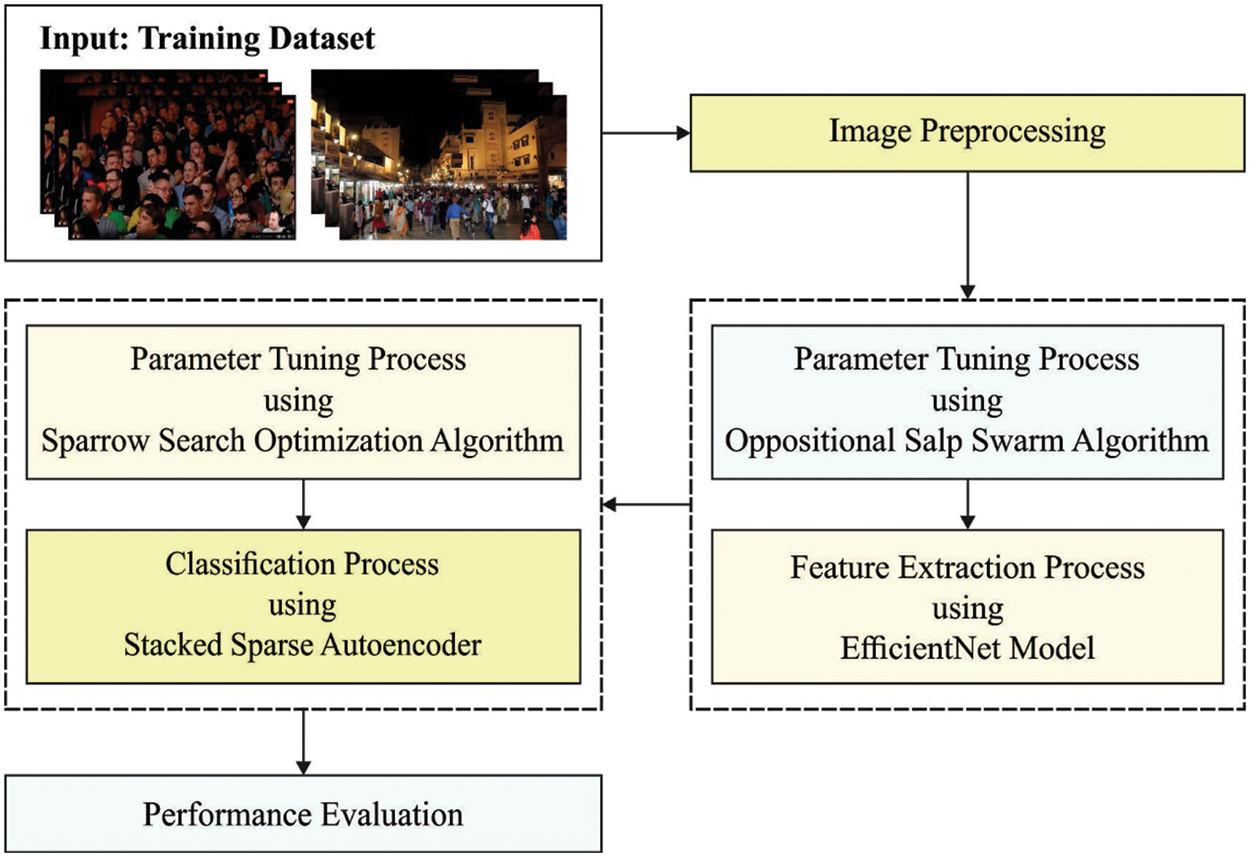
Figure 1: The overall process of SSODTL-CD2C approach
In this stage, the presented SSODTL-CD2C technique exploits EfficientNet model to derive the feature vectors. EfficientNet is a novel scaling methodology that was recently launched by Google team [16] to scale-up the CNN outcomes. It employs simple and highly-efficient compound coefficients. EfficientNet works differently compared to conventional techniques and scale-up the dimensions of the network including resolution, width, and depth. Further, it also scales up all the dimensions in the network data, using a certain set of scaling coefficients. Practically, the efficiency of the module can be enhanced by scaling up single dimensions. However, balancing each dimension of the network, in terms of accessible resources, increases the whole efficiency of the process. The efficiency of the scaled-up model strongly depends upon the standard network. It is constructed through AutoML architecture that in turn enhances the effectiveness and precision for the implementation of a neural structure search. Like MnasNet and MobileNetV2, EfficientNet employs mobile inverted bottleneck convolution (MBConv) as its key component. In addition, this system also employs a novel activation function named ‘swish’ rather than Rectified Linear Unit (ReLU) function. Here, the baseline structure of EfficientNet-B0 and its deep version i.e., EfficientNet-B3 are presented.
2.2 Hyperparameter Tuning Using OSSA
For optimal fine-tuning of the parameters involved in EfficientNet architecture, OSSA is utilized. SSA simulates the swarming performance of Salps. With a transparent body, SSA is simulated by the activities of Salp Swarming in water. Salp swarm is nothing but a chain of salps that use this formation for locomotion during foraging process [17]. For the purpose of modelling the Salps mathematically, the population is separated into two groups such as the leader that lies in front of the chains and its followers i.e., the rest of the salps
here,
here,
The opposite solution is achieved after relating both the solutions. Fig. 2 depicts the flowchart of SSA.
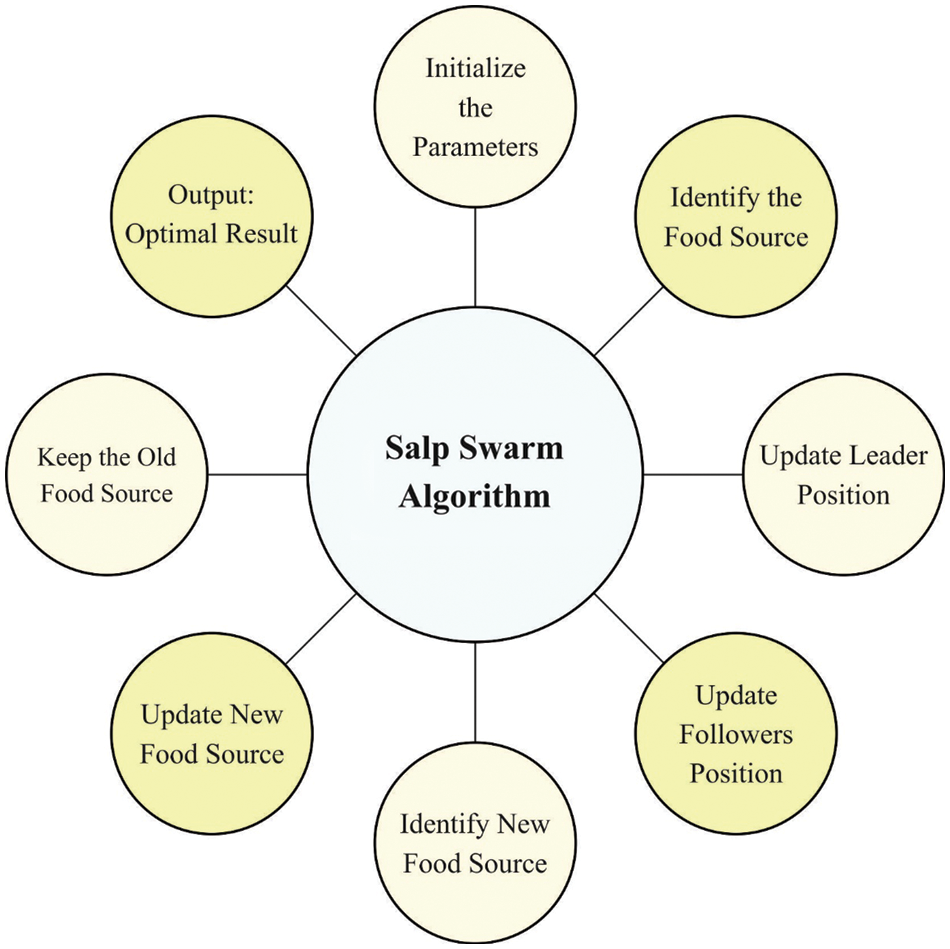
Figure 2: Flowchart of SSA
Definition: An opposite number if
here,
Definition: Opposite Vector, if
here,
2.3 Crowd Density Classification Using SSAE Model
Afterwards, SSAE model is utilized for the classification of crowd densities. Auto Encoder (AE) is an unsupervised learning network structure in which the output and input parameters are similar. Further, the node count in the middle layer is usually lesser than that of the node count on right and left sides. It works with Deep Learning (DL) technique to identify the effective depiction of the input dataset, without any data loss [18]. Briefly, it compresses the new information using encoder to achieve a low dimension that is recreated later into a new information with the help of decoder. In this algorithm, a trainable encoder can be utilized as a tool to reduce the data dimensionality issues. In comparison with conventional PCA data dimension reduction technique, AE achieves non-linear variations that facilitate the learning of prediction dataset. Even though AE has the ability to accomplish improved data dimensionality reduction compared to other techniques, an AE that is capable of performing dimensionality reduction and increasing the robustness of the data is proposed in this study to adapt for a complex network scenario. Dropout allows every neuron with a probability
Amongst the types of AE, sparse is the most applied type for handling classification problems. In SSAE, all the hidden states are made up of independently-trained SSAEs. Every Stacked Auto Encoder (SAE) considers the output of the hidden state of the preceding SSAE as its own input, so that the features of the input dataset are extracted alongside the hidden layer. This scenario enables the output neuron to implement the classifier after supervised training. Here, the training model is implemented using the above-discussed technique. The presented SSAE structure uses an input layer (
In Eq. (6),
Here,
Now
here,
2.4 Parameter Tuning Using SSO Algorithm
In this final stage, SSO approach is employed for optimal fine-tuning of the parameters involved in SSAE mechanism. SSO algorithm is an emergent evolutionary mechanism, inspired by anti-predation and sparrow foraging behaviours [19]. In comparison with conventional evolutionary algorithms, SSO algorithm has faster convergence speed and strong global search capability in terms of optimization issues. In SSO algorithm, the population is classified as producer and scrounger groups. At first, the producer group executes a large searching step to search for food. Then, the scrounger group follows the producer to find the food. In this searching method, the scrounger group has a huge probability to search for food through subsequent behaviour. However, the roles played by producer and scrounger are dynamically adjusted to search for high quality food sources. Subsequently, SSO algorithm is mathematically modelled as given herewith.
Step 1: Define the parameters such as maximum iteration (
In Eq. (10),
Step 2: The position of the producer is upgraded as given herewith.
In Eq. (11),
Step 3: The position of the scrounger is upgraded as follows.
In Eq. (12),
Step 4: In order to prevent potential danger, around 10–20 per cent of sparrows in the swarm are designated at a random fashion as scouters and their positions are upgraded as follows.
In Eq. (13),
Step 5: Upgrade the best and worst fitness values to obtain the novel position of each sparrow.
Step 6: When the end criteria are not satisfied, proceed to Step 2 for the following cycle; or else, the global better known location is found through sparrow population and is processed as the final solution for the targeted problem.
In this section, the crowd classification performance of the proposed SSODTL-CD2C method was validated using a dataset of 2,000 samples under four classes. Each class holds a set of 500 samples. Since no benchmark dataset is available in the literature, the current study authors have collected their own dataset. Table 1 depicts the details of the datasets.
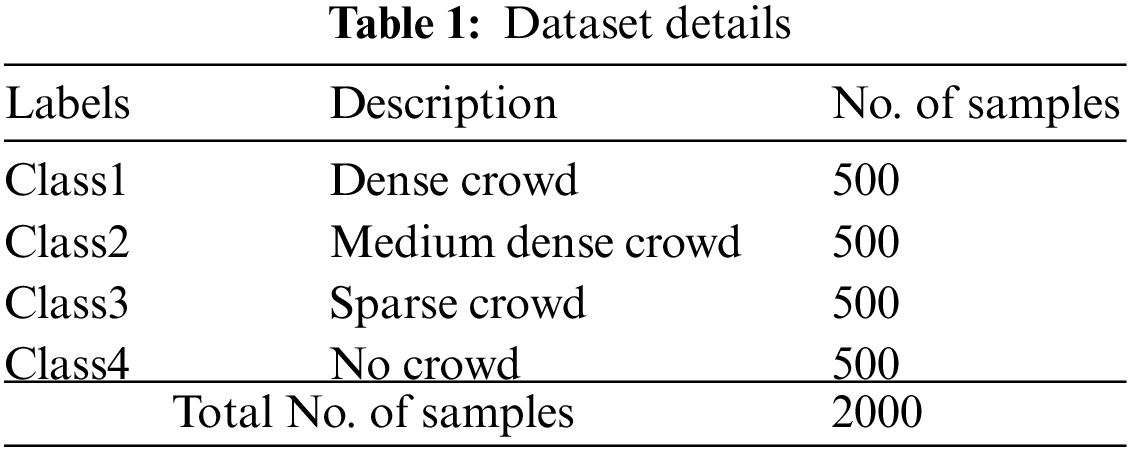
Fig. 3 reports the confusion matrices generated by the proposed SSODTL-CD2C model with 70:30 of TR/TS datasets. With 70% of training (TR) data, the proposed SSODTL-CD2C model recognized 270 samples as class 1, 244 samples as class 2, 313 samples as class 3 and 309 samples as class 4. Moreover, in 30% of testing (TS) dataset, the presented SSODTL-CD2C method classified 122 samples under class 1, 121 samples under class 2, 119 samples under class 3, and 139 samples under class 4.
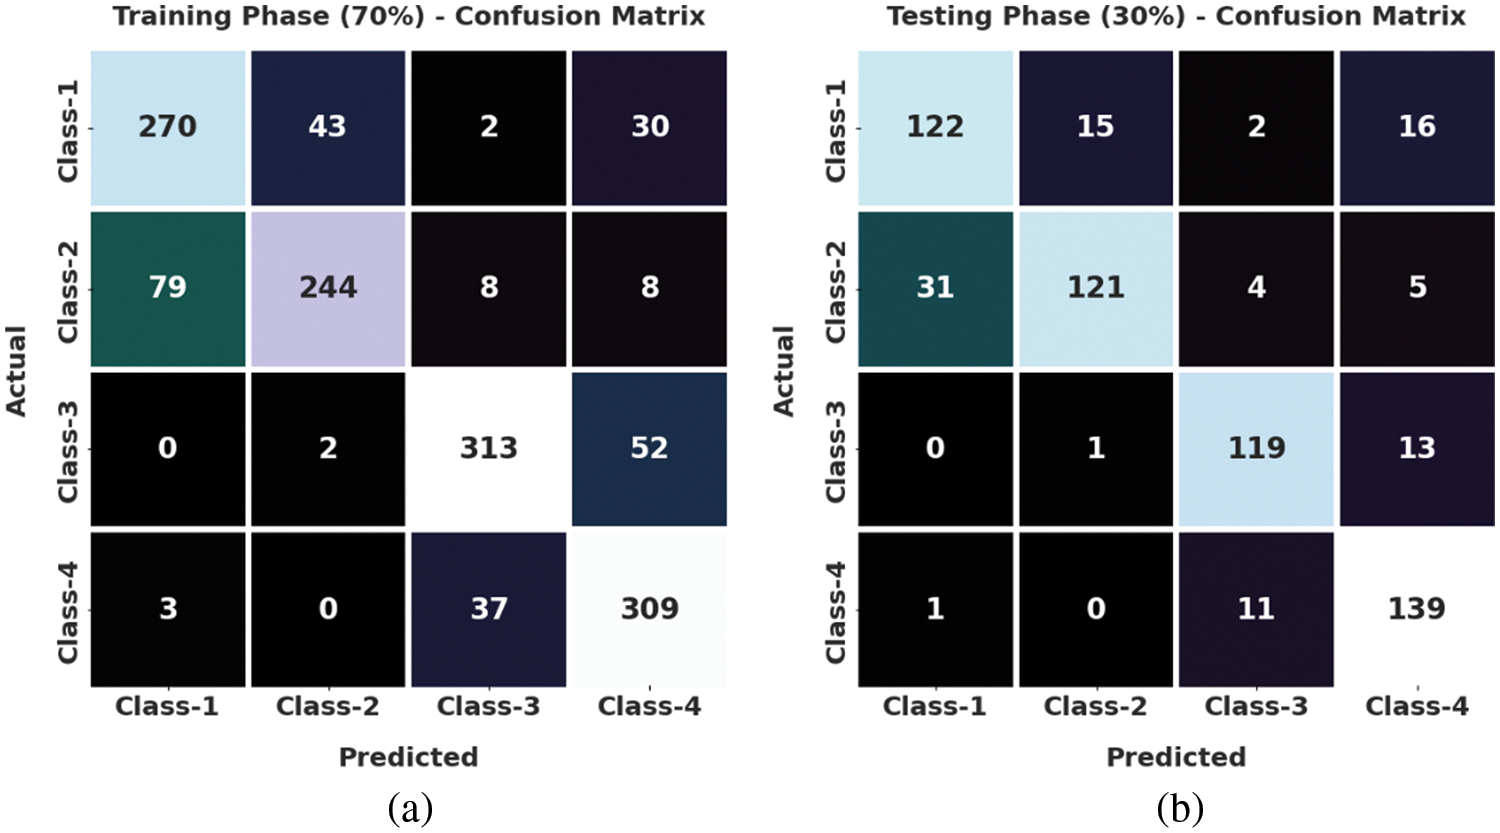
Figure 3: Confusion matrices of SSODTL-CD2C approach (a) 70% of TR data and (b) 30% of TS data
Table 2 provides the overall crowd classification outcomes achieved by the proposed SSODTL-CD2C method on 70:30 of TR/TS datasets.
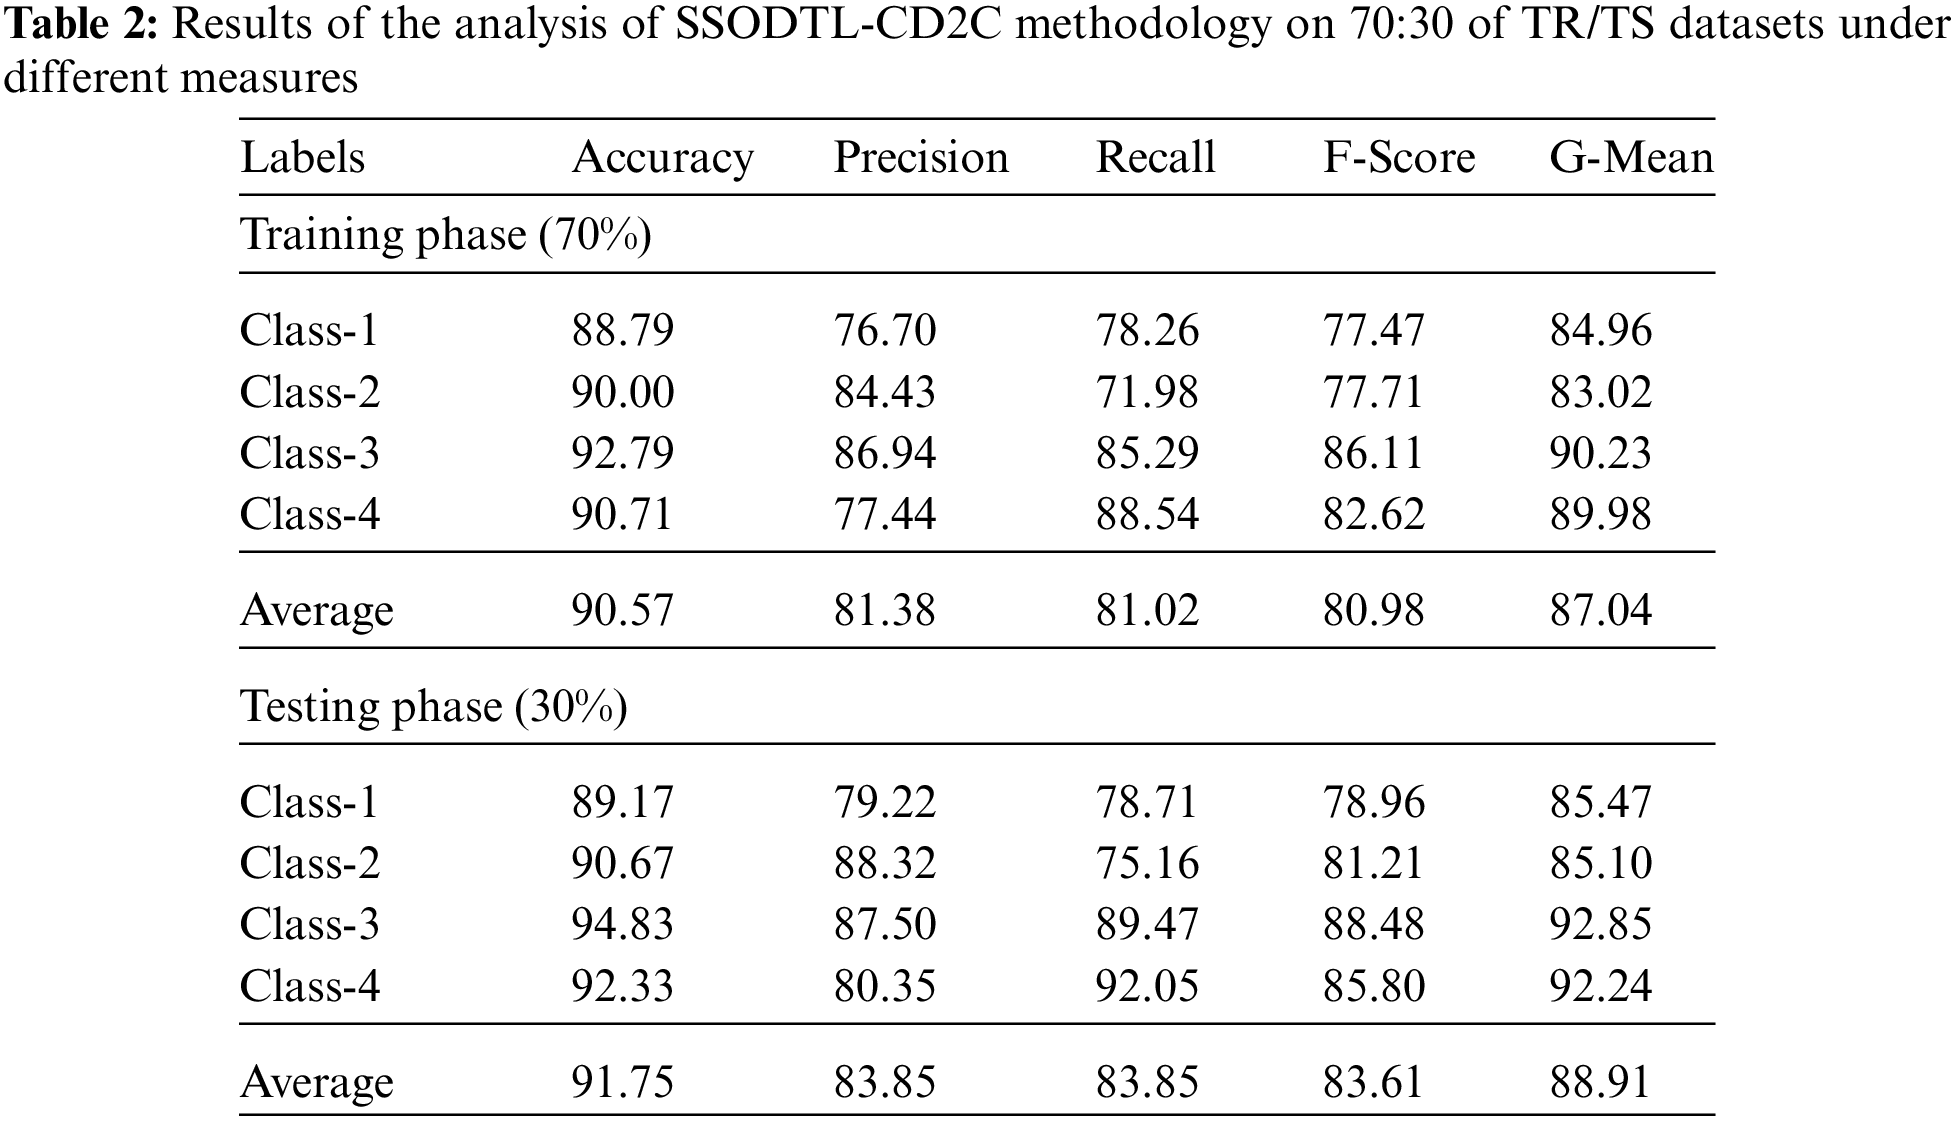
Fig. 4 exhibits the classification performance of the presented SSODTL-CD2C method on 70% of TR data. The figure shows that SSODTL-CD2C technique obtained effective outcomes under all the classes. For example, in class 1, the presented SSODTL-CD2C approach reached an
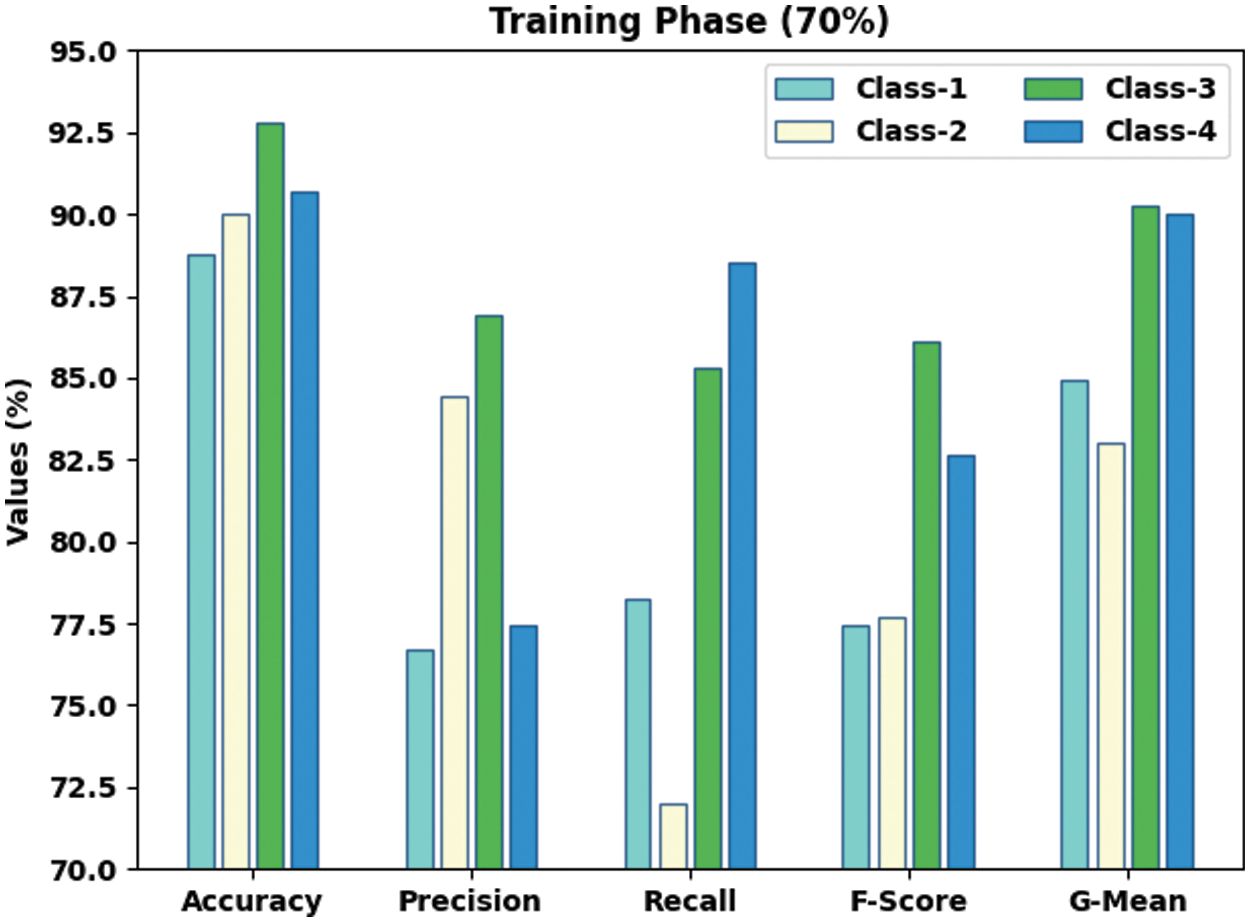
Figure 4: Results of the analysis of SSODTL-CD2C method under 70% of TR dataset
Fig. 5 displays the classification performance of the proposed SSODTL-CD2C approach on 30% of TS data. The figure shows that the presented SSODTL-CD2C approach achieved effective results under each class. For example, in class 1, the proposed SSODTL-CD2C method attained an
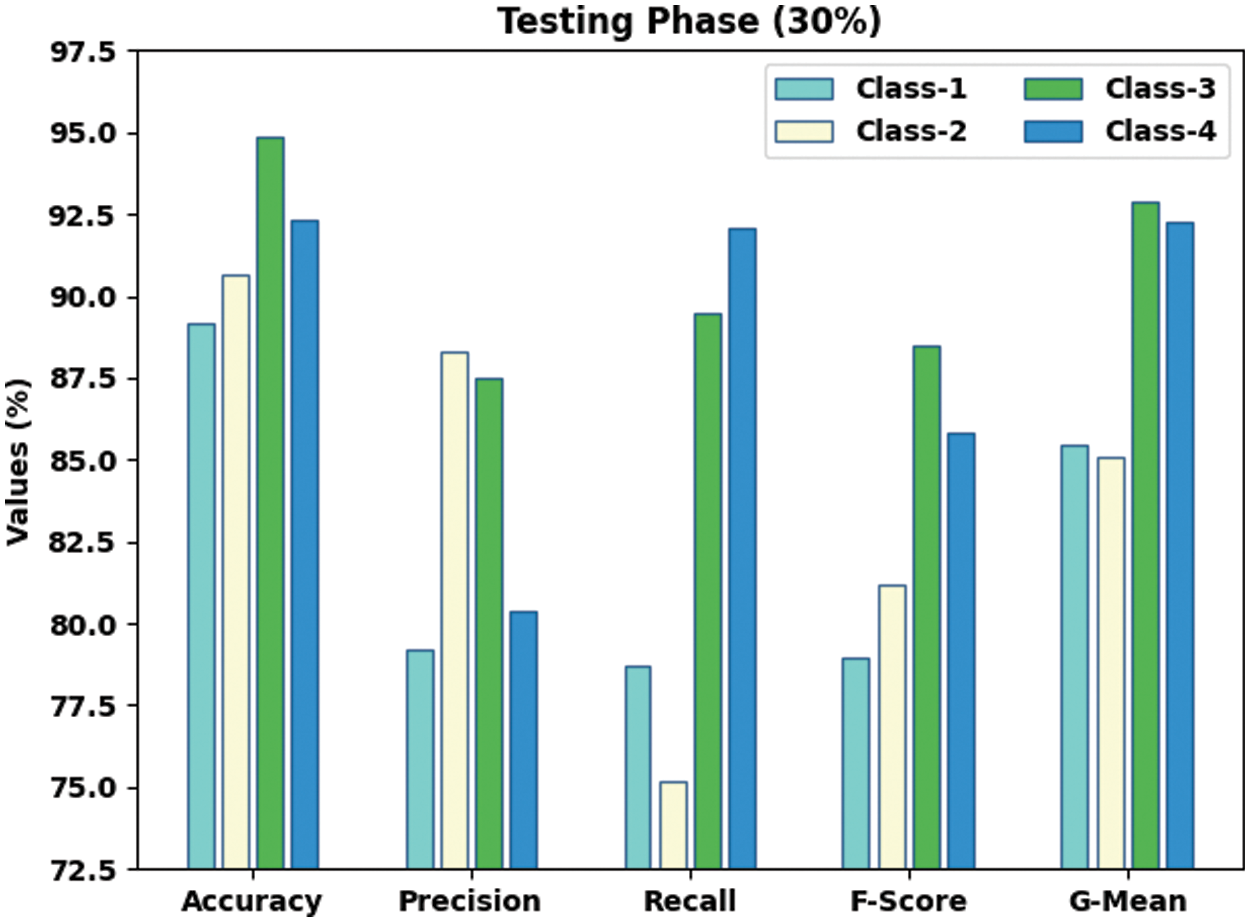
Figure 5: Results of the analysis of SSODTL-CD2C system under 30% of TS dataset
Fig. 6 demonstrates the confusion matrices generated by the proposed SSODTL-CD2C method with 80:20 of TR/TS datasets. With 80% of TR data, SSODTL-CD2C technique recognized 325 samples under class 1, 388 samples under class 2, 368 samples under class 3, and 342 samples under class 4. Furthermore, in 20% of TS data, the presented SSODTL-CD2C approach categorized 93 samples under class 1, 87 samples under class 2, 82 samples under class 3, and 84 samples under class 4.
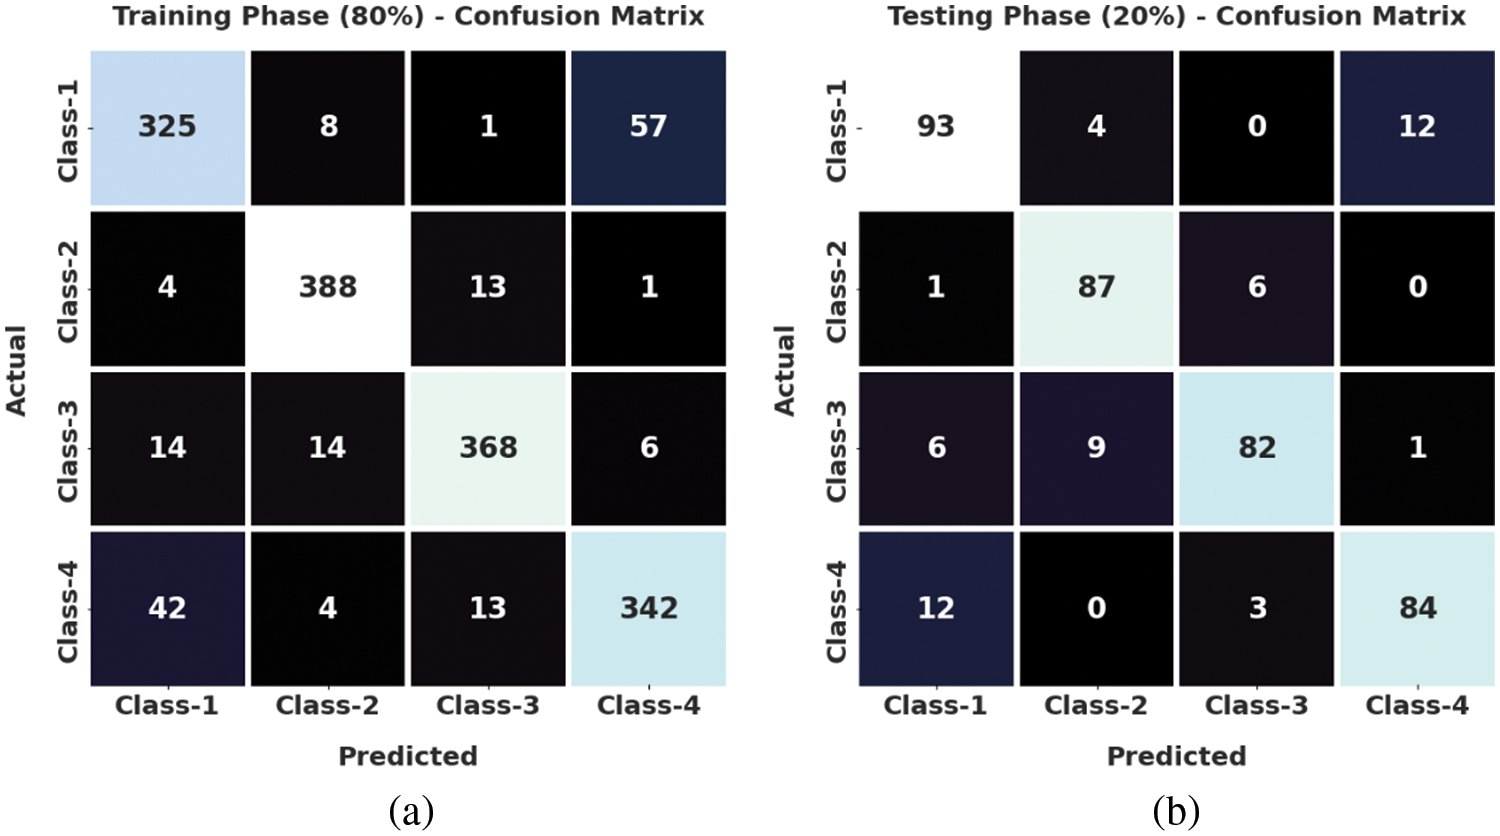
Figure 6: Confusion matrices of SSODTL-CD2C approach (a) 80% of TR data and (b) 20% of TS data
Table 3 offers the overall crowd classification results accomplished by the proposed SSODTL-CD2C method on 80:20 of TR/TS datasets.
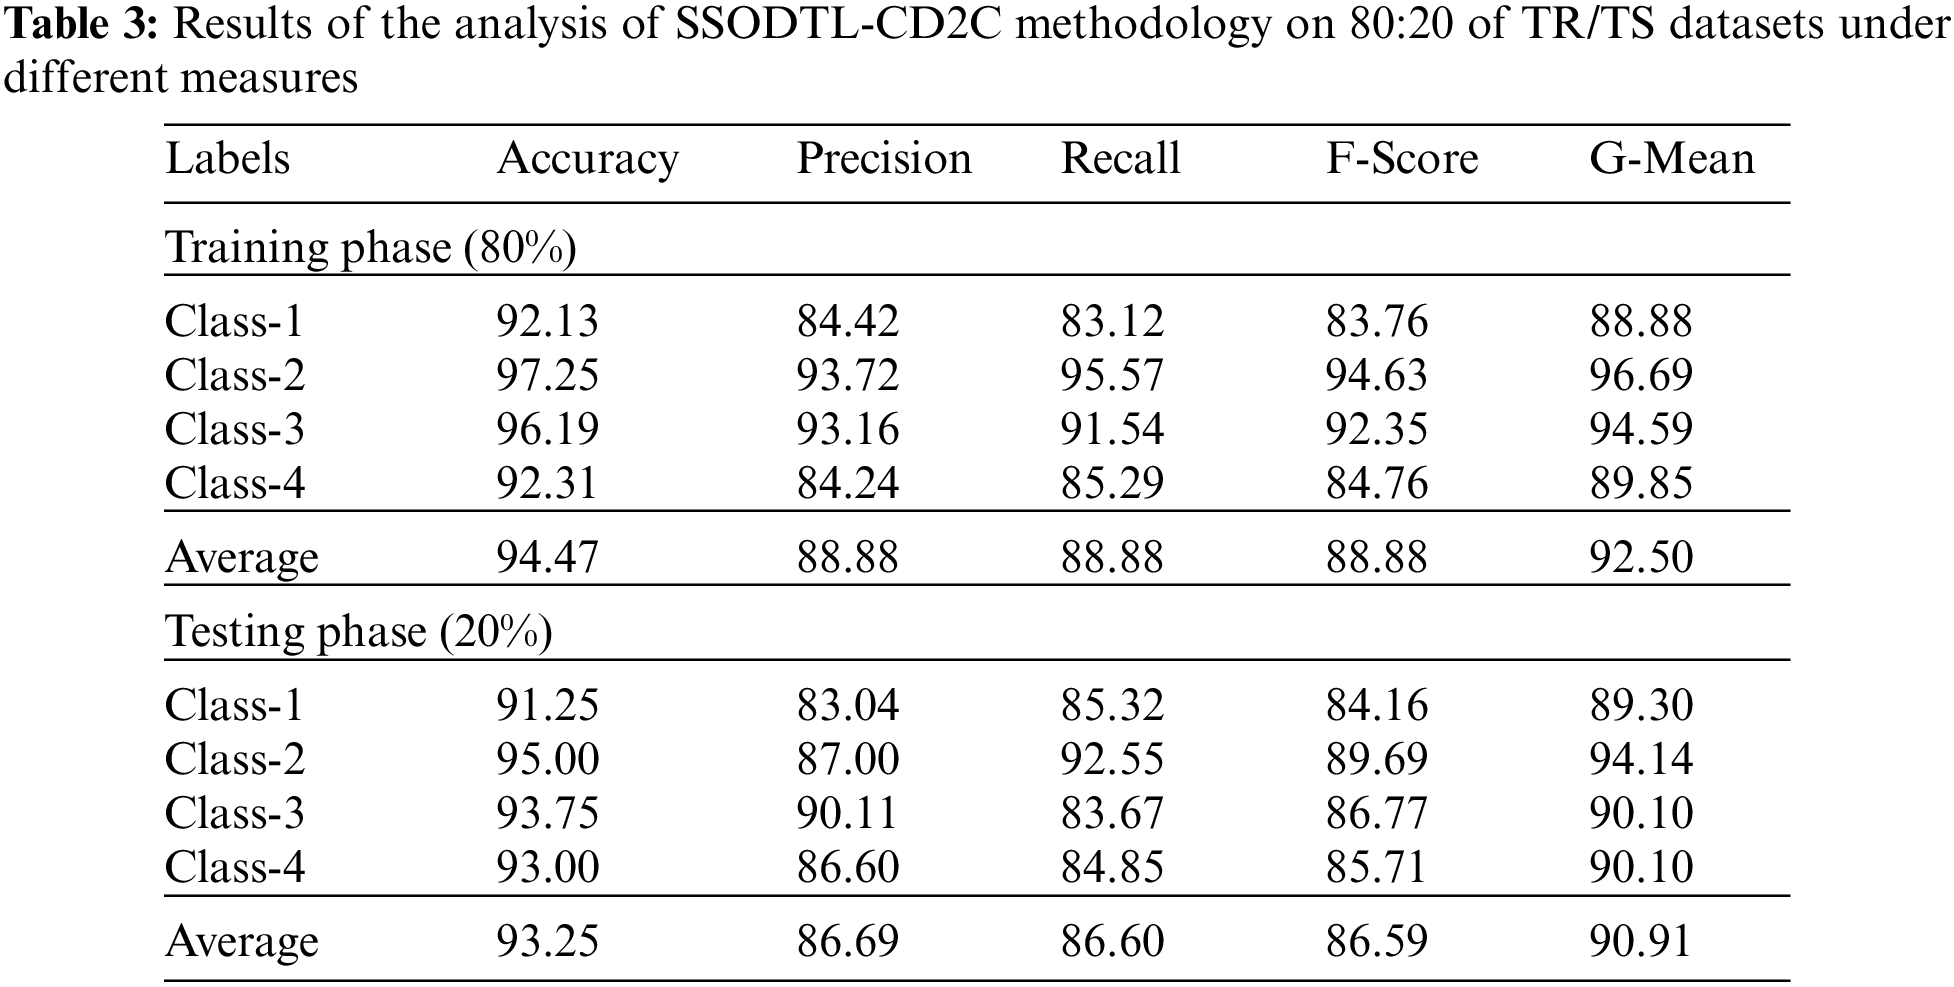
Fig. 7 demonstrates the classification performance of the presented SSODTL-CD2C method on 80% of TR data. The figure shows that SSODTL-CD2C method attained effective results under each class. For example, in class 1, the proposed SSODTL-CD2C technique produced an
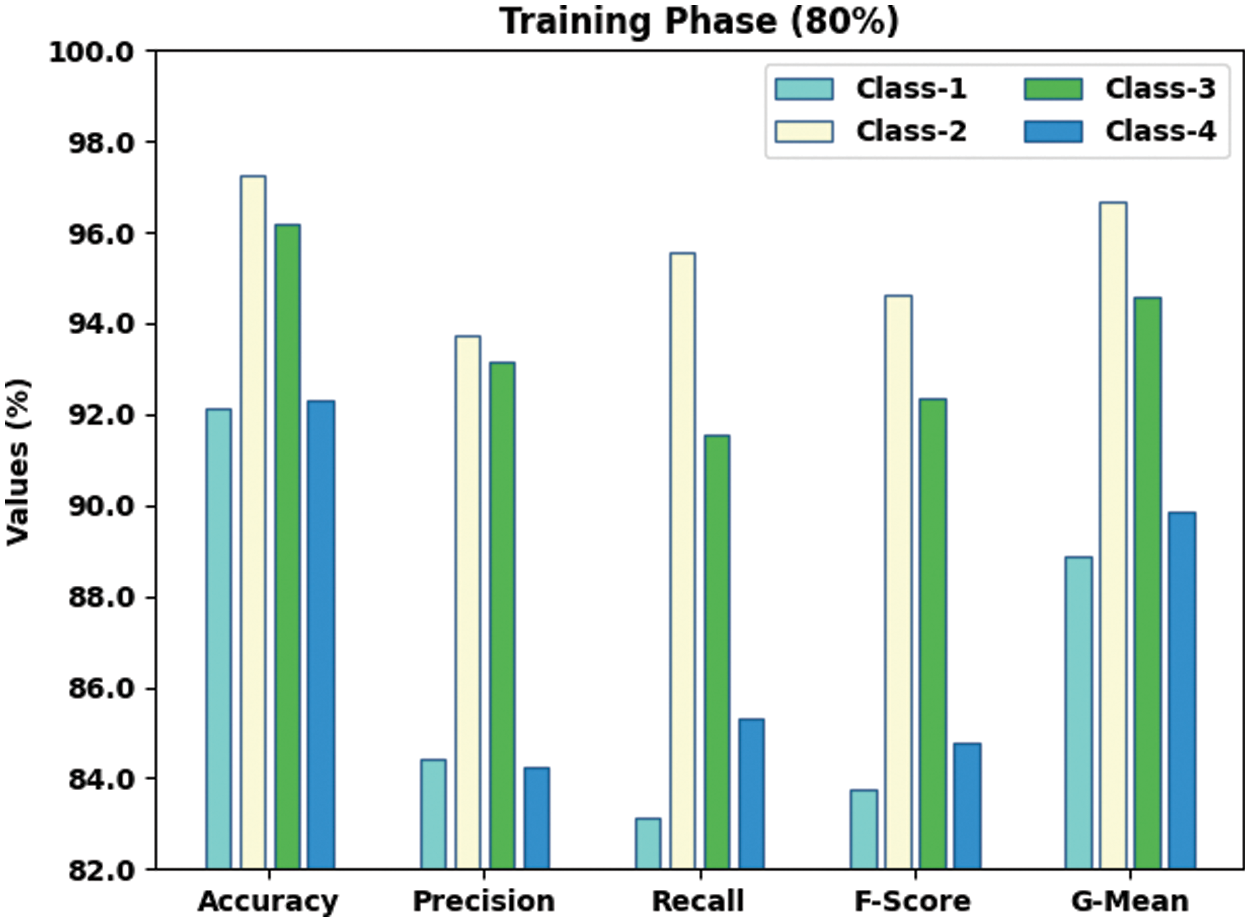
Figure 7: Results of the analysis of SSODTL-CD2C methodology under 80% of TR dataset
Fig. 8 displays the classification performance achieved by the proposed SSODTL-CD2C system on 20% of TS dataset. The figure shows that SSODTL-CD2C technique attained effective results under each class. For example, in class 1, the proposed SSODTL-CD2C method attained an
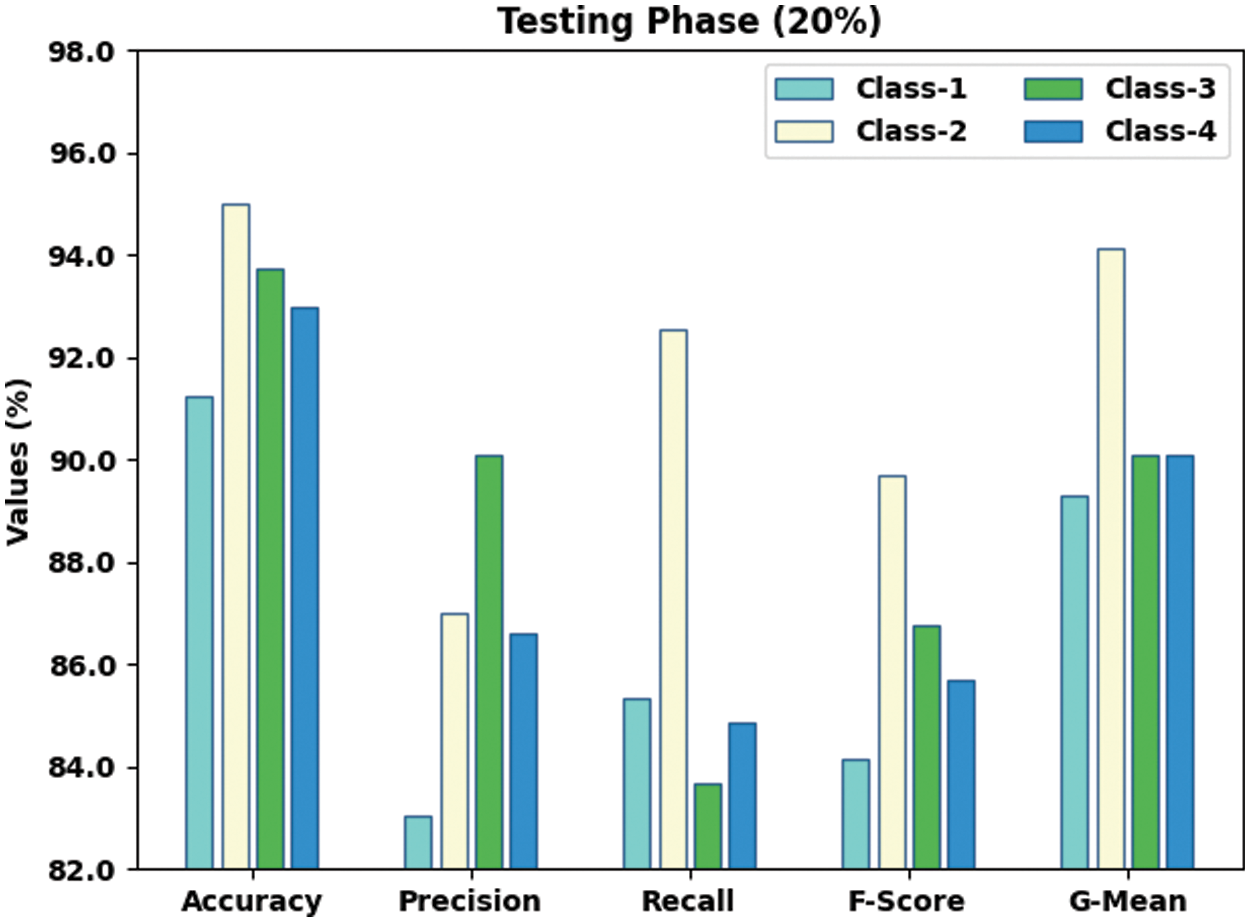
Figure 8: Results of the analysis of SSODTL-CD2C method under 20% of TS dataset
Both Training Accuracy (TA) and Validation Accuracy (VA) values, achieved by the proposed SSODTL-CD2C methodology on testing data, are illustrated in Fig. 9. The experimental result indicate that the proposed SSODTL-CD2C approach accomplished the maximal TA and VA values while VA values were higher than TA.
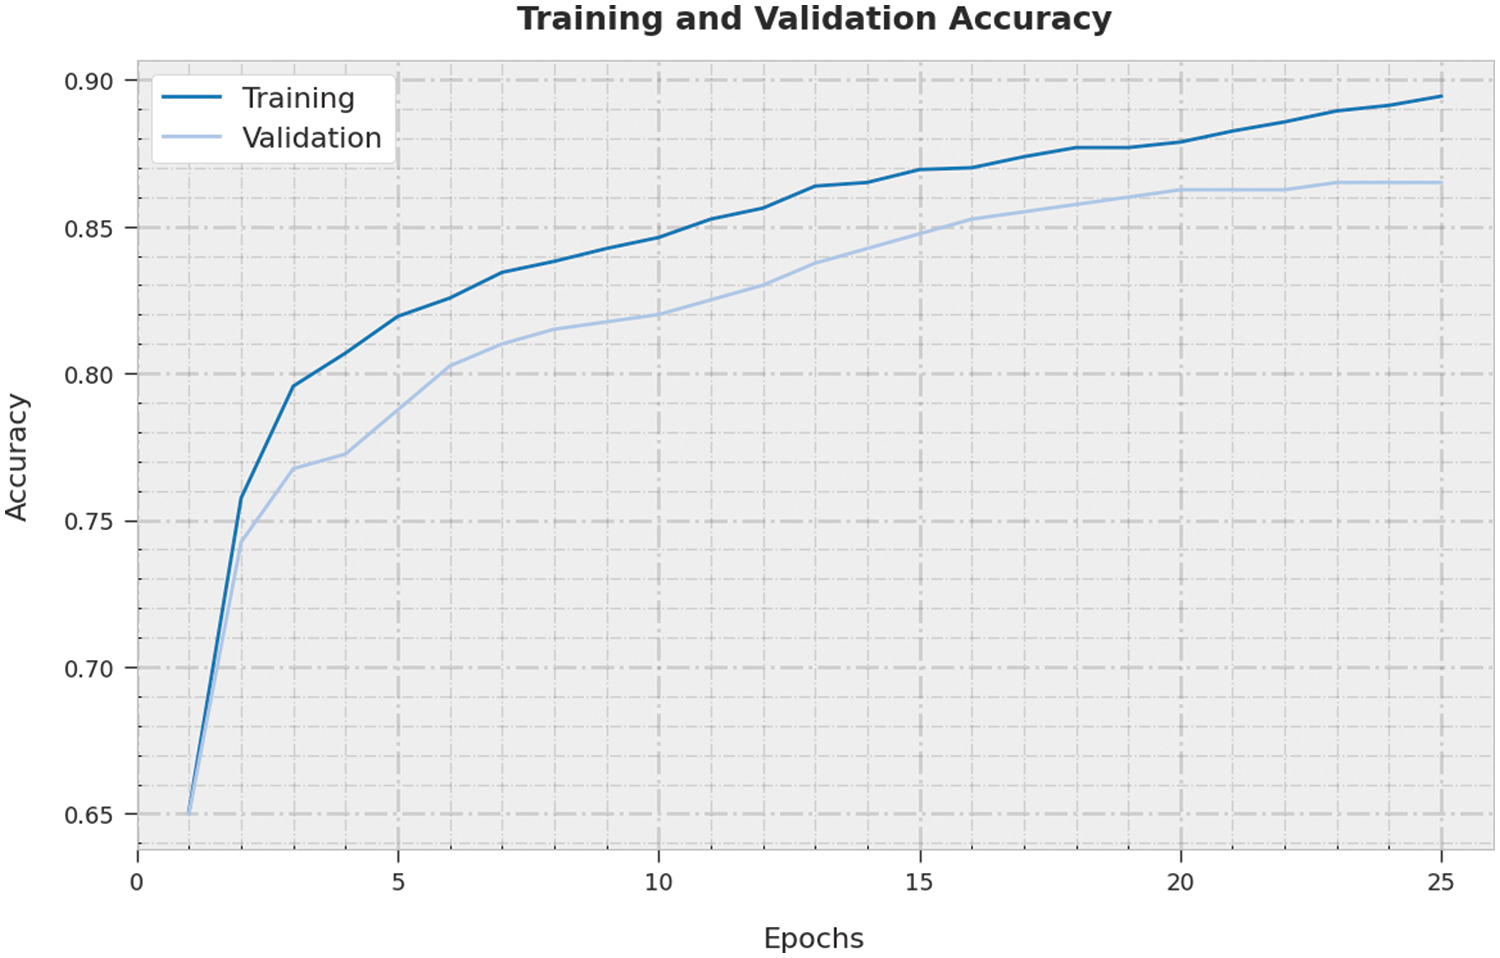
Figure 9: TA and VA analyses results of SSODTL-CD2C methodology
Both Training Loss (TL) and Validation Loss (VL) values, accomplished by the proposed SSODTL-CD2C methodology on testing data, are demonstrated in Fig. 10. The experimental outcomes infer that the proposed SSODTL-CD2C approach obtained minimal TL and VL values whereas VL values were lower than TL.
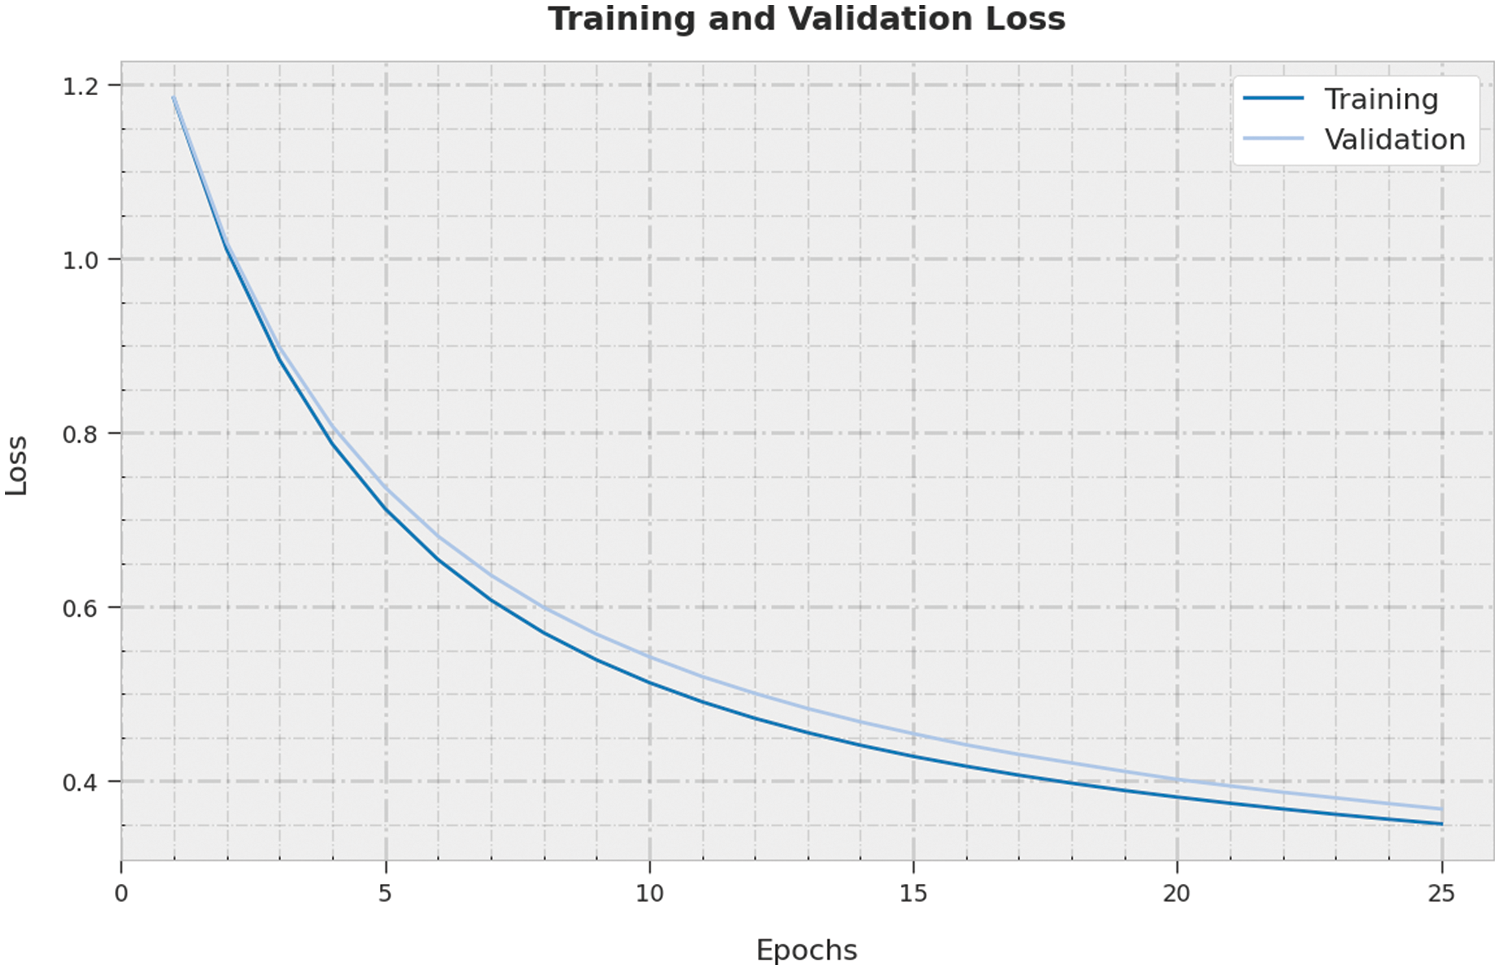
Figure 10: TL and VL analyses results of SSODTL-CD2C method
A clear precision-recall examination was conducted upon SSODTL-CD2C system using testing dataset and the results are shown in Fig. 11. The figure specifies that the proposed SSODTL-CD2C process produced improved precision-recall values under each class.
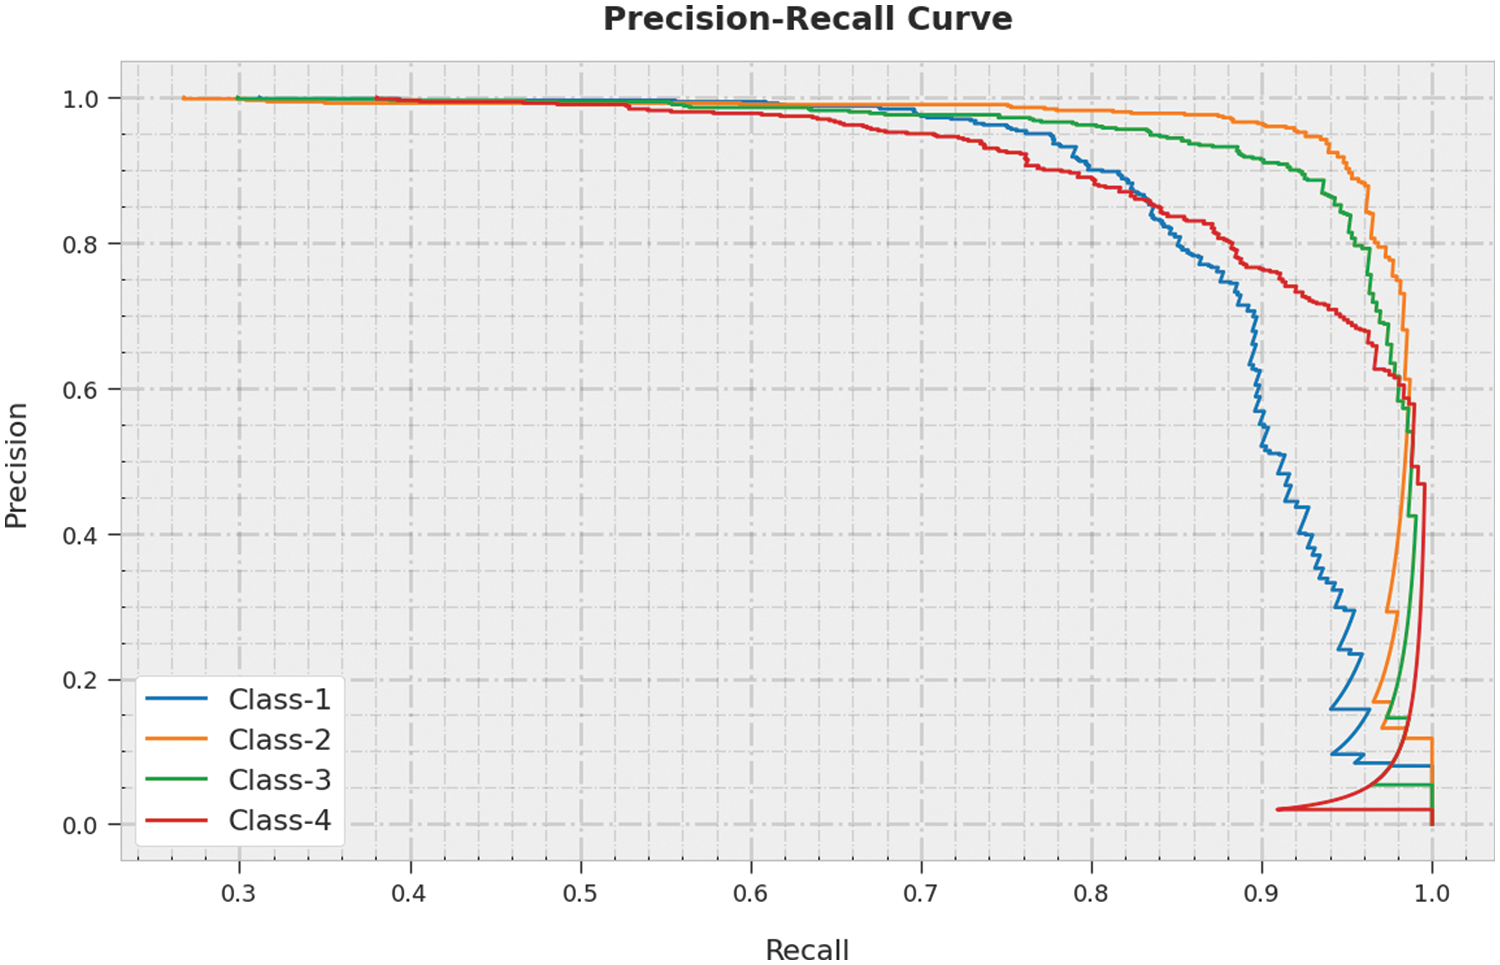
Figure 11: Precision-recall curve analysis results of SSODTL-CD2C methodology
A brief Receiver Operating Characteristic (ROC) analysis was conducted upon SSODTL-CD2C methodology on testing dataset and the results are portrayed in Fig. 12. The results denote that the proposed SSODTL-CD2C method demonstrated its capability in classifying the testing dataset under different classes.
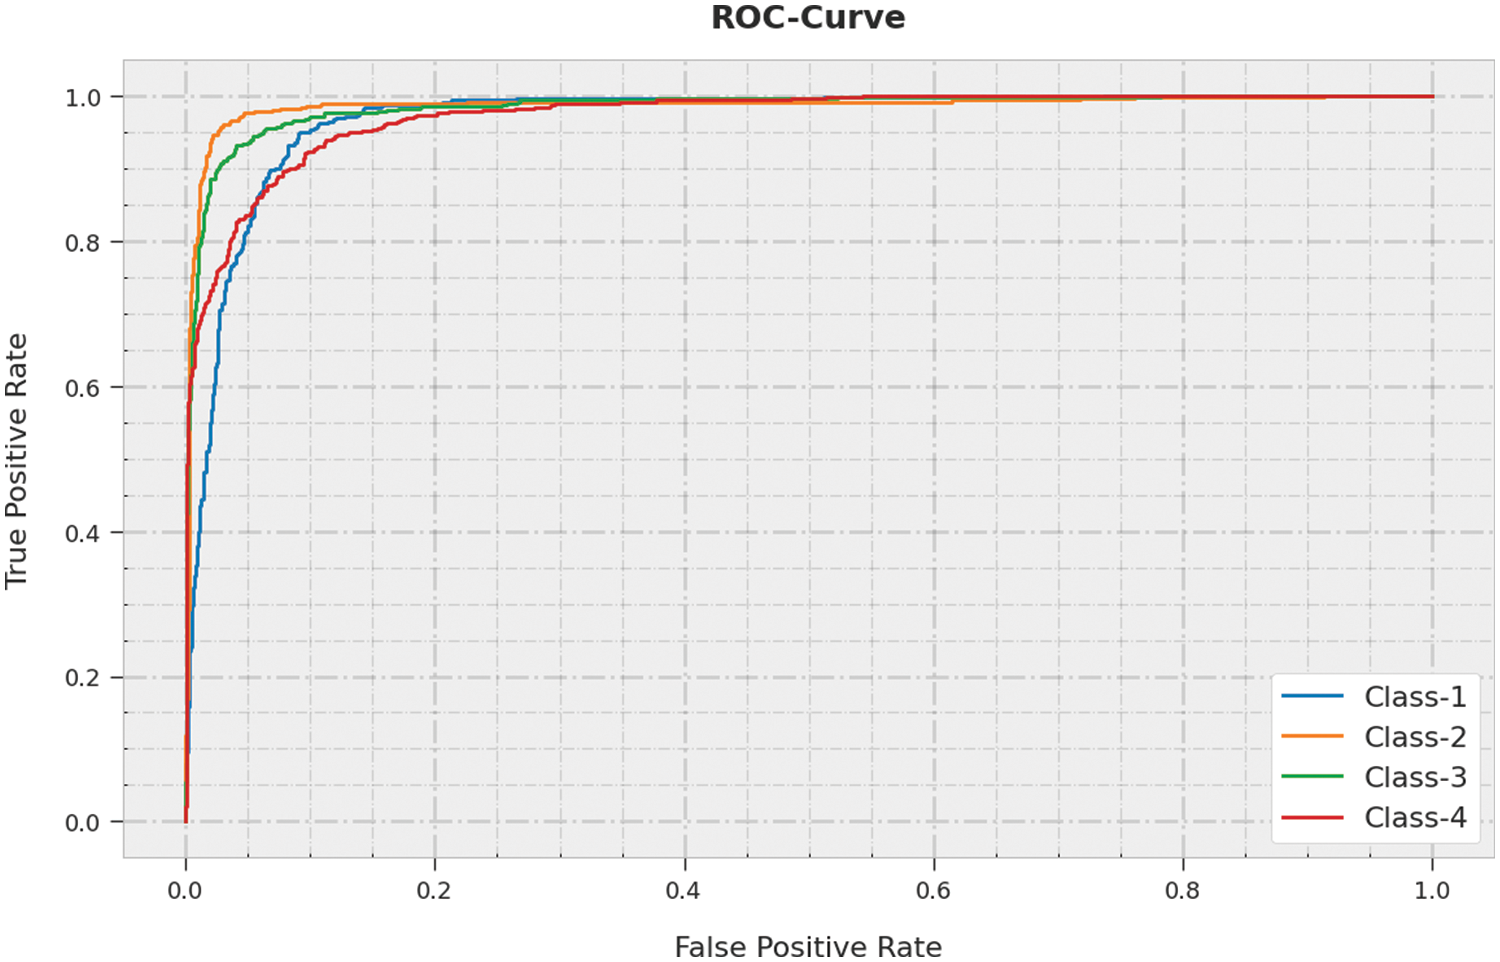
Figure 12: ROC curve analysis of SSODTL-CD2C method
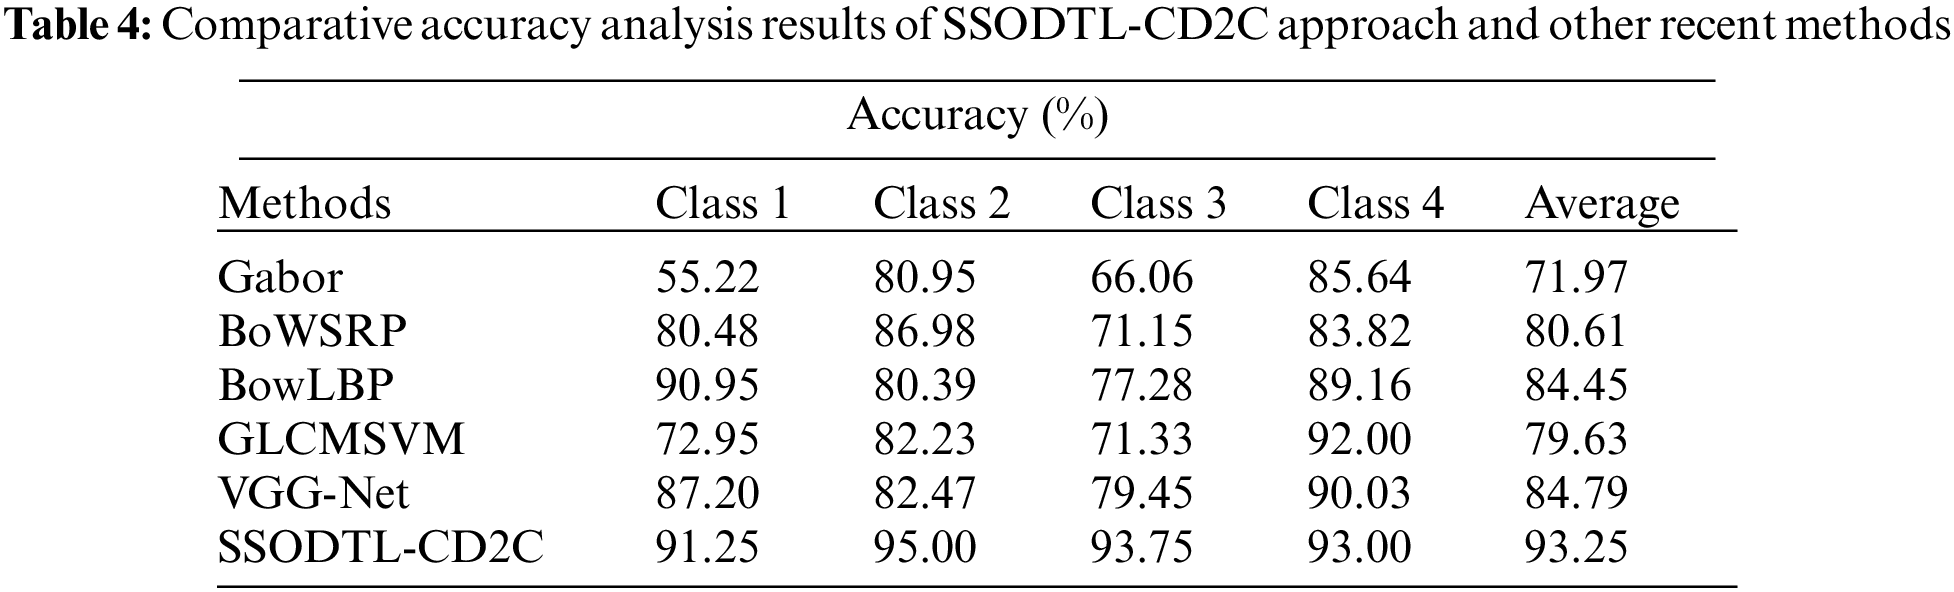
To assure the enhanced performance of the proposed SSODTL-CD2C model, a detailed comparative study was conducted and the results are shown in Table 4 [22,23]. The experimental values highlight that the proposed SSODTL-CD2C technique produced high
In this study, the SSODTL-CD2C approach has been presented for the identification and classification of crowd densities. Primarily, the SSODTL-CD2C technique exploited the OSSA with EfficientNet model to derive the feature vectors. Followed by, the SSAE model is utilized for the classification of the crowd densities. Eventually, the SSO technique is employed for the optimal fine-tuning of the parameters based on the SSAE method. The performance of the proposed SSODTL-CD2C technique was validated using the dataset with four different kinds of crowd densities. The obtained outcomes inferred the superior performance of SSODTL-CD2C approach with maximal crowd classification performance. As a part of the future scope, a new crowd counting approach should be derived to estimate the number of people. As commented earlier, the current research would help in achieving better crowd management for all the events globally.
Funding Statement: This research work was funded by Institutional Fund Projects under grant no. (IFPHI-097-120-2020). Therefore, authors gratefully acknowledge technical and financial support from the Ministry of education and King Abdulaziz University, DSR, Jeddah, Saudi Arabia.
Conflicts of Interest: The authors declare that they have no conflicts of interest to report regarding the present study.
References
1. G. Sreenu and M. A. S. Durai, “Intelligent video surveillance: A review through deep learning techniques for crowd analysis,” Journal of Big Data, vol. 6, no. 1, pp. 48, 2019. [Google Scholar]
2. L. Chen, G. Wang and G. Hou, “Multi-scale and multi-column convolutional neural network for crowd density estimation,” Multimedia Tools and Applications, vol. 80, no. 5, pp. 6661–6674, 2021. [Google Scholar]
3. H. Zheng, Z. Lin, J. Cen, Z. Wu and Y. Zhao, “Cross-line pedestrian counting based on spatially-consistent two-stage local crowd density estimation and accumulation,” IEEE Transactions on Circuits and Systems for Video Technology, vol. 29, no. 3, pp. 787–799, 2019. [Google Scholar]
4. A. Khan, J. A. Shah, K. Kadir, W. Albattah and F. Khan, “Crowd monitoring and localization using deep convolutional neural network: A review,” Applied Sciences, vol. 10, no. 14, pp. 4781, 2020. [Google Scholar]
5. D. Chaudhary, S. Kumar and V. S. Dhaka, “Video based human crowd analysis using machine learning: A survey,” Computer Methods in Biomechanics and Biomedical Engineering: Imaging & Visualization, vol. 10, no. 2, pp. 113–131, 2022. [Google Scholar]
6. H. Ullah, I. U. Islam, M. Ullah, M. Afaq, S. D. Khan et al., “Multi-feature-based crowd video modeling for visual event detection,” Multimedia Systems, vol. 27, no. 4, pp. 589–597, 2021. [Google Scholar]
7. H. Ammar and A. Cherif, “DeepROD: A deep learning approach for real-time and online detection of a panic behavior in human crowds,” Machine Vision and Applications, vol. 32, no. 3, pp. 1–15, 2021. [Google Scholar]
8. S. Elbishlawi, M. H. Abdelpakey, A. Eltantawy, M. S. Shehata and M. M. Mohamed, “Deep learning-based crowd scene analysis survey,” Journal of Imaging, vol. 6, no. 9, pp. 95, 2020. [Google Scholar]
9. G. Tripathi, K. Singh and D. K. Vishwakarma, “Convolutional neural networks for crowd behaviour analysis: A survey,” The Visual Computer, vol. 35, no. 5, pp. 753–776, 2019. [Google Scholar]
10. H. Jiang and W. Jin, “Effective use of convolutional neural networks and diverse deep supervision for better crowd counting,” Applied Intelligence, vol. 49, no. 7, pp. 2415–2433, 2019. [Google Scholar]
11. L. Zhu, C. Li, Z. Yang, K. Yuan and S. Wang, “Crowd density estimation based on classification activation map and patch density level,” Neural Computing and Applications, vol. 32, no. 9, pp. 5105–5116, 2020. [Google Scholar]
12. A. Fitwi, Y. Chen, H. Sun and R. Harrod, “Estimating interpersonal distance and crowd density with a single-edge camera,” Computers, vol. 10, no. 11, pp. 143, 2021. [Google Scholar]
13. M. S. Saleem, M. J. Khan, K. Khurshid and M. S. Hanif, “Crowd density estimation in still images using multiple local features and boosting regression ensemble,” Neural Computing and Applications, vol. 32, no. 21, pp. 16445–16454, 2020. [Google Scholar]
14. X. Ding, F. He, Z. Lin, Y. Wang, H. Guo et al., “Crowd density estimation using fusion of multi-layer features,” IEEE Transactions on Intelligent Transportation Systems, vol. 22, no. 8, pp. 4776–4787, 2021. [Google Scholar]
15. A. Almagbile, “Estimation of crowd density from UAVs images based on corner detection procedures and clustering analysis,” Geo-spatial Information Science, vol. 22, no. 1, pp. 23–34, 2019. [Google Scholar]
16. Y. Bazi, M. M. Al Rahhal, H. Alhichri and N. Alajlan, “Simple yet effective fine-tuning of deep CNNs using an auxiliary classification loss for remote sensing scene classification,” Remote Sensing, vol. 11, no. 24, pp. 2908, 2019. [Google Scholar]
17. M. Zivkovic, C. Stoean, A. Chhabra, N. Budimirovic, A. Petrovic et al., “Novel improved salp swarm algorithm: An application for feature selection,” Sensors, vol. 22, no. 5, pp. 1711, 2022. [Google Scholar]
18. J. Xu, L. Xiang, Q. Liu, H. Gilmore, J. Wu et al., “Stacked sparse auto encoder (SSAE) for nuclei detection on breast cancer histopathology images,” IEEE Transactions on Medical Imaging, vol. 35, no. 1, pp. 119–130, 2016. [Google Scholar]
19. J. Xue and B. Shen, “A novel swarm intelligence optimization approach: Sparrow search algorithm,” Systems Science & Control Engineering, vol. 8, no. 1, pp. 22–34, 2020. [Google Scholar]
20. Q. Liu, Y. Zhang, M. Li, Z. Zhang, N. Cao et al., “Multi-UAV path planning based on fusion of sparrow search algorithm and improved bioinspired neural network,” IEEE Access, vol. 9, pp. 124670–124681, 2021. [Google Scholar]
21. R. Liu, G. Li, L. Wie, Y. Xu, X. Gou et al., “Spatial prediction of groundwater potentiality using machine learning methods with grey wolf and sparrow search algorithms,” Journal of Hydrology, vol. 610, pp. 127977, 2022. [Google Scholar]
22. O. Meynberg, S. Cui and P. Reinartz, “Detection of high-density crowds in aerial images using texture classification,” Remote Sensing, vol. 8, no. 6, pp. 470, 2016. [Google Scholar]
23. S. Pu, T. Song, Y. Zhang and D. Xie, “Estimation of crowd density in surveillance scenes based on deep convolutional neural network,” Procedia Computer Science, vol. 111, no. 3, pp. 154–159, 2017. [Google Scholar]
Cite This Article
 Copyright © 2023 The Author(s). Published by Tech Science Press.
This work is licensed under a Creative Commons Attribution 4.0 International License , which permits unrestricted use, distribution, and reproduction in any medium, provided the original work is properly cited.
 Downloads
 Citation Tools