
 Submit a Paper
 Propose a Special lssue
 Open Access
ARTICLE

Deep Transfer Learning Driven Automated Fall Detection for Quality of Living of Disabled Persons
1 King Salman Center for Disability Research, Riyadh, Saudi Arabia
2 Department of Special Education, College of Education, King Saud University, Riyadh, 12372, Saudi Arabia
3 Department of Information Technology, College of Computers and Information Technology, Taif University, P.O. Box 11099, Taif, 21944, Saudi Arabia
4 Department of Computer Science, College of Science & Arts, King Khaled University, Saudi Arabia
5 Department of Computer Science, College of Sciences and Humanities-Aflaj, Prince Sattam bin Abdulaziz University, Saudi Arabia
6 Department of Computer and Self Development, Preparatory Year Deanship, Prince Sattam bin Abdulaziz University, AlKharj, Saudi Arabia
* Corresponding Author: Anwer Mustafa Hilal. Email:
Computers, Materials & Continua 2023, 74(3), 6719-6736. https://doi.org/10.32604/cmc.2023.034417
Received 16 July 2022; Accepted 03 October 2022; Issue published 28 December 2022
 View Full Text
 Download PDF
Abstract
Mobile communication and the Internet of Things (IoT) technologies have recently been established to collect data from human beings and the environment. The data collected can be leveraged to provide intelligent services through different applications. It is an extreme challenge to monitor disabled people from remote locations. It is because day-to-day events like falls heavily result in accidents. For a person with disabilities, a fall event is an important cause of mortality and post-traumatic complications. Therefore, detecting the fall events of disabled persons in smart homes at early stages is essential to provide the necessary support and increase their survival rate. The current study introduces a Whale Optimization Algorithm Deep Transfer Learning-Driven Automated Fall Detection (WOADTL-AFD) technique to improve the Quality of Life for persons with disabilities. The primary aim of the presented WOADTL-AFD technique is to identify and classify the fall events to help disabled individuals. To attain this, the proposed WOADTL-AFD model initially uses a modified SqueezeNet feature extractor which proficiently extracts the feature vectors. In addition, the WOADTL-AFD technique classifies the fall events using an extreme Gradient Boosting (XGBoost) classifier. In the presented WOADTL-AFD technique, the WOA approach is used to fine-tune the hyperparameters involved in the modified SqueezeNet model. The proposed WOADTL-AFD technique was experimentally validated using the benchmark datasets, and the results confirmed the superior performance of the proposed WOADTL-AFD method compared to other recent approaches.Keywords
Internet of Things (IoT) is a networking phenomenon of smart devices connected via the Internet and transmitting information amongst themselves, excluding computers [1]. The IoT-based services empower disabled persons to function autonomously, especially in their day-to-day activities. Further, it also reduces certain requirements for human accommodations or intermediaries. Nowadays, advanced IoT devices and their services can be easily accessed by disabled persons; some IoT techniques are specially developed for disabled people, whereas a few other techniques are re-processed for disabled individuals [2]. The IoT and the associated information collection result in availability-based developments ranging from smart home devices to self-driving cars [3]. The data collected from disabled persons are used in the IoT services whereas the devices might offer perceptions, opportunities and challenges. Such perceptions are utilized in optimizing the existing IoT products or developing a new product [4].
The Human Fall Detection (FD) techniques observe and classify the day-to-day life activities of disabled people to differentiate them from unintended fall events for which different techniques and sensors are utilized [5,6]. The researchers have categorized the FD systems into three categories: ambient sensors, cameras and wearable devices. Amongst the wearable devices, an accelerometer is a most commonly used device to realize a fall event. It exploits the acceleration measure to categorize the FD techniques [7]. Clifford et al. patented a human-body FD method with a wireless transmitter, accelerometer and a processor. The processor uses the measurements from the accelerometer to find whether an individual, who is wearing the device, has fallen or not based on the data recorded after a fall event due to no movements of the individual. Then, the generated response signal is transmitted remotely to a wireless transmission device [8]. To reduce the adverse effects of the human fall events, it is important to detect the fall events rapidly and provide an appropriate warning to the healthcare service provider [9]. Though it is not possible to avoid the falls completely, it can be prevented to a certain extent with the help of technological solutions and the physical exercises. The usage of the IoT devices can promote the application of the FD solutions by allowing remote and continuous monitoring of the context and its environment [10]. The wearable IoT devices can help the elderly people in terms of generating the walking profiles of the users, distinguishing the fall events from day-to-day activities and prediction of the falls on a real-time basis.
The authors in the literature [11] developed a Field-Programmable Gate Array (FPGA)-based FD technique with a threshold-based analytical model to reduce the false positive rate. Various researchers involved the non-fall events too, when assessing the general information. The suggested method was capable of differentiating the fall events from the non-fall events efficiently, excluding the falls and the fast-lying actions that may end up in sitting positions. The authors [12] focused on the energy efficiency of the wearable sensor nodes in the IoT-based FD technique. In this study, the authors developed an energy-efficient, tiny, lightweight and a flexible wearable device. The study assessed the impact of dissimilar characteristics (such as the transmission bus interface, sampling rate, communication rate and the communication protocol) upon the energy utilization of the wearable devices. Furthermore, the study also examined the energy usage of the wearables under different operating conditions and dissimilar configurations. In literature [13], the researchers developed an intelligent walking stick and a smart, effective technique based on wearable smart glasses for disabled persons. The study aimed to achieve the outcomes similar to the FD technique and avoid aerial obstacles. The suggested technique encompassed a smart walking stick, wearable smart glasses, a cloud-based information management platform and mobile devices. Disabled people can wear wearable smart glasses and hold smart walking sticks so that their fall events and aerial obstacles on the roads can be predicted earlier.
The authors [14] developed a wearable device named ‘TTXFD-based MPU6050’ to gather information on tri-axial acceleration signals. The study further developed a two-step FD technique combining the Threshold-Based Method (TBM) and the Machine Learning (ML) techniques. The proposed TTXFD used the TBM phase with a low computation difficulty for selection and the transmission of the suspicious fall information, i.e., tri-axial acceleration signals. During the machine learning phase, a two-stage approach was followed in which the data from the server was encoded as an image at first. Then, the FD technique was employed based on the Convolutional Neural Network (CNN) model to identify a fall event, according to the image. In literature [15], the authors identified the fall events in a realistic apartment measuring 40 square meters, using a Deep Neural Network (DNN) method and three ultra-wideband radars. In this method, the DNN method had a CNN method stacked with Long Short Term Memory (LSTM) and a Fully Connected Network (FCN) for the fall detection process. In other terms, the issue tackled in the study was the binary classification type that distinguishes the fall activities from the non-fall ones.
The current study introduces a Whale Optimization Algorithm Deep Transfer Learning-Driven Automated Fall Detection (WOADTL-AFD) technique to improve the Quality of life for disabled persons. The presented WOADTL-AFD technique aims to identify and classify the fall events to help disabled individuals. To attain this, the WOADTL-AFD model initially uses the modified SqueezeNet feature extractor which proficiently derives the feature vectors. In addition, the WOADTL-AFD technique classifies the fall events using an Extreme Gradient Boosting (XGBoost) classifier. In the presented WOADTL-AFD technique, the hyperparameters of the modified SqueezeNet model are fine-tuned with the help of the WOA approach. The proposed WOADTL-AFD technique was experimentally validated using a benchmark dataset.
This study developed a novel WOADTL-AFD model for automatic fall detection to help disabled persons. The presented WOADTL-AFD technique majorly concentrates on identifying and classifying fall events to assist disabled persons.
2.1 Feature Extraction: Modified SqueezeNet Model
The WOADTL-AFD model initially uses a modified SqueezeNet feature extractor in this study. The suggested structure is motivated by the SqueezeNet model, a depth-wise separable convolution layer, and an encoder-decoder approach, established in the SegNet approach [16]. The SqueezeNet structure is considered due to its unique fire module. In this work, the fire module is substituted by a ‘spark’ module which is a smaller version of the original one. The SqueezeNet model is utilized with spark modules in an encoder-decoder structure. Fig. 1 demonstrates the architecture of the fire module.
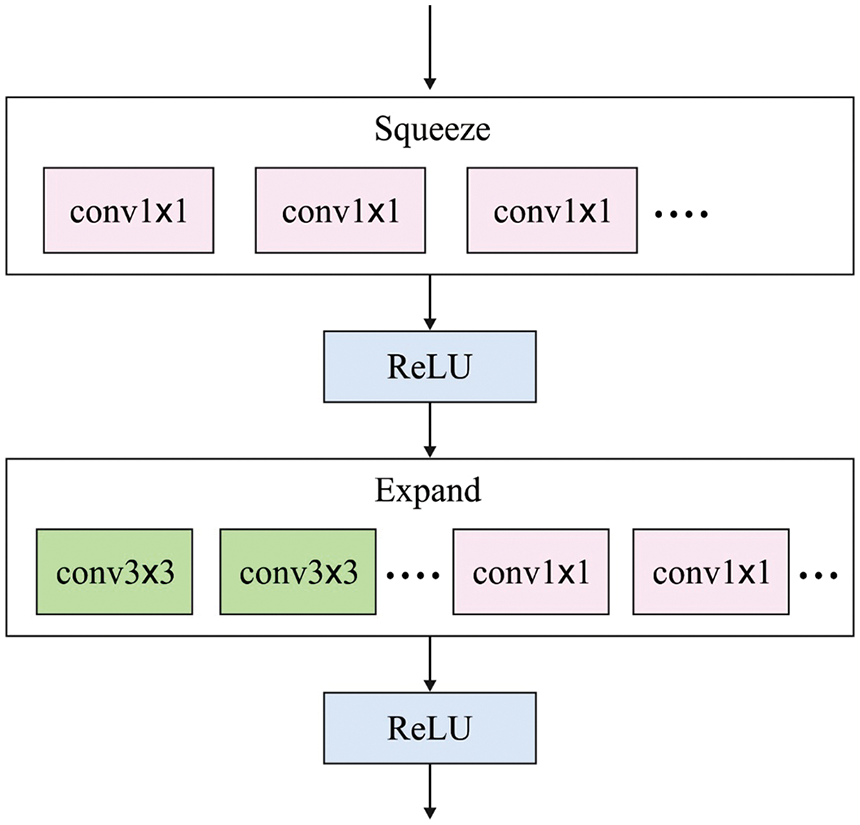
Figure 1: Architecture of the fire module
In this architecture, the encoder has four encoding blocks. The initial encoding block has a Rectified Linear Unit (ReLU) activation layer, a convolution layer and an average pooling layer. The 2nd and the 3rd blocks are comparable and include two spark modules and an average pooling layer. The last block contains four spark modules. The decoder architecture includes the SegNet model with the help of the max-unspooling layer with the forwarded pooling indices. Though this phenomenon reduces the computation complexity, it still results in the loss of accuracy. In the current study, the transposed depth-wise separable convolutions are used. A depth-wise separable convolution layer is applied for a standard convolution layer. This method with the transposed convolution, allows the features to be easily up-sampled when using a few parameters. In the decoding process, the initial decoder block employs a transposed depth-wise separable convolutional layer as the output of the absolute encoder. In the output segmentation mask, every pixel number corresponds to a class while a specific pixel has the maximum probability value. The final output is up-sampled to match the original input size. Instead of the whole set of features, the passing indices reduce the requirement for high memory. But, this phenomenon results in the loss of accuracy. In this model, the encoded feature map is passed onto the decoder. The observation proves that the number of parameters for this model is considerably lesser than the SegNet model. However, the accuracy is either comparable or better across different types of data sets. The projected architecture accomplishes a reasonable trade-off between computational complexity and the accuracy.
2.2 Hyperparameter Tuning: WOA
In the presented WOADTL-AFD technique, the hyperparameters of the modified SqueezeNet model are fine-tuned with the help of WOA. The searching procedure of the WOA method is inspired by the mathematical model of the bubble-net feeding approach, followed by the humpback whales [17]. The humpback whales express a form of cooperative behaviour when hunting prey. This distinct hunting approach is otherwise named as the bubble-net feeding approach. The humpback whales implement the bubble-net feeding approach by diving under a shoal of fishes. In this process, it instantaneously blows the bubbles and moves in a spherical shape towards the surface of the water. Here, the prey is enclosed by a spherical path of bubbles that inspire the prey to swim toward the surface.
Exploitation Process
In this exploitation phase, every solution candidate implements a neighbourhood search and is directed towards the location of the recent global optimal solution.
After gaining each solution, a fitness value is calculated, and the position of each solution in the population is upgraded in terms of optimal global location.
Now
Here, r denotes a uniformly-distributed pseudo-random number in the range of 0 and 1 and
As per the Eqs. (1)–(4), a solution candidate
The shrinking-encircling method and the spiral-shaped path mathematical modelling are utilized to emulate the bubble-net attack model.
The shrinking-encircling method is modelled and formulated as given herewith through a linear reduction of the vector α from 2 to 0 during each iteration.
In Eq. (5), t and max Iter denote the present and the maximal iteration counts correspondingly.
In this study, the researcher suggests that the value of
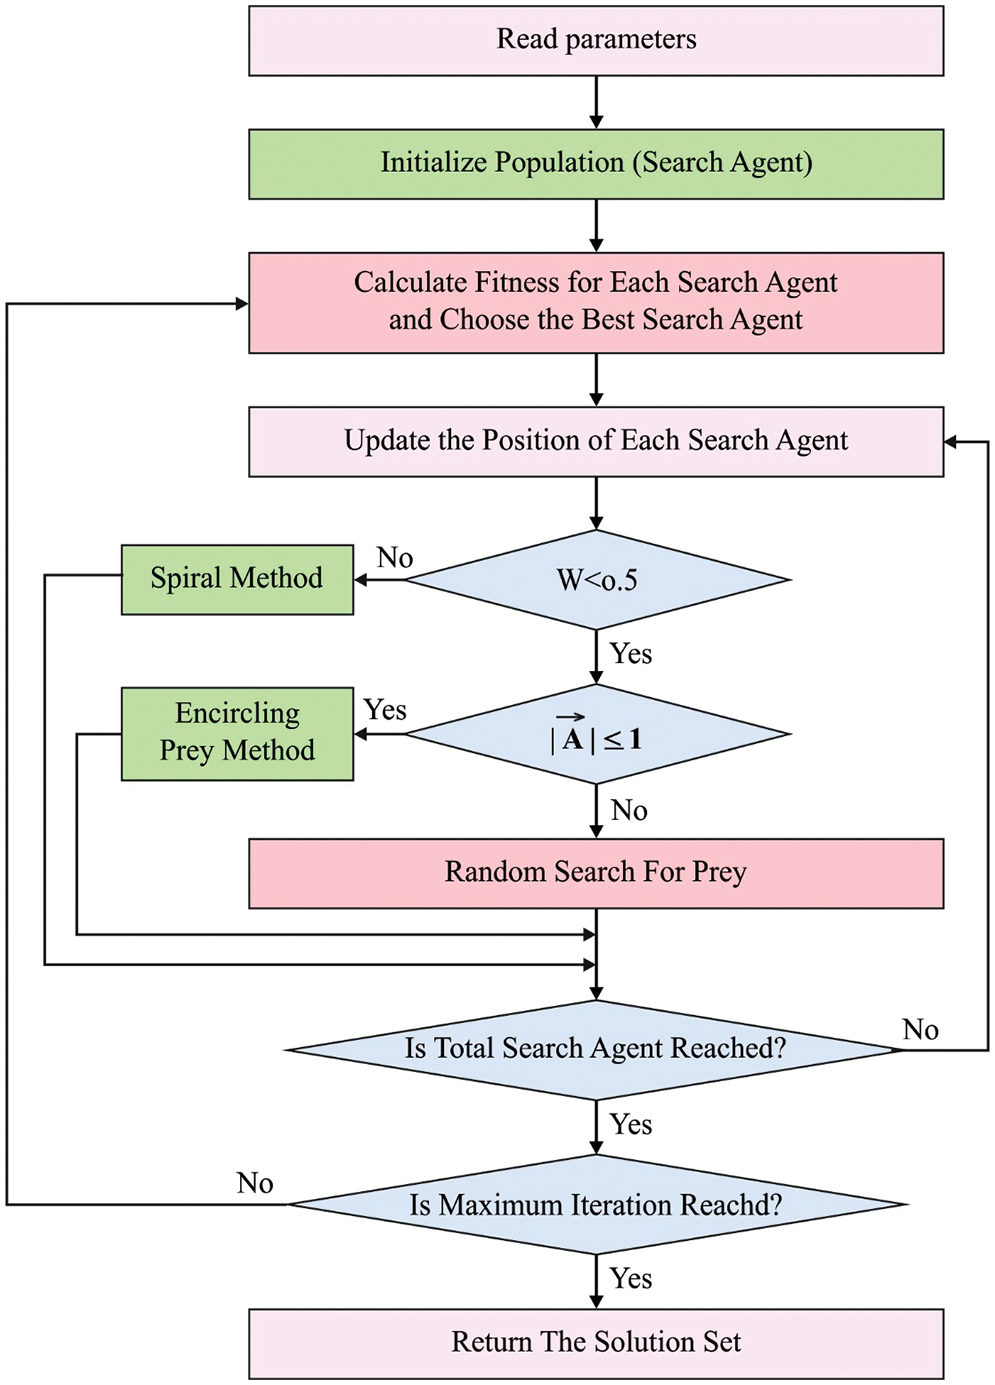
Figure 2: Flowchart of WOA
The next model that guides the exploitation procedure (a spiral-shaped path) is implemented herewith. At first, the distance between the current solution
In Eq. (6),
During all the iterations, the p probability is derived from an arbitrary distribution number within [
Exploration Process
In this stage, every solution candidate in the population is upgraded based on the location of the arbitrarily-selected solution rather than the optimal global solution.
For the exploration stage, a coefficient vector
In Eq. (8),
2.3 Fall Detection: XGBoost Model
For fall detection and classification processes, the XGBoost classification model is exploited. XGBoost is a Decision Tree (DT)-based ensemble learning method that is applied to resolve regression and classification issues [18]. XGBoost is a boosting algorithm, since it enhances the predictive strength of a model by training a set of weak learners and progressively transforming it into stronger ones. XGBoost is a widely-applied DT-based supervised learning method. Assume a data,
Now,
In Eq. (12),
XGBoost exploits a second-order Taylor expansion for approximation. The last objective function is formulated as given below.
In Eq. (13),
Now, L denotes the number of leaves in a tree. Consider
For a tree model, the solution weight
When the Eqs. (15) and (16) are merged, and the following result is attained.
The above equation is applied to evaluate a tree
Now
The proposed WOADTL-AFD model was experimentally validated using two standard datasets, the Multiple Cameras Fall (MCF) dataset and the UR Fall Detection (URFD) data. The details of the datasets are shown in Table 1.
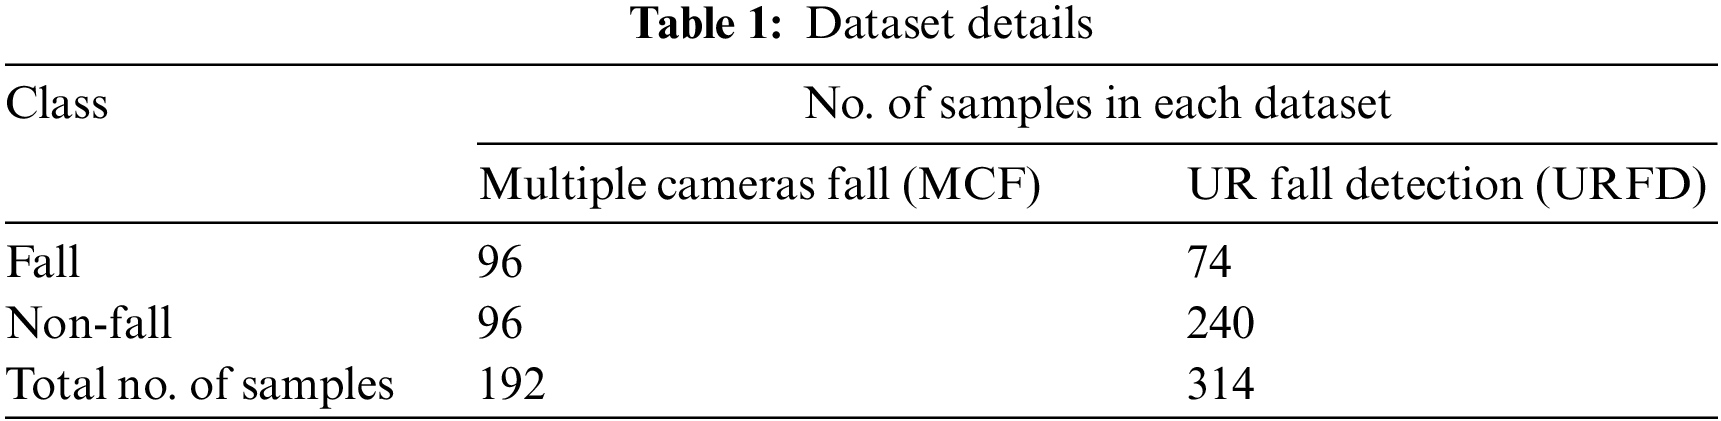
Fig. 3 depicts the confusion matrices generated by the proposed WOADTL-AFD method under dissimilar runs on the MCF dataset. The figure claims that the WOADTL-AFD technique proficiently recognized all the class labels. For instance, on run-1, the proposed WOADTL-AFD model classified 95 samples as Fall events and 96 as Non-Fall events. Along with that, on run-2, the presented WOADTL-AFD model recognized 93 samples as Fall event and 96 samples as Non-Fall event. In line with run-3, the proposed WOADTL-AFD model categorized 95 samples under Fall event and 96 samples under Non-Fall event.
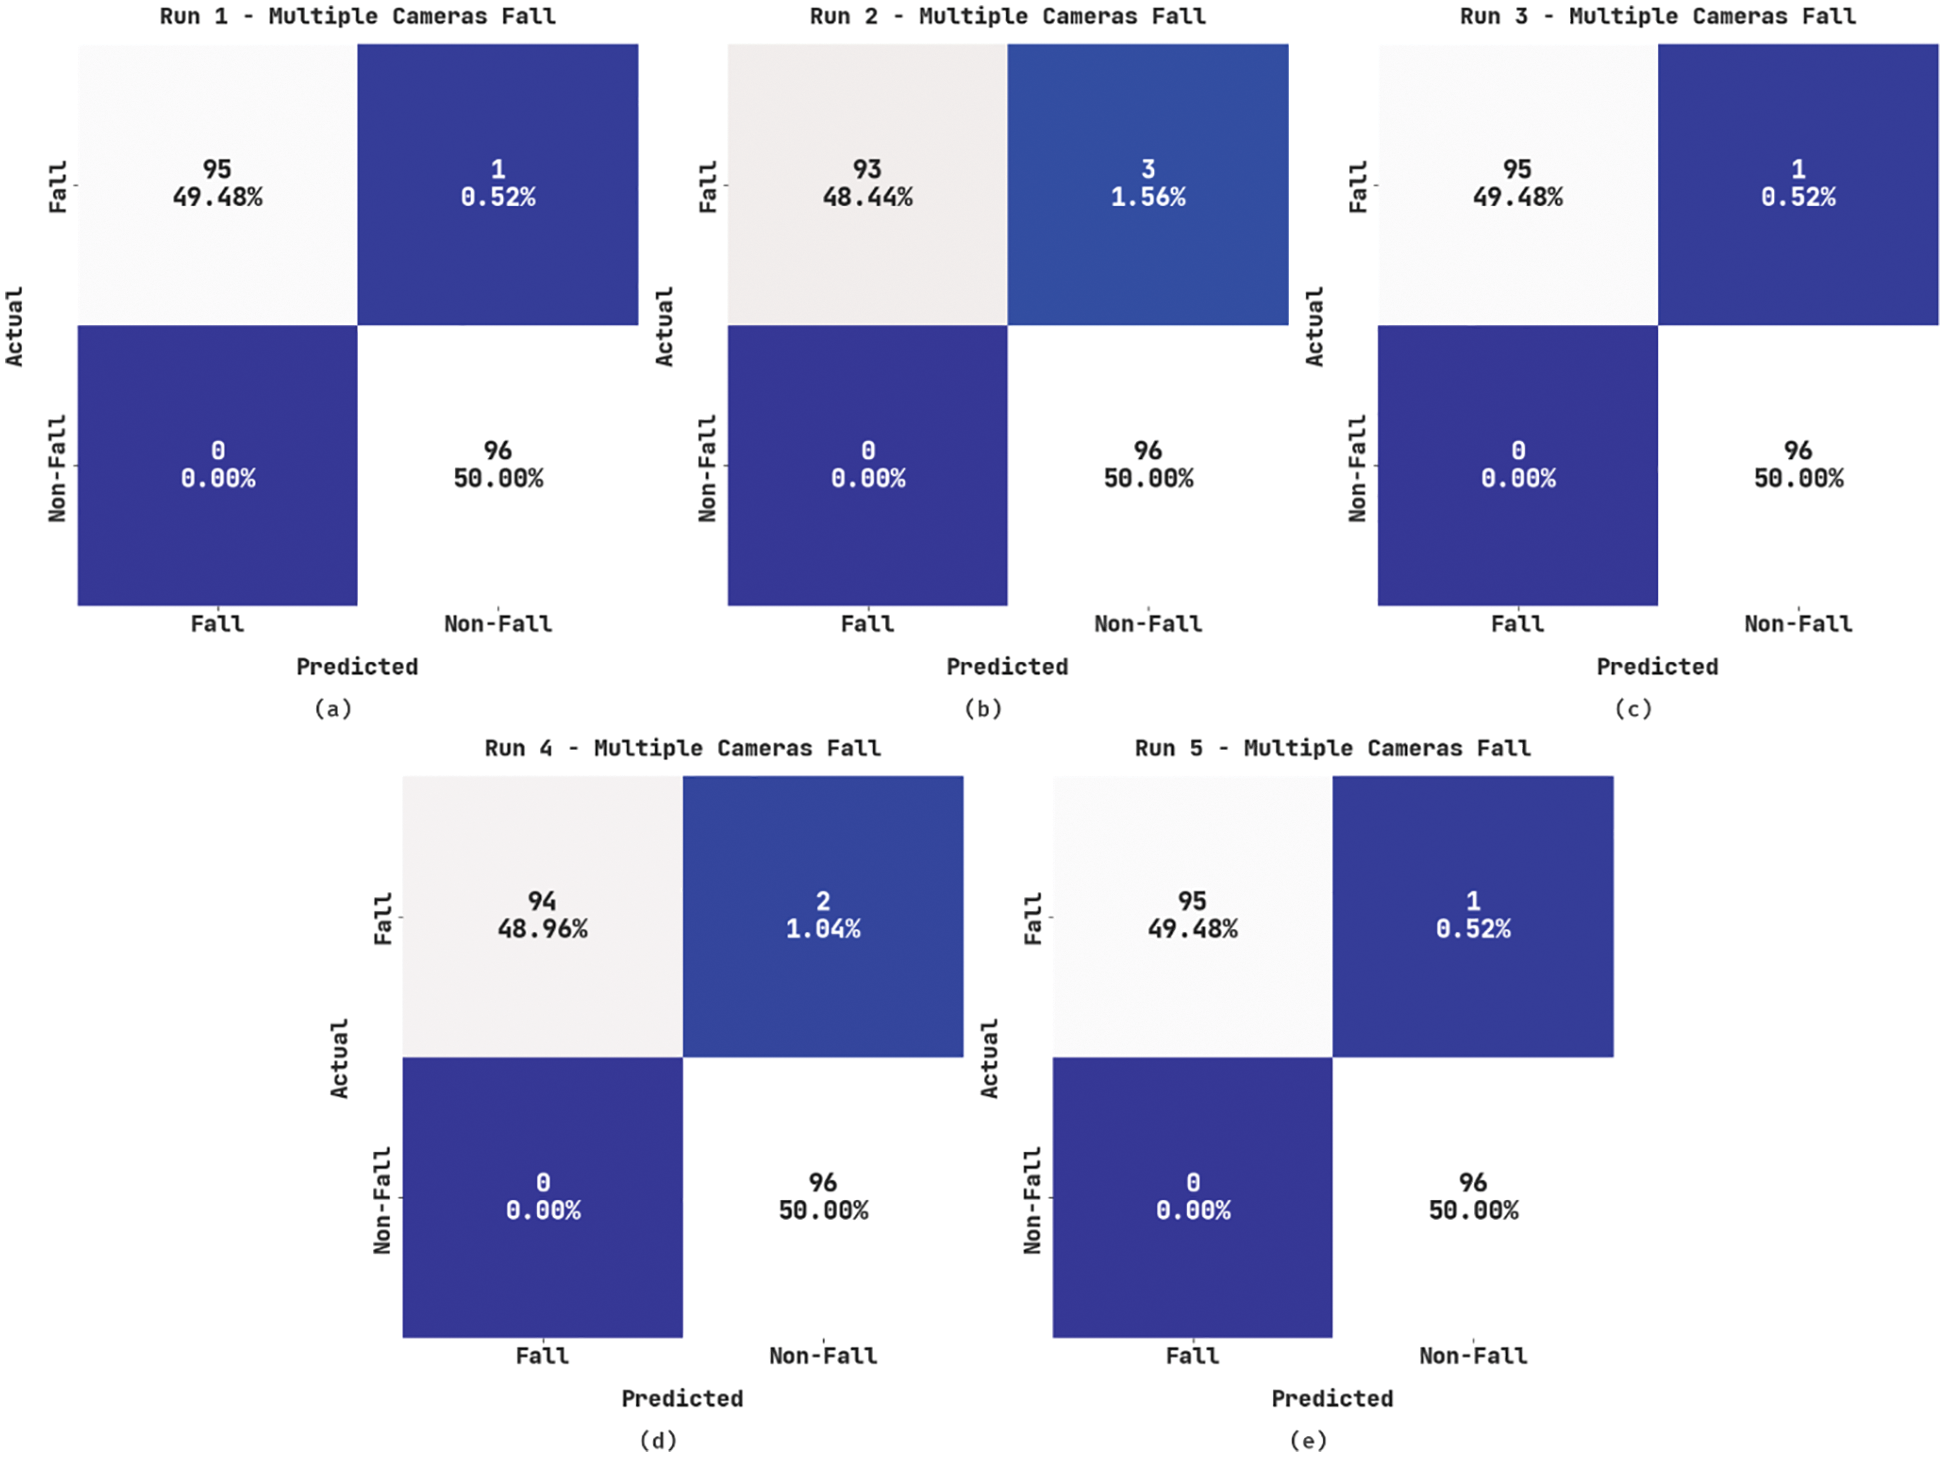
Figure 3: Confusion matrices of the WOADTL-AFD approach under MCF dataset (a) Run1, (b) Run2, (c) Run3, (d) Run4, and (e) Run5
Table 2 portrays the comparative analysis outcomes achieved by the WOADTL-AFD model on the MCF dataset. Fig. 4 shows the performance of the proposed WOADTL-AFD model on the MFC dataset in terms of
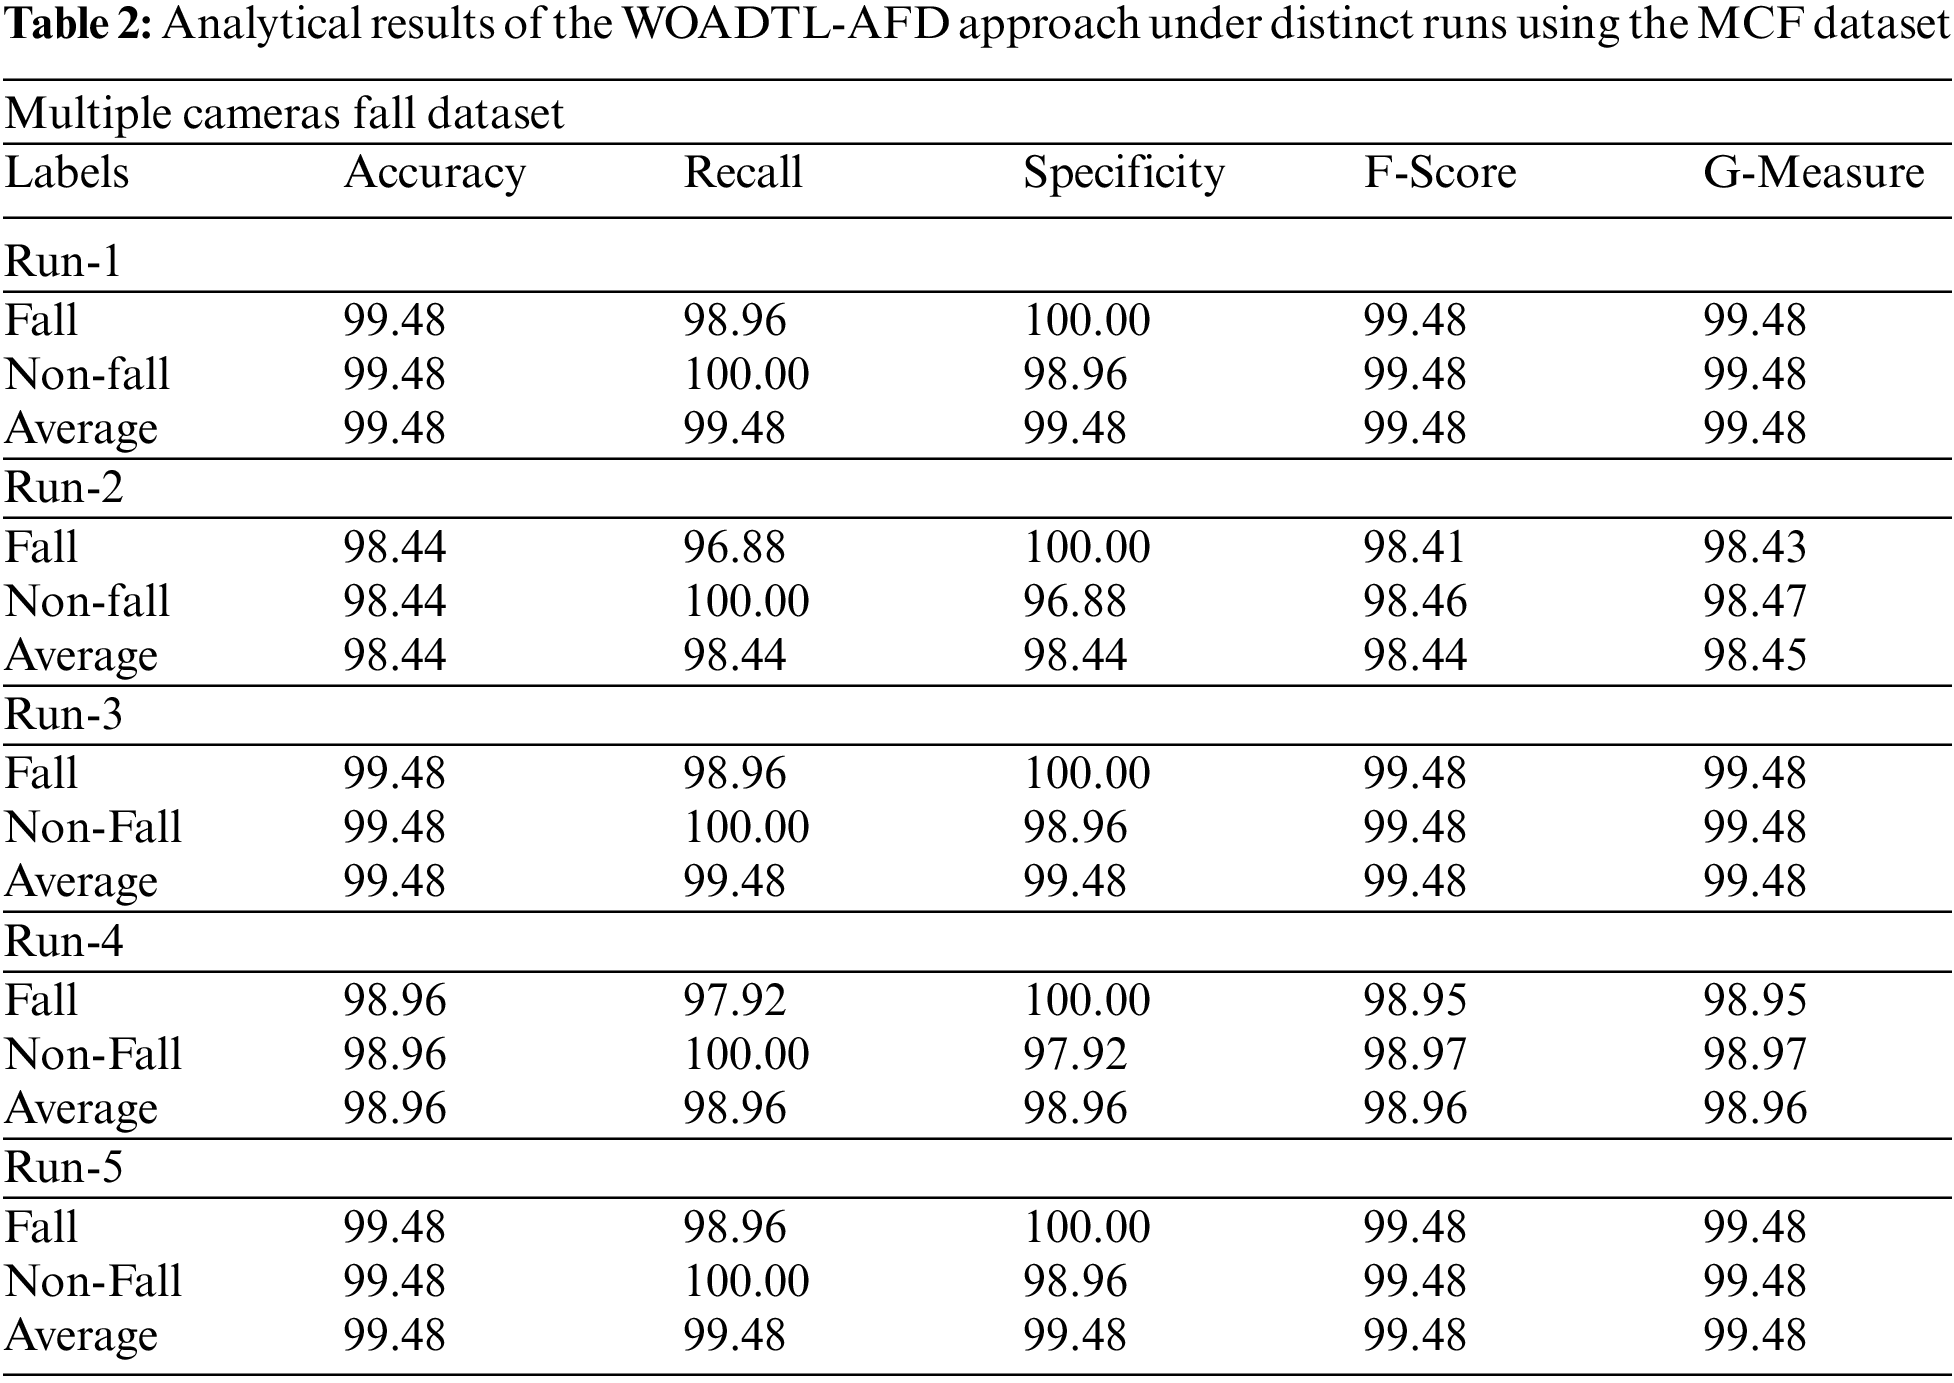
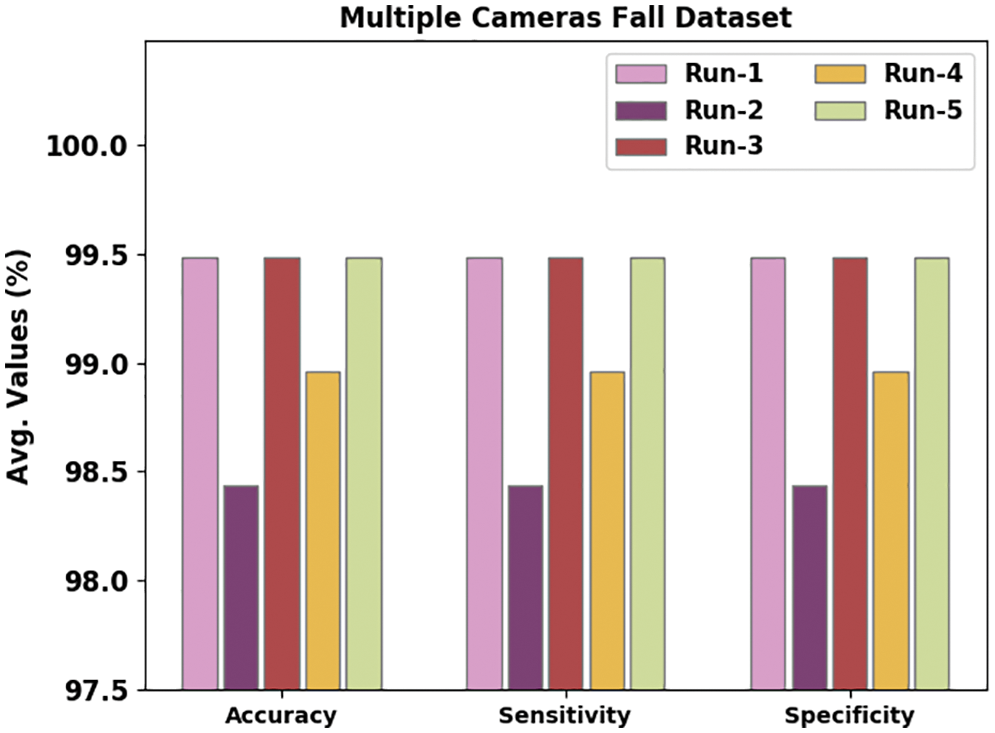
Figure 4: Average analysis results of the WOADTL-AFD approach on MCF dataset
Fig. 5 portrays the performance of the proposed WOADTL-AFD model on the MFC dataset in terms of
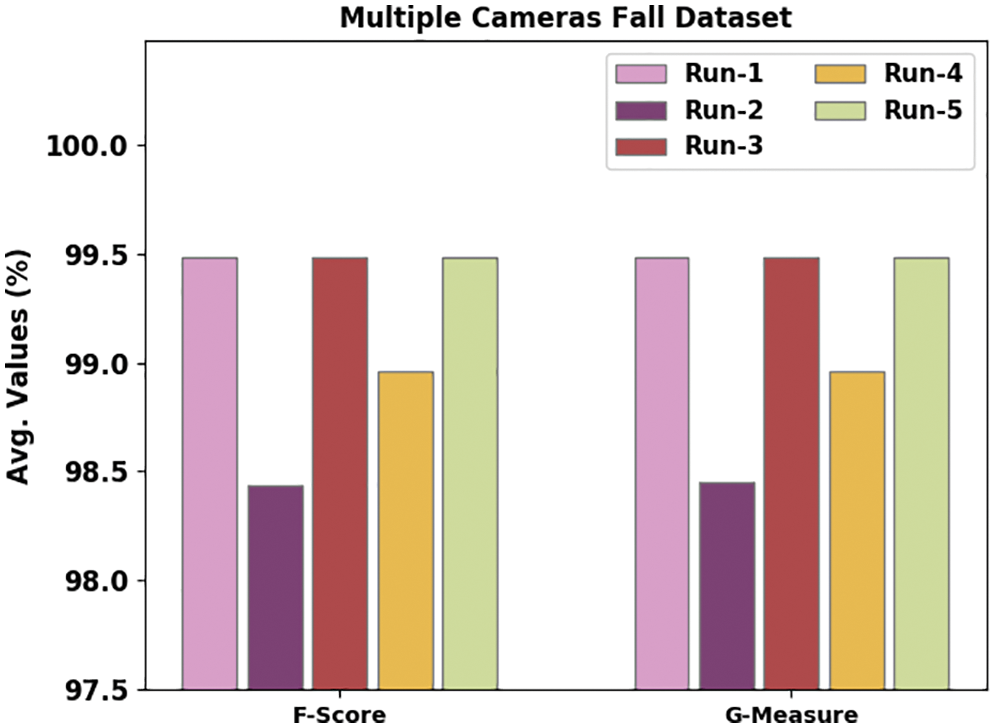
Figure 5:
Both Training Accuracy (TRA) and Validation Accuracy (VLA) values, achieved by the proposed WOADTL-AFD methodology on the MCF dataset, are depicted in Fig. 6. The experimental outcomes infer that the proposed WOADTL-AFD method accomplished the maximal TRA and VLA values. In contrast, the VLA values were higher than the TRA values.
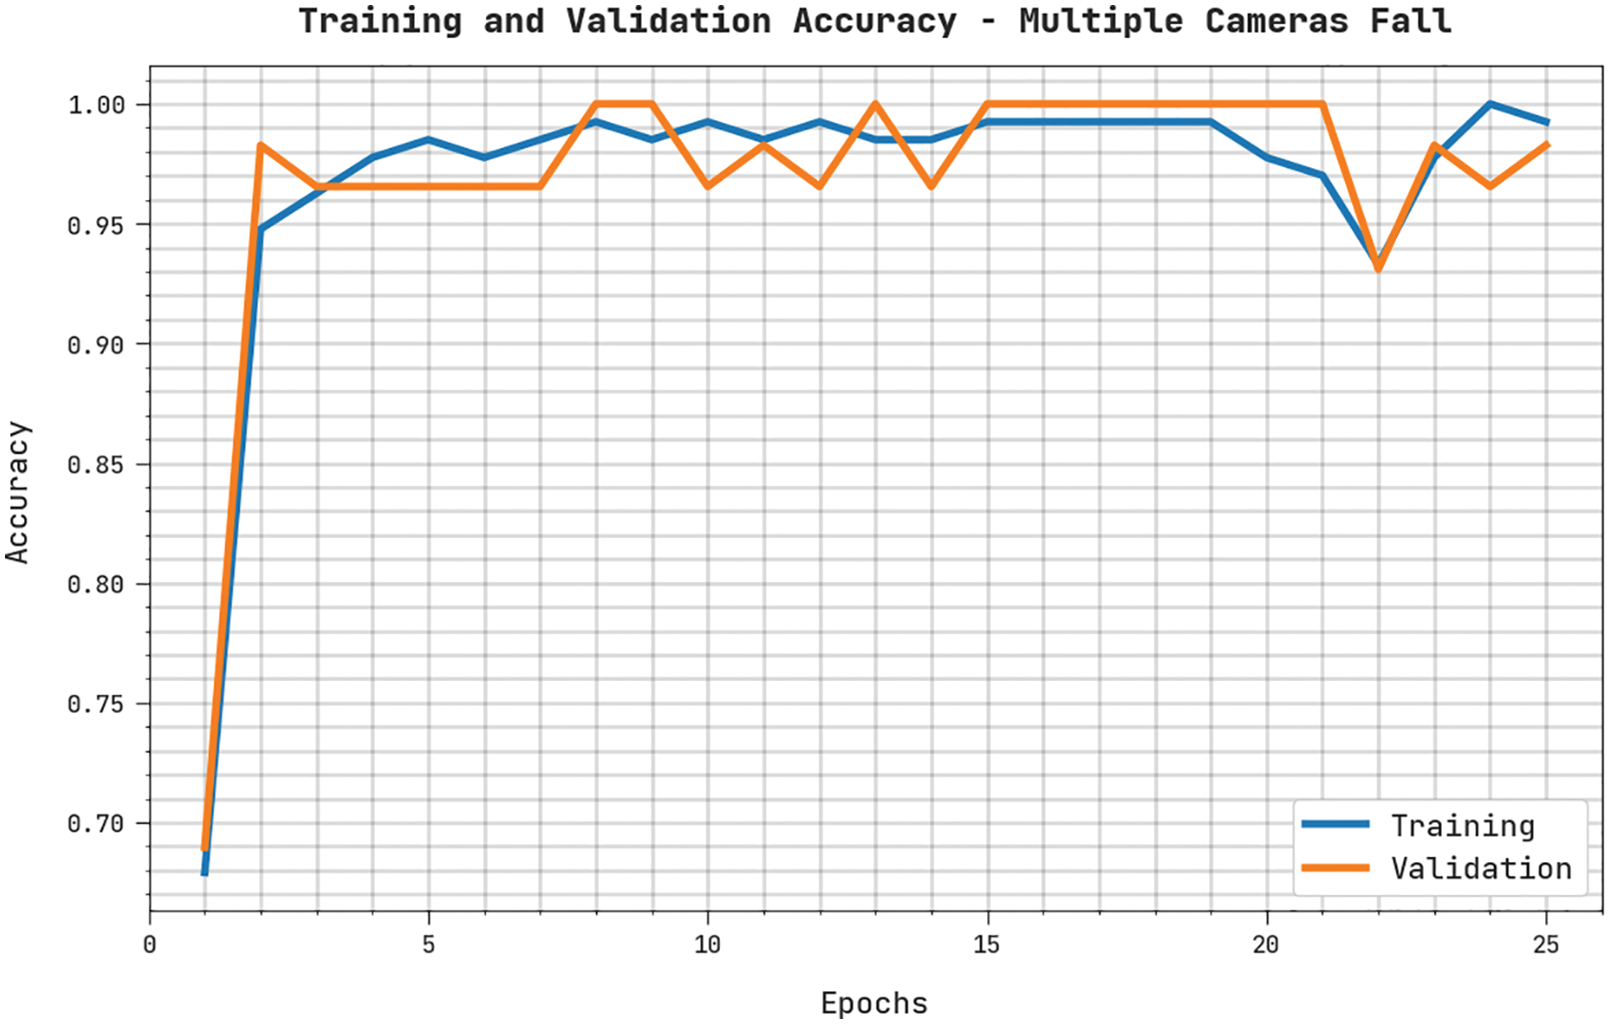
Figure 6: TRA and VLA analyses results of the WOADTL-AFD approach on MCF dataset
Both Training Loss (TRL) and Validation Loss (VLL) values, accomplished by the proposed WOADTL-AFD approach on the MCF dataset, are shown in Fig. 7. The experimental results illustrate that the WOADTL-AFD method obtained the minimal TRL and VLL values whereas the VLL values were lower than the TRL values.
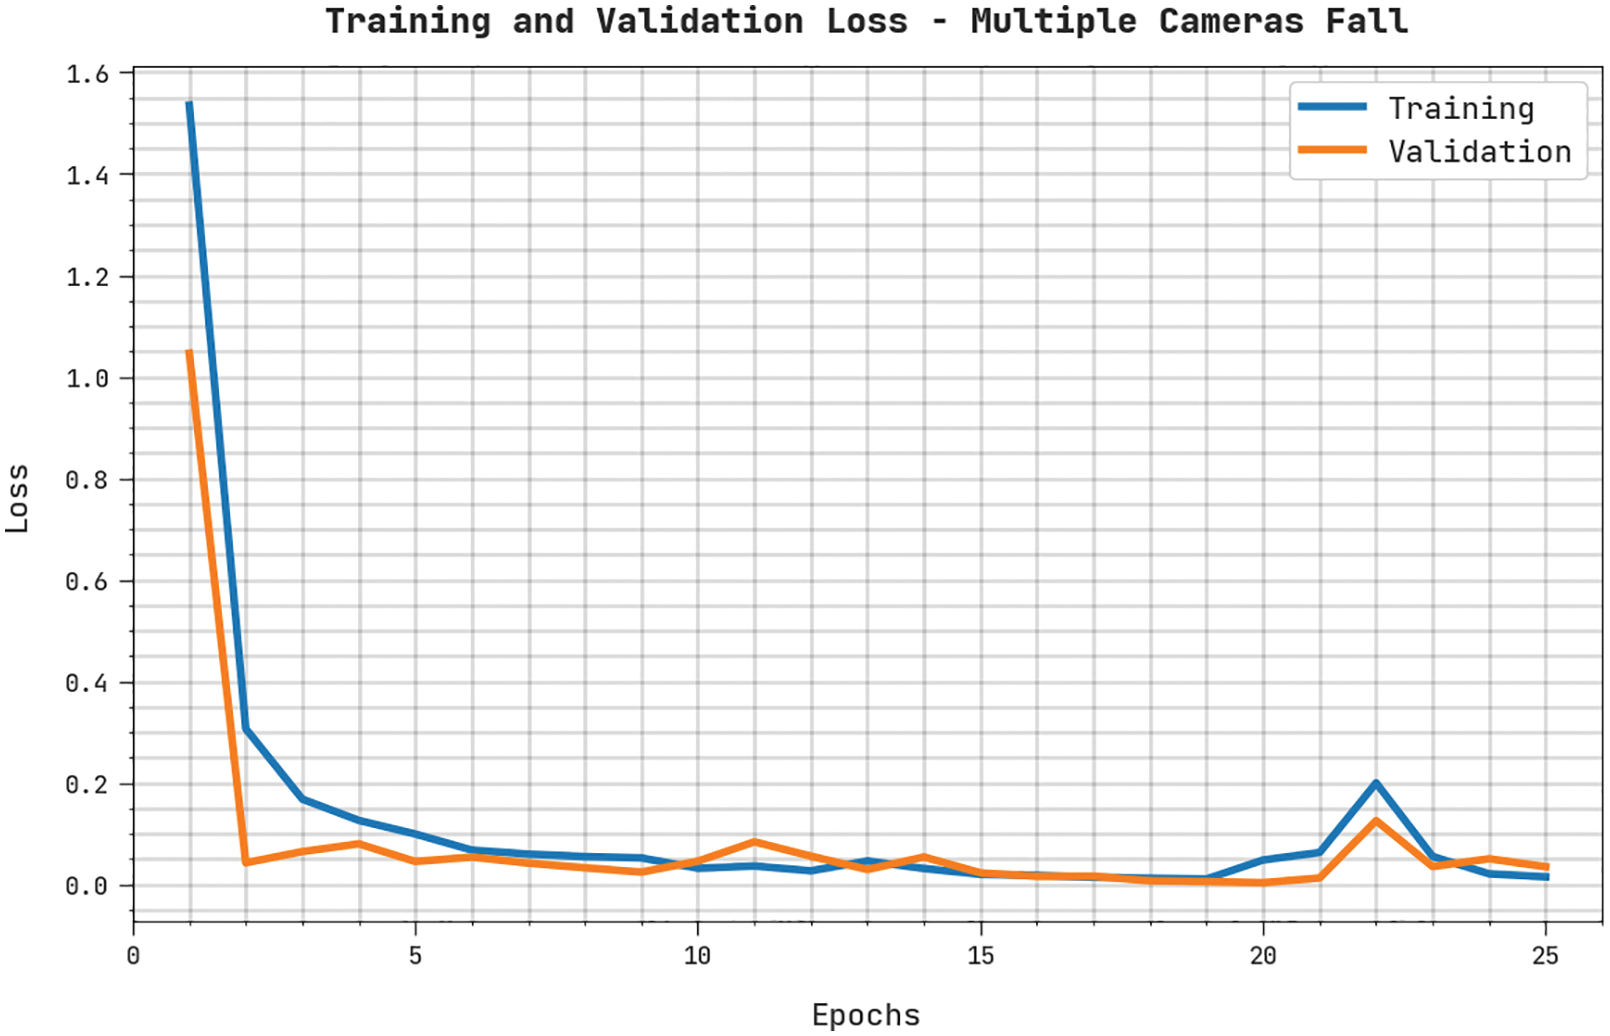
Figure 7: TRL and VLL analyses results of the WOADTL-AFD approach on the MCF dataset
Fig. 8 shows the confusion matrices generated by the proposed WOADTL-AFD technique under dissimilar runs using the URFD dataset. The figure shows that the proposed WOADTL-AFD method proficiently recognized all the class labels. For example, on run-1, the WOADTL-AFD system identified 73 samples as Fall event and 239 samples as Non-Fall event. Along with that, on run-2, the proposed WOADTL-AFD model classified 74 samples as Fall event and 237 samples as Non-Fall event. In line with run-3, the proposed WOADTL-AFD model categorized 72 samples under Fall event and 238 samples under Non-Fall event.
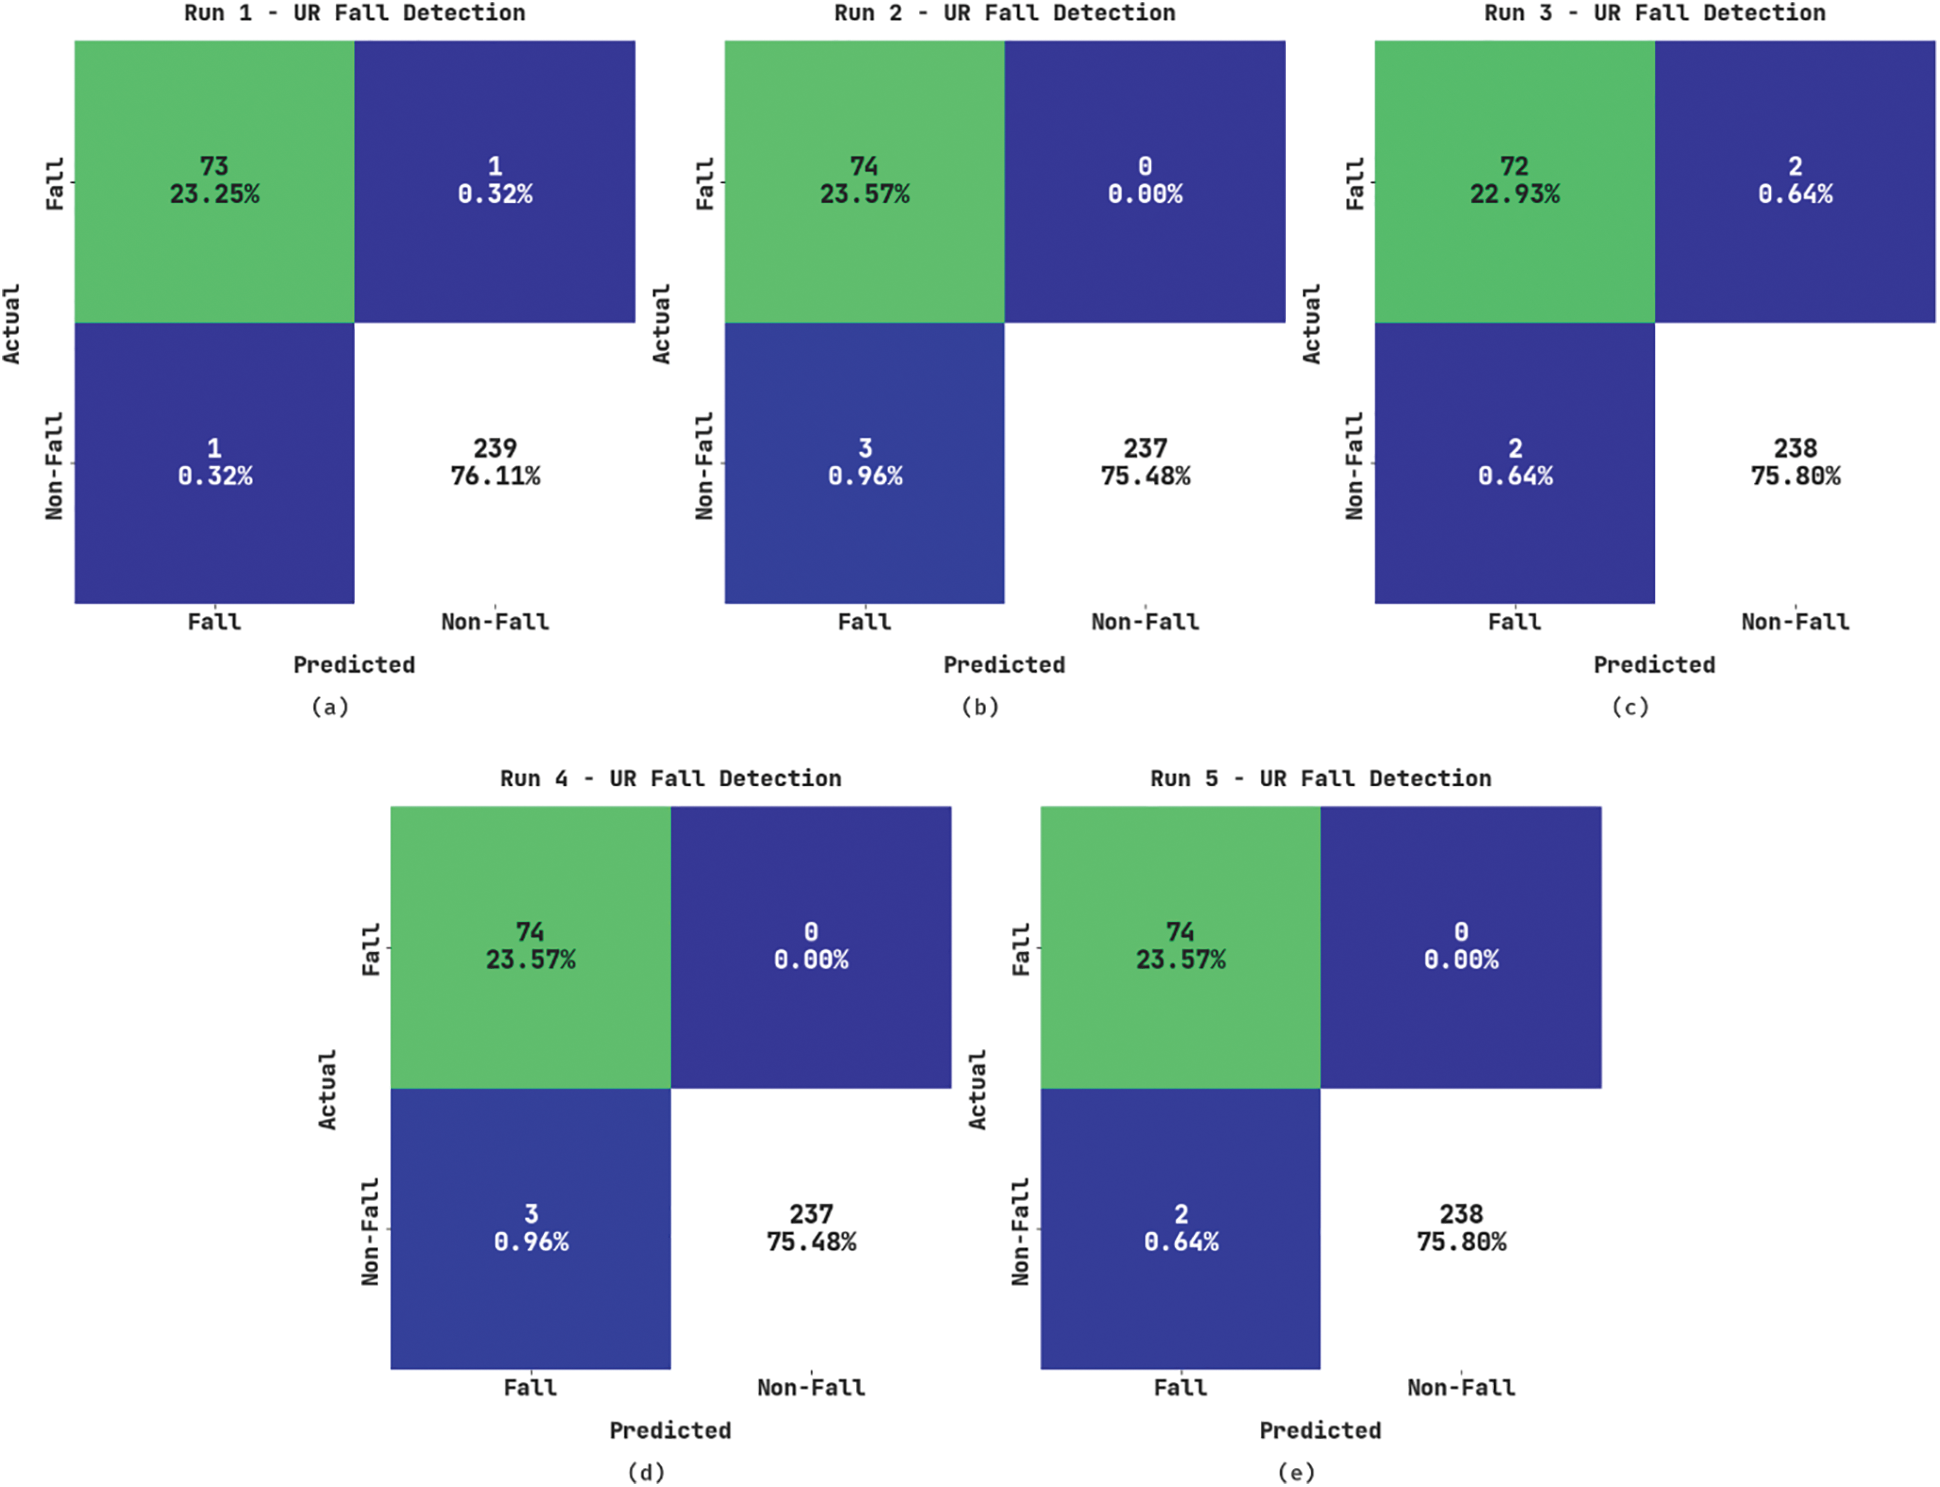
Figure 8: Confusion matrices of the WOADTL-AFD approach using the MCF dataset (a) Run1, (b) Run2, (c) Run3, (d) Run4, and (e) Run5
Table 3 portrays the comparative analysis outcomes of the proposed WOADTL-AFD model on the URCF dataset. Fig. 9 shows the performance of the WOADTL-AFD model on the URFD dataset in terms of
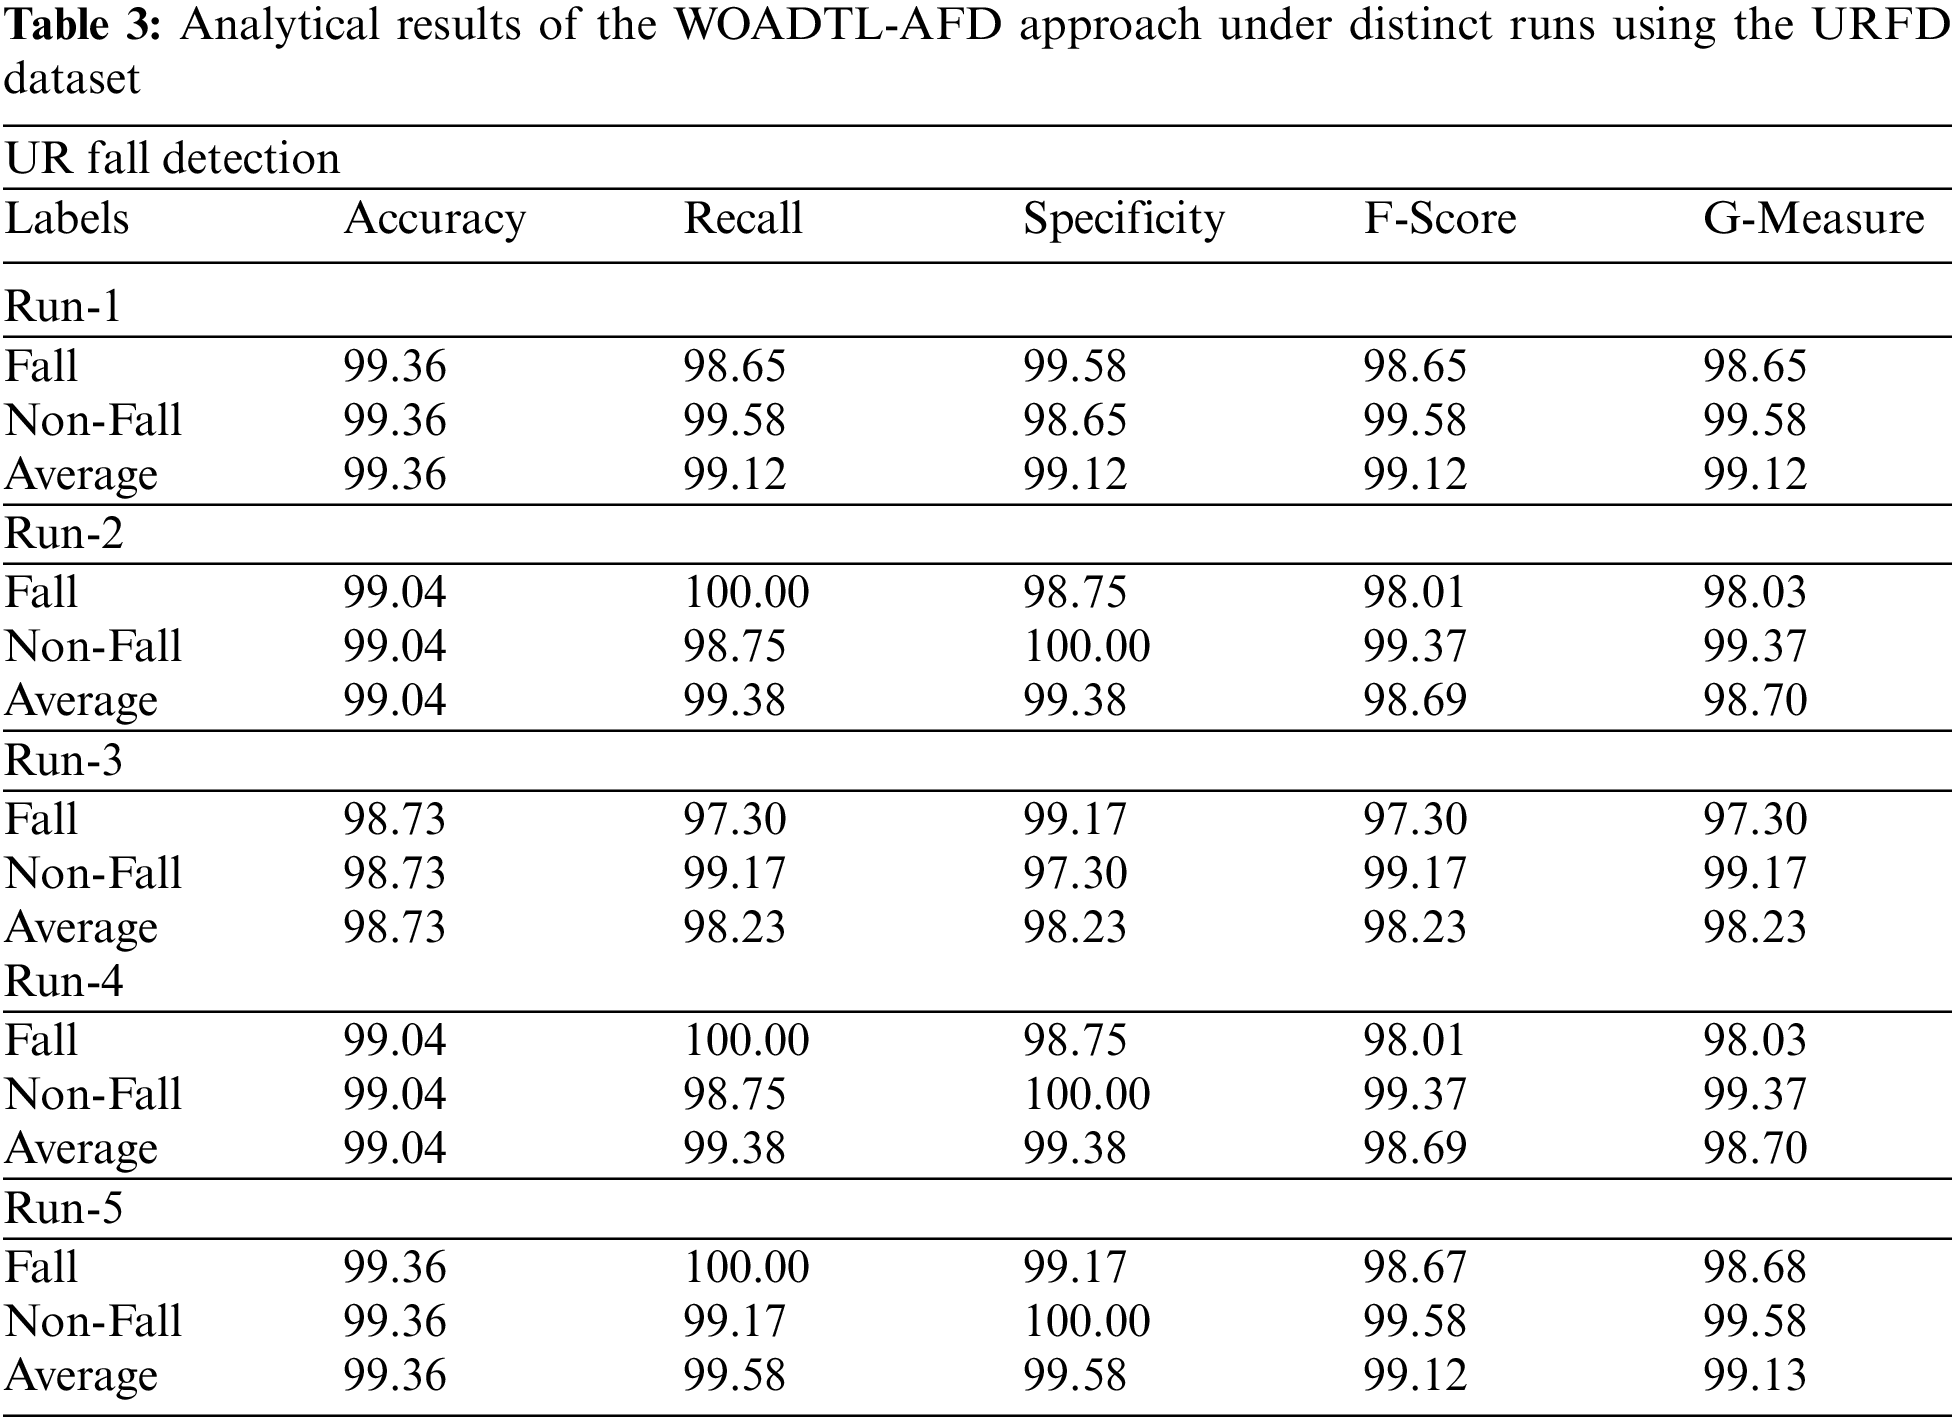
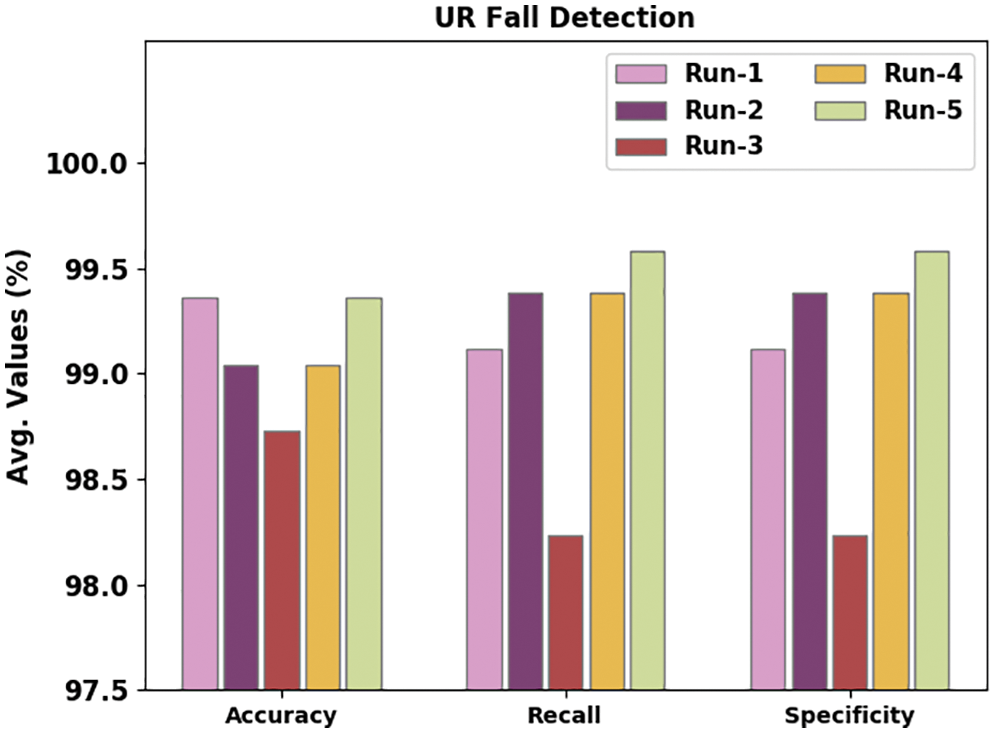
Figure 9: Average analysis results of the WOADTL-AFD approach on the URCF dataset
Fig. 10 illustrates the performance of the proposed WOADTL-AFD model on the URFD dataset in terms of
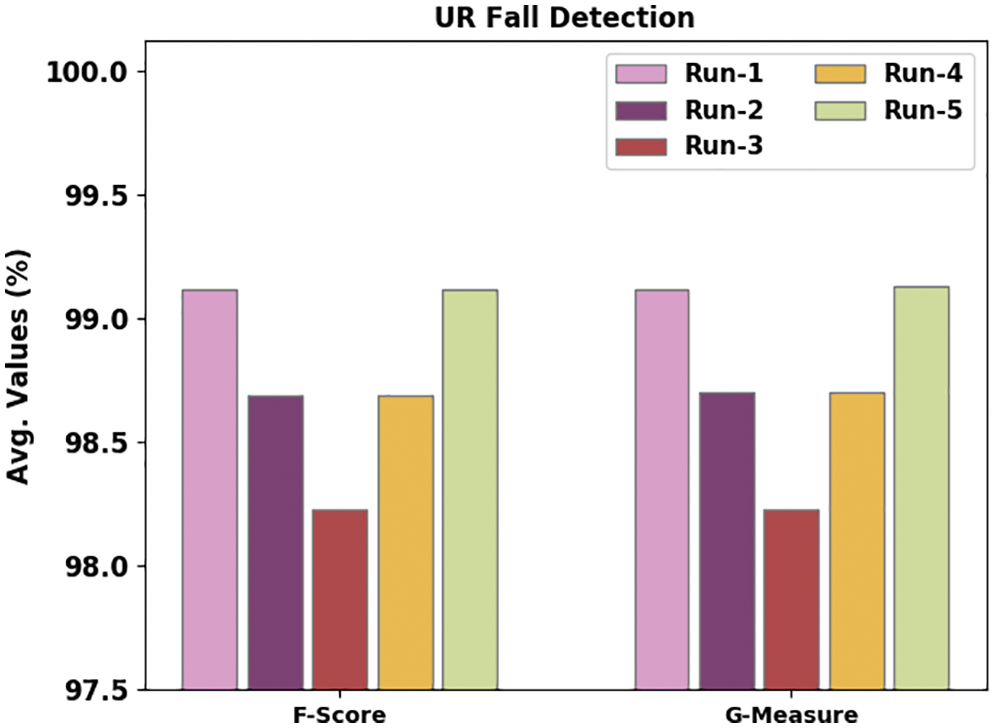
Figure 10:
Both TRA and VLA values, attained by the proposed WOADTL-AFD methodology on the URCF dataset, are illustrated in Fig. 11. The experimental results infer that the WOADTL-AFD method accomplished the maximal TRA and VLA values whereas the VLA values were higher than the TRA values.
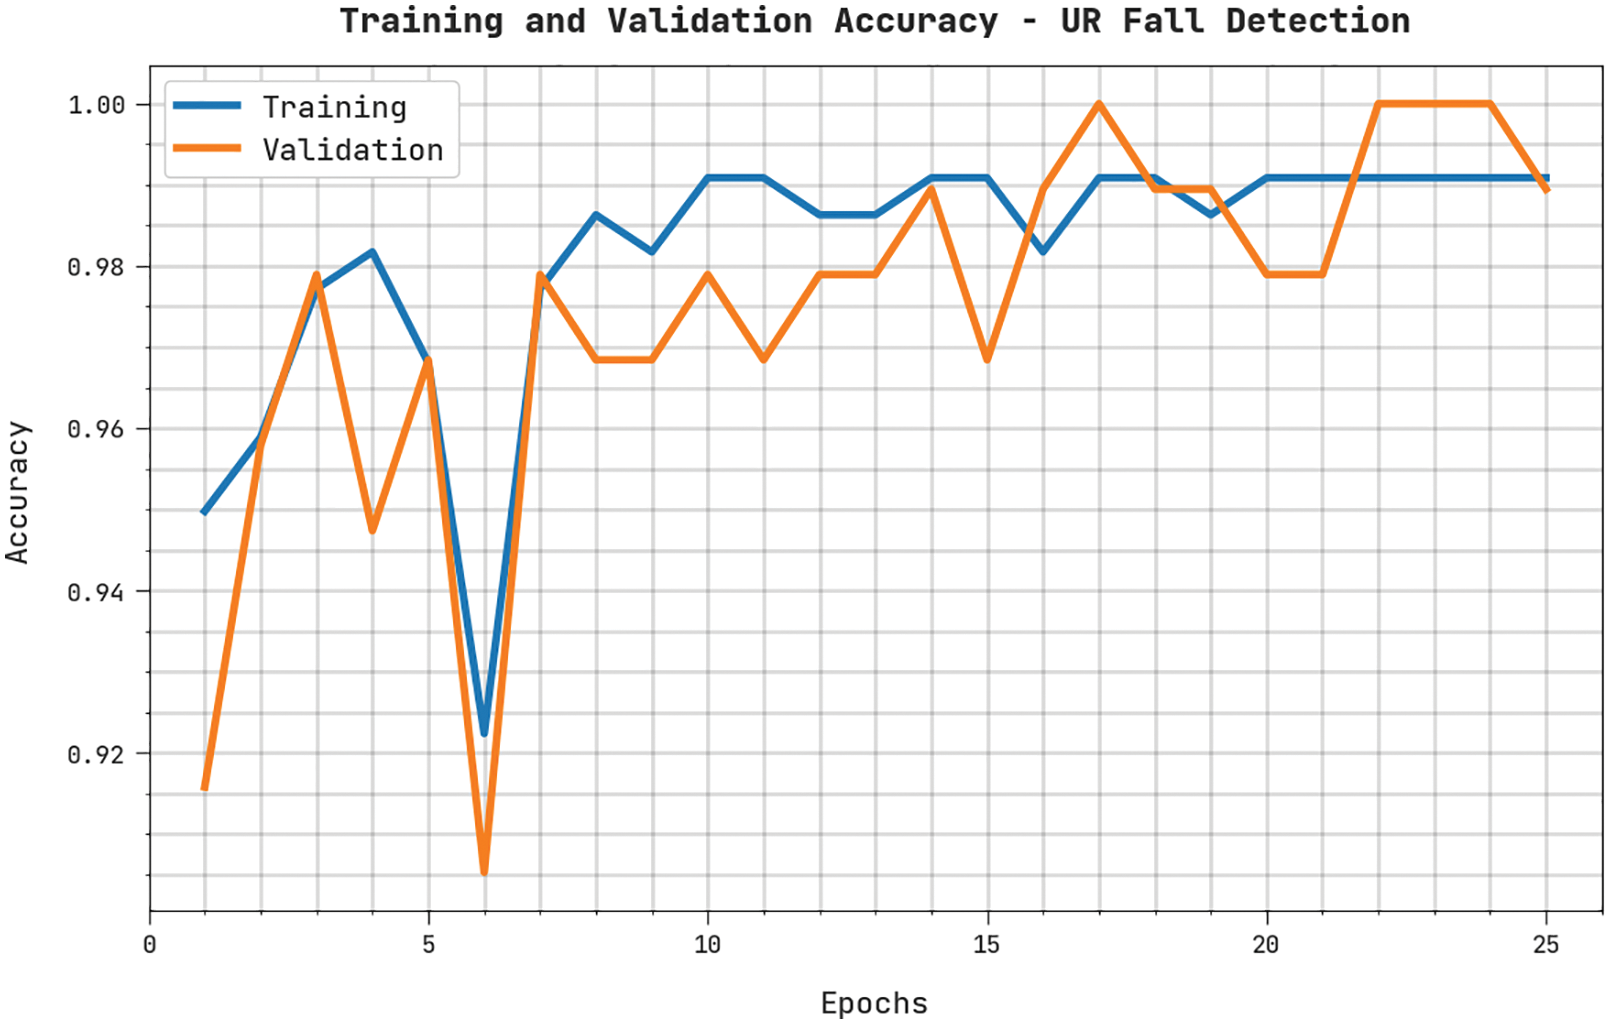
Figure 11: TRA and VLA analyses results of the WOADTL-AFD approach on the URCF dataset
Both TRL and VLL values, accomplished by the proposed WOADTL-AFD methodology on the URCF dataset, are portrayed in Fig. 12. The experimental outcomes imply that the proposed WOADTL-AFD method obtained the minimal TRL and VLL values whereas the VLL values lower than TRL values.
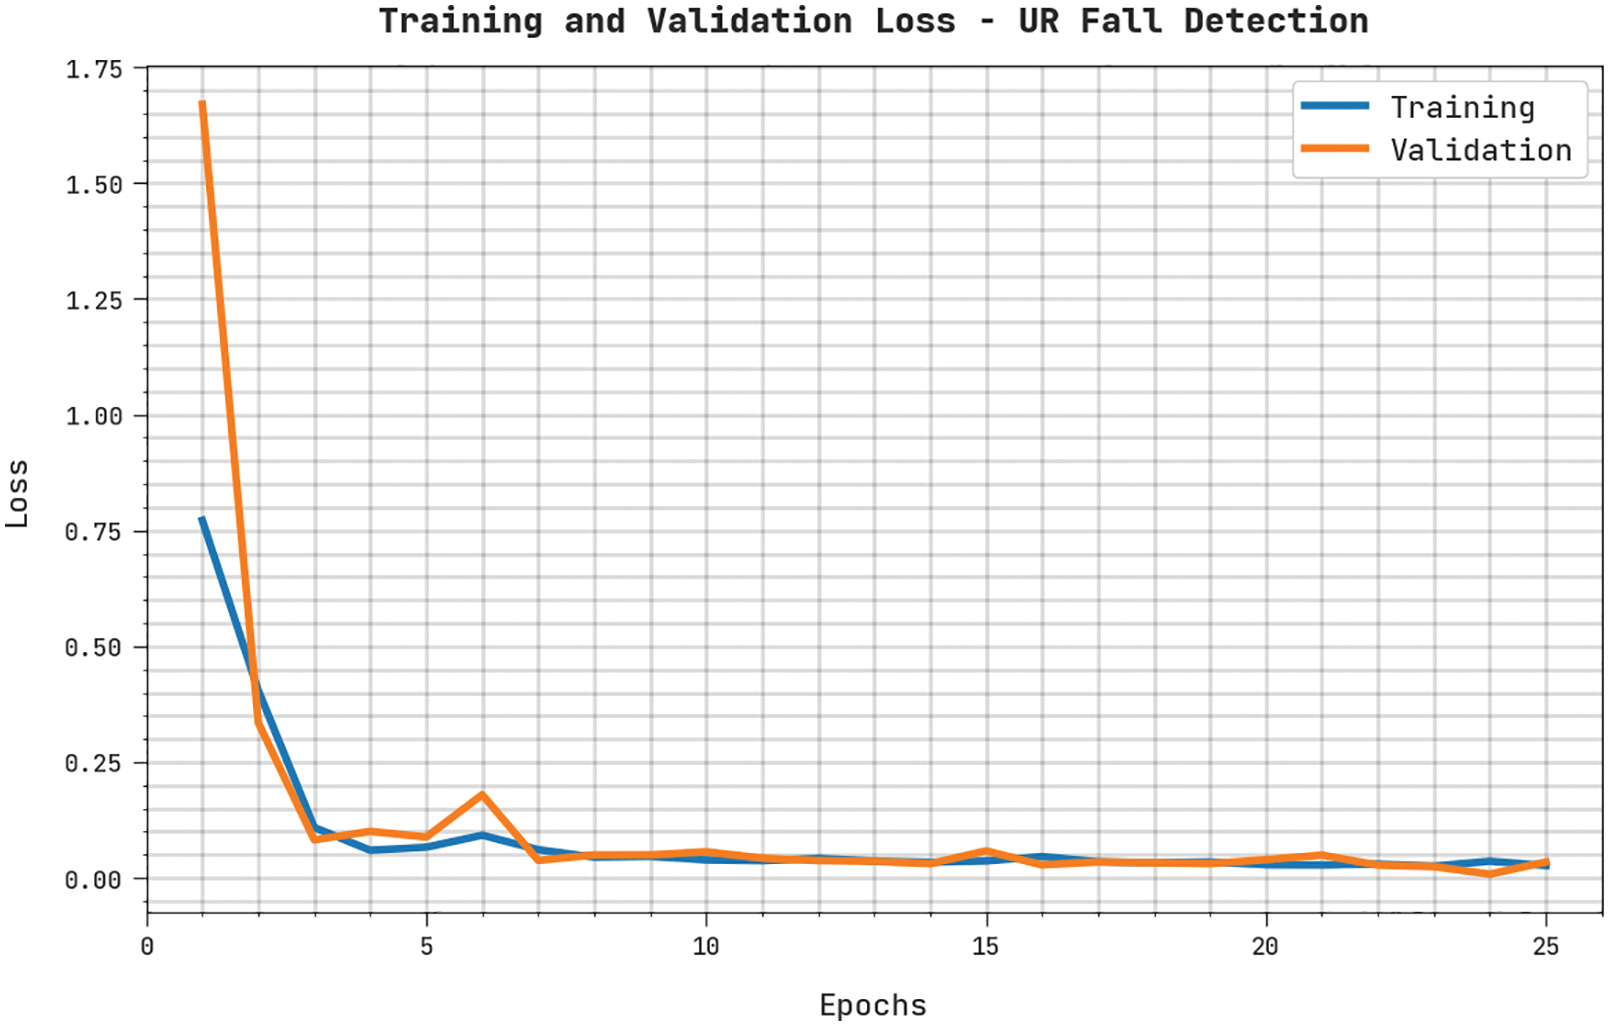
Figure 12: TRL and VLL analyses results of the WOADTL-AFD approach on the URCF dataset
Table 4 and Fig. 13 show the brief
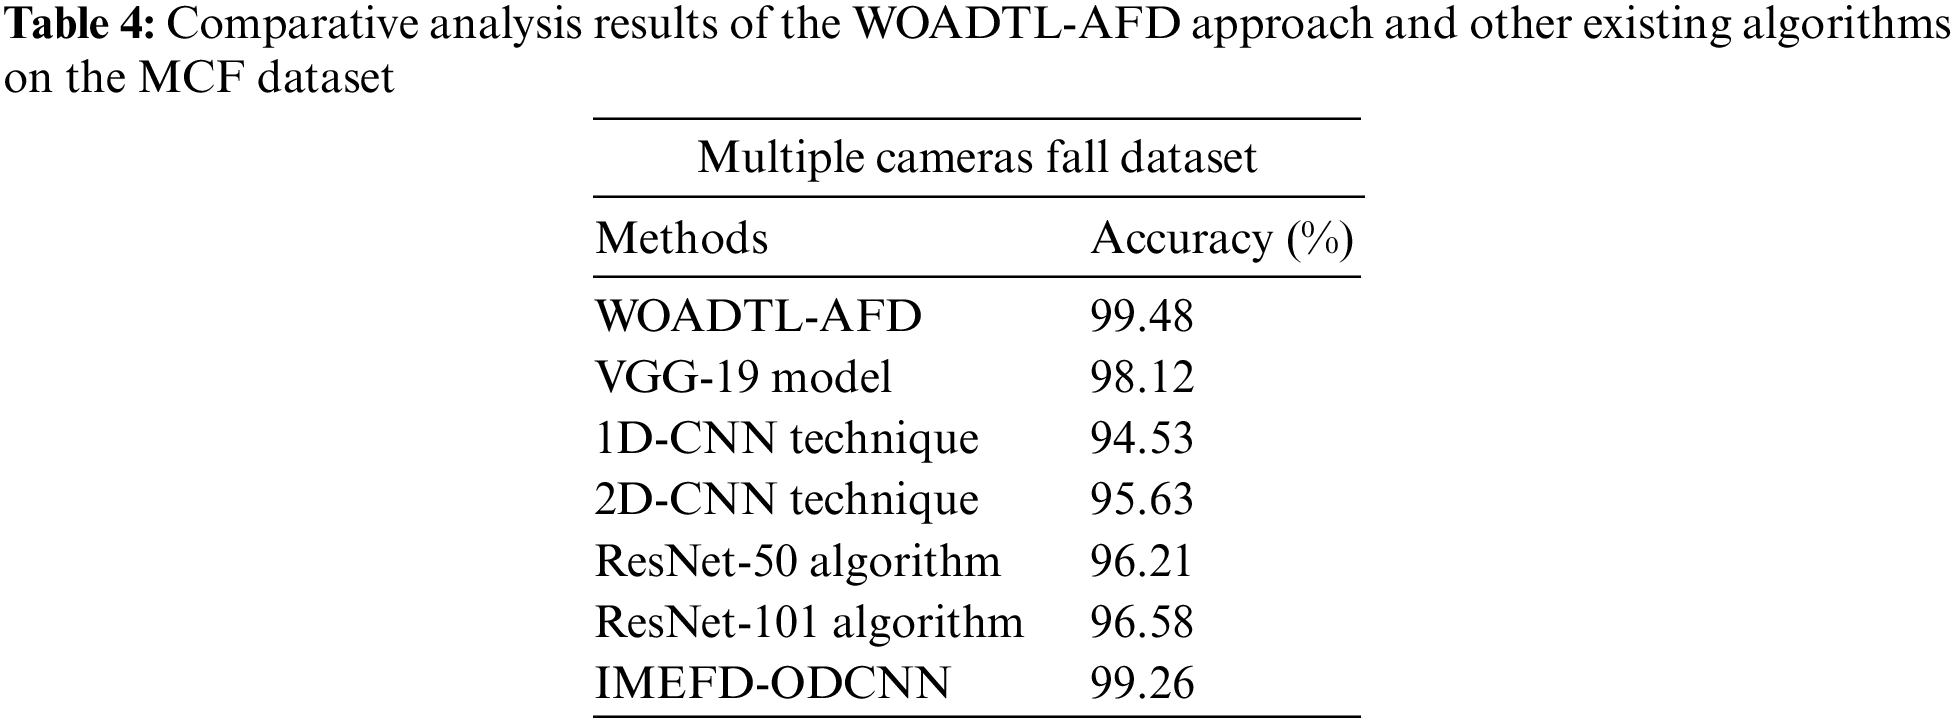
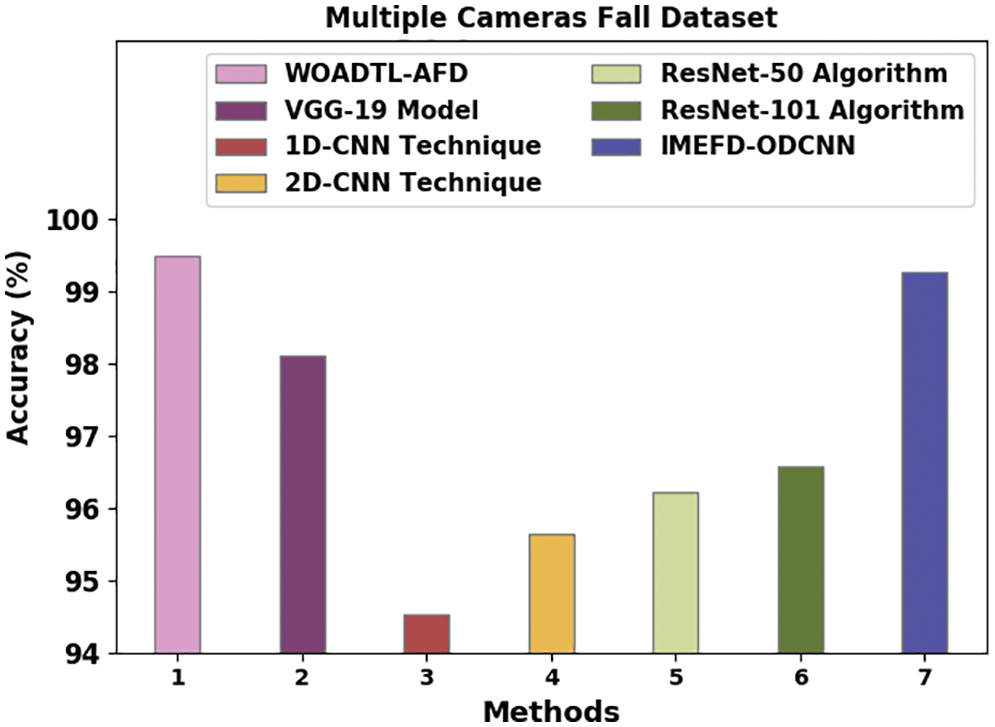
Figure 13: Comparative analysis results of the WOADTL-AFD approach on the MCF dataset
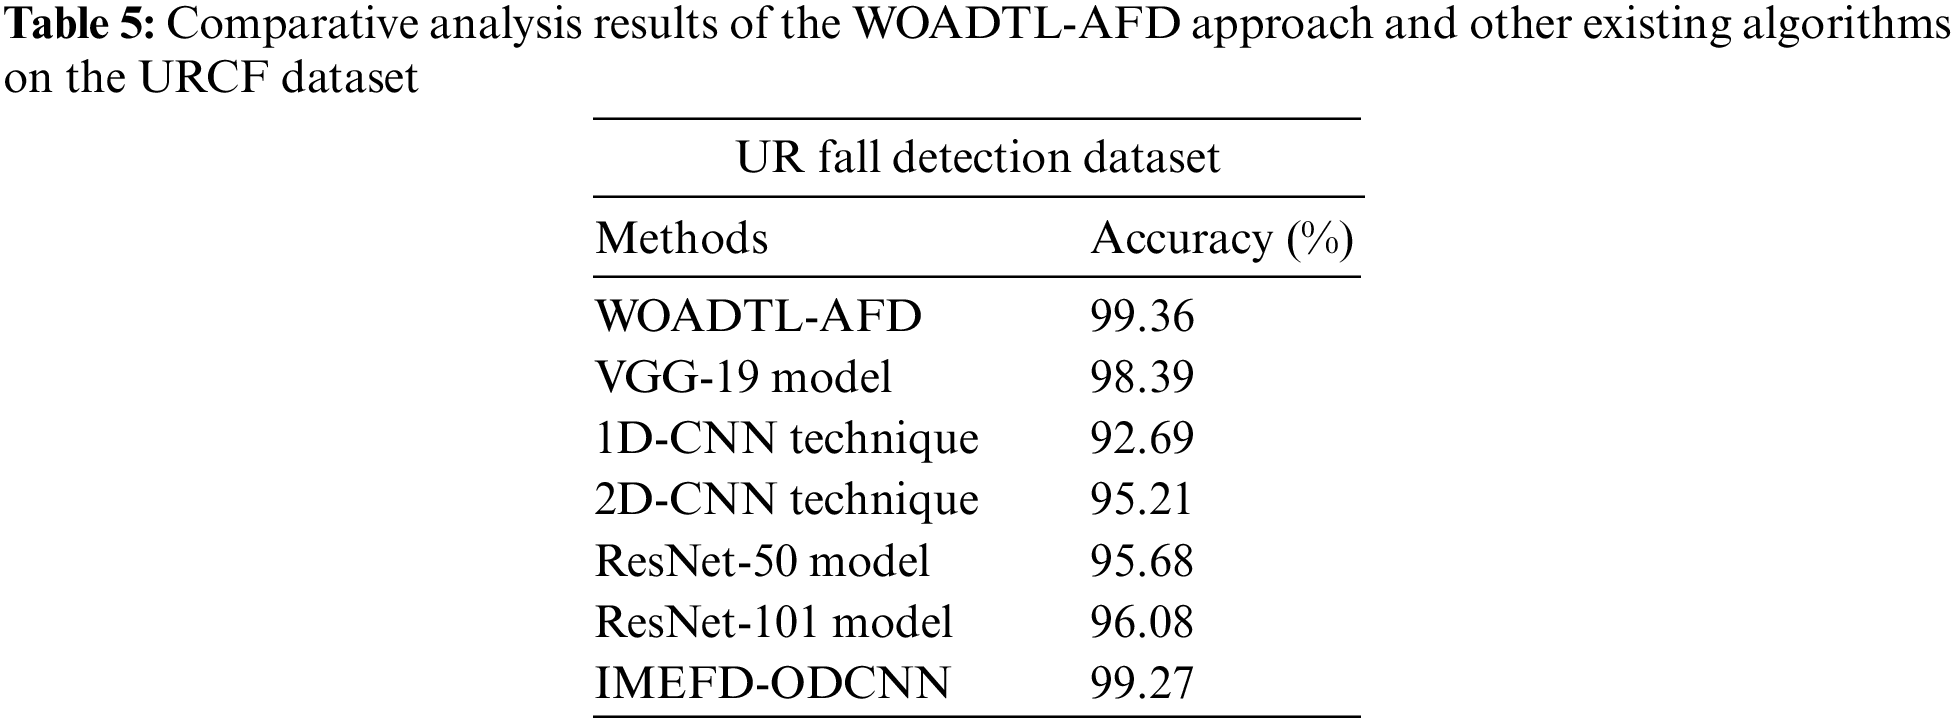
Table 5 offers a brief overview of the
In the current study, a novel WOADTL-AFD model has been developed to detect the fall events automatically so as to help the disabled people. The presented WOADTL-AFD technique majorly concentrates on identification and the classification of the fall events to assist the disabled people. At the initial level, the proposed WOADTL-AFD model uses a modified SqueezeNet feature extractor, which proficiently derives the feature vectors. In addition, the WOADTL-AFD technique classifies the fall events using an XGBoost classifier. In the presented WOADTL-AFD technique, the hyperparameters of the modified SqueezeNet model are adjusted with the help of WOA. The proposed WOADTL-AFD technique was experimentally validated using two benchmark datasets and the results inferred the superior performance of the proposed WOADTL-AFD technique compared to other existing technologies.
Funding Statement: The authors extend their appreciation to the King Salman Center for Disability Research for funding this work through Research Group no KSRG-2022-030.
Conflicts of Interest: The authors declare that they have no conflicts of interest to report regarding the present study.
References
1. Y. Zhang, X. Zheng, W. Liang, S. Zhang and X. Yuan, “Visual surveillance for human fall detection in healthcare IoT,” IEEE MultiMedia, vol. 29, no. 1, pp. 36–46, 2022. [Google Scholar]
2. R. Shrivastava and M. Pandey, “Adaptive window based fall detection using anomaly identification in fog computing scenario,” Multiagent and Grid Systems, vol. 17, no. 1, pp. 15–37, 2021. [Google Scholar]
3. S. Usmani, A. Saboor, M. Haris, M. A. Khan and H. Park, “Latest research trends in fall detection and prevention using machine learning: A systematic review,” Sensors, vol. 21, no. 15, pp. 5134, 2021. [Google Scholar]
4. E. Casilari, J. A. S. Ramón and J. M. C. García, “Analysis of public datasets for wearable fall detection systems,” Sensors, vol. 17, no. 7, pp. 1513, 2017. [Google Scholar]
5. G. J. Horng and K. H. Chen, “The smart fall detection mechanism for healthcare under free-living conditions,” Wireless Personal Communications, vol. 118, no. 1, pp. 715–753, 2021. [Google Scholar]
6. Z. A. Kakarash, S. H. T. Karim and M. Mohammadi, “Fall detection using neural network based on internet of things streaming data,” UHD Journal of Science and Technology, vol. 4, no. 2, pp. 91–98, 2020. [Google Scholar]
7. X. Kong, Z. Meng, L. Meng and H. Tomiyama, “A privacy protected fall detection IoT system for elderly persons using depth camera,” in Int. Conf. on Advanced Mechatronic Systems (ICAMechS), Zhengzhou, pp. 31–35, 2018. [Google Scholar]
8. X. Xi, M. Tang, S. M. Miran and Z. Luo, “Evaluation of feature extraction and recognition for activity monitoring and fall detection based on wearable semg sensors,” Sensors, vol. 17, no. 6, pp. 1229, 2017. [Google Scholar]
9. M. Guvensan, A. Kansiz, N. Camgoz, H. Turkmen, A. Yavuz et al., “An energy-efficient multi-tier architecture for fall detection on smartphones,” Sensors, vol. 17, no. 7, pp. 1487, 2017. [Google Scholar]
10. R. Alazrai, M. Momani and M. Daoud, “Fall detection for elderly from partially observed depth-map video sequences based on view-invariant human activity representation,” Applied Sciences, vol. 7, no. 4, pp. 316, 2017. [Google Scholar]
11. P. M. Lo and A. A. Aziz, “A fpga threshold-based fall detection algorithm for elderly fall monitoring with verilog,” Bulletin of Electrical Engineering and Informatics, vol. 10, no. 5, pp. 2477–2487, 2021. [Google Scholar]
12. T. N. Gia, V. K. Sarker, I. Tcarenko, A. M. Rahmani, T. Westerlund et al., “Energy efficient wearable sensor node for IoT-based fall detection systems,” Microprocessors and Microsystems, vol. 56, pp. 34–46, 2018. [Google Scholar]
13. W. J. Chang, L. B. Chen, M. C. Chen, J. P. Su, C. Y. Sie et al., “Design and implementation of an intelligent assistive system for visually impaired people for aerial obstacle avoidance and fall detection,” IEEE Sensors Journal, vol. 20, no. 17, pp. 10199–10210, 2020. [Google Scholar]
14. T. Xu, H. Se and J. Liu, “A fusion fall detection algorithm combining threshold-based method and convolutional neural network,” Microprocessors and Microsystems, vol. 82, pp. 103828, 2021. [Google Scholar]
15. J. Maitre, K. Bouchard and S. Gaboury, “Fall detection with uwb radars and CNN-lstm architecture,” IEEE Journal of Biomedical and Health Informatics, vol. 25, no. 4, pp. 1273–1283, 2021. [Google Scholar]
16. H. Lee, I. Ullah, W. Wan, Y. Gao and Z. Fang, “Real-time vehicle make and model recognition with the residual squeezenet architecture,” Sensors, vol. 19, no. 5, pp. 982, 2019. [Google Scholar]
17. N. Rana, M. Latiff, S. Abdulhamid and H. Chiroma, “Whale optimization algorithm: A systematic review of contemporary applications, modifications and developments,” Neural Computing and Applications, vol. 32, no. 20, pp. 16245–16277, 2020. [Google Scholar]
18. A. Ogunleye and Q. G. Wang, “XGBoost model for chronic kidney disease diagnosis,” IEEE/ACM Transactions on Computational Biology and Bioinformatics, vol. 17, no. 6, pp. 2131–2140, 2020. [Google Scholar]
Cite This Article
 Copyright © 2023 The Author(s). Published by Tech Science Press.
This work is licensed under a Creative Commons Attribution 4.0 International License , which permits unrestricted use, distribution, and reproduction in any medium, provided the original work is properly cited.
 Downloads
 Citation Tools