
 Submit a Paper
 Propose a Special lssue
 Open Access
ARTICLE

Machine Vision Based Fish Cutting Point Prediction for Target Weight
Department of Computer Engineering, Yeungnam University, Gyeongsan, 38541, Korea
* Corresponding Author: Yeong-Seok Seo. Email:
Computers, Materials & Continua 2023, 75(1), 2247-2263. https://doi.org/10.32604/cmc.2023.027882
Received 28 January 2022; Accepted 26 April 2022; Issue published 06 February 2023
 View Full Text
 Download PDF
Abstract
Food processing companies pursue the distribution of ingredients that were packaged according to a certain weight. Particularly, foods like fish are highly demanded and supplied. However, despite the high quantity of fish to be supplied, most seafood processing companies have yet to install automation equipment. Such absence of automation equipment for seafood processing incurs a considerable cost regarding labor force, economy, and time. Moreover, workers responsible for fish processing are exposed to risks because fish processing tasks require the use of dangerous tools, such as power saws or knives. To solve these problems observed in the fish processing field, this study proposed a fish cutting point prediction method based on AI machine vision and target weight. The proposed method performs three-dimensional (3D) modeling of a fish’s form based on image processing techniques and partitioned random sample consensus (RANSAC) and extracts 3D feature information. Then, it generates a neural network model for predicting fish cutting points according to the target weight by performing machine learning of the extracted 3D feature information and measured weight information. This study allows for the direct cutting of fish based on cutting points predicted by the proposed method. Subsequently, we compared the measured weight of the cut pieces with the target weight. The comparison result verified that the proposed method showed a mean error rate of approximately 3%.Keywords
The fishing industry has significantly contributed to providing human beings with marine products for many years. Recently, it has seen major development through the installation of automation equipment [1–6]. The rapid growth of the fishing industry has sharply increased the amount of catch, thereby requiring an increasing number of workers in this industry. Under these circumstances, various studies have been conducted to improve the working environment in the fishing industry [7–11]. These studies mainly focused on using machine vision systems to increase productivity and profitability in the fields of fish classification and fish farming. The research technique of extracting characteristics of objects based on machine vision has been widely applied to not only fish but also livestock, such as chickens and pigs. In this regard, this technique is highly promising in the food industry [12–13]. Moreover, artificial intelligence (AI) technology based on deep learning has been rapidly advanced and widely applied along with machine vision in the fishing industry [14–15]. Particularly, AI combined with machine vision brings powerful synergy effects [16–22]. Since AI machine vision exhibits exceptional performance, it is expected that this technology will be effectively applied in various industries including the fishing industry. AI and machine vision techniques have been mainly utilized in the fish farming industry. Researchers have applied these techniques to measure the length and weight of live fish and increase the efficiency of fish farming management [8,23,24]. In addition, several studies attempted to classify fish caught based on these techniques. Balaban et al. pointed out that people had manually classified a large number of salmons caught from Alaska in the United States. Accordingly, they used machine vision to solve this problem [25]. Hauser utilized neural network technology to train a model for classifying three types of fish [14].
Despite the advancement of fish processing technology, people still perform manual fish trimming which is a traditional method. Although various types of automation equipment are installed, certain processes require the intervention of human operators. For this reason, the complete efficiency of these facilities and soft wares cannot be obtained [26–28].
Fishing trimming processes are extremely dangerous in that workers responsible for fish processing mainly use power saws or knives. These processes also require a large number of trained workers. As the amount of catch has rapidly increased through the rapid growth of the fishing industry, manual fish trimming performed by responsible workers will incur an increased cost [29].
Group meal providers handle a large volume of food including fish, which has high supply and demand. As these companies provide meals, they expect to receive fish products that are neatly trimmed and cut based on fixed weight. However, fish cannot be evenly cut into pieces due to their curved shape and inconsistent width from the head to tail [30–31]. Fig. 1 shows automation equipment designed for automatically cutting fish into pieces. However, this equipment cuts fish based on a fixed frame without considering fish of different size and patterns.

Figure 1: Equipment for automatically cutting fish into pieces
Azarmdel et al. [32] predicted cutting points at the head and stomach of fish by using an image processing algorithm and information on the length and fins of fish. However, as their study was related to the process of cutting fish according to parts, its research results cannot be applied to the process of evenly cutting fish according to a target weight. A number of researchers have attempted to predict the weight of fish; however, they performed fish weight prediction mainly to classify types of fish or identify fish growth conditions. Unfortunately, few studies have been conducted to facilitate automation for cutting fish according to weight.
Thus, this study proposes a fish cutting point prediction method based on the target weight to efficiently improve the working environment in fish processing sites in the fishing industry. The proposed method uses image processing and partitioned random sample consensus (RANSAC) to perform three-dimensional (3D) modeling and extract 3D feature information. Subsequently, it performs machine learning to train a correlation between weight and 3D feature information extracted and generates a model for predicting cutting points according to the target weight. Furthermore, this study evaluated the performance of the trained prediction model to verify the performance of the proposed method.
The structure of this paper is as follows. Section 1 presents the introduction, and Section 2 reviews relevant studies. Section 3 describes the proposed method in detail, and Section 4 indicates experimental procedures for performance evaluation and evaluation results. Section 5 discusses threats to validity. Finally, Section 6 presents conclusions.
Hauser-Davis et al. [14] applied statistics and neural network techniques to classify geophagus brasiliensis (acaras), tilapia rendall (tilapias), and mugil liza (mullets), which are frequently caught in Brazil. They analyzed 250 samples to obtain information on the total length, standard length, head length and head height, and sex of the fish. Subsequently, they trained neural networks to learn the aforementioned information and verified the classification performance of the proposed method.
Balaban et al. [25] carried out a study on predicting the weight of salmon according to four types of salmon caught from Alaska. As for the salmon weight prediction process, they calculated the best fitting rectangle for fitting the salmon shown in an image. In addition, they calculated the area of the salmon based on the size of this fish and that of the best fitting rectangle. Subsequently, they generated various regression equations for training a correlation between data of the area and those of weight. Based on the results of their study, they argued that the weight of salmon can be predicted based on only the data of area of the salmon and a simple quadratic function.
Man et al. [33] proposed a method of using a digital camera to easily obtain length data, which can be effectively used for fish type classification. This method used refraction data collected by the lens of the digital camera and the distance between the lens and the fish to predict the length of the actual fish. The predicted length of the fish was compared with its practically measured length, and the comparison result indicated that the proposed method exhibited an error within only 6%.
Al-Jubouri et al. [24] stressed that machine vision technology should be applied in the fish farming industry. Accordingly, they presented a method that can measure the length of fish freely moving in water by using a low-cost machine vision system. The proposed method analyzes images taken by two cameras located at different positions and predicts the distance between the cameras and fish based on these images. The predicted distance is used to predict both the length of fish shown in images and that of actual fish. The proposed method showed an error of only approx. 1% for the predicted length of fish based on stereo images. Therefore, the analytic result verified the performance of the proposed method.
Miranda et al. [23] insisted that automatic length measurement technology should be applied for fish type classification in the fish farming industry. To this end, they developed a prototype for measuring the length of rainbow trout. Given that rainbow trout have an instinctive behavior of swimming against the flow of water, they designed the prototype to enable the rainbow trout to pass through a narrow channel. When the target rainbow trout passed through the channel, cameras installed in the channel captured images of this fish. Subsequently, diverse image processing techniques were applied to predict the length of this fish. They reported that the mean absolute error (MAE) for the predicted length was 1.413 and that this result was significantly inspiring.
Konovalov et al. [34] reviewed multiple existing studies on accurately predicting morphological features of fish, such as length and width, and pointed out that the results of predicting the weight of fish derived in these existing studies were not accurate. To solve this problem, they generated a dataset for a fish weight prediction model based on convolutional neural networks (CNNs) by taking images of fish, removing their fins, obtaining binarized images of fish without fins, and measuring their actual weight. The trained weight prediction model showed a mean absolute percentage error (MAPE) of 4% to 11% over several experiments.
The aforementioned studies mainly introduced methods for predicting the weight of intact fish. On the contrary, the purpose of this study is to predict fish weight for delivery, which are cut into pieces according to the desired weight of group meal providers. Hyun et al. [35], who conducted a study based on the same research purpose of this study, predicted fish weight based on 3D information. In their study, they proposed a method that can calculate the weight of fish according to length by using 3D physical form data of fish, which were obtained by a laser scanner. It was verified that the proposed method predicted points at which fish can be cut evenly according to the target weight. In addition, Hyeon measured the weight of fish pieces cut practically and found that the proposed method generated a prediction error of 6% to 8% according to fish types. Based on this analytic result, they argued that the proposed method with this error range can be applied in the field. However, the proposed method by Hyeon et al. have the following limitations. First, a laser scanner, which was used to detect the 3D physical form of fish in their study, is not appropriate to be applied in the field due to the operation time. Moreover, the proposed method calculated fish weight based on uniform density data despite inconsistent density in the entire fish parts caused by bones, flesh, and intestines. Because of these limitations, the method proposed by Hyeon et al. cannot be applied in the field as of yet.
3 Fish Cutting Point Prediction Method According to Weight
This section describes the weight-based fish cutting point prediction method, which was proposed in this study. The proposed method includes four phases of preprocessing, 2D modeling of fish, 3D modeling of fish, and cutting point prediction according to weight based on machine learning. Fig. 2 shows the overview of the proposed method. A filter based on image processing is used to preprocess fish images so that 2D modeling of these images can be performed more effectively. In the 2D modeling phase, the outline of the fish is approximated to generate a quadric equation model for this outline. In the 3D modeling phase, the 3D form of the fish is modeled based on the 2D fish outline model. Accordingly, information on the volume, length, and thickness of the fish is extracted from the 3D modeling result. In the cutting point prediction phase, 3D information extracted from the previous phase is input into the cutting point prediction model based on the target weight and machine learning to enable the model to predict each cutting point according to the target weight. The cutting point prediction model trained the target weight regarding the volume, length, and thickness of the fish in advance.

Figure 2: An overview of the proposed method
The 3D form extraction requires image information from at least two perspectives. For this reason, two cameras installed in the preprocessor simultaneously take photos of the target fish from the floor plan view, which provides the top-down view and front view. Next, filtering based on image processing is applied to the images taken from the floor plan view and front view. The filtering process adopted the following image processing techniques: grayscaling for reducing the amount of calculation, high pass filtering for appropriately expressing an edge, and masking, gaussian blurring, and binarization for eliminating noise [36–38]. The aforementioned filtering process facilitates more efficient detection of the fish’s outline. Fig. 3 shows the preprocessing process for efficient 2D modeling.

Figure 3: Preprocessing process applying the image processing filter to images taken from the floor plan view
3.2.1 Modeling of the Fish Outline Based on RANSAC
The 3D form extractor comprises the outline modeling phase and 3D modeling phase. It performs modeling of the fish’s outline based on the preprocessed images taken from the floor plan view and front view. RANSAC was used for fish outline modeling due to the advantages of this technique, such as high processing velocity and robust performance against noise [39–43]. To perform 2D modeling of the fish’s outline, three dots were randomly selected from the preprocessed fish image. Then, a quadric equation model passing the three dots was derived. To verify whether the obtained model can serve as an appropriate outline model, the number of dots, whose distance from the model is the critical distance (t) or less, was calculated. The calculated value indicates how many dots are located near the obtained model. The higher the number of these dots, the more appropriate the quadric equation model is for an outline model. Finally, the process of randomly selecting three dots is repeated. In this process, the quadric equation model that obtained the highest score (number) is selected as the outline model. Each sub-figure in Fig. 4 shows scores of randomly selected quadric equation models. Among the three sub-figures, the model shown in Fig. 4c includes 39 dots within the critical distance (t), which is the highest number. Red dots indicate three dots randomly selected to generate a model, and green dots indicate dots supporting the model. Based on this result, it can be observed that the model shown in Fig. 4c is likely the most appropriate outline model among the models selected through the repeated random dot selection processes.
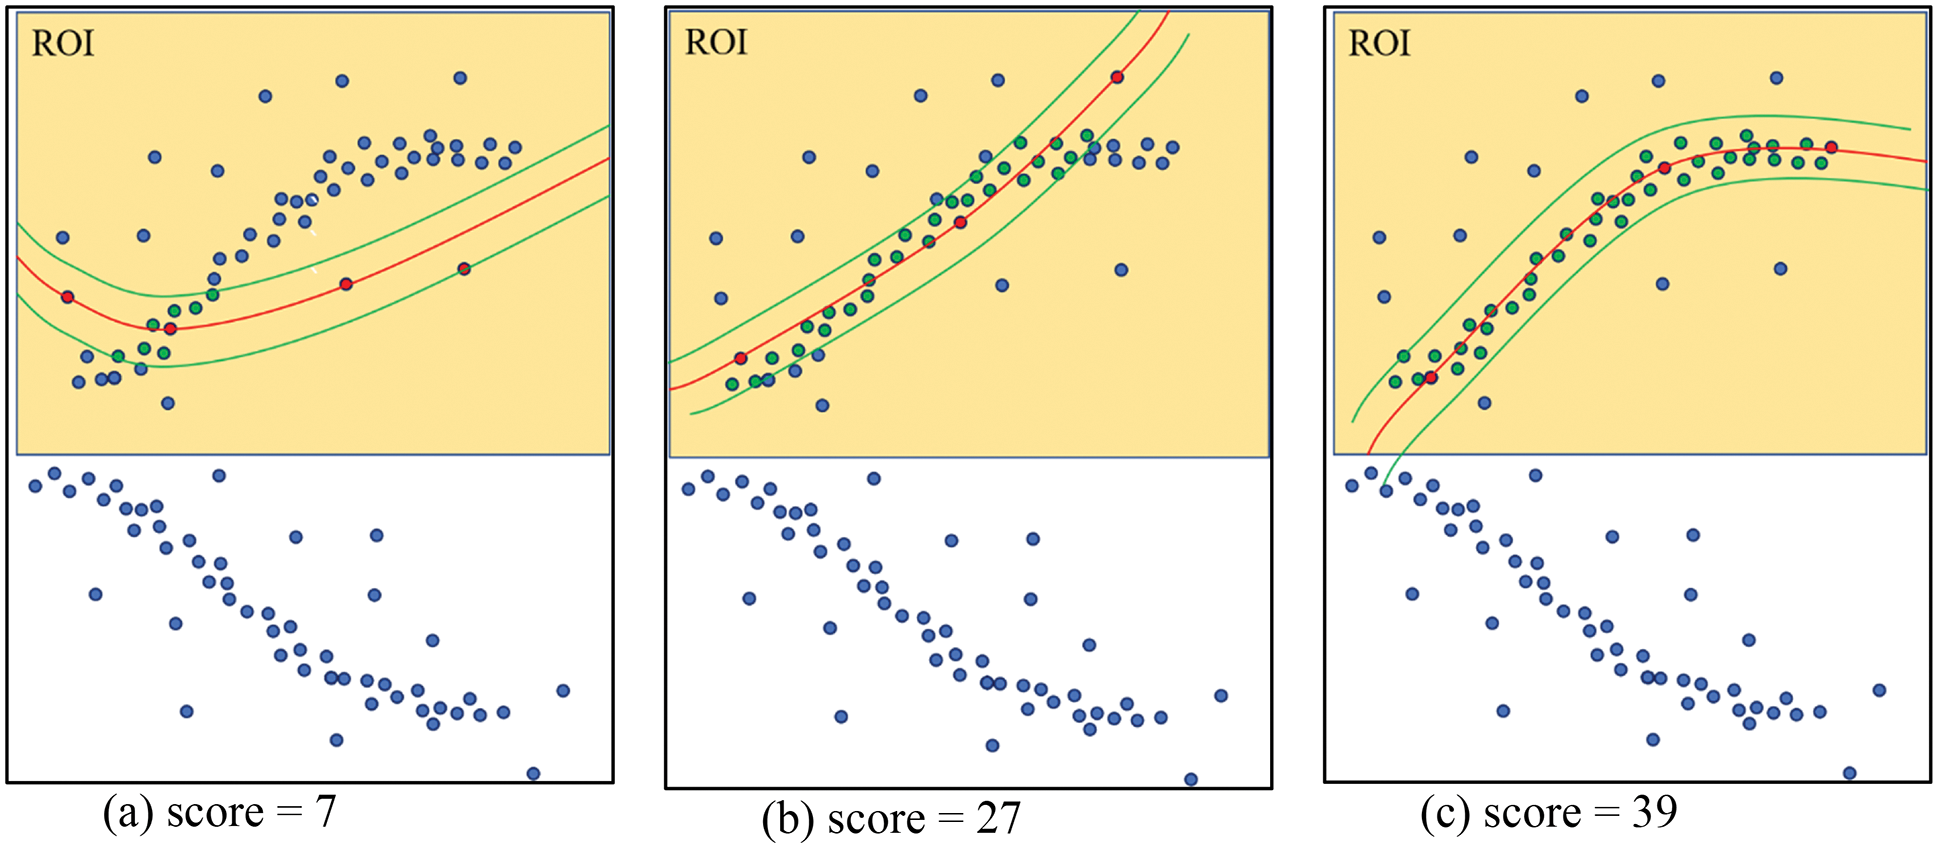
Figure 4: Selection of an appropriate model based on RANSAC
Eq. (1) shows the probability of m randomly selected dots by RANSAC being inliers for an appropriate model.
where m is the number of dots randomly selected, a is the ratio of inliers to the entire dots, and p is the probability for all m dots, which were randomly selected through the random dot selection process repeated N times, being inliers. Eq. (2) is used to calculate the minimum number of repetitions for the random dot selection process for selecting an appropriate model.
Fig. 5 shows the process of extracting the fish outline based on RANSAC. RANSAC was applied to two preprocessed images to detect an appropriate outline.
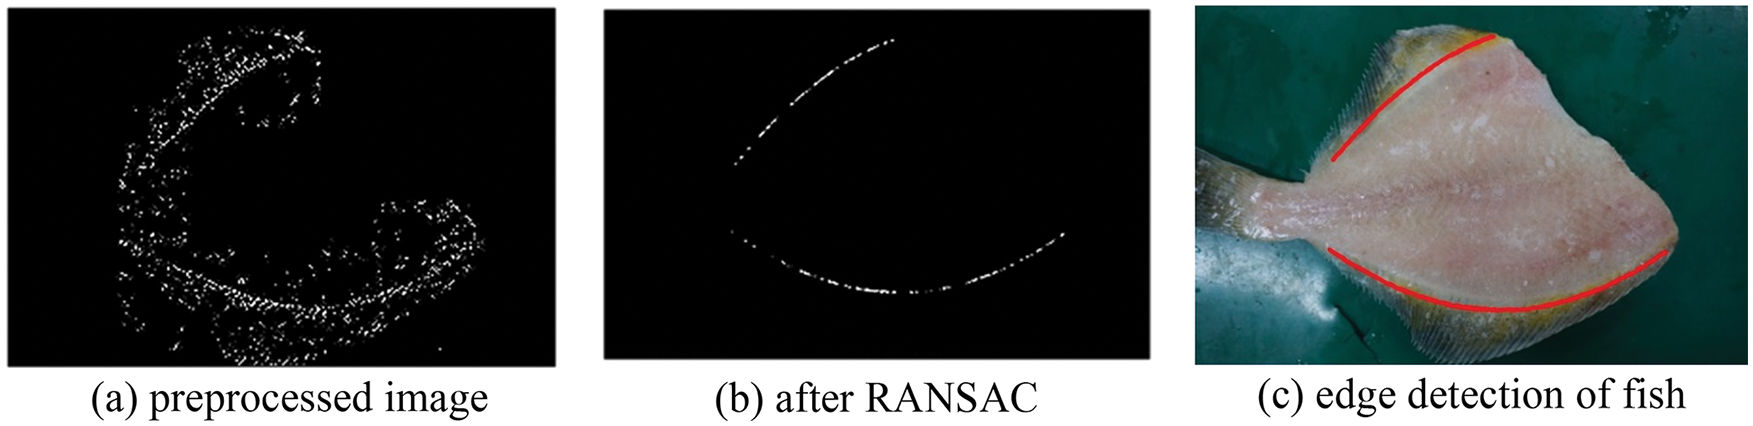
Figure 5: The process of fish outline detection based on 2D modeling
As described above, this study performed appropriate fish outline modeling based on RANSAC. However, the tails of fish include an inflection point where a parabola is inversely bent. Fig. 6 indicates that the calculation of a quadratic equation model is not sufficient to completely perform fish outline detection. When the upper outline was expanded in the direction of the head, model fitting became inappropriate. This problem was also observed when the bottom outline was expanded in the direction of the tail. To solve this problem, this study additionally proposed partitioned RANSAC. Fig. 7 shows the processes of partitioned RANSAC.
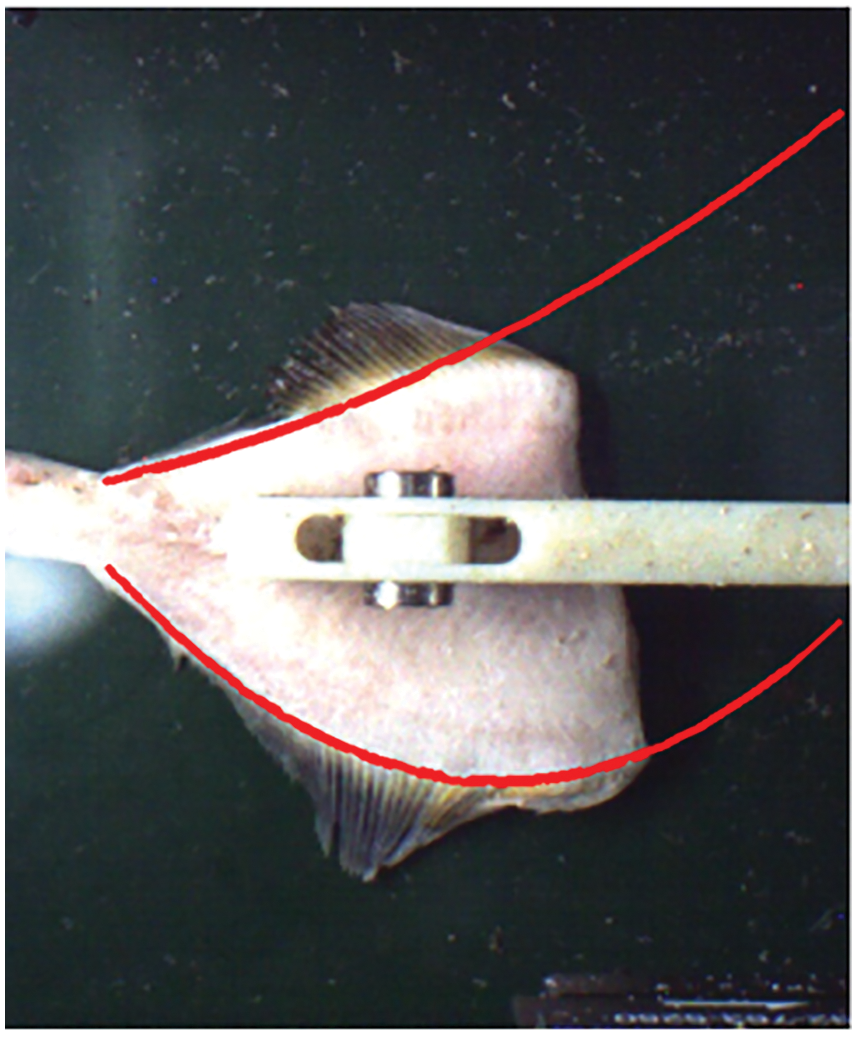
Figure 6: Limitations of the derived fish outline model based on RANSAC
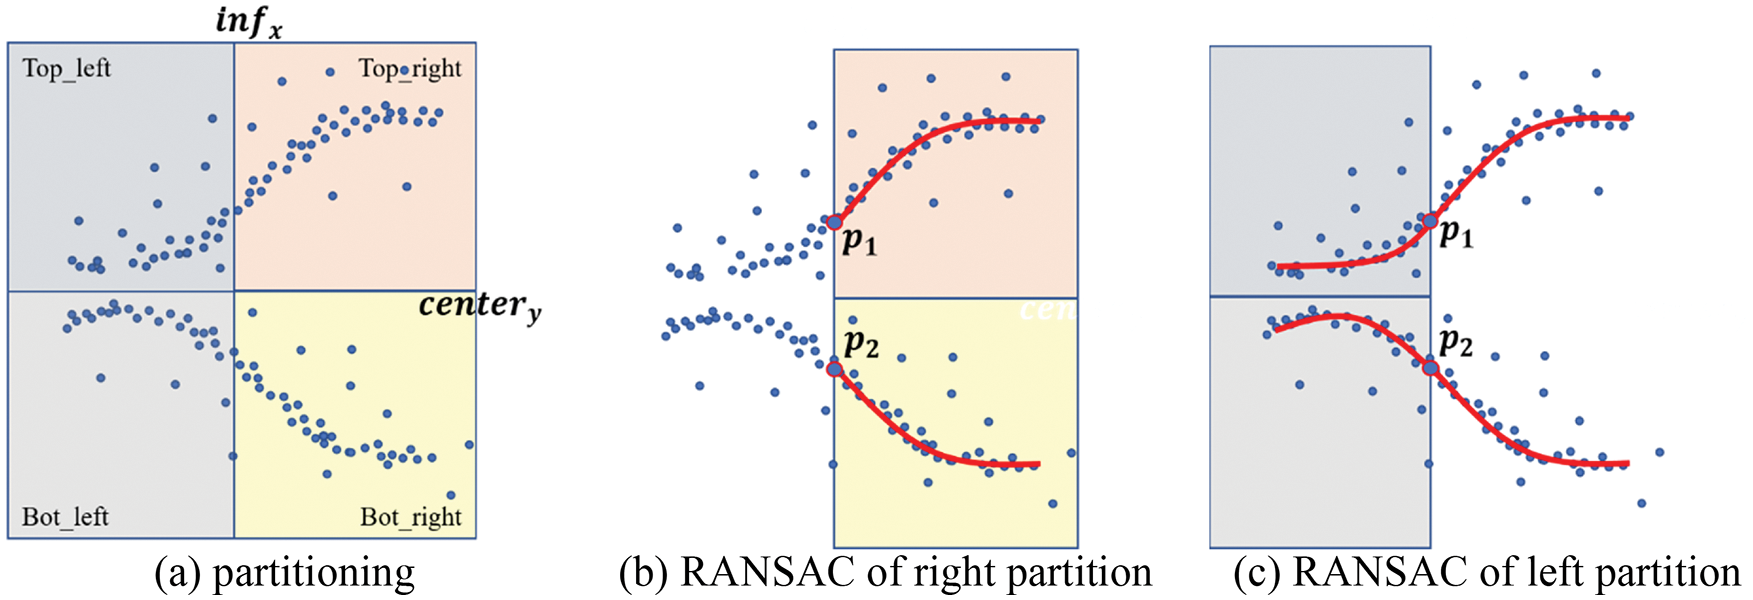
Figure 7: Fish outline modeling processes based on partitioned RANSAC
If it is assumed that fish are always located at a similar location, the inflection point will also be located at a similar location. As shown in Fig. 7, first, the target image is partitioned based on infx, the x coordinate of the average inflection point from side to side. Accordingly, the image is partitioned based on the vertical center of the fish. Through these processes, four sections (top_left section, bot_left section, top_right section, and bot_right section) are partitioned, as shown in Fig. 7a. Subsequently, RANSAC is applied to the top_right and bot_right sections to perform modeling of the fish outline, as shown in Fig. 7b. At this time, p1 refers to the dot that has the lowest x of the outline model in the top_right section. In addition, p2 refers to the dot that has the lowest x of the outline model in the bot_right model. In the following process, RANSAC is applied to the top_left and bot_left sections to perform modeling of the fish outline. However, when three dots for fish outline modeling are randomly selected, p1 in the top_left section and p2 in the bot_left section must be included. As a result of this process, the outline in the top_left section is connected to that in the top_right section. In the same way, the outline in the bot_left section is connected to that in the bot_right section. Fig. 7c shows these results. Fig. 8 indicates that outline modeling based on partitioned RANSAC can solve the problem of the inflection point effectively. The outlined model obtained based on partitioned RANSAC, which is shown in Fig. 8a, shows a more flexible result than that obtained based on normal RANSAC, which is shown in Fig. 8b.
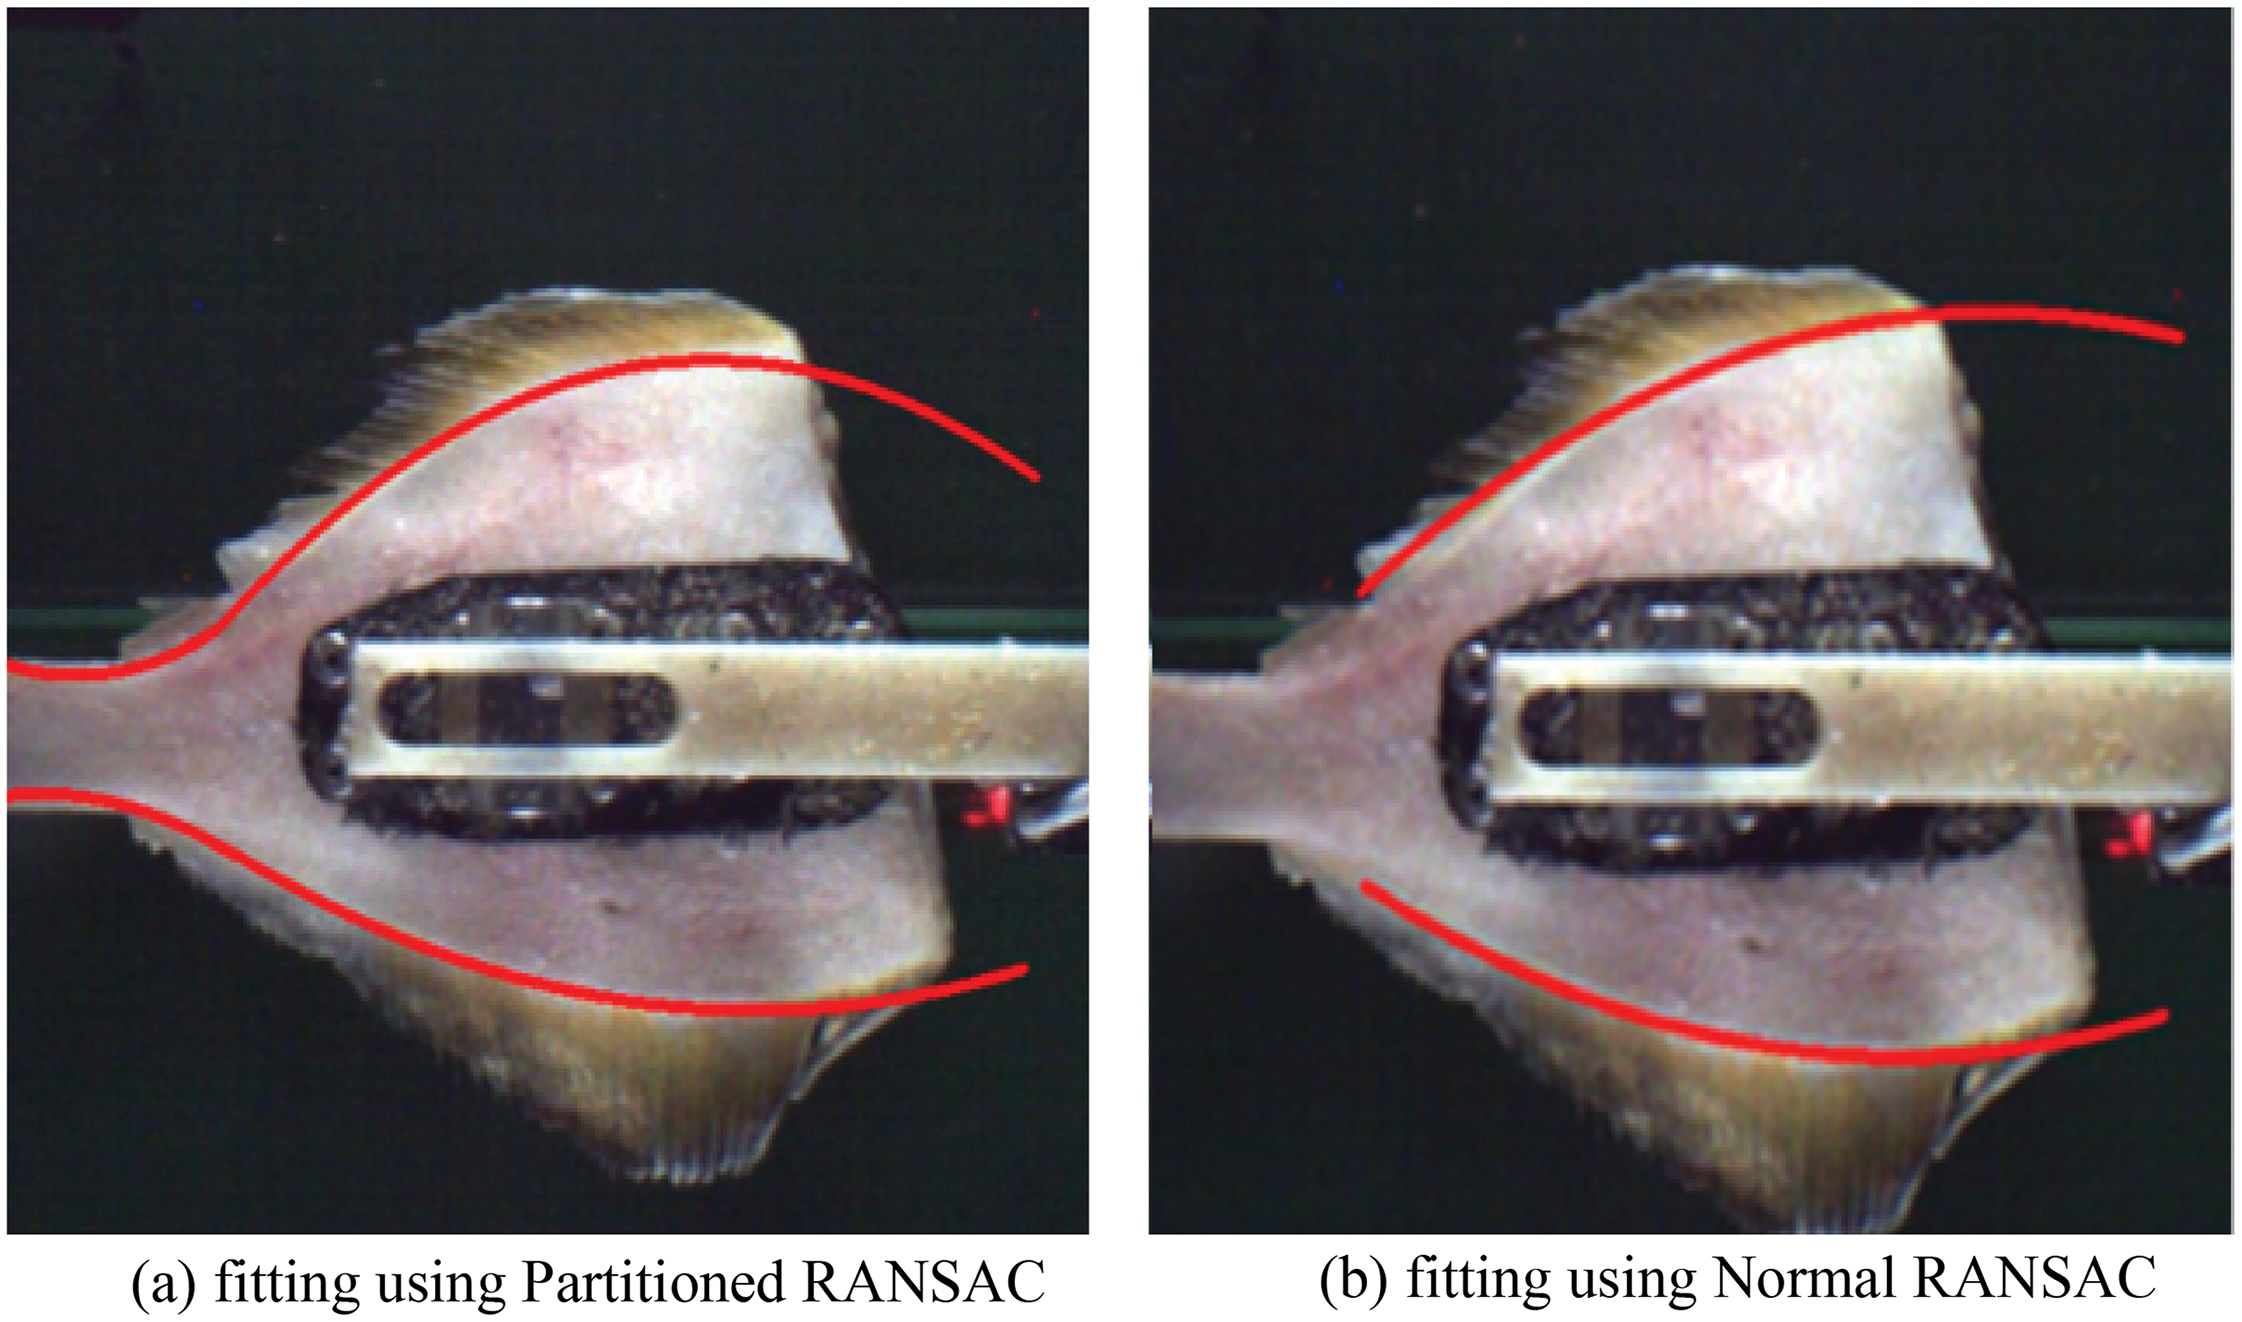
Figure 8: Comparison between the outline model obtained by partitioned RANSAC and that obtained by normal RANSAC
This section presents a method that extracts the 3D form of the target fish by using the information on the fish’s outline, which was detected by the partitioned RANSAC from the images of the fish taken from the floor plan view and the front view. Fig. 9 shows the processes of modeling the 3D form of the target fish. First, an oval is generated based on information on the thickness of the target fish based on p, a random x coordinate, obtained from two outlines. To generate the oval, information on the thickness of the target fish at point p in the image of the floor plan view is defined as 2 ap. Information on the thickness of the target fish at point p in the front view is defined as 2 bp. As a result, 2 ap and 2 bp serve as the major axis and minor axis, respectively, thereby forming the oval. Furthermore, ovals in the entire sections of the target fish can be connected to derive the 3D form of the target fish. At this time, the area of the oval at p can be calculated based on Eq. (3). Eq. (4) is used to calculate the volume from the tail over length l. Consequently, the user of the proposed method can obtain 3D information on the volume, length, maximum major axis, and maximum minor axis by performing 3D modeling of the initial images of the target fish. Information on the thickness of the target fish is replaced with information on the major and minor axes of the oval. The proposed method carries out machine learning to train the correlation between such 3D information and practically measured weight and ultimately implements a fish cutting point prediction model based on machine learning according to weight.
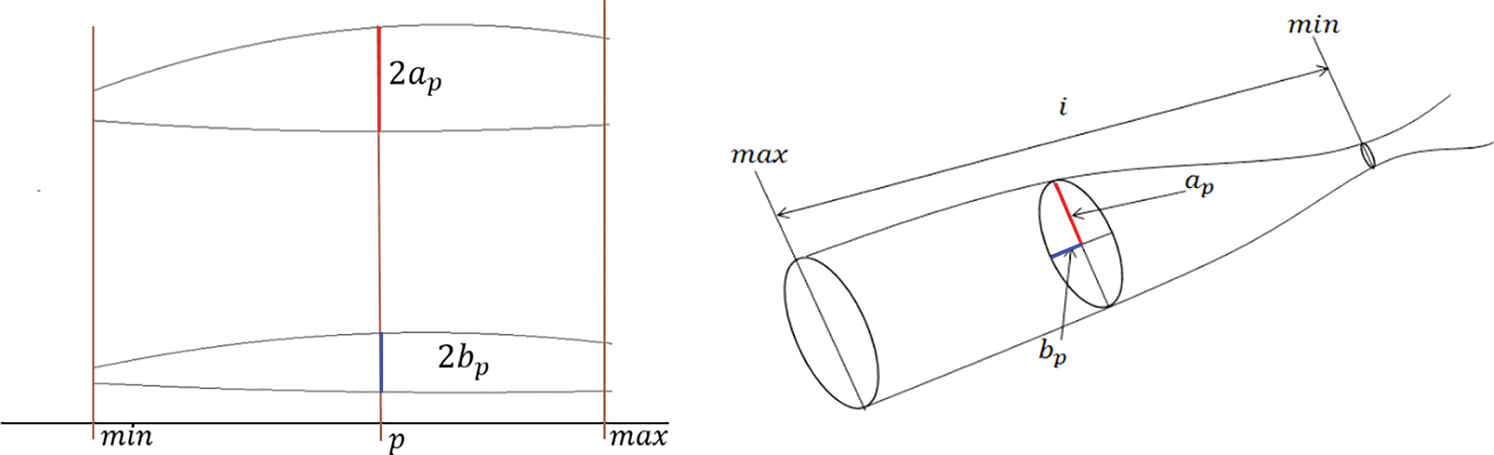
Figure 9: 3D modeling of the target fish’s form
3.4 Fish Cutting Point Prediction Model
The calculated volume is multiplied by density to calculate the weight of the target fish. However, density varies depending on fish parts, such as a part full of flesh and a part including intestines. For this reason, the same density cannot be applied to the entire fish. To solve this problem, the proposed method predicts the weight of the target fish by performing machine learning of a correlation between 3D information (e.g., volume, length, maximum major axis, and maximum minor axis) extracted from images and practically measured weight. To facilitate machine learning, 100 Pacific saury samples, which were cut into different lengths, were generated. Fig. 10 shows some of these samples.
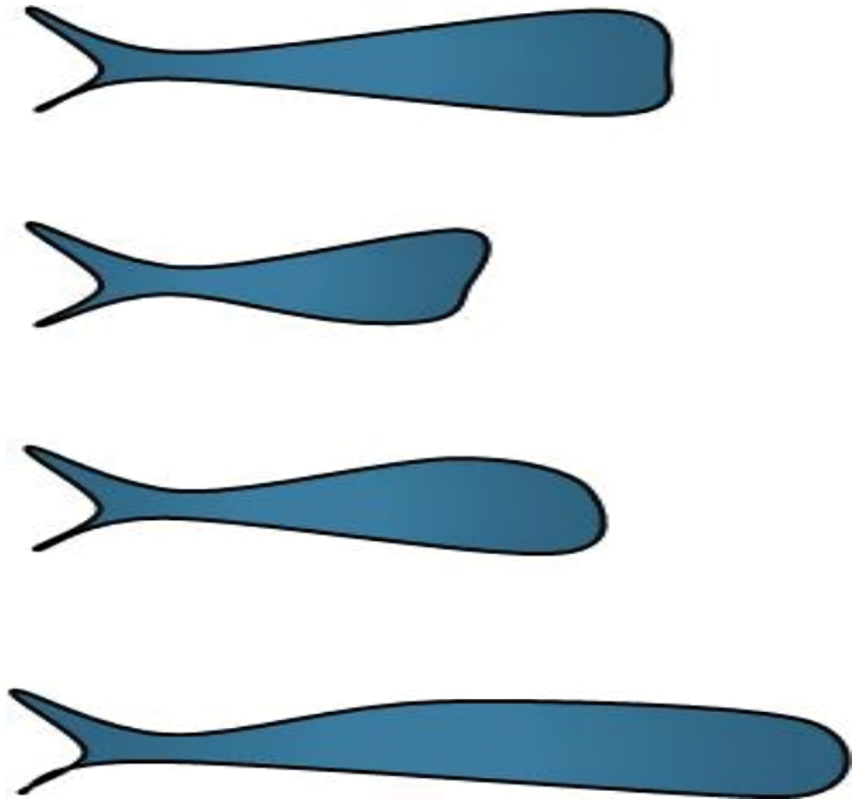
Figure 10: Examples of the samples for the establishment of a dataset
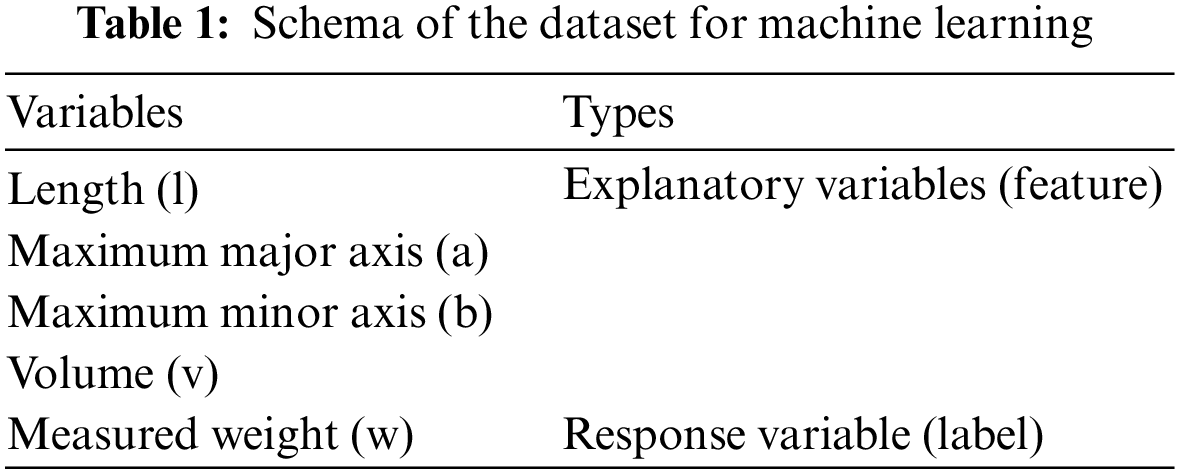
The proposed method extracted 3D feature information by performing preprocessing, 2D modeling, and 3D modeling of each sample. Subsequently, it recorded all cases of practically measured weight to generate a dataset. Table 1 shows the schema of the dataset applied to machine learning. Length, maximum major and minor axes, and volume were used as explanatory variables. Practically measured weight was used as a response variable.
Artificial neural networks were selected as a technique for training a relationship between 3D feature information and weight based on machine learning. First, the previously trained fish cutting point prediction model receives the 3D feature information on the input fish. Then, it increases the length (l) of the target fish from the tail direction (min) to the head direction (max) until the predicted weight (pw) becomes the target weight (tw). When pw becomes tw, l1 serves as the first cutting point according to tw. When pw becomes 2*tw, l2 serves as the second cutting point. That is, the nth cutting point is consistent with the length calculated when pw becomes n*tw. Fig. 11 shows each fish cutting point under the condition of tw maintained as 30 g.
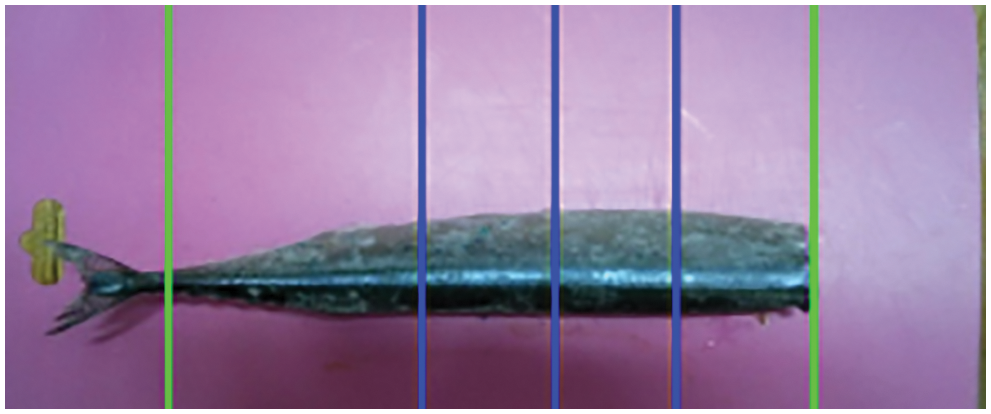
Figure 11: Cutting point prediction according to the target weight of 30 g, performed by the previously trained cutting point prediction model considering the weight (green (left): min, green (right): max, blue: cutting points)
4.1 Experimental Environment and Procedures
150 Pacific sauries were used to verify the performance of the proposed method. Thirty fish were cut in different lengths, as shown in Fig. 10, and used to establish a dataset for training. The other 120 Pacific saury were used for evaluation. Next, 60 of the 120 Pacific sauries were used in an experiment applying a target weight of 40 g, and the other 60 were used in an experiment applying a target weight of 60 g.
Fig. 12 shows the experimental procedures. First, the target Pacific saury and the target weight are input in the capture box. At this time, the Pacific saury is always located at the fixed location in the capture box. The capture box contains two cameras and a lamp, which are used to take photos of the target fish from the floor plan view and front view. When the photos of the Pacific saury are taken in the capture box, 3D feature information on this fish is extracted through preprocessing and modeling processes. By using the extracted information, the previously trained model predicts and visualizes cutting points according to the target weight. Finally, the Pacific saury is cut based on the predicted cutting points, and the weight of the pieces cut is measured.
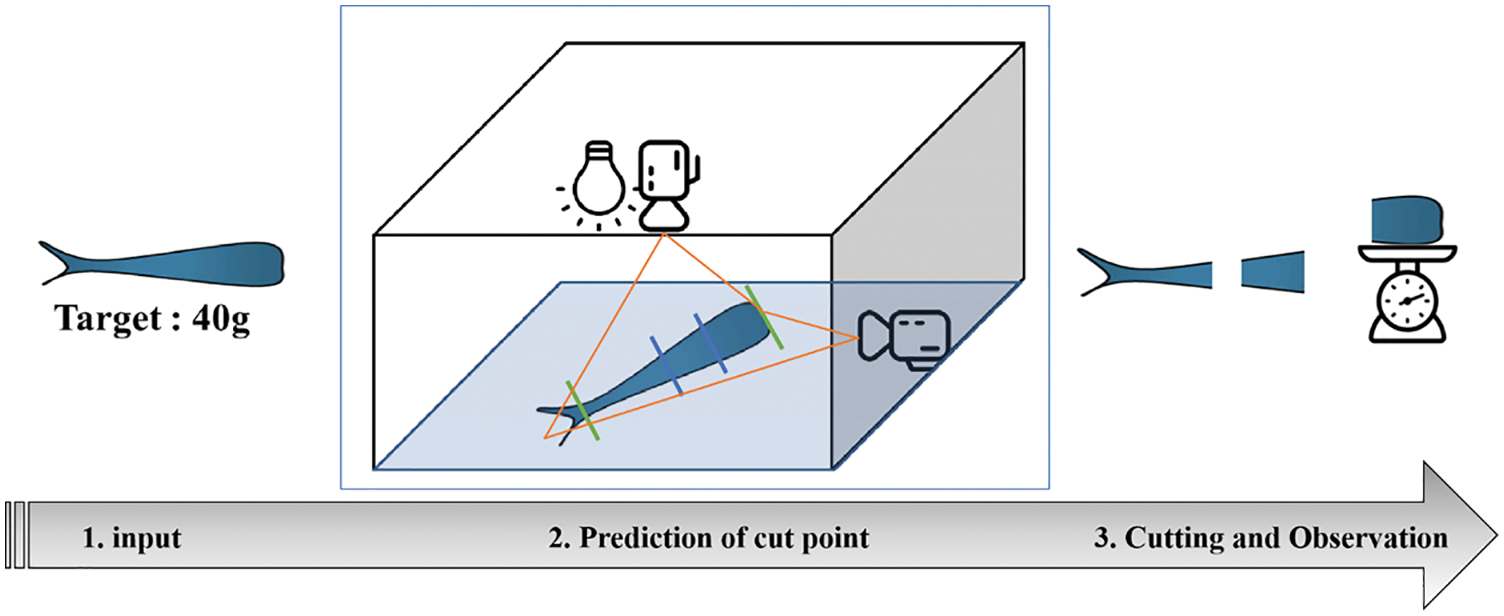
Figure 12: Procedures for evaluating the proposed method
The measured results were analyzed based on the MAE, the mean relative error (MRE) and the Max Error to evaluate the performance of the proposed method. Eqs. (5)–(7) were used to calculate the MAE, the MRE and the Max Error. Here,
Table 2 shows the results of the performance evaluation according to the target weight of 40 g. Sixty samples were used in this experiment, and the MAE, MRE, and max error were indicated in the evaluation result.
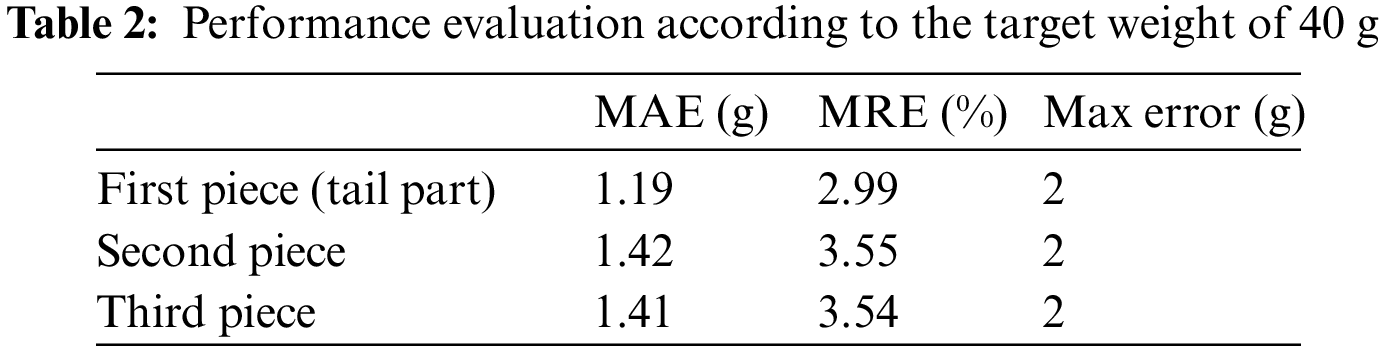
In the experiment applying the target weight of 40 g, the MAE, MRE, and max error of the first piece were 1.19 g, 2.99%, and 2 g, respectively. This means that the first pieces showed a mean error of 1.19 g, which can be converted into an error rate of approx. 3%. The max error was 2 g. The MAE, MRE, and max error of the second piece were 1.42 g, 3.55%, and 2 g, respectively. The max error was 2 g. The MAE, MRE, and max error of the third piece were 1.41 g, 3.54%, and 2 g, respectively. The overall MRE was calculated to be approx. 3%.
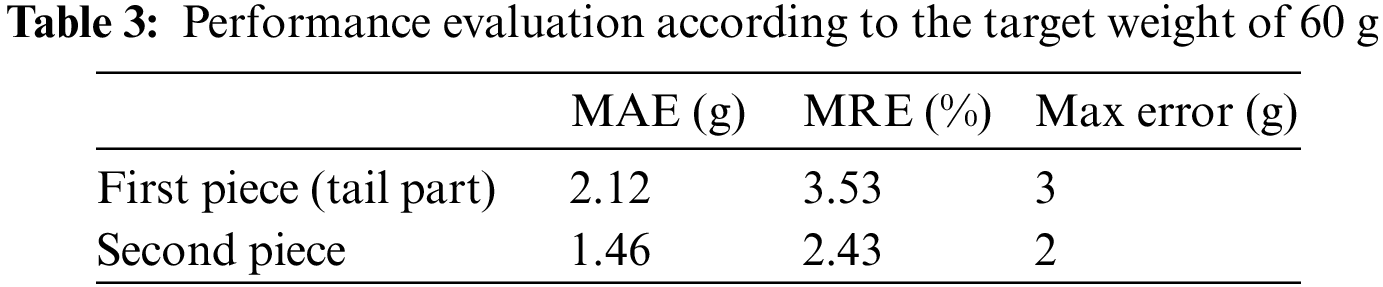
Table 3 shows the result of the performance evaluation according to the target weight of 60 g. In this experiment, 60 samples were used. The analytic results indicated that the overall MRE was approx. 3%.
As for practically allowable errors in the field, the error rate of weight is within 8% [35]. As the proposed method shows an error rate of approx. 3%, this method exhibits excellent performance. Moreover, image processing techniques were used for 3D modeling. Since image processing was carried out within 0.01 s, it is expected that the proposed method can perform image processing with insignificant delay in the environment where a conveyer belt is operated.
4.3 Fitting Performance Evaluation
The weight prediction performance is related to how accurately the fish contours are fitted. Thus, the fitting accuracy of the fish contour was examined using Partitioned RANSAC and Normal RANSAC methods with the evaluation criteria, MAE and Max Error. MAE was assessed by comparing the line fitted by each method to the line drawn by a worker on the fish contour. Table 4 shows the fitting errors of Partitioned RANSAC and Normal RANSAC. The fitting error was calculated using two different views: the floor plan and the front view. As shown in Table 4, Partitioned RANSAC outperforms Normal RANSAC in every view.

As indicated in the results of performance evaluation in Section 4.2, the proposed method showed a general error rate of approx. 3% under different target weight conditions and thus exhibited excellent performance. However, the following limitations should be considered in further research. First, 150 Pacific saury samples were used in the experiments of this study. Such a low number of samples can be significantly insufficient to evaluate the objective performance of the proposed method.
Thus, more samples should be applied in further research. Second, various types of fish should be considered in performance evaluation. This study carried out experiments based on only one type of fish. In this regard, experiments on different types of fish should be conducted in further research.
To overcome the aforementioned threats, this study conducted multiple negotiations with the company that supplied Pacific saury samples from the initial state of experiments. Nevertheless, this study faced practical limitations in that a sufficient number of fish (the number of Pacific saury samples) and various types of fish cannot be supplied and used in experiments without financial support. In addition, although a sufficient number of fish and different types of fish are supplied, the following experimental environment conditions should be satisfied to accurately cut fish. First, fish samples should be put in a freezer at extremely low temperatures. Then, experiments should be carried out under the condition where the frozen state of fish samples is maintained. However, it was practically impossible to stay in such an environment and keep cutting fish samples regardless of the state of a sufficient number and different types of fish samples provided. Third, parameter settings for various filters used for image processing should also be considered. This study established necessary parameters for the proposed method as default values or the optimal values for experimental conditions. However, the performance of the proposed method can be affected by a degree of different illumination intensity and selection of appropriate parameters for deriving objective performance according to fish types.
Food manufacturing and processing companies that handle a large number of fishes intend to package and deliver their food projects at a fixed weight. Particularly, skilled workers manually perform fish trimming when a certain type of fish cannot be easily trimmed. A few companies use automated processing machines in the field, whereas the structure of these machines is too simple to process fish with various patterns. These machines also show a significant range of errors regarding the target weight. This study proposed a method that can predict fish cutting points according to weight by using image processing and machine learning techniques to solve the aforementioned problems and ultimately improve the working environment in food manufacturing and processing companies. The proposed method applies various types of image processing techniques and partitioned RANSAC to the images to extract information on the 3D modeling, length, maximum major axis, maximum minor axis, and volume of the target fish. The proposed model trains extracted 3D feature information and practically measures weight information and predicts cutting points on the input fish image according to the desired weight by using the trained information. The result of evaluating the performance of the proposed method indicated that this method showed a mean error of approx. 3% between the target weight and the predicted weight. An error rate of 8% is allowable and can be practically applied in the field. In this regard, it is evaluated that the proposed method exhibits higher performance than existing machines used in the field. It is expected that the proposed method will significantly contribute to developing automated cutting systems that connect cutting machines with conveyer belts and consider weight.
In addition, further research will be carried out to apply a method that can identify the optimal parameter values for image processing techniques and ultimately commercialize the proposed method. Furthermore, the research team will conclude research project agreements with fish product delivery factories to receive a sufficient number and more various types of fish, apply the proposed method to abundant fish samples, and enhance this method in future research.
Funding Statement: This research was supported by the Basic Science Research Program through the National Research Foundation of Korea (NRF) funded by the Ministry of Education (NRF-2020R1I1A3073313).
Conflicts of Interest: The authors declare that they have no conflicts of interest to report regarding the present study.
References
1. G. Merino, M. Barange, J. L. Blanchard, J. Harle, R. Holmes et al., “Can marine fisheries and aquaculture meet fish demand from a growing human population in a changing climate?,” Global Environmental Change, vol. 22, no. 4, pp. 795–806, 2012. [Google Scholar]
2. N. N. Gaikwad, T. Ahmad, G. B. Yenge and A. Shinh, “Design, development and performance evaluation of fish descaling machine,” Fishery Technology, vol. 54, no. 4, pp. 273–278, 2017. [Google Scholar]
3. H. Hong, X. Yang, Z. You and F. Cheng, “Visual quality detection of aquatic products using machine vision,” Aquacultural Engineering, vol. 63, no. 1, pp. 62–71, 2014. [Google Scholar]
4. M. Kobayashi, S. Msangi, M. Batka, S. Vannuccini, M. Dey et al., “Fish to 2030: The role and opportunity for aquaculture,” Aquaculture Economics & Management, vol. 19, no. 3, pp. 282–300, 2015. [Google Scholar]
5. G. Sanchez-Torres, A. Ceballos-Arroyo and S. Robles-Serrano, “Automatic measurement of fish weight and size by processing underwater hatchery images,” Engineering Letters, vol. 26, no. 4, pp. 461–472, 2018. [Google Scholar]
6. W. H. Choi, “For the indirect measurement of ocean acidification, finding a plan to collect big data of crab catches using domestic fishing boats: focusing on the West Sea in South Korea,” in Proc. Int. Conf. on Multimedia Information Technology and Applications (MITA), Seogwipo, KOR, pp. 458–461, 2021. [Google Scholar]
7. F. Antonucci and C. Costa, “Precision aquaculture: A short review on engineering innovations,” Aquaculture International, vol. 28, no. 1, pp. 41–57, 2020. [Google Scholar]
8. I. Laradji, A. Saleh, P. Rodriguez, D. Nowrouzezahrai, M. R. Azghadi et al., “Affinity LCFCN: Learning to segment fish with weak supervision,” arXiv preprint arXiv: 2011, 03149, 2020. [Google Scholar]
9. R. Jongjaraunsuk and W. Taparhudee, “Weight estimation of asian sea bass (lates calcarifer) comparing whole body with and without fins using computer vision technique,” Walailak Journal of Science and Technology (WJST), vol. 18, no. 10, pp. 9495, 2021. [Google Scholar]
10. T. M. Banhazi, M. Tscharke, W. M. Ferdous, C. Saunders and S. H. Lee, “Improved image analysis based system to reliably predict the live weight of pigs on farm: Preliminary results,” Australian Journal of Multi-disciplinary Engineering, vol. 8, no. 2, pp. 107–119, 2011. [Google Scholar]
11. X. Li, “Study on the freshness identification of frozen-thaw fish based on hyperspectral detection technology,” in Proc. Int. Conf. on Multimedia Information Technology and Applications (MITA), Seogwipo, KOR, pp. 96–99, 2021. [Google Scholar]
12. I. Nyalala, C. Okinda, N. Makange, T. Korohou, Q. Chao et al., “On-line weight estimation of broiler carcass and cuts by a computer vision system,” Poultry Science, vol. 100, no. 12, pp. 101474, 2021. [Google Scholar]
13. A. Pezzuolo, M. Guarino, L. Sartori, L. A. González and F. Marinello, “On-barn pig weight estimation based on body measurements by a Kinect v1 depth camera,” Computers and Electronics in Agriculture, vol. 148, no. 2, pp. 29–36, 2018. [Google Scholar]
14. R. A. Hauser-Davis, T. F. Oliveira, A. M. Silveira, T. B. Silva and R. L. Ziolli, “Case study: Comparing the use of nonlinear discriminating analysis and artificial neural networks in the classification of three fish species: Acaras (geophagus brasiliensistilapias (tilapia rendalli) and mullets (mugil liza),” Ecological Informatics, vol. 5, no. 6, pp. 474–478, 2010. [Google Scholar]
15. D. Li and L. Du, “Recent advances of deep learning algorithms for aquacultural machine vision systems with emphasis on fish,” Artificial Intelligence Review, vol. 55, pp. 4077–4116, 2022. [Google Scholar]
16. A. Voulodimos, N. Doulamis, A. Doulamis and E. Protopapadakis, “Deep learning for computer vision: A brief review,” Computational Intelligence and Neuroscience, vol. 2018, pp. 1–13, 2018. [Google Scholar]
17. T. T. E. Vo, H. Ko, J. H. Huh and Y. Kim, “Overview of smart aquaculture system: Focusing on applications of machine learning and computer vision,” Electronics, vol. 10, no. 22, pp. 2882, 2021. [Google Scholar]
18. J. Park, J. Y. Kim, J. H. Huh, H. S. Lee, S. H. Jung et al., “A novel on conditional min pooling and restructured convolutional neural network,” Electronics, vol. 10, no. 19, pp. 2407, 2021. [Google Scholar]
19. S. H. Kim and J. H. Huh, “Consistency of medical data using intelligent neuron faster R-CNN algorithm for smart health care application,” Multidisciplinary Digital Publishing Institute in Healthcare, vol. 8, no. 2, pp. 185, 2020. [Google Scholar]
20. Y. Lee, D. Jun, B. G. Kim and H. Lee, “Enhanced single image super resolution method using lightweight multi-scale channel dense metwork,” Sensors, vol. 21, no. 10, pp. 3351, 2021. [Google Scholar]
21. S. K. Kumaran, S. Mohapatra, D. P. Dogra, P. P. Roy and B. G. Kim, “Computer vision-guided intelligent traffic signaling for isolated intersections,” Expert Systems with Applications, vol. 134, no. 5–6, pp. 267–278, 2019. [Google Scholar]
22. Y. J. Choi, Y. W. Lee and B. G. Kim, “Residual-based graph convolutional network for emotion recognition in conversation for smart internet of things,” Big Data, vol. 9, no. 4, pp. 279–288, 2021. [Google Scholar]
23. J. M. Miranda and M. Romero, “A prototype to measure rainbow trout’s length using image processing,” Aquacultural Engineering, vol. 76, no. 1, pp. 41–49, 2017. [Google Scholar]
24. Q. Al-Jubouri, W. Al-Nuaimy, M. Al-Taee and I. Young, “Towards automated length-estimation of free-swimming fish using machine vision,” in Proc. IEEE Int. Conf. on Systems, Signals & Devices (SSD), Marrakech, MAR, pp. 469–474, 2017. [Google Scholar]
25. M. O. Balaban, G. F. Ünal Şengör, M. G. Soriano and E. G. Ruiz, “Using image analysis to predict the weight of Alaskan salmon of different species,” Journal of Food Science, vol. 75, no. 3, pp. E157–E162, 2010. [Google Scholar]
26. Y. Wu, R. Zhuang and Z. Cui, “Automatic sorting system of large yellow croaker based on machine vision,” in Proc. IEEE Int. Conf. on High Performance Big Data and Intelligent Systems (HPBD&IS), Shenzhen, CHN, pp. 233–237, 2019. [Google Scholar]
27. S. Yang, Z. Zhang, J. Yi, J. Liu and J. Wang, “Design of bay scallop roll grading equipment,” Food Research and Development, vol. 37, no. 12, pp. 220–224, 2016. [Google Scholar]
28. D. G. Lee and Y. S. Seo, “Testing cost reduction using nested mutation testing,” in Proc. Int. Conf. on Multimedia Information Technology and Applications (MITA), Seogwipo, KOR, pp. 462–463, 2021. [Google Scholar]
29. K. A. Kamaruzzaman, A. Mahfurdz, M. Hashim and M. N. Bidin, “Design and performance evaluation of semi-automatic fish cutting machine for industry,” in Proc. Joint Conf. on Green Engineering Technology & Applied Computing 2020, Bangkok, THA, pp. 1–7, 2020. [Google Scholar]
30. C. Pornpanomchai, B. Lurstwut, P. Leerasakultham and W. Kitiyanan, “Shape-and texture-based fish image recognition system,” Agriculture and Natural Resources, vol. 47, no. 4, pp. 624–634, 2013. [Google Scholar]
31. C. -U. Son, G. -H. Kim, I. Kim, H. -H. Tak and S. -B. Lee, “Implementation of the controller for intelligent process system using neural network,” in Proc. Korean Institute of Intelligent Systems Conf., Gyeongsan, KOR, pp. 376–379, 2000. [Google Scholar]
32. H. Azarmdel, S. S. Mohtasebi, A. Jafari and A. R. Muñoz, “Developing an orientation and cutting point determination algorithm for a trout fish processing system using machine vision,” Computers and Electronics in Agriculture, vol. 162, no. 3, pp. 613–629, 2019. [Google Scholar]
33. M. Man, N. Abdullah, M. S. Rahim and I. M. Amin, “Fish length measurement: The results from different types of digital camera,” Journal of Advanced Agricultural Technologies, vol. 3, no. 1, pp. 67–71, 2016. [Google Scholar]
34. D. A. Konovalov, A. Saleh, D. B. Efremova, J. A. Domingos and D. R. Jerry, “Automatic weight estimation of harvested fish from images,” in Proc. Digital Image Computing: Techniques and Applications, Perth, AUS, pp. 1–7, 2019. [Google Scholar]
35. S. H. Hyun, S. C. Lee, K. H. Kim and K. S. Seo, “Shape, volume prediction modeling and identical weights cutting for frozen fishes,” Journal of Korean Institute of Intelligent Systems, vol. 22, no. 3, pp. 294–299, 2012. [Google Scholar]
36. G. A. De Vitis, P. Foglia and C. A. Prete, “A pre-processing technique to decrease inspection time in glass tube production lines,” IET Image Processing, vol. 15, no. 10, pp. 2179–2191, 2021. [Google Scholar]
37. G. Dzhezyan and H. Cecotti, “Symmetrical filters in convolutional neural networks,” International Journal of Machine Learning and Cybernetics, vol. 12, no. 7, pp. 2027–2039, 2021. [Google Scholar]
38. K. Benhamza and H. Seridi, “Canny edge detector improvement using an intelligent ants routing,” Evolving Systems, vol. 12, no. 2, pp. 397–406, 2021. [Google Scholar]
39. M. A. Fischler and R. C. Bolles, “Random sample consensus: A paradigm for model fitting with applications to image analysis and automated cartography,” Communications of the ACM, vol. 24, no. 6, pp. 381–395, 1981. [Google Scholar]
40. E. Brachmann and C. Rother, “Neural-guided RANSAC: Learning where to sample model hypotheses,” in Proc. 2019 IEEE/CVF Int. Conf. on Computer Vision, Seoul, KOR, pp. 4321–4330, 2019. [Google Scholar]
41. H. Li, J. Qin, X. Xiang, L. Pan, W. Ma et al., “An efficient image matching algorithm based on adaptive threshold and RANSAC,” IEEE Access, vol. 6, pp. 66963–66971, 2018. [Google Scholar]
42. J. Li, Q. Hu and Ai Mingyao, “Point cloud registration based on one-point ransac and scale-annealing biweight estimation,” IEEE Transactions on Geoscience and Remote Sensing, vol. 59, no. 11, pp. 9716–9729, 2021. [Google Scholar]
43. D. Barath and J. Matas, “Graph-cut RANSAC,” in Proc. 2018 IEEE/CVF Conf. on Computer Vision and Pattern Recognition, Salt Lake City, USA, pp. 6733–6741, 2018. [Google Scholar]
Cite This Article
 Copyright © 2023 The Author(s). Published by Tech Science Press.
This work is licensed under a Creative Commons Attribution 4.0 International License , which permits unrestricted use, distribution, and reproduction in any medium, provided the original work is properly cited.
 Downloads
 Citation Tools