
 Submit a Paper
 Propose a Special lssue
 Open Access
ARTICLE

Prediction of the SARS-CoV-2 Derived T-Cell Epitopes’ Response Against COVID Variants
1 Department of Electrical Engineering, HITEC University, Taxila, 47080, Pakistan
2 Department of Cyber Security, Pakistan Navy Engineering College, NUST, Karachi, 75350, Pakistan
3 Computer Science Department, College of Computer and Information Sciences, Imam Mohammad Ibn Saud Islamic University (IMSIU), Riyadh, 11432, Saudi Arabia
4 School of Computing, Edinburgh Napier University, Edinburgh, EH10 5DT, U.K
* Corresponding Author: Jawad Ahmad. Email:
Computers, Materials & Continua 2023, 75(2), 3517-3535. https://doi.org/10.32604/cmc.2023.035410
Received 20 August 2022; Accepted 29 January 2023; Issue published 31 March 2023
 View Full Text
 Download PDF
Abstract
The COVID-19 outbreak began in December 2019 and was declared a global health emergency by the World Health Organization. The four most dominating variants are Beta, Gamma, Delta, and Omicron. After the administration of vaccine doses, an eminent decline in new cases has been observed. The COVID-19 vaccine induces neutralizing antibodies and T-cells in our bodies. However, strong variants like Delta and Omicron tend to escape these neutralizing antibodies elicited by COVID-19 vaccination. Therefore, it is indispensable to study, analyze and most importantly, predict the response of SARS-CoV-2-derived t-cell epitopes against Covid variants in vaccinated and unvaccinated persons. In this regard, machine learning can be effectively utilized for predicting the response of COVID-derived t-cell epitopes. In this study, prediction of T-cells Epitopes’ response was conducted for vaccinated and unvaccinated people for Beta, Gamma, Delta, and Omicron variants. The dataset was divided into two classes, i.e., vaccinated and unvaccinated, and the predicted response of T-cell Epitopes was divided into three categories, i.e., Strong, Impaired, and Over-activated. For the aforementioned prediction purposes, a self-proposed Bayesian neural network has been designed by combining variational inference and flow normalization optimizers. Furthermore, the Hidden Markov Model has also been trained on the same dataset to compare the results of the self-proposed Bayesian neural network with this state-of-the-art statistical approach. Extensive experimentation and results demonstrate the efficacy of the proposed network in terms of accurate prediction and reduced error.Keywords
Since its outbreak, the COVID-19 virus has affected our society and economies in several ways [1,2]. Around 200 countries have been affected by this ongoing disease. As of 17 August 2022, there have been around 589.68 million confirmed cases, including approximately 6.43 million deaths. After an extensive administration of vaccine doses, an eminent decline in new cases has been observed. However, the virus is still mutating, and the new variants of COVID-19 are more dangerous and dreadful than the previous ones. The four most dominating variants are Beta, Gamma, Delta, and Omicron. The health department first detected the Beta variant in the Nelson Mandela Bay metropolitan area of Eastern Cape Province of South Africa on December 18, 2020 [3]. The Gamma variant of SARS-CoV-2 was first detected by the National Institute of Infectious Diseases (NIID) of Japan on 6 January 2021 in four patients who had arrived in Tokyo and had recently visited Brazil [4]. On the other hand, the Delta variant (B.1.617) was first detected in October 2020. It turned out to be twice contagious as the previous variants [5]. Patients affected by the delta variant were more likely to be hospitalized than earlier variants. Lastly, the Omicron (B.1.1.529) variant was detected in November 2021 and is considered more transmissible than the Delta variant [6].
The response of the human body’s immune system plays a critical role against viruses or other foreign particles [7]. The COVID-19 vaccination induces the neutralizing antibodies and T-cells in our body [8]. The Omicron variant has been reported to escape these neutralizing antibodies elicited by COVID-19 vaccination extensively. T-cells are the main components of our immune system and are developed from the stem cells in our bone marrow. T-cells play a pivotal role in the immune response to viral infections. The foreign particle is commonly termed an antigen that could be a bacteria or a virus. An antibody, on the other hand, is a Y-shaped protein used by the immune system to identify and neutralize foreign particles (bacteria/viruses). Whereas an epitope is the part of an antigen molecule to which an antibody attaches itself [9–12]. The response of T-cells against different variants of COVID-19 is a vital parameter to gauge the strength of the immune system and the effectiveness of the administered vaccine doses. The virus-specific T-cells, i.e., Cluster of differentiation (CD8+ and CD4+), exert antiviral functions leading to rapid control of viral infection and reducing disease severity [13].
It is still under investigation whether or not the Omicron variant completely evades the T-cell immunity elicited by COVID-19 vaccination. Therefore, it is indispensable to study, analyze, and most importantly predict the response of SARS-CoV-2-derived t-cell epitopes against different Covid variants in vaccinated and unvaccinated persons. In this regard, machine learning methods can effectively predict the response of COVID-derived t-cell epitopes in vaccinated and unvaccinated persons, which could help and further the vaccine development studies by providing realistic prediction data.
This paper focuses on the machine learning-based prediction analysis of T-cell epitope’s response against different Covid variants in vaccinated and unvaccinated persons. The prediction analysis has been carried out using a self-proposed Bayesian neural network by combining variational inference and flow normalization optimizers. Furthermore, the Hidden Markov Model (HMM) has also been trained on the same dataset to compare the results of the self-proposed Bayesian neural network with this state-of-the-art statistical approach. Extensive experimentation and results demonstrate the efficacy of the proposed network in terms of accurate prediction and reduced error.
The main contributions of this paper are:
1. A self-proposed Bayesian Neural Network with Variational Inference and flow normalization optimizer has been developed to predict the response of T-cell epitope against four variants of COVID-19 in both vaccinated and unvaccinated persons.
2. The self-proposed Bayesian Neural Network has been compared with the Hidden Markov Method for validation purposes.
3. To validate the cross-variational inference of the proposed Bayesian Neural Network, it has been compared with the Monte Carlo method. Similarly, HMM has been cross-validated with the Support Vector Machine (SVM).
In literature, Bayesian Neural Network and Hidden Markov Method can be found for several related applications; for instance, a shallow long short-term memory (LSTM) based neural network has been proposed in [14] to predict the risk category of a country. A Bayesian optimization framework has been utilized to optimize and automatically design country-specific networks. The results show that the proposed pipeline outperforms state-of-the-art methods for data from 180 countries and can be helpful for such risk categorization. Furthermore, a hybrid approach has been proposed in [15] for forecasting COVID-19 time series methods based on combining three deep learning models, i.e., multi-head attention, long short-term memory (LSTM), and convolutional neural network (CNN) with the Bayesian optimization algorithm. All models are designed based on the multiple-output forecasting strategy, which allows forecasting multiple time points. Moreover, in [16] the spatial epidemic dynamics of the COVID-19 outbreak in Italy were modelled by employing an Object-Oriented Bayesian Network to explore the dependence relationships, statically and dynamically, among the weekly incidence rate, the intensive care units occupancy rate and that of deaths. Vaccination risk-benefit analysis has been challenging because of rapidly evolving data and/or transmission levels. To optimize the risk-benefit, a Bayesian network has been used in [17,18] to integrate local and international data, government reports, published literature and expert opinion. The model estimates probabilities of outcomes under different scenarios of age, sex, low/medium/high transmission, SARS-CoV-2 variant, vaccine doses, and vaccine effectiveness. The model can be rapidly updated to incorporate new data, adapted for other countries, extended to other outcomes (e.g., severe disease), or used for other vaccines. Similarly, a probabilistic model (a Bayesian network) has been presented that tells the users about the likelihood of asymptotic, mild or severe COVID-19 (past, present and projected). When embedded in a smartphone app, the model can detect new outbreaks in a monitored population and identify outbreak locations as early as possible.
Hidden Markov models (HMMs) capture randomnesses in Spatio-temporal dynamics and uncertainty in observations. In recent literature, several articles utilize the Hidden Markov Method for the prediction analysis of COVID data; for example, in [19] the LSTM-Markov model has been presented for the efficient prediction of COVID cases. The Markov model has been integrated with the LSTM model to reduce the prediction error of the LSTM model. Compared with the prediction results of the classical LSTM model, the average prediction error of LSTM-Markov has been reduced by more than 75%. Similarly, in [20] the problem of modelling constrained hospital resources during the pandemic has been solved using a proposed ‘aggregate count explicit-duration hidden Markov model’. Instead of daily patient admission count, authors have modelled aggregated counts of used resources. Results show that the presented approach provides competitive probabilistic forecasts for the future even as the dynamics of the pandemic shift. Besides, in another study [21], a Markov model was developed to study the clinical risk factors of patients based on cardinal data and clinical symptoms. The Markov model predicts the number of COVID-19 infections was constructed. Furthermore, the patient’s general information, clinical characteristics, and prevention methods were analyzed. The authors concluded that the Markov model could be utilized to judge the time course of COVID-19 in various development states. Furthermore, the severity of COVID-19 in different states has been predicted using the HMM model [22]. Authors have further aggregated the severity level of each region over a fixed period to visualize the time evolution and propagation across regions. Results from the implemented HMM are consistent with what was observed in Italy and the USA. Similarly, the Hidden Markov Chain has been utilised to forecast the evolution of COVID-19 in Morocco [23]. The recorded and forecasted data for the cumulative number of confirmed, recovered and active cases had been presented correctly. In addition to the Bayesian and HMM models, various hybrid models can also be found in literature, e.g., a Bayesian Ridge Regression has been hybridized with an n-degree Polynomial in [24]. It utilizes a probabilistic distribution to estimate the value of the dependent variable instead of using traditional methods for Covid-19 analysis.
While Bayesian networks (BNs) have drawn more scientific interest, their use in practice has lagged, despite their potential to impact healthcare positively. The variety of medical diseases for which healthcare-related BN models have been presented has been improved, as have the approaches taken by the models when applied to the most prevalent medical conditions. According to recent studies [25–28], nearly two-thirds of all healthcare BNs utilize a Bayesian network to focus on the four conditions cardiac, cancer, psychiatric, and lung illnesses.
After an extensive literature review, the research gap found in the existing literature to the authors’ knowledge is that machine learning-based prediction for the T-cell epitopes’ response against Covid-19 has not been performed on four different variants. Hence, in this research, a robust analysis was conducted on four different variants of Covid-19 to predict the trend of upcoming variants or similar diseases using imbalanced and new datasets and that too in a resource constraint environment, i.e., for small datasets and low computation power.
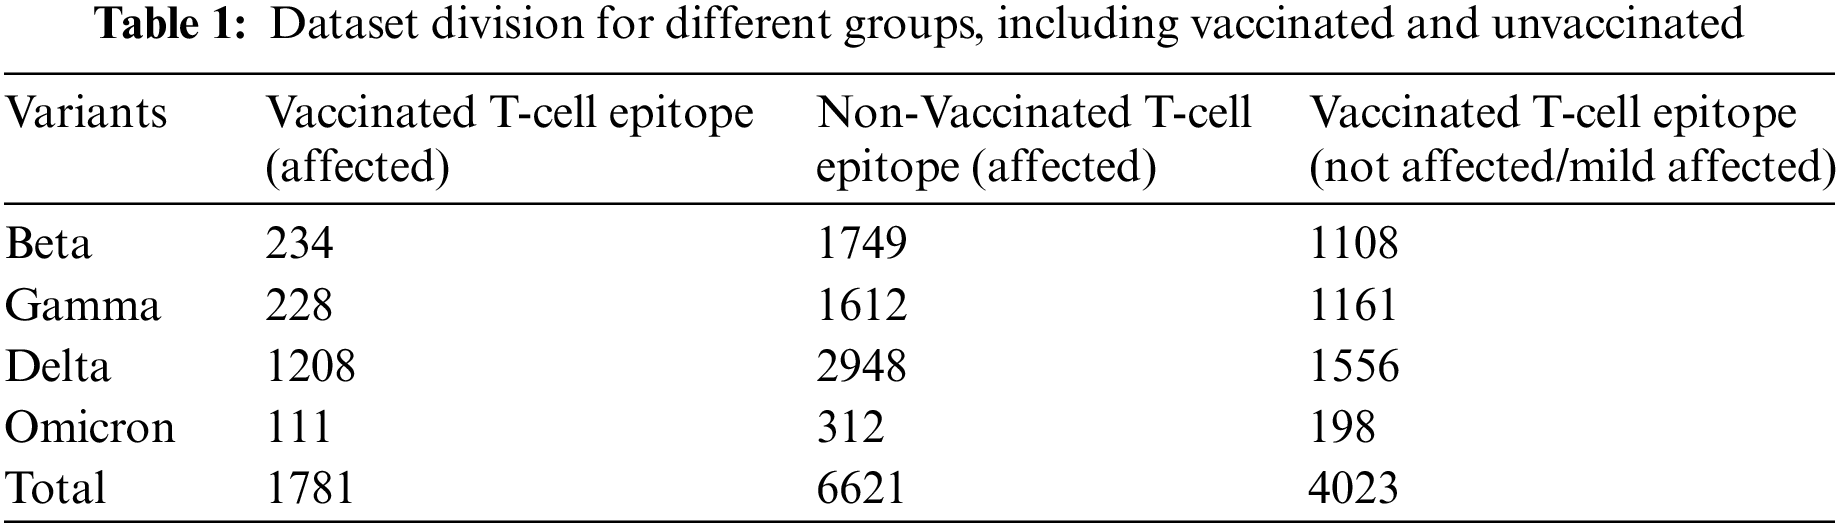
In this study, the dataset has been divided into two categories, i.e., vaccinated and unvaccinated. The Microarray datasets have been utilized for inscribing Gene Expression Omnibus of the National Centre of Biotechnology to extract the raw gene of “SARS-CoV” [29]. In addition, the T-cells epitope Affymetrix microarray dataset was gathered for different variants under vaccination and non-vaccination phases. The utilized dataset consists of 1781 samples for affected + vaccinated T-cells epitopes, 6621 samples for affected + unvaccinated T-cells epitopes, and 4023 samples for the mild affected/not affected T-cells epitopes. These samples have been obtained from four COVID-19 variant categories, i.e., beta, Gamma, delta, and Omicron, as shown in Table 1.
The overall design approach structure is shown in Fig. 1. In the design approach, initially, the dataset is distributed in two categories, i.e., vaccinated and unvaccinated. Furthermore, variants affected groups were subdivided. Moreover, the deep neural networks were trained on P-100 GPU. Comparative analysis was conducted with state-of-the-art networks to confirm the usefulness of the proposed model.
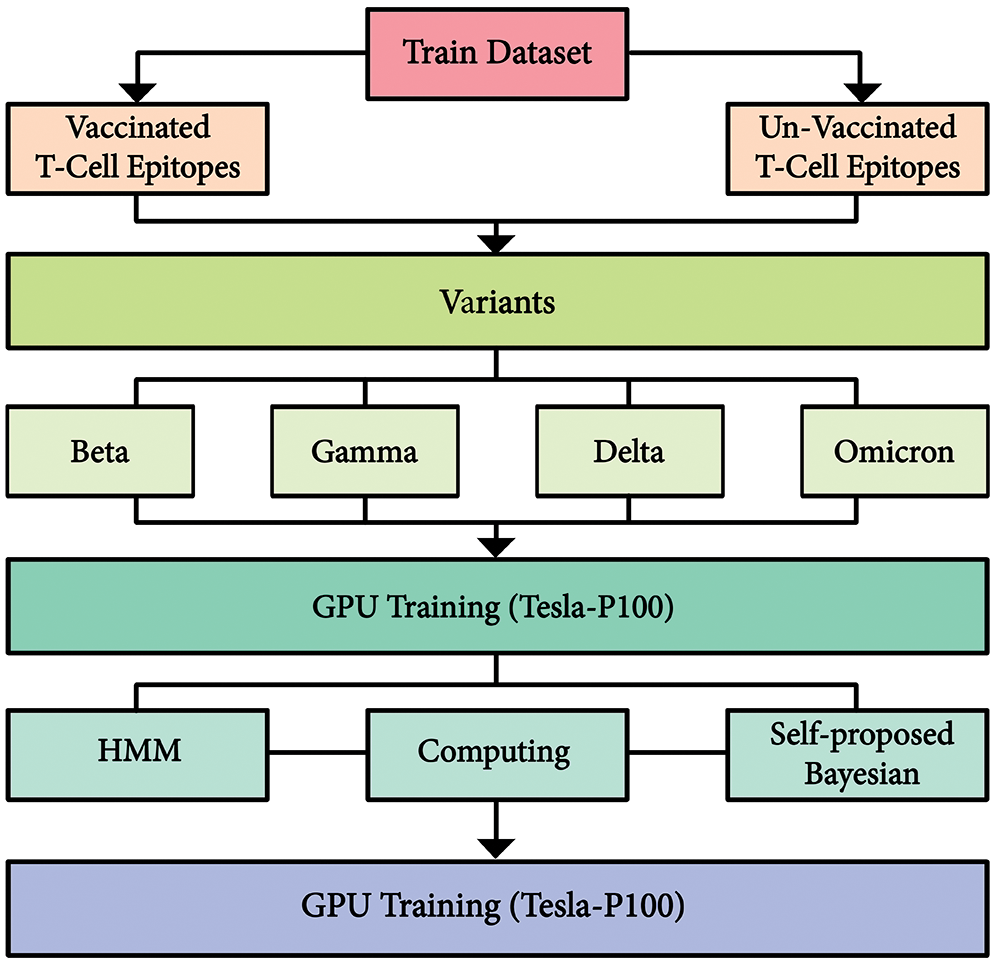
Figure 1: Integrated proposed architecture of dataset and proposed model
3.2.1 Self-Proposed Bayesian Neural Network
The proposed Bayesian neural network approach helps to enhance the predictability of COVID-19 variants and their effects on T-cells Epitopes. Especially this method is beneficial for Omicron Variant, which can help researchers to achieve analysis in a sophisticated manner with limited data. Bayesian Neural Network, in comparison to the standard neural network is more marginalized, and weights tend towards probabilistic distributions instead of single set weights distribution. It also helps in approximate predictive analysis. In this paper, the utilized technique to implement a Bayesian neural network includes integrating a variational inference with deep learning. Initially, the TensorFlow probability library is imported, and a sequential module is initialized. The model is divided into three parts, i.e., the input layer, the hidden layer and the output layer. The variational inference is applied as a dropout layer to obtain an approximate prediction analysis of different variants of COVID-19 on T-cell epitopes. Moreover, the optimization technique of variational inference using a flow normalization surrogate has been used to enhance results. Fig. 2 depicts the proposed model. Similarly, a basic variational model along with flow normalization is given in Fig. 3. The Imbalance of the dataset is explained for different distributions followed by Gaussian distribution to tackle the dataset’s misinformation and compensate for it.
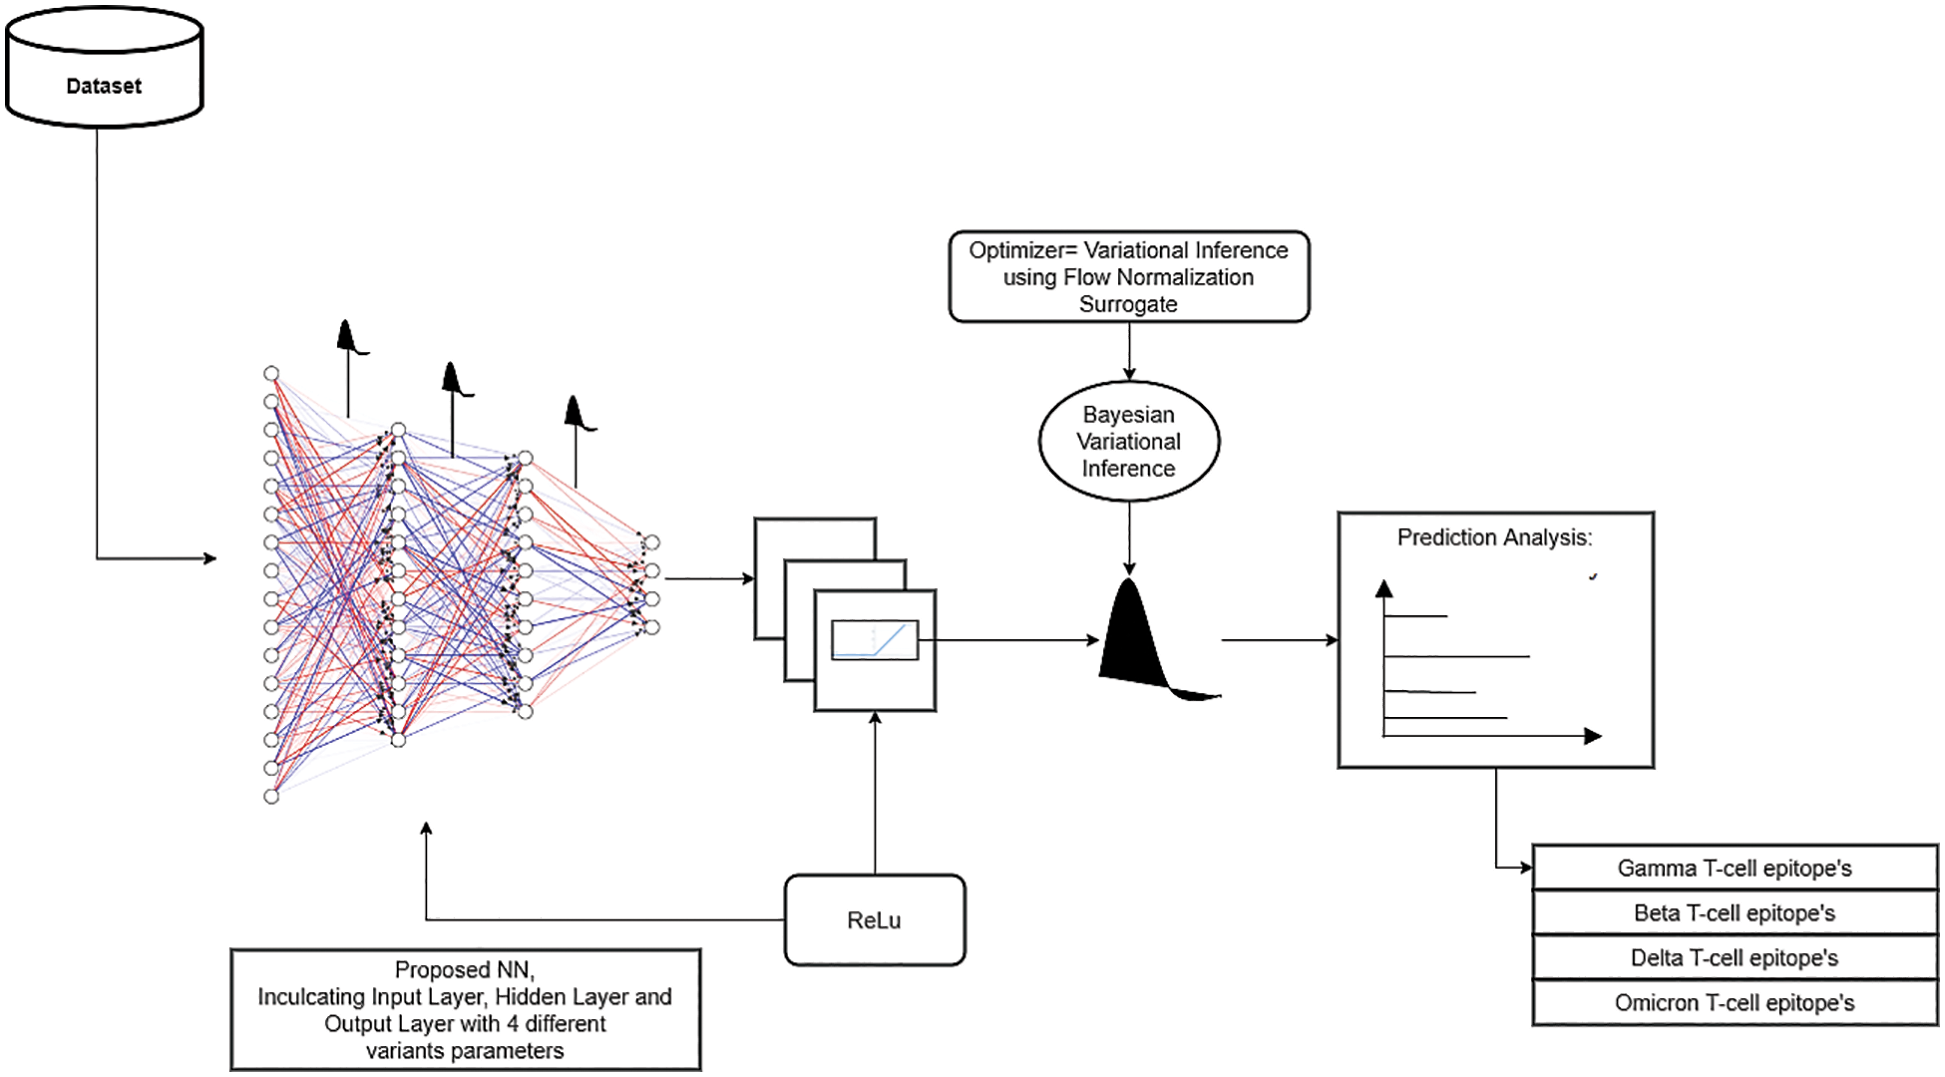
Figure 2: Detailed structure of self-proposed Bayesian neural network
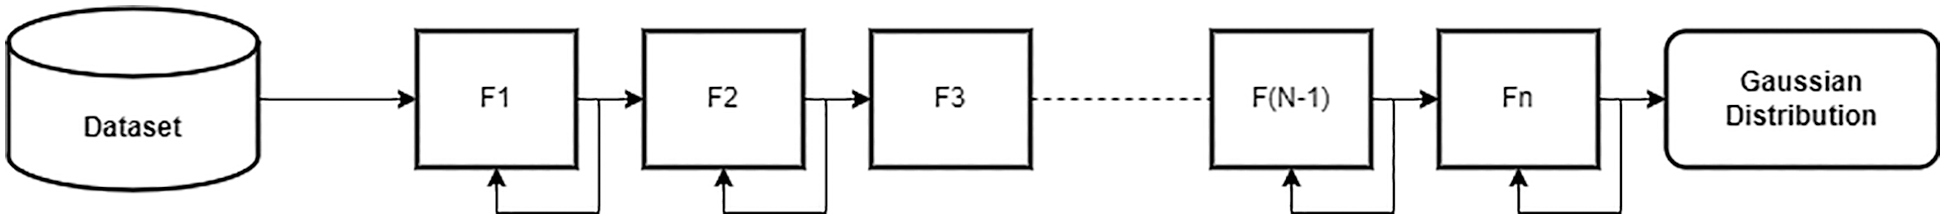
Figure 3: Basic variational inference model using normalization flow
In this study, the surrogate is built using normalization flow. Normalization flow helps to build custom probability distributions. This is different from the Bijector-based surrogate, in which a new Bijector (also known as Inverse Autoregressive flows (IAF)) transformation has to be established and have been implemented in [30–34]. IAFs are normalizing flows that employ neural networks to capture complicated, nonlinear dependencies between distribution components. We utilized variational inference to fit a straightforward model, linear regression with intercept and slope, to data with and without a normalizing flows-based surrogate density. To check whether VI with Normalization Flows give many results on a given dataset of 4 different variants of COVID-19 against T-cell Epitopes, analysis is made in Results Section.
3.2.2 Hidden Markov Structure Implementation
The model of HMM is prepared using PyTorch Libraries, inculcating forward and backward propagation techniques for minimizing the total probability difference with respect to actual figures. Prediction analysis was carried out on a P100 Graphic Processing Unit (GPU). The GPU had a frequency of 1190 MHz with a memory unit of 715 MHz. Being a dual-slot card, the NVIDIA Tesla P100 PCIe 16 GB drew power from a 1x 8-pin power connector, with a power draw rated at 250 W maximum.
The HMM architecture depicting the emission probabilities is shown in Fig. 4. Emission probabilities depict how likely any COVID variant will act against the T-cell epitopes of vaccinated or unvaccinated samples, e.g., state-1 represents the Gamma variant. It depicts how the gamma variant will affect the T-cell epitopes in an unvaccinated sample. State-1 to State-4 show the future state prediction analysis via Emission probabilities, respectively. These states describe the T-cell epitope response on the Gamma variant in three categories, i.e., M1 (affected epitopes), M2 (strong epitopes), and M3 (over-activated Epitopes) due to the effect of the Covid-19 Variant. The design approach for HMM is described as shown in Fig. 5.
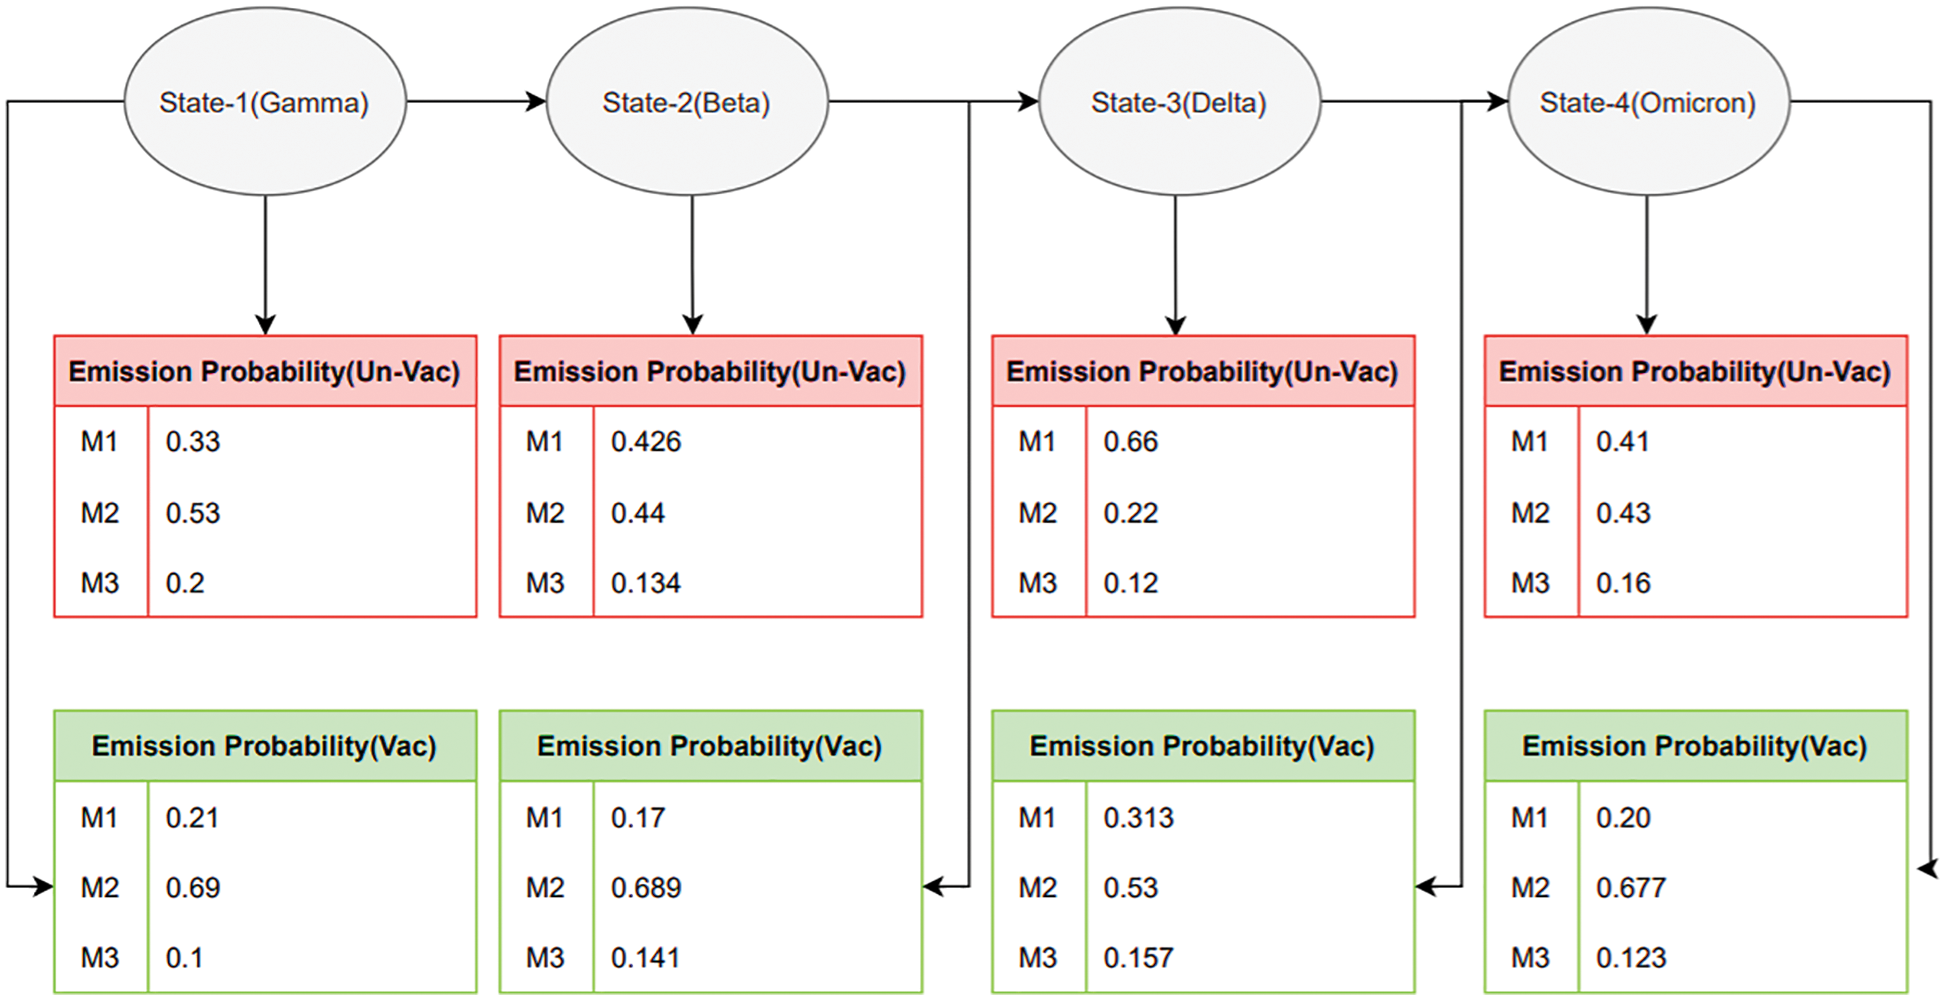
Figure 4: Emission matrix analysis for vaccinated and unvaccinated groups
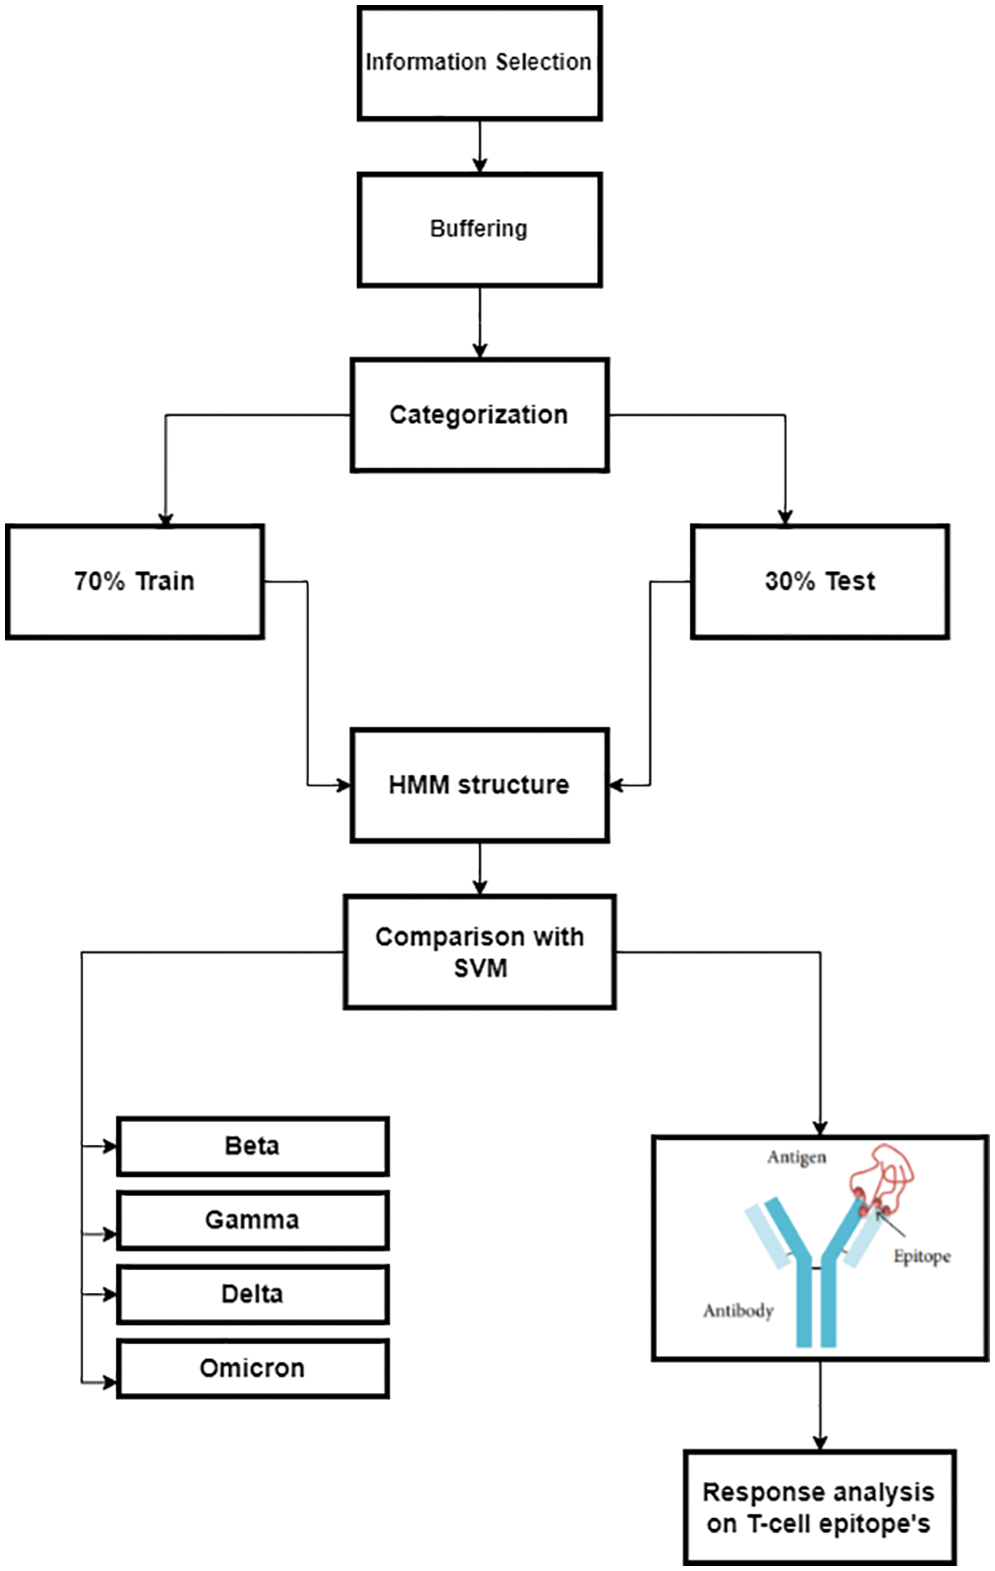
Figure 5: Detailed design approach for predicting COVID variants’ response to a T-cell epitope
4.1 Self-Proposed Bayesian Neural Network
The training performance of the model was evaluated with different parameters. The parameters inscribed prediction analysis, mean losses, median losses, IAF surrogate losses, and Prediction density prediction with respect to intercept.
Firstly, prediction analysis of the response of T-cell epitope with respect to different variants was observed after rigorous training in the case of unvaccinated people. The overall analysis predicted that the Delta variant was more impairing towards T-cell epitope with respect to the Omicron variant, as shown in Table 2. Furthermore, graphical analyses of results are shown in Fig. 6.
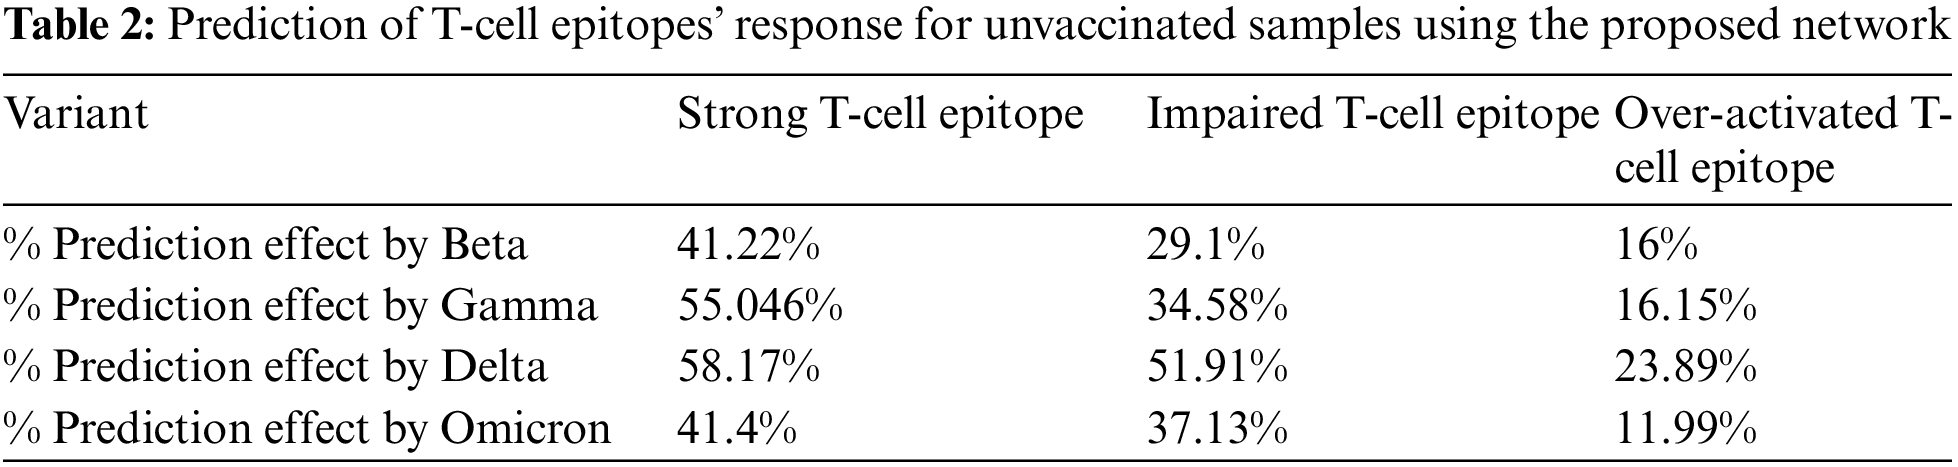
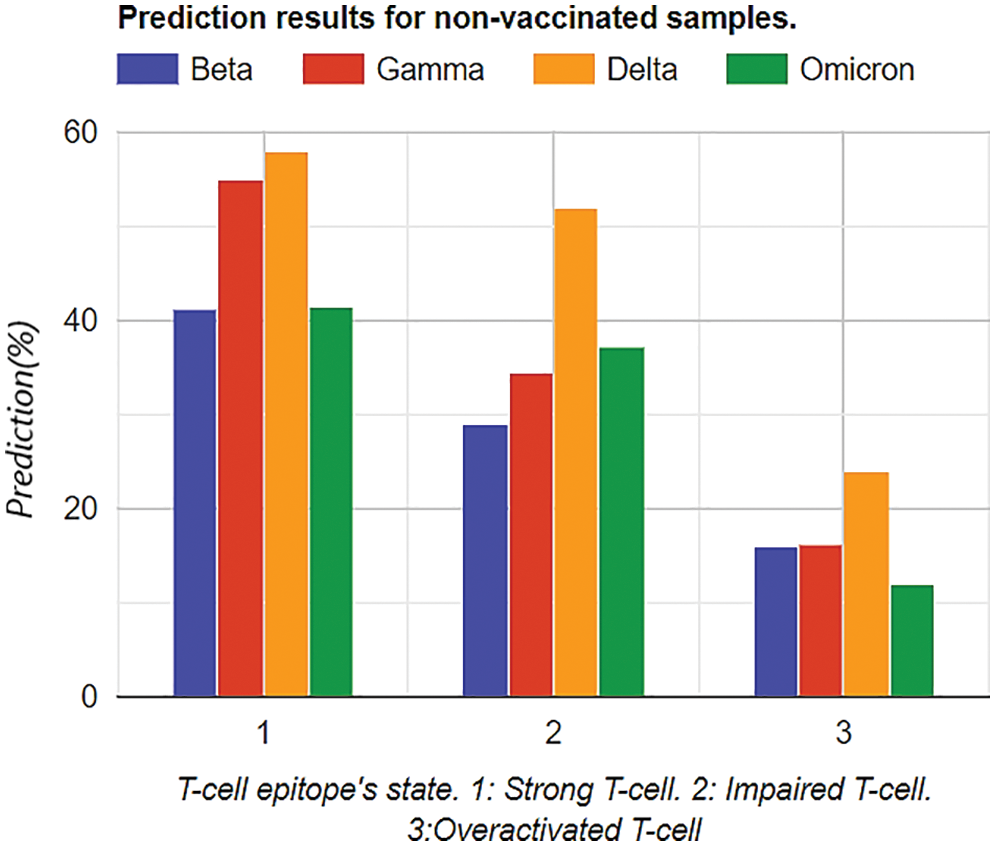
Figure 6: Graphical analysis of prediction results for vaccinated samples
Moreover, similar training was performed on the vaccinated group. The results depicted that the Omicron was less affected by the T-Cell epitope, which shows that the T-cell is attacking or protecting the body from the Omicron variant, as shown in Table 3. Furthermore, graphical analyses of results are shown in Fig. 7.
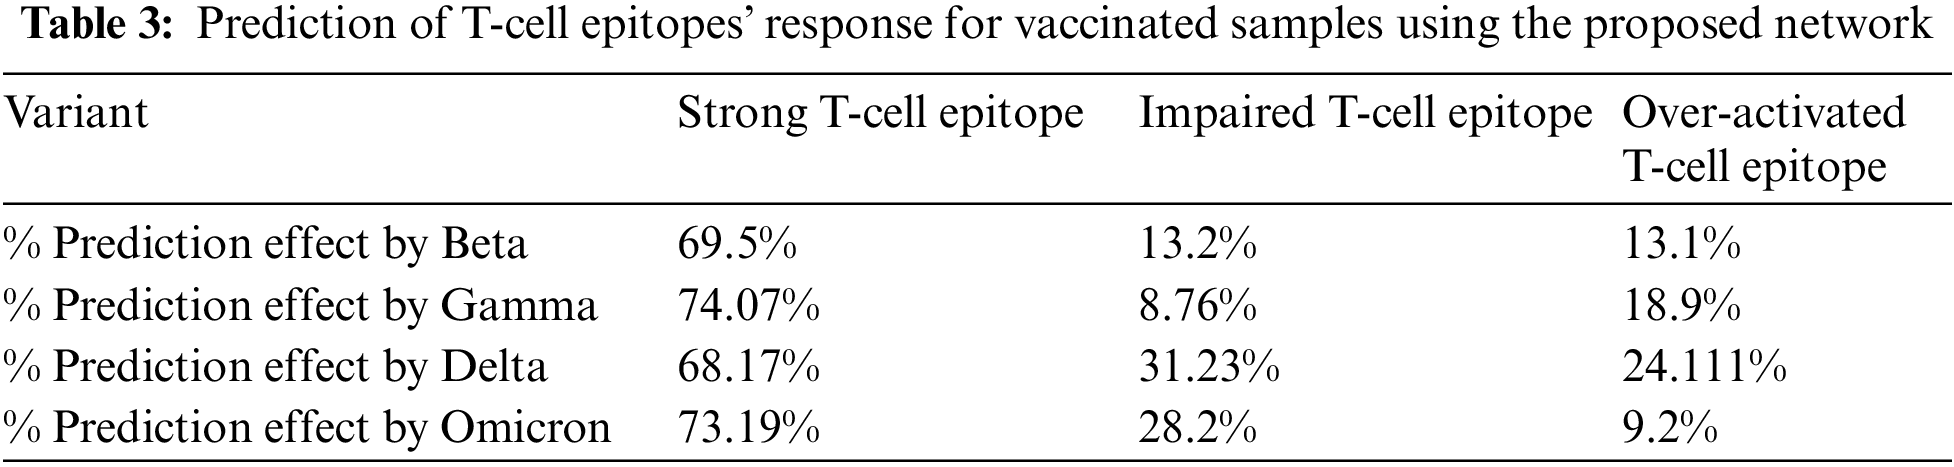
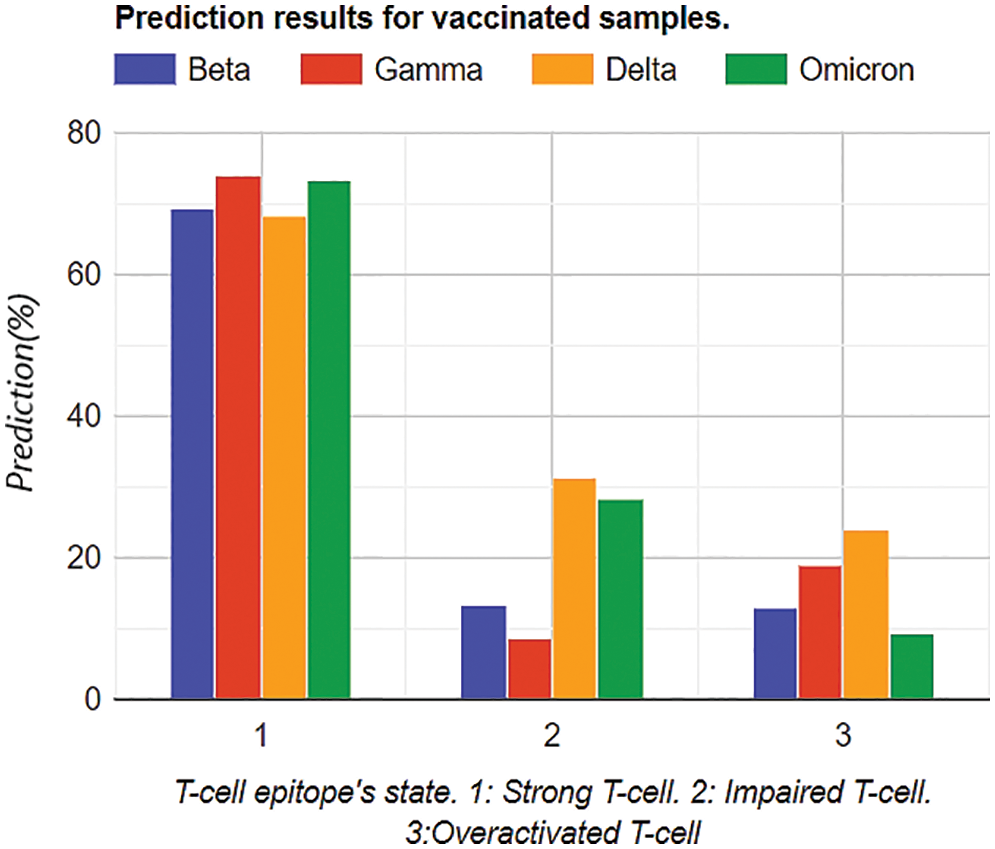
Figure 7: Graphical analysis of prediction results for unvaccinated samples
While comparing Tables 2 and 3 for Bayesian Neural Network, the vaccine effect on T-cell epitopes is the most notable, even in the presence of different variants. For example, in the unvaccinated group, the most dominating and affected variant on T-cell epitopes is the Delta variant (effect predictability due to previous states = 51.91%), followed by Omicron that is 37.33% as second dominant, Gamma 29.1% as third dominant, and Gamma, at last, resulting as 34.58%. Moreover, over-activated T-cell epitopes also result in an overactive immune response (symptoms are Fatigue, Joint Pain, and Recurring fevers), which can also be the downside that variants affect. On the other hand, in the vaccinated group Delta variant is still the most dominating, but the rate of effect is at 31.23%. Similarly, Omicron is observed as a low-effecting variant on T-cell epitopes for over-activation.
The holistic scope of this study is towards an in-depth comparison of HMM and a self-proposed model in terms of accuracy and computational power (will be discussed in an upcoming section). However, the accuracy of state-of-the-art HMM and Bayesian models is near and reasonable. However, to cross-verify the proper working and methodology of the Self-proposed Bayesian Model, further analyses are performed in further sections for satisfactory cross-validating results.
4.1.2 Model Fitting Analysis of Bayesian Neural Network
To assess convergence, the progress of the model fitting process was followed. These optimizations can be observed under loss functions in the fitting process. The mean squared error (MSE) loss function has been used. The loss plots of the IAF surrogate in Fig. 8 show mean and median negative estimations. Each graph is modelled at 6 data points, calling six samples in code. Minimization in losses appears after 37,889 iterations, and the model resulted in less noisy. However, the noise still appeared.
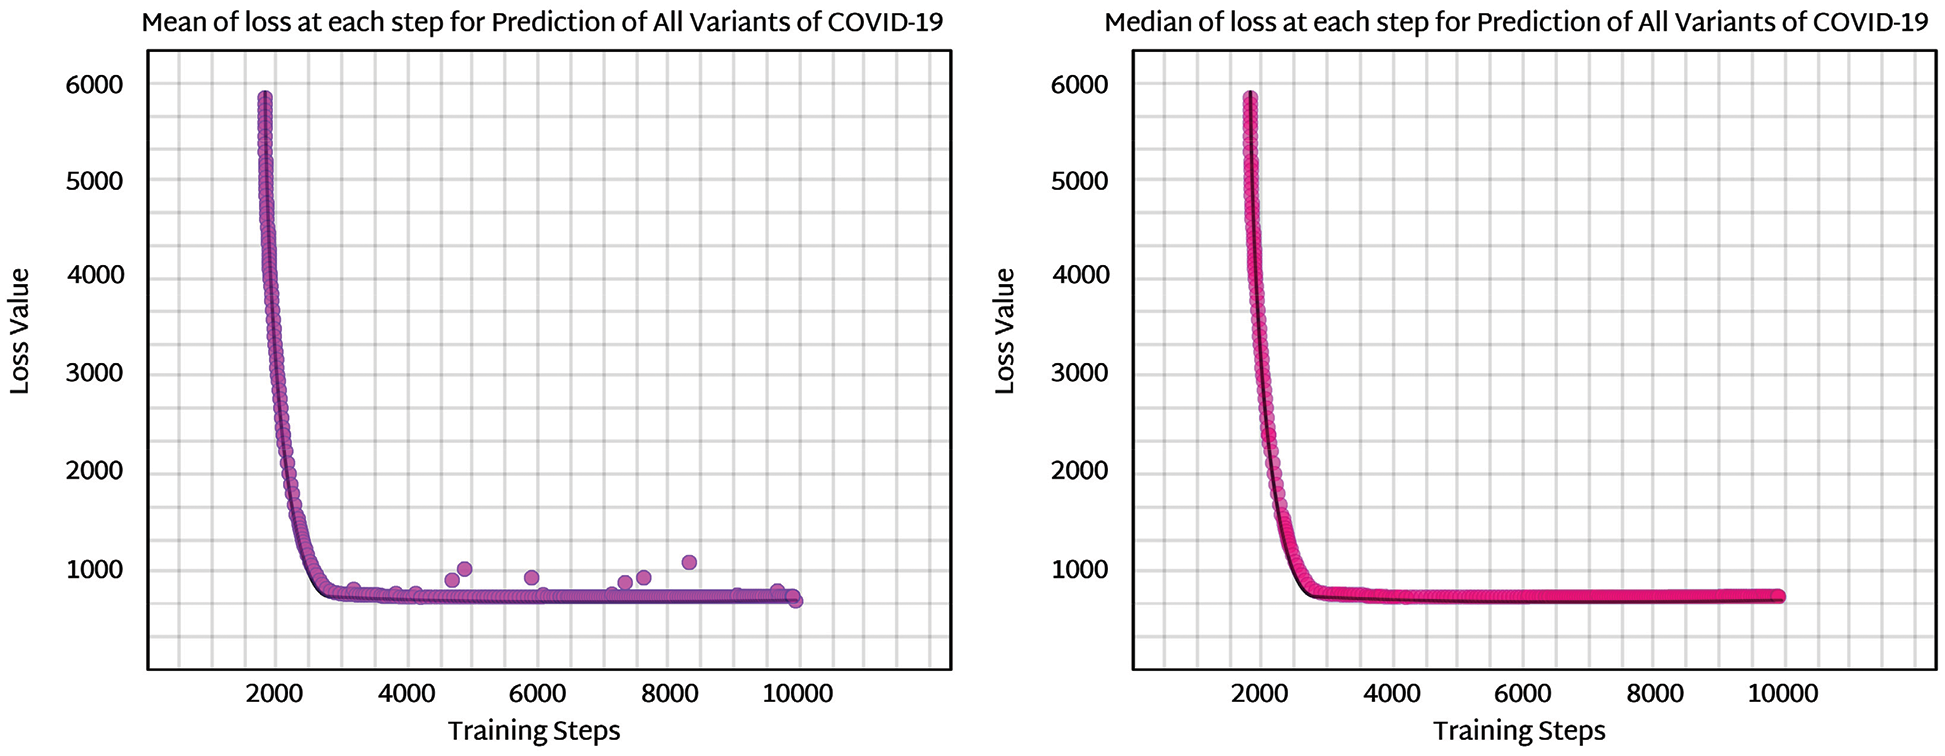
Figure 8: Mean and median loss analysis for prediction analysis using IAF surrogate in Bayesian neural
The evidence lower bound (ELBO, also known as the variational lower bound) is a lower bound on the likelihood of seeing some data in a given model. It is an important parameter to be observed and gives direction about how well surrogate density performs for a specific prediction model, for example, prediction analysis of variants with respect to t-cell epitopes in our study.
The sample size is enhanced and then observed for better convergence of the model. The ELBO for this model is predicted to be ELBO = −661.4, and given the comparison with earlier loss numbers, it appears plausible that the ELBO should be slightly less. However, the difference is minor and arguably negligible. Even though the noise parameter is enhanced by increasing the sample size to 30, the ELBO value is only slightly enhanced. The drawback of noise is that it can disturb the stability of the whole case, as shown in Fig. 9. Noise analysis is vital because the dataset used in this research is imbalanced. For noise detection in a Bayesian neural network, surrogate losses help to identify the amount of noise produced via an imbalanced dataset. In this study, variational inference using a flow normalization surrogate helped reduce network noise. ELBO values, as discussed before, help to tune noise parameters. The noise density for the proposed model came out to be approximately 670 decibels A (dBA) which is optimal with respect to the threshold level (that is 1000 ideally).
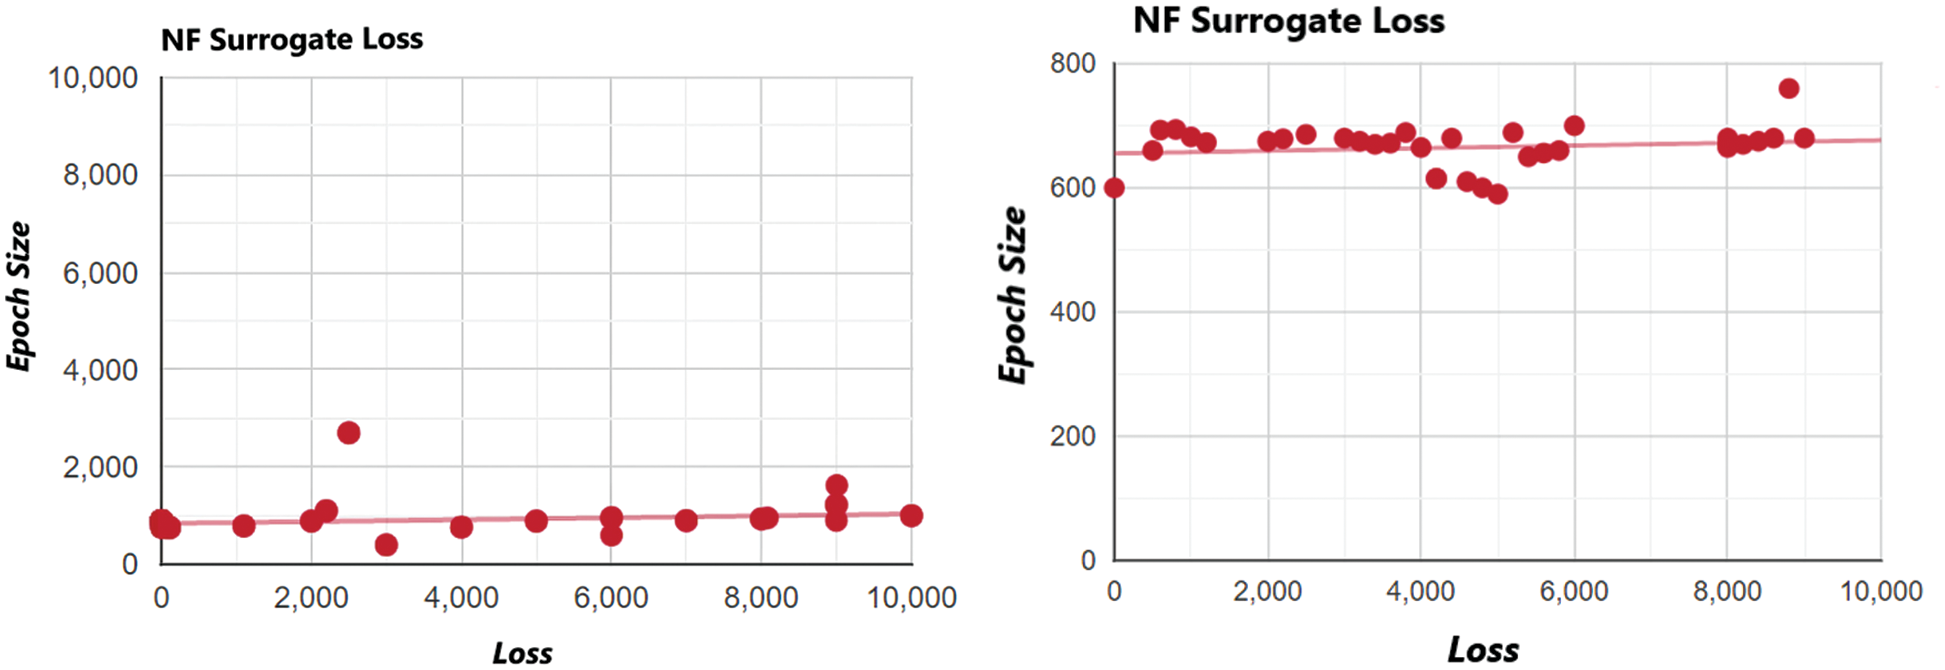
Figure 9: Noise and destabilization analysis of normalization flow NF (IAF) surrogate at increased sample points
4.1.3 Cross Validation with Markov Chain Monte Carlo (MCMC) Method
After the abovementioned analysis, a question arises whether flow normalization performs better in Variational Inference. Because the ELBO value was not much differentiating at different sample points, this density comparison for all variants of COVID-19 prediction was estimated for the model against the T-Cell epitopes dataset. We compare density estimates from the VI IAF model with those from Just Another Gibbs Sampler (JAGS) to see if normalizing flows have helped with our current modelling difficulty (which uses MCMC). As it does not use any surrogate density, the Markov chain Monte Carlo sampling becomes the preferred approach here, as shown in Fig. 8. The first step in applying a Monte Carlo simulation was to determine the transfer equation. Then we had to define the distribution and parameters of each input used in the transfer equation. The last step involves analyzing the simulation output and comparing the input variables for the required probabilistic output. The comparison in Fig. 10 is carried out for two variables, i.e., MCMC and flow normalization with respect to density variations [35]. Intercept is the threshold point where values of density variations cross the threshold level, and the density variations are the difference in the probabilistic outputs.
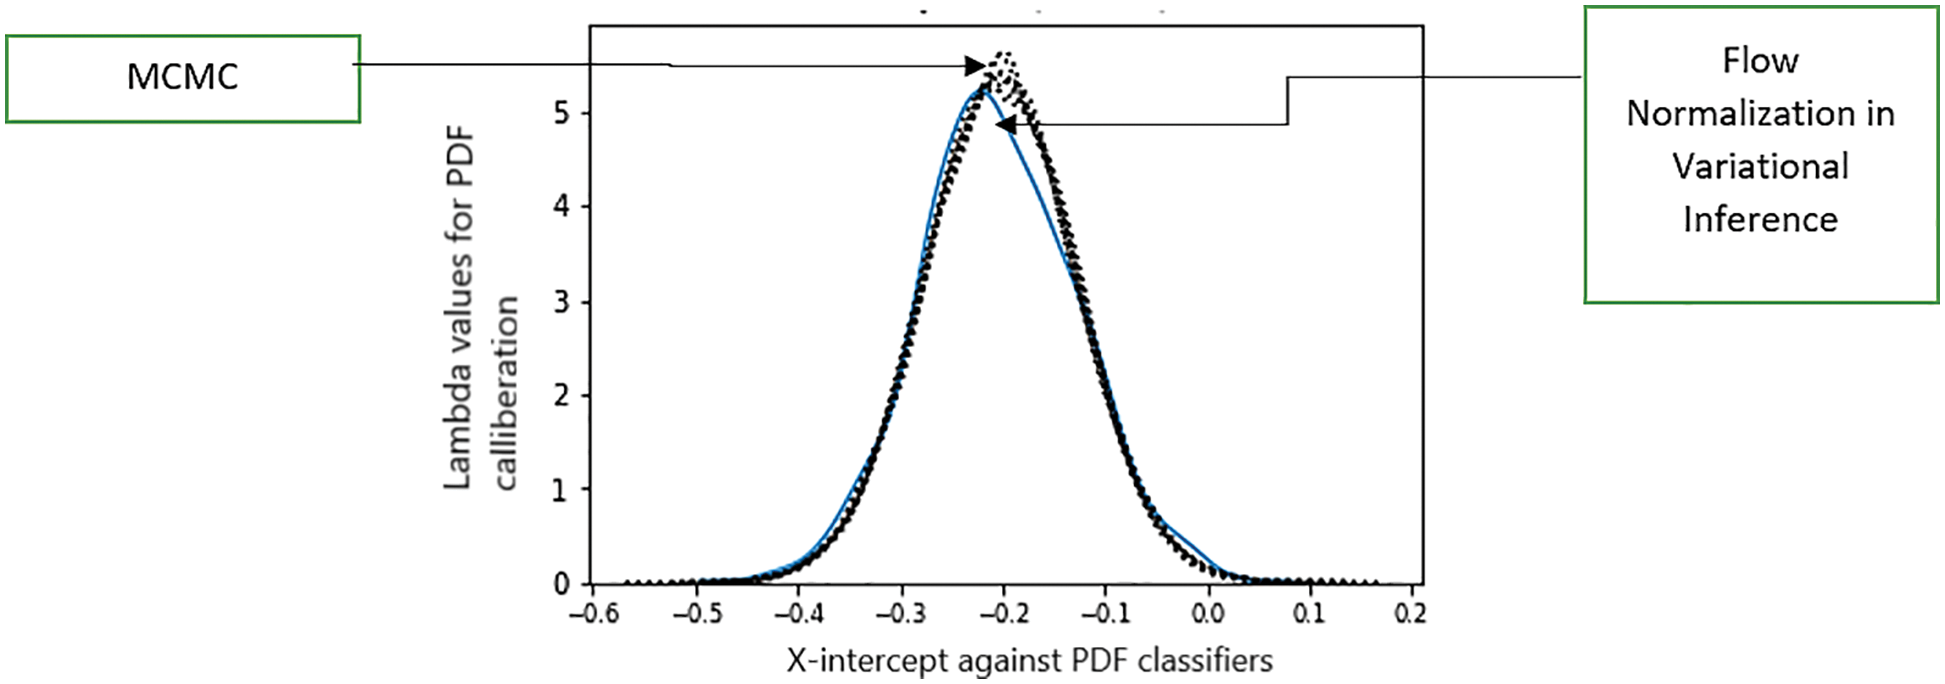
Figure 10: Comparison analysis of flow normalization surrogate with respect to the Markov standardized model. The X-axis represents the intercept, and Y-axis shows density measurements
Fig. 10 shows that the normalizing flows model is significantly closer to MCMC findings than either of the Gaussian surrogates, and IAF is nearly equal to MCMC for the intercept. The holistic limitation of this whole model is that although additional diagnostic checks are required, it is still a very effective strategy for many problems.
The training performances of the model were evaluated with different parameters. The parameters inscribed prediction analysis, comparison analysis with SVM and processing analysis.
Firstly, prediction analysis of the response of T-cell epitope with respect to different variants was observed after rigorous training in the case of unvaccinated people. The overall results analysis predicted that the Delta variant was more impairing towards T-cell epitope with respect to the Omicron variant can be shown in Table 4. Graphical analysis is depicted in Fig. 11.
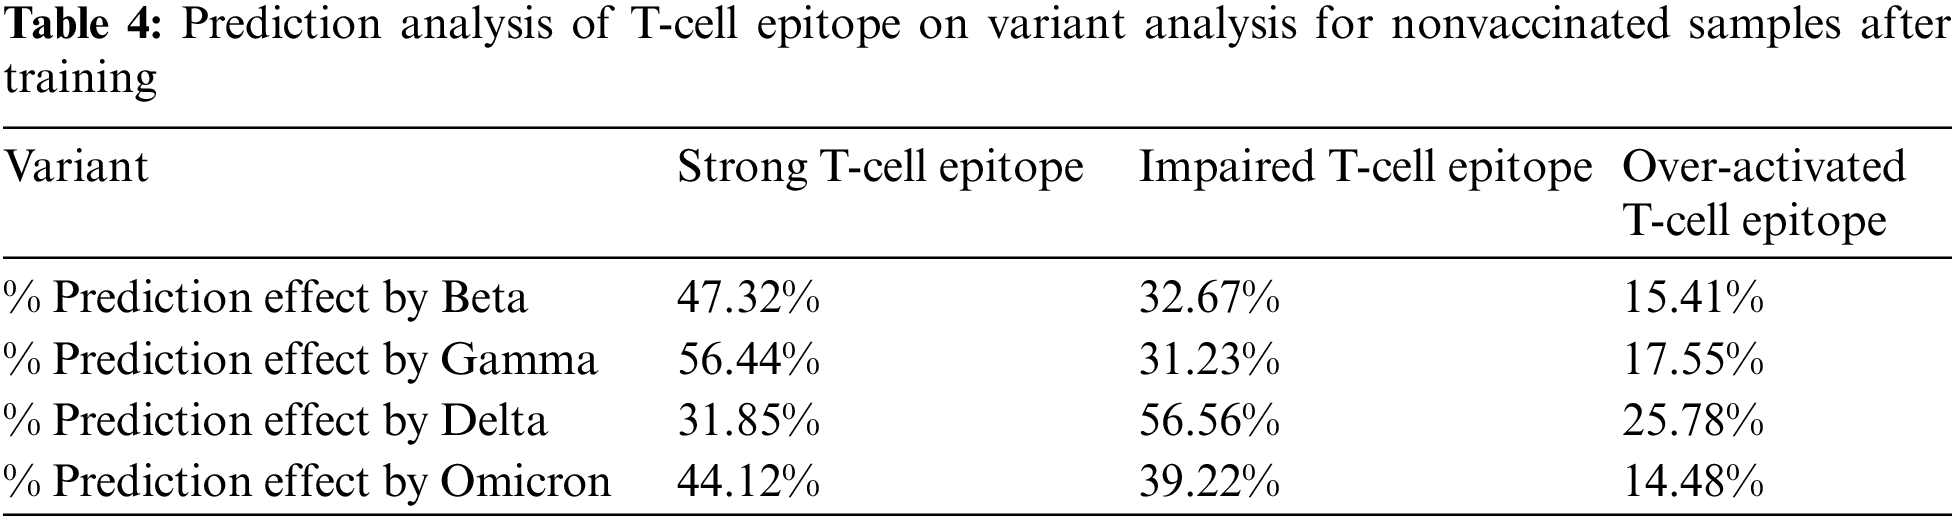
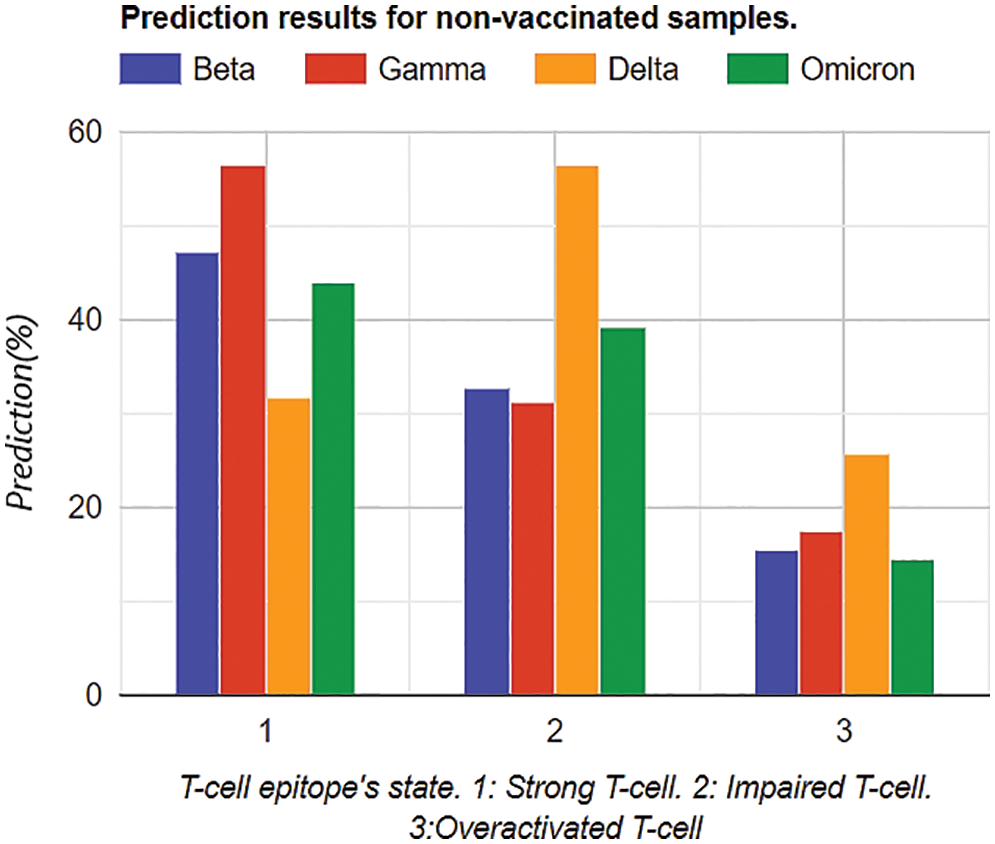
Figure 11: Graphical analysis of prediction results for unvaccinated samples
Similarly, the same training methodology was implemented on the vaccinated group, and the results depicted that Omicron was less affected by the T-Cell epitopes. This portrays that T-cells might be protecting the body from the Omicron variant, as shown in Table 5. Graphical analysis is illustrated in Fig. 12.
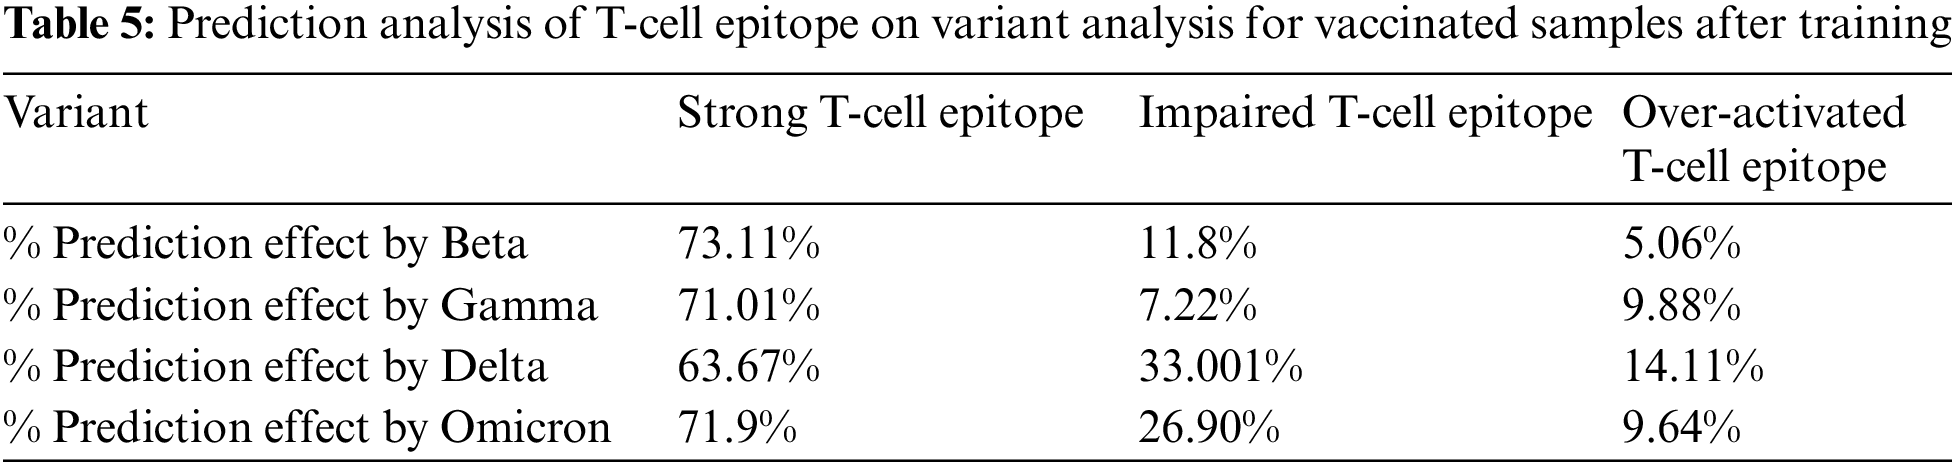
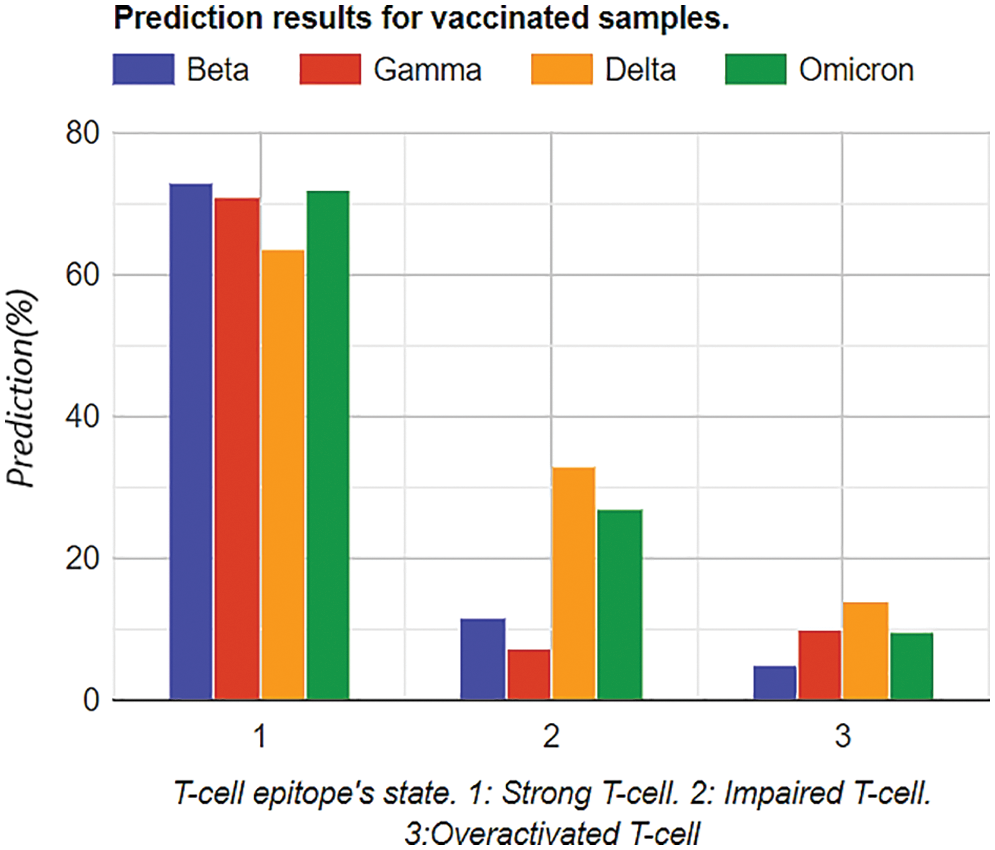
Figure 12: Graphical analysis of prediction results for vaccinated samples
In Tables 4 and 5, the most notable thing is the vaccine effect on T-cell epitope’s even in the presence of different variants. For example, in the unvaccinated group, the most dominating and affected variant on T-cell epitopes is the Delta variant (effect predictability due to previous states = 56.56%), followed by Omicron is 39.33% as the second dominant, Beta 32.67% as third dominant, and Gamma, at last, resulting as 31.23%. Moreover, over-activated T-cell epitopes also result in an overactive immune response (symptoms are Fatigue, Joint Pain, and Recurring fevers), which can also be the downside that variants affect. On the other hand, in the vaccinated group Delta variant is still the most dominating, but the rate of effect is at 33.001%. Similarly, Omicron is observed as a low-effecting variant on T-cell epitopes for over-activation.
4.2.2 Cross-Validation of HMM with SVM
SVM categorizes data points even when they are not linearly separable by mapping the data to a high-dimensional feature space. The data are changed to enable the hyper plane representation of the separator once a separator between the categories has been found. Therefore, cross-validation with SVM was carried out to cross-check HMM on this dataset, and the results were considerable, as shown in Fig. 13. Trend shows that HMM outperformed SVM at the 36th bulk epoch size. A support vector machine is a validation factor because it helps map high dimensional points at dataset imbalance [36].
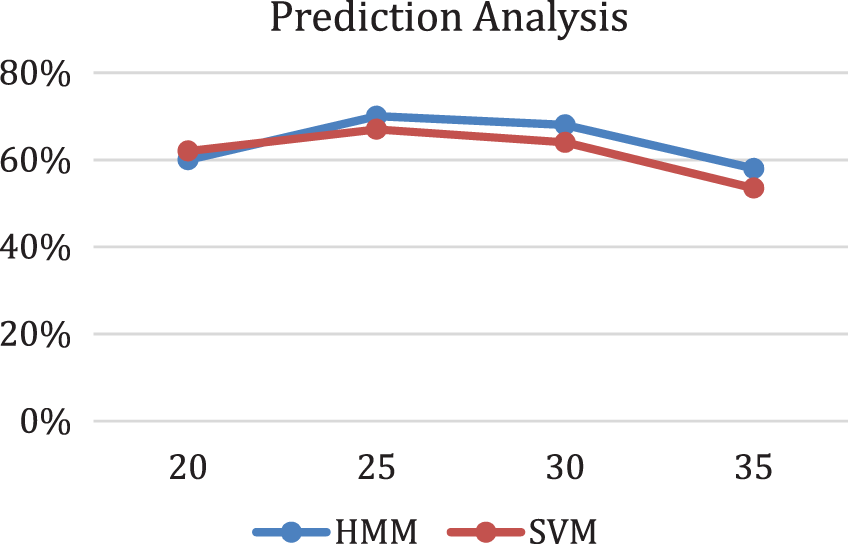
Figure 13: Prediction analysis with respect to HMM and SVM
4.3 Comparison of Self-Proposed Bayesian Neural Network and HMM
The comparison analysis was carried out as given in Table 6. After in-depth comparison analysis, it was noted that Delta variants most affected vaccinated and unvaccinated groups in all three categories: strong T-cell epitope, impaired, and over-activated. Furthermore, Omicron was the second variant to affect the unvaccinated group. Moreover, Gamma and beta variant stats were more or less severely affecting the unvaccinated group but mildly affecting the vaccinated group.
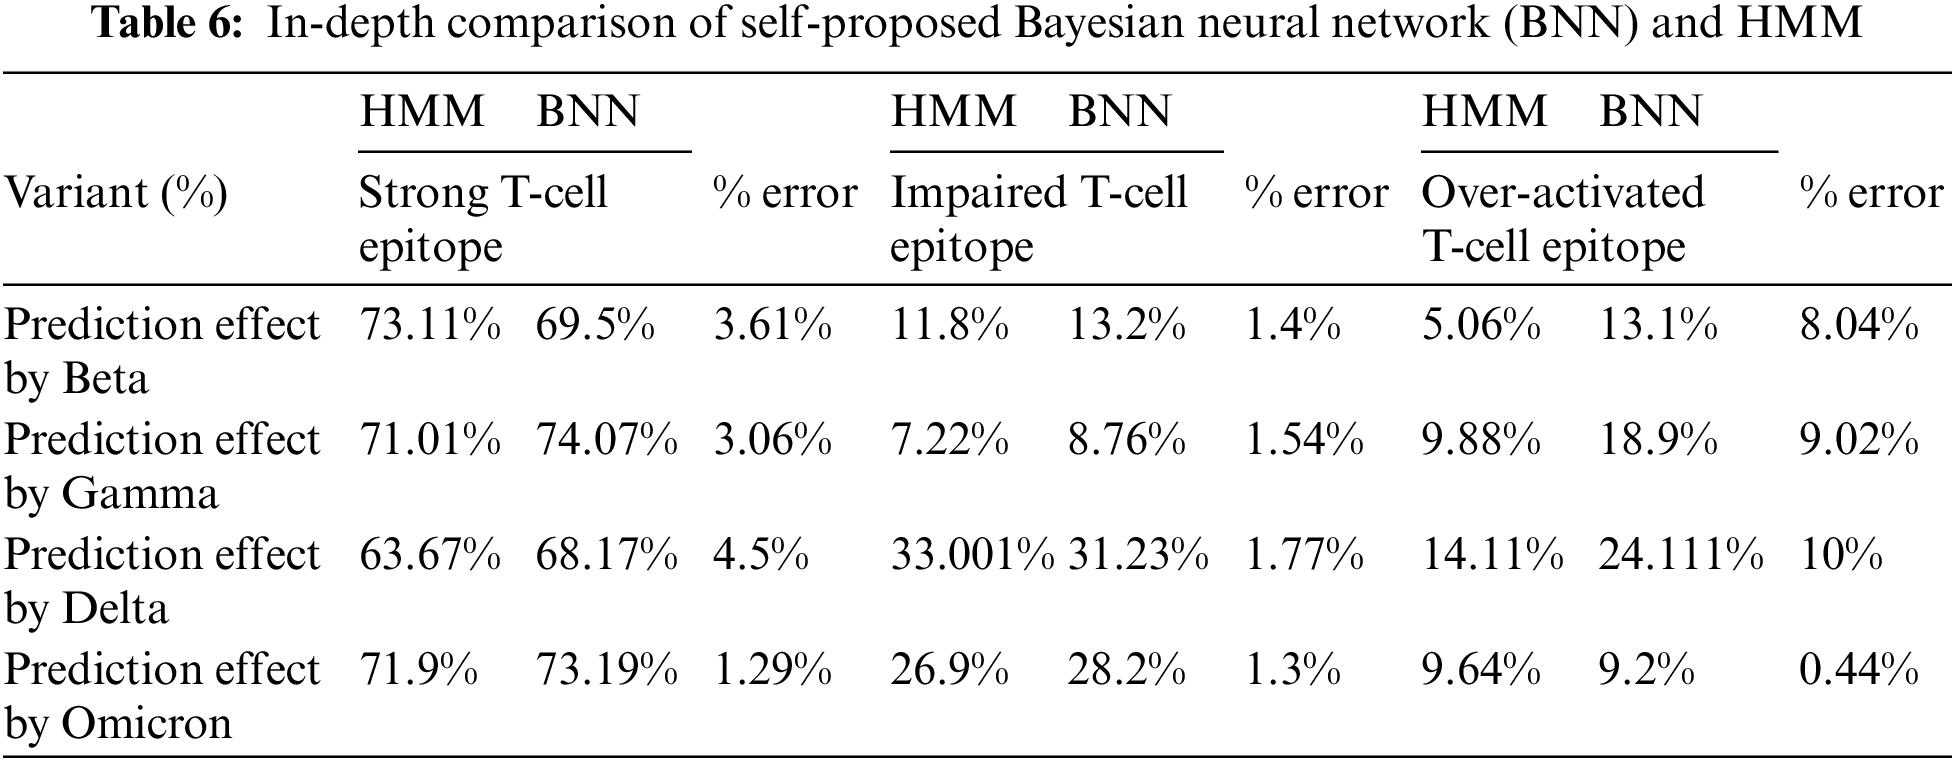
Comparison analysis was conducted to determine whether the proposed Bayesian neural network is in proper directives. So, by comparing the values with the state-of-the-art Hidden Markov model, the % error was relatively less in string and impaired the T-Cell epitope’s analysis. Furthermore, the edge of the self-proposed Bayesian Neural network on the Hidden Markov model was that no data cleaning was required. On the other hand, data cleaning was required in the Hidden Markov model for accuracy. Moreover, the processing time of Self proposed model was less than the Hidden Markov model and other Bayesian Neural Networks already on the market. Similarly, cross-check optimizations were performed for the Bayesian Neural network, and cross-check validation was performed with the state-of-the-art Monte Carlo method. It was observed that the Bayesian Neural network performed exceptionally well. The graphical trend is shown in Fig. 14.
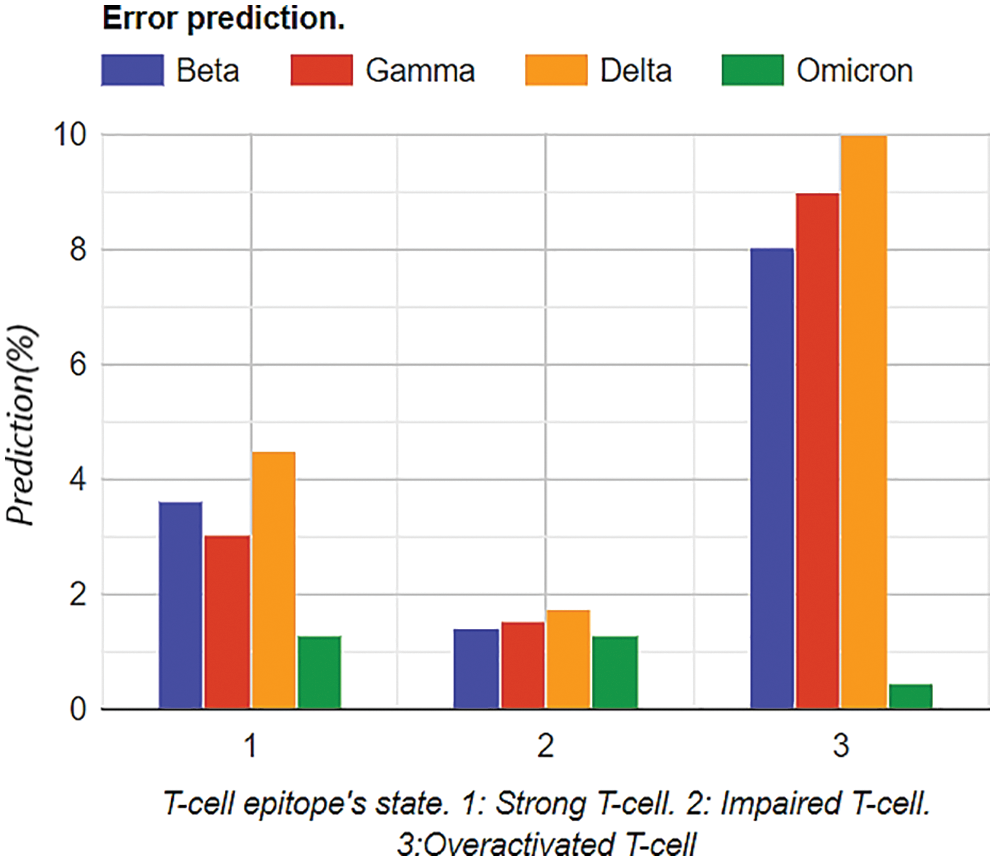
Figure 14: Graphical analysis of prediction results for vaccinated samples
4.4 Training Loss and Computational Performance Analysis
Training losses were computed before model optimization and after model optimization. Training Losses were computed, and 10,000 numbers of training steps were performed. After optimization of the Bayesian model, training losses were significantly reduced, as shown in Fig. 15. Optimization analysis was performed using variational inference, as mentioned in previous sections. The learning rate was set to 0.0001, the number of epochs was kept at 10000, and the dataset split was 70:30.
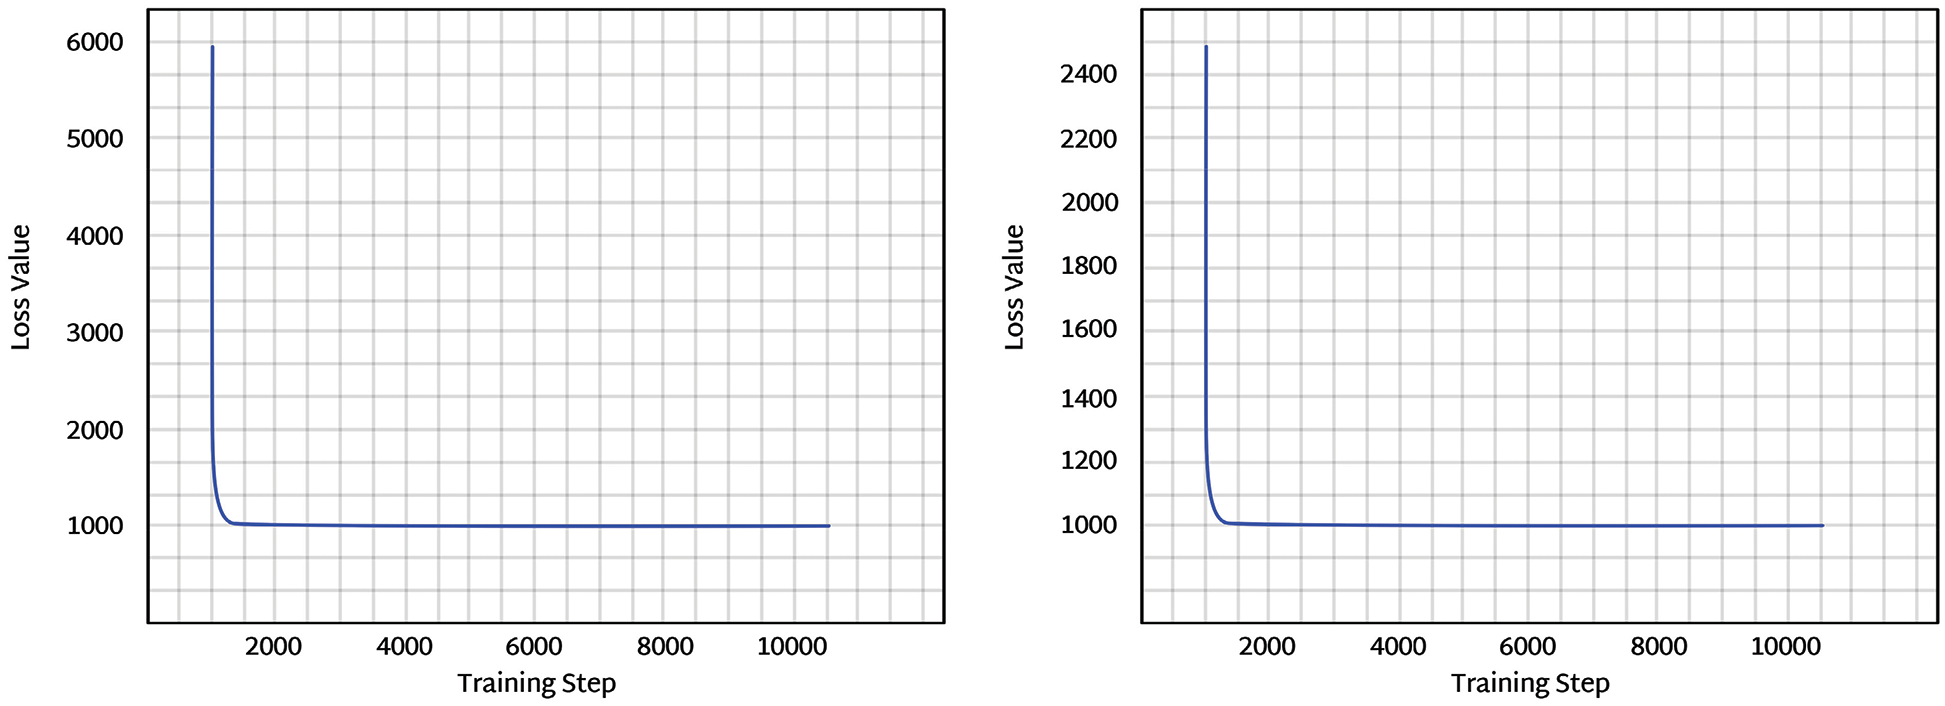
Figure 15: The left figure represents the training loss before optimization, and the right figure represents the training loss after optimization
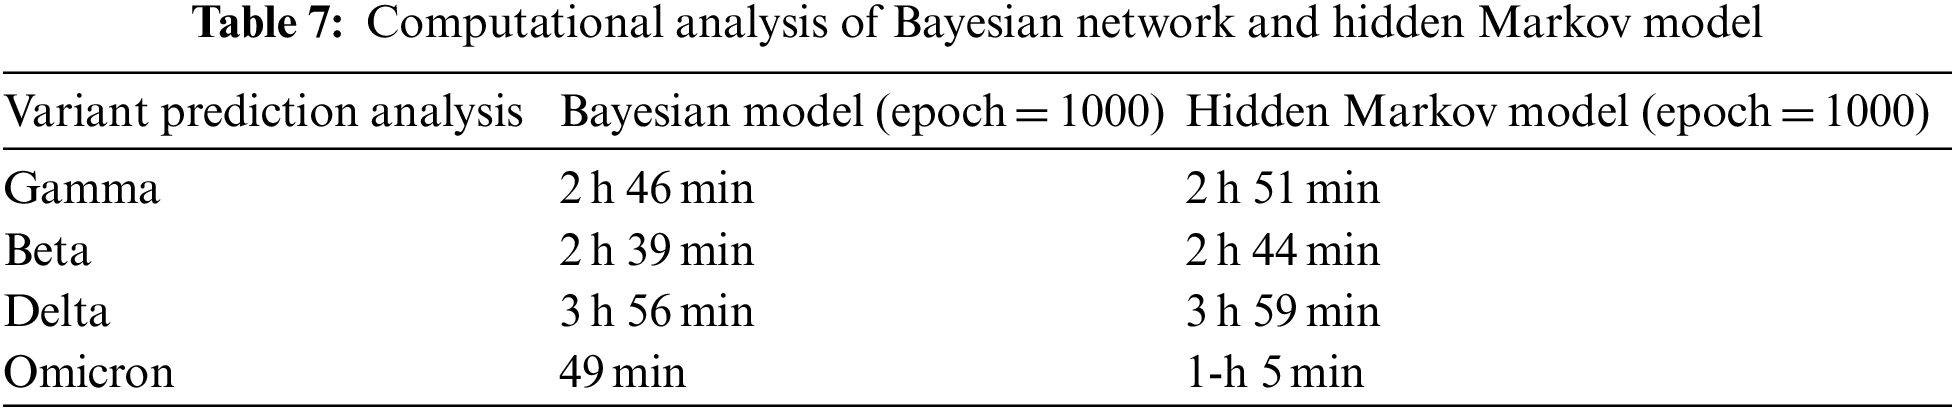
Average Processing time and computational cost at different states were observed in Table 7. Furthermore, model complexity can be described in two categories: expressive capacity and model complexity. So, during training and time analysis, the HMM against computational resources gave considerable outputs and results in model framework, data complexity, model complexity, and optimization processing. According to the dataset, the overall computation analysis shows that the proposed Bayesian network was slightly lighter than the Hidden Markov model under rigorous training, as shown in Table 7.
This paper presents a self-proposed Bayesian neural network with variational inference and normalization flow for the prediction analysis of T-cell epitopes’ response against four Covid variants, i.e., Beta, Delta, Gamma, and Omicron response for vaccinated and unvaccinated samples. The dataset was divided into two categories: vaccinated and unvaccinated. The least affected variant in the unvaccinated group predicted through a self-proposed Bayesian neural network was the Beta variant of Covid-19, standing at 29.1% among the impaired group. Furthermore, the least affected variant in the vaccinated group was the Gamma variant. A comparison analysis was made with Hidden Markov Model to validate results further. The results were similar to the self-proposed model. However, the additional advantage of our self-proposed network included reduced computational complexity compared to the standard Hidden Markov model. Furthermore, it was predicted that under the unvaccinated category delta variant was creating the most impaired T-cell epitopes with a ratio of more than 50%. On the other hand, in the vaccinated category, this percentage was considerably reduced in all variants, especially the delta variant. For future work, the proposed algorithm can be deployed on real time devices, and the network can also be trained in a distributed manner by exploiting federated learning techniques. In clinical practices, such algorithms on real time devices can help predict the impacts of COVID-19 variants on vaccinated and unvaccinated people.
Acknowledgement: Authors extend their appreciation to the Deanship of Scientific Research at Imam Mohammad Ibn Saud Islamic University for funding this work through Research Group No. RG-21-07-05.
Funding Statement: This paper is funded by the Deanship of Scientific Research at Imam Mohammad Ibn Saud Islamic University Research Group No. RG-21-07-05.
Conflicts of Interest: The authors declare that they have no conflicts of interest to report regarding the present study.
References
1. M. Umair, M. S. Khan, F. Ahmed, F. Baothman, F. Alqahtani et al., “Detection of COVID-19 using transfer learning and Grad-CAM visualization on indigenously collected X-ray dataset,” Sensors, vol. 21, no. 17, pp. 5813, 2021. [Google Scholar] [PubMed]
2. M. S. Khan, M. O. Tariq, M. Nawaz and J. Ahmed, “MEMS sensors for diagnostics and treatment in the fight against COVID-19 and other pandemics,” IEEE Access, vol. 9, pp. 61123–61149, 2021. [Google Scholar]
3. S. Nasreen, H. Chung, S. He, K. A. Brown, J. B. Gubbay et al., “Effectiveness of mRNA and ChAdOx1 COVID-19 vaccines against symptomatic SARS-CoV-2 infection and severe outcomes with variants of concern in Ontario,” Nature Microbiology, vol. 7, pp. 379–385, 2022. https://doi.org/10.1038/s41564-021-01053-0 [Google Scholar] [PubMed] [CrossRef]
4. X. He, C. He, W. Hong, K. Zhang and X. Wei, “The challenges of COVID-19 delta variant: Prevention and vaccine development,” MedComm., vol. 2, no. 4, pp. 846–854, 2021. [Google Scholar] [PubMed]
5. N. Andrews, J. Stowe, F. Kirsebom, S. Toffa, T. Rickeard et al., “Effectiveness of COVID-19 vaccines against the Omicron (B.1.1.529) variant of concern,” New England Journal of Medicine, vol. 386, no. 16, pp. 1532–1546, 2022. [Google Scholar] [PubMed]
6. A. Bani-Hani, A. Lavorel and N. Bessadet, “Data-fusion for epidemiological analysis of COVID-19 variants in UAE,” Computers, Materials & Continua, vol. 68, no. 3, pp. 3895–3913, 2021. [Google Scholar]
7. C. del Rio, S. B. Omer and P. N. Malani, “Winter of Omicron—The evolving COVID-19 pandemic,” JAMA, vol. 327, no. 4, pp. 319–320, 2021. [Google Scholar]
8. L. Liu, S. Iketani, Y. Guo, J. F. W. Chan, M. Wang et al., “Striking antibody evasion manifested by the Omicron variant of SARS-CoV-2,” Nature, vol. 602, pp. 676–681, 2022. https://doi.org/10.1038/s41586-021-04388-0 [Google Scholar] [PubMed] [CrossRef]
9. A. Tarke, J. Sidney, C. K. Kidd, J. M. Dan, S. I. Ramirez et al., “Comprehensive analysis of T cell immunodominance and immunoprevalence of SARS-CoV-2 epitopes in COVID-19 cases,” Cell Reports Medicine, vol. 2, no. 2, 2021. https://doi.org/10.1016/j.xcrm.2021.100204 [Google Scholar] [PubMed] [CrossRef]
10. A. A. Quadeer, S. F. Ahmed and M. R. McKay, “Landscape of epitopes targeted by T cells in 852 individuals recovered from COVID-19: Meta-analysis, immunoprevalence, and web platform,” Cell Reports Medicine, vol. 2, no. 6, 2021. https://doi.org/10.1016/j.xcrm.2021.100312 [Google Scholar] [PubMed] [CrossRef]
11. S. K. Saini, D. S. Hersby, T. Tamhane, H. R. Povlsen, S. P. A. Hernandez et al., “SARS-CoV-2 genome-wide T cell epitope mapping reveals immunodominance and substantial CD8+ T cell activation in COVID-19 patients,” Science Immunology, vol. 6, no. 58, 2021. https://doi.org/10.1126/sciimmunol.abf7550 [Google Scholar] [PubMed] [CrossRef]
12. A. Tarke, J. Sidney, N. Methot, E. D. Yu and Y. Zhang et al., “Impact of SARS-CoV-2 variants on the total CD4+ and CD8+ T cell reactivity in infected or vaccinated individuals,” Cell Reports Medicine, vol. 2, no. 7, 2021. https://doi.org/10.1016/j.xcrm.2021.100355 [Google Scholar] [PubMed] [CrossRef]
13. J. Y. Noh, H. W. Jeong, J. H. Kim and E. -C. Shin, “T Cell-oriented strategies for controlling the COVID-19 pandemic,” Nature Review Immunology, vol. 21, no. 11, pp. 687–688, 2021. [Google Scholar]
14. X. Zhang, L. Yao, M. Dong, Z. Liu, Y. Zhang et al., “Adversarial representation learning for robust patient-independent epileptic seizure detection,” IEEE Journal of Biomedical and Health Informatics, vol. 24, no. 10, pp. 2852–2859, 2020. [Google Scholar] [PubMed]
15. M. Hengstler, E. Enkel and S. Duelli, “Applied artificial intelligence and trust—The case of autonomous vehicles and medical assistance devices,” Technological Forecasting and Social Change, vol. 105, pp. 105–120, 2016. [Google Scholar]
16. A. Marfak, D. Achak, A. Azizi, C. Nejjari, K. Aboudi et al., “The hidden Markov chain modelling of the COVID-19 spreading using Moroccan dataset,” Data Brief, vol. 32, pp. 106067, 2020. [Google Scholar] [PubMed]
17. R. Yacef, M. Benghanem and A. Mellit, “Prediction of daily global solar irradiation data using Bayesian neural network: A comparative study,” Renewable Energy, vol. 48, pp. 146–154, 2012. [Google Scholar]
18. E. Semenova, D. P. Williams, A. M. Afzal and S. E. Lazic, “A Bayesian neural network for toxicity prediction,” Computational Toxicology, vol. 16, pp. 100133, 2020. https://doi.org/10.1016/j.comtox.2020.100133 [Google Scholar] [CrossRef]
19. J. Long, J. Jian and Y. Cai, “A Short-term climate prediction model based on a modular fuzzy neural network,” Adv. Atmospheric Sci., vol. 22, no. 3, pp. 428–435, 2005. [Google Scholar]
20. V. Popov, A. Ellis-Robinson and G. Humphris, “Modelling reassurances of clinicians with hidden Markov models,” BMC Medical Research Methodology, vol. 19, no. 1, pp. 11, 2019. [Google Scholar] [PubMed]
21. P. Hofmann and Z. Tashman, “Hidden markov models and their application for predicting failure events,” in The Int. Conf. on Computational Science–ICCS, London, UK, pp. 464–477, 2020. [Google Scholar]
22. J. Meier, A. Dietz, A. Boehm and T. Neumuth, “Predicting treatment process steps from events,” J. Biomed. Inform., vol. 53, pp. 308–319, 2015. https://doi.org/10.1016/j.jbi.2014.12.003 [Google Scholar] [PubMed] [CrossRef]
23. R. E. Watkins, S. Eagleson, B. Veenendaal, G. Wright and A. J. Plant, “Disease surveillance using a hidden Markov model,” BMC Medical Information and Decision Making, vol. 9, no. 1, pp. 39, 2009. [Google Scholar] [PubMed]
24. Y. Marchuk, R. Magrans, B. Sales, J. Montanya, J. Lopez-Aguilar et al., “Predicting patient-ventilator asynchronies with hidden Markov models,” Scientific Reports, vol. 8, no. 1, pp. 17614, 2018. [Google Scholar] [PubMed]
25. S. McLachlan, K. Dube, G. A. Hitman, N. E. Fenton and E. Kyrimi, “Bayesian networks in healthcare: Distribution by medical condition,” Artificial Intelligence in Medicine, vol. 107, pp. 101912, 2020. https://doi.org/10.1016/j.artmed.2020.101912 [Google Scholar] [PubMed] [CrossRef]
26. P. Arora, D. Boyne, J. J. Slater, A. Gupta, D. R. Brenner et al., “Bayesian networks for risk prediction using real-world data: A tool for precision medicine,” Value Health J. Int. Soc. Pharmacoeconomics Outcomes Res., vol. 22, no. 4, pp. 439–445, 2019. [Google Scholar]
27. X. Bi, C. Zhang, F. Wang, Z. Liu, X. Zhao et al., “An uncertainty-based neural network for explainable trajectory segmentation,” ACM Trans Intell Syst Technol., vol. 13, no. 1, pp. 1, 2021. [Google Scholar]
28. M. Langarizadeh and F. Moghbeli, “Applying naive Bayesian networks to disease prediction: A systematic review,” Acta Inform. Medica AIM J. Soc. Med. Inform. Bosnia Herzeg. Cas. Drustva Za Med. Inform. BiH, vol. 24, no. 5, pp. 364–369, 2016. [Google Scholar]
29. H. Guo and H. Li, “A decomposition structure learning algorithm in Bayesian network based on a two-stage combination method,” Complex and Intelligent Systems, vol. 8, pp. 2151–2165, 2022. https://doi.org/10.1007/s40747-021-00623-3 [Google Scholar] [CrossRef]
30. M. S. Satu, M. I. Khan, M. R. Rahman, K. C. Howlader, S. Roy et al., “Diseasome and comorbidities complexities of SARS-CoV-2 infection with common malignant diseases,” Briefings in Bioinform, vol. 22, no. 2, pp. 1415–1429, 2021. [Google Scholar]
31. M. Zorzi, R. R. Rao and L. B. Milstein, “On the accuracy of a first-order Markov model for data transmission on fading channels,” in The Proc. of Int. Conf. on Universal Personal Communications, Tokyo, Japan, pp. 211–215, 1995. [Google Scholar]
32. M. Momenzadeh, M. Sehhati and H. Rabbani, “Using hidden Markov model to predict recurrence of breast cancer based on sequential patterns in gene expression profiles,” Journal of Biomed. Informatics, vol. 111, pp. 103570, 2020. https://doi.org/10.1016/j.jbi.2020.103570 [Google Scholar] [PubMed] [CrossRef]
33. D. Chicco and G. Jurman, “The advantages of the Matthews correlation coefficient (MCC) over F1 score and accuracy in binary classification evaluation,” BMC Genomics, vol. 21, no. 1, pp. 6, 2020. [Google Scholar] [PubMed]
34. C. Zhang, J. Bütepage, H. Kjellström and S. Mandt, “Advances in variational inference,” IEEE Transactions on Pattern Analysis and Machine Intelligence, vol. 41, no. 8, pp. 2008–2026, 2019. [Google Scholar] [PubMed]
35. A. Hagen, K. Pazdernik, N. LaHaye and M. Oostrom, “DBCal: Density based calibration of classifier predictions for uncertainty quantification,” ArXiv, vol. abs/2204.00150, 2022. [Google Scholar]
36. R. Obiedat, R. Qaddoura, A. M. A. Zoubi, L. A. Qaisi, O. Harfoushi et al., “Sentiment analysis of customers’ reviews using a hybrid evolutionary SVM-based approach in an imbalanced data distribution,” IEEE Access, vol. 10, pp. 22260–22273, 2022. [Google Scholar]
Cite This Article
 Copyright © 2023 The Author(s). Published by Tech Science Press.
This work is licensed under a Creative Commons Attribution 4.0 International License , which permits unrestricted use, distribution, and reproduction in any medium, provided the original work is properly cited.
 Downloads
 Citation Tools