
 Submit a Paper
 Propose a Special lssue
 Open Access
ARTICLE

Recommendation Algorithm Integrating CNN and Attention System in Data Extraction
College of Information and Management Science, Henan Agricultural University, Zhengzhou, 450046, China
* Corresponding Author: Xianghui Hui. Email:
Computers, Materials & Continua 2023, 75(2), 4047-4063. https://doi.org/10.32604/cmc.2023.036945
Received 17 October 2022; Accepted 13 February 2023; Issue published 31 March 2023
 View Full Text
 Download PDF
Abstract
With the rapid development of the Internet globally since the 21st century, the amount of data information has increased exponentially. Data helps improve people’s livelihood and working conditions, as well as learning efficiency. Therefore, data extraction, analysis, and processing have become a hot issue for people from all walks of life. Traditional recommendation algorithm still has some problems, such as inaccuracy, less diversity, and low performance. To solve these problems and improve the accuracy and variety of the recommendation algorithms, the research combines the convolutional neural networks (CNN) and the attention model to design a recommendation algorithm based on the neural network framework. Through the text convolutional network, the input layer in CNN has transformed into two channels: static ones and non-static ones. Meanwhile, the self-attention system focuses on the system so that data can be better processed and the accuracy of feature extraction becomes higher. The recommendation algorithm combines CNN and attention system and divides the embedding layer into user information feature embedding and data name feature extraction embedding. It obtains data name features through a convolution kernel. Finally, the top pooling layer obtains the length vector. The attention system layer obtains the characteristics of the data type. Experimental results show that the proposed recommendation algorithm that combines CNN and the attention system can perform better in data extraction than the traditional CNN algorithm and other recommendation algorithms that are popular at the present stage. The proposed algorithm shows excellent accuracy and robustness.Keywords
With technological development in the 21st century, big data has infiltrated all walks of life and data analysis technologies pave the way for the combination of intelligent machines, the Internet, and big data [1]. As humans can only receive limited data, the efficient extraction and analysis of big data have become more of a challenge [2]. In current research on data feature extraction, some scholars have proposed a fast artificial intelligence (AI) framework and the method of cycle strategy and automatic diagnostic detection. As a result, the accuracy has increased by 97.4% [3]. Using stacking technology, some scholars begin to build integrated classifiers to predict future changes in data. This technology is based on multi-modal time series data [4]. Recommendation algorithms show unique advantages in data screening. The role of the recommendation algorithm is to help people filter out their preferred content from a large amount of data. It is a technology for efficient information processing [5]. The recommendation algorithm obtains the user’s historical data, establishes his preference model, uses the model and the database to analyze, and recommends the related content. It continuously optimizes and adjusts the model based on the feedback from the users’ responses to the recommendations. Currently, there are many applications of recommendation algorithms, including various hybrid models [6]. Convolutional neural networks are widely used in data extraction in multiple disciplines due to their apparent advantages in data feature processing [7]. In the human visual system, if the attention is high, the time for humans to process complex data information will decrease. Therefore, some scholars propose an attention system. The computing resources of the network are more invested in important data [8]. To solve the problems of the recommendation system at this stage, this research innovatively proposes a recommendation algorithm that integrates CNN and the attention system. The text convolutional network improves the CNN algorithm, and the self-attention system in the attention algorithm extracts user feature data. The data name features are obtained through the convolution kernel. Through the designed data extraction model framework, a new data recommendation system is developed. Based on the performance comparison experiments of the designed algorithms, this paper has compared the algorithm performances such as recognition rate, accuracy rate, and diversity and prediction preference of different algorithms in the data set. It verifies the algorithm with CNN and attention is better and provides the reference idea for the future improvement of the recommendation algorithm.
CNN is an efficient machine learning algorithm that has developed a lot and attracted lots of attention from academia. It has been applied to different fields by scholars. Chandra et al. have integrated the generalizable information in the CNN algorithm with the multimodal system to get higher stability and accuracy than traditional heartbeat detection. The method had higher performance and accuracy in different clinical conditions [9]. Bhuiyan et al. used CNN algorithms to build a system for performing mode analysis and crowd counting to conduct video analysis of the Hajj crowds in Mecca, for higher safety of pilgrims during their stay. The research created a new dataset that significantly reduced the average error and the mean square error. They conducted simulation tests and verified that the analysis and counting capabilities of the new system were excellent [10]. Aiming at the forecasting of the stock market, Zhou proposed to process the continuous time information of stocks based on the images of the stock market. He divided the raw data without information into multiple categories and used this as a CNN training set [11]. Chen et al. proposed a quaternary two-stream model based on the CNN algorithm. By adding a mask branch that combined a fully convolutional network and a conditional random field, they used the model to localize pixel-level stitching regions. The color stitching images were also processed. The overall processing, combined with the attention model, made the system more focused on the spliced areas to obtain the noisy input of the noise flow. Finally, the experiments showed that the method was more excellent than other methods in terms of localization, generalization, and robustness [12]. Xu et al. proposed an improved CNN to predict oil and gas flow cross-section gas proportion in oil production. With three different sensor datasets, they compared the sensor-based imaging cross-view feature fusion CVF algorithm and support vector machine (SVM) algorithm with the CNN algorithm. They also verified that the CNN algorithm had feasibility in multiphase flow measurement techniques [13].
In recent years, data mining and recommendation algorithms have attracted the attention of many scholars. Gabbay et al. proposed a new meta-learning method and applied it to dataset recommendation. Based on the isolated forest algorithm, they added a new similarity measurement model between datasets to improve the problem standard. The testing of public data sets shows that the algorithm has a good predictive performance and can compute complex problems [14]. Li et al. found that among the recent diversity recommendation algorithms, reinforcement learning methods were low efficient and had a significant variance, so they proposed a new critic reinforcement learning method and increased the critic supervision loss to enhance the performance. The Movielens data set proposed the effectiveness of the method [15]. Chen et al. proposed a hybrid personalized recommendation algorithm, which used collaborative filtering and content-based recommendation, and the Dirichlet allocation model to reduce the dimension of high-dimensional data. This can reduce the inaccuracy caused by high data sparsity in collaborative filtering. Experimental results have verified the effectiveness and accuracy of the recommendation algorithm in this study. Overall, it is better than other recommendation algorithms [16]. Ali developed a recommended method of field fertilizer nitrogen management based on the canopy reflection sensor of Green Seeker. They established different normalized vegetation indices to measure the nitrogen absorption index and the recommendation of fertilizer nitrogen content was appropriate. The results showed that the proposed method was better than the general one [17]. Wang et al. found that most current recommendation systems focused on optimizing user experience and limiting the provider’s perspective. Therefore, they proposed a cascade hybrid multi-objective recommendation algorithm to balance the objectives of different stakeholders. The research constructs a new provider visibility model through provider coverage, user arrival coverage, and provider entropy. Experimental results showed that the proposed algorithm could effectively upgrade unbalanced provider recommendations and reduce the complexity of high-dimensional multi-target recommendations [18].
As one of the popular modules in the research of deep learning attention systems, the attention system has excellent performances, such as intuition, breadth, and interpretability, and is suitable for various disciplines. Tang et al. proposed an image hashing with a visual attention system and invariant moment. Through weighted discrete wavelet transform, it can effectively extract the saliency reflecting the focus image area of attention. It has perceptual robustness of the hash, and the study validates the performance of the proposed hash with extensive experiments on open image datasets [19]. According to Duan et al., there is an issue with machine translation in retrosynthesis, so they applied the attention model and data-driven system to datasets with different responses. As a result, the method was much better than others at this stage. Through a series of tests, it was able to select and analyze chemically plausible predictions that do not match the facts [20]. Zhou et al. and other scholars proposed a detection framework for defects at the bottom surface of glass bottles based on visual attention and wavelet transform. The model consisted of three parts, the entropy rate superpixel circle detection and localization method, and the integrated frequency tuning salient region used in the central panel area. Detection method based on wavelet transformation and multi-scale filtering used in annular texture area. The proposed framework was tested on four datasets of the visual attention system. The study shows that the framework is more excellent than most traditional methods [21]. Schaffert et al. proposed a learning weighting method to improve the system’s learning capability. The attention model paid more attention to internal correspondences in motion estimation, allowing minimal registration errors to train the model directly. The model exhibited a highly increased robustness in the application of spine registration. Compared to previous methods, it had a higher accuracy of about 0.5 mm average projection distance [22]. Liu et al. innovatively combined a two-way attention recognition model to achieve bidirectional reinforcement. The model consisted of an attention agent for distinguishing partial region proposals for feature extraction, while directly optimizing the attention agent based on feedback. The model shows great capability and is better than other methods of the same stage in classification accuracy [23].
In summary, due to the unique advantages of the CNN algorithm and attention method, they have been studied by scholars in different fields. This paper innovatively integrates CNN and the attention system to propose a new recommendation algorithm for more efficient and accurate data extraction.
3 Implementation of Recommendation Algorithm Integrating CNN and Attention System in Data Extraction
3.1 Application and Improvement of Recommendation Algorithm Based on CNN
Various fields adopt machine learning algorithms for data prediction and processing [24]. CNN relies on the mathematical operation of convolution. It is dedicated to processing data with similar grid structures and performs very well in image algorithms [25]. The basic CNN structure is shown in Fig. 1.

Figure 1: Basic CNN structure
As shown in Fig. 1, the basic CNN includes three layers, specifically the convolutional layer, the pooling layer, and the fully connected layer. The convolutional layer and the pooling layer in CNN are unique. The structure of the text CNN is like the traditional CNN, but the difference still exists. The input layer of the text CNN has two channels, and their attributes are static and non-static, respectively. The word vector represented by static will change with network training. The trained word vector trains the model in the static state. Eq. (1) shows the expression of the continuous estimation function of the convolution operation in the CNN algorithm.
In Eq. (1),
As shown in the Eq. (2), x represents the first parameter in the convolution, which is generally called the input. w represents an effective probability dense function, and it is also the second parameter, which is called the kernel function. High-dimensional data is generally the input first. The convolution kernel is the high-dimensional parameters produced by the algorithm. Eq. (3) shows the details.
where
Convolutional layer is the core of CNN. It is the key to performing the network convolution and the critical part of feature extraction capability [26]. The convolution layer generally refers to the 2D convolution operation. If the dimension of the original image is set to
The input layer and the convolutional layer must be consistent, so it is necessary to choose the appropriate step size to extract image features. The long expression of input and output after convolution is shown in Eq. (6).
As shown in Eq. (6),
As shown in Eq. (7),

Figure 2: Schematic diagram of the convolution operation
The pooling layer is also known as the downsampling layer. It is the place between the convolutional layers and is essentially an abstract representation of local features [27]. There are two pooling methods. Fig. 3 shows the pooling of the two methods.

Figure 3: Pooling process
The pooling layer filters out the main visual features and combines them with high-level visual features. The expression of the process is shown in Eq. (8).
where,
The fully connected layer improves the nonlinear mapping capability, connecting the neurons used in previous layer of the network with the neurons of the current network. The neurons in the same layer are not connected. Its expression is shown in Eq. (9).
where, l represents the number of network layers; n represents the
3.2 Attention Model System and Its Improvement in Recommendation Model Algorithm
The attention method originated from the research on human vision. It helps improve the speed of information screening [28]. In computer vision, the attention method is used for the processing and screening of visual information. The basic attention system is shown in Fig. 4.

Figure 4: The basic principle of the attention system
As shown in Fig. 4, the attention model first regards the content in the original data as a paired composition of Value and Key data. The query is selected as the calculation target of the attention method. The similarity between all Key data and Query is calculated to determine the weight coefficient of the corresponding Value. Finally, it uses the weight coefficient to add up and weigh all Value data and obtain the Attention data. The Query and key data in the attention system are used to solve the factor of the weight coefficient of Value, which is shown in Eq. (10).
Eq. (10),

Figure 5: The calculation process of attention
As shown in Fig. 5, the first step in attention calculation is to obtain the characteristic data of Query and Key, calculate their similarity, and obtain the required weight coefficient by normalizing the similarity. The second step is based on the weight coefficient. A weighted sum is performed to get the attention score. When calculating the similarity, the vector is often used to do the dot product operation to obtain the similarity, or the multi-layer perceptron (MLP) network is used to complete it. Eq. (11) shows the dot product formula and the MLP network formula.
The obtained similarities are also different when using different similarity calculation methods. For other similarities, two ways can complete the quantitative comparisons. One is normalization, which adjusts the similarity data to the weight of all elements, and 1. Probability distribution. The other is to use Softmax to emphasize the importance of elements’ weight, and its formula is shown in Eq. (12).
In Eq. (12),
The formula above determines the attention value for Query. As a branch of the attention method, the self-attention method is used for feature extraction with higher accuracy. The principle of the attention method is similar to the attention method, both of which calculate the weighted score of the input value. However, the self-attention system focuses on the processed data, and makes all relevant data based on the second. It works better when used for data extraction. Therefore, this study adopts the self-attention system to enhance the attention system.
3.3 Hybrid Recommendation Algorithm Based on Fusion of CNN and Attention System
The recommendation system uses known user information to recommend content from big data. First, information is collected through the feature module of the users’ preference, then the information is sent to the user preference feature extraction module, and these features are sent to the recommendation module. The algorithm can analyze and learn to make better recommendations [30]. The core of the content-based recommendation system is to recommend similar content based on the user’s previous preference content. The primary step is to analyze the project. In other words, the foremost step is to convert the data structure. Using the space vector model, select the text content to be altered as
In the Eq. (14),
Then, a user’s model is established according to the historical data. Judgments are made based on their historical behavior. Different weights are given according to the user’s preference, thereby generating a recommendation list. Collaborative filtering is the widely used recommendation system. The methods for calculating user similarity mainly include the cosine similarity formula, Pearson similarity formula, and Euclidean distance formula. The cosine similarity calculation formula is shown in Eq. (16)
As shown in Eq. (16), after dividing the product of the respective modulo lengths of the vectors by the inner product, the value is
As shown in Eq. (17), the similarity is judged by calculating the quotient of covariance and standard deviation. When the calculation result is greater than 0, the variable is positively correlated; when the calculation result is less than 0, the variable is negatively correlated. The Euclidean distance formula is shown in Eq. (18).
The modulo length is calculated using the difference between two vectors in the Euclidean distance formula to determine the similarity. When the modulo length is shortened, the similarity of the two vectors increases. The text convolutional neural network improves the network accuracy through multiple iterations of training. It uses convolution and pooling to operate on features, and the self-attention method can distribute different weights to the features. In this way, the accuracy of recommendations can be enhanced. Therefore, combining the two algorithms can further improve the accuracy without increasing the operation time. The first layer of the recommendation algorithm that integrates CNN and the attention system is the embedding layer. The embedding layer can be divided into two parts: one is the embedding of user information features, and the feature of each item is extracted by the recurrent neural network, which is fused into user features through the fully connected layer. The other is the feature extraction of the data name, which convolves the features embedded in the input layer through the set convolution kernel to obtain the feature of data name. Finally, the max pooling layer is used to get long vectors, and the data type features are obtained through the attention system layer. The process is shown in Fig. 6.

Figure 6: Recommendation algorithm flowchart
As shown in Fig. 6, the recommendation algorithm first converts the user’s ID data, gender data, age data and occupational data into numbers. This is done through a text convolutional network. The dimensions are divided into (1, 32) and (1, 16). After the name and data type are converted into numeric types, the sum of the feature matrix is converted to the dimension of (1, 32). The obtained user features are sent to the fully connected layer, and the dimension is converted to (1, 128). The user features are extracted. The data name and type features are introduced into the fully connected layer. The dimension becomes (1, 64), the data name matrix is passed through the fully connected layer, and the dimension is converted to (1, 64). Then, through the self-attention system layer, the coordination of different features is calculated. The variance is then used to calculate the weight and output new data features. The obtained user features, data features and recommendation rating features are multiplied by vectors, and the predicted user preferences are obtained by Softmax calculation. The accuracy of the algorithm can be judged by obtaining the difference between the estimated preference and the actual preference in the data set test. The hybrid recommendation model based on self-attention system and text convolutional network is studied, as shown in Fig. 7.

Figure 7: Hybrid recommendation model
This study uses the cross entropy loss function to enhance the sorting performance of the mixed recommendation model when the recommendation model of CNN and the attention system for parameter training are combined. The expression of the cross entropy loss function is shown in Eq. (19).
In Eq. (19), x represents the real distribution of the click sequence, and y represents the probability distribution of model output results. To solve the problems of over-fitting and long training time in the traditional recommendation algorithm, Eq. (20) was used for optimization.
In Eq. (15),
4 Performance Comparison and Result Analysis of the Recommendation Algorithm Integrating CNN and Attention System
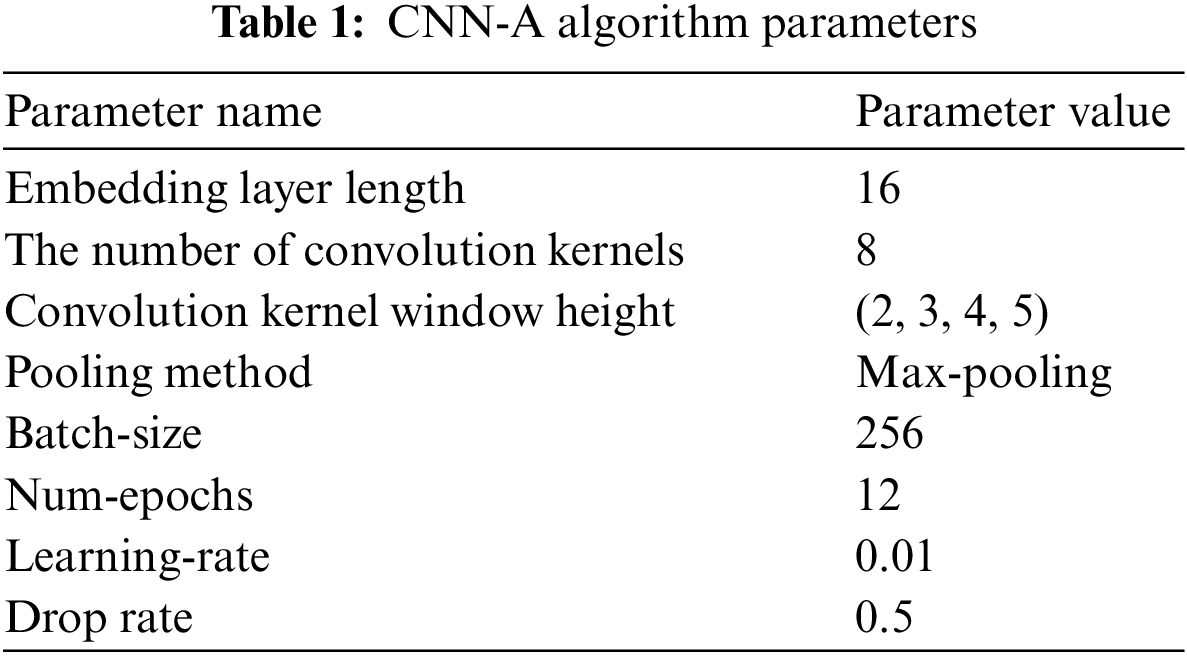
This study has proposed the convolutional neural network-attention (CNN-A) algorithm, in which recommendation system is combined with CNN and attention system. The performance of the algorithm is compared by looking at the data recognition rate and the recommendation accuracy rate. Moreover, the preference of Movielens-100 K data set and the Movielens-1 K data set are also analyzed. Table 1 shows the comparison results of prediction and diversity as well as related parameters of the CNN-A.
Other recommended algorithms are used to compare the performance of the proposed algorithm, including collaborative filtering algorithm based on alternating least squares (ALS-CF), collaborative filtering algorithm based on generative adversarial neural network (CFGAN), singular value decomposition algorithm (SVD), and CNN. The recognition rate of each algorithm in the training iteration of the data set is shown in Fig. 8.

Figure 8: The recognition rate of each algorithm in the training iteration of the data set
Fig. 8 is a comparison of the iterative recognition accuracy. According to the figure, as the iterations increase, the recognition rate of each algorithm also rises significantly. The CNN-A proposed in this study has a higher recognition rate than the traditional CNN. By the time it reaches its 10th iteration, the CNN-A algorithm’s recognition rate has reached to 93.3%, almost completely converged. The CNN-A algorithm performs better than other widely used recommendation algorithms at this stage. When the computer program is launched, the CNN-A algorithm takes about 21 s on average to calculate one iteration, which is much less than the CNN algorithm, which takes 35 s. It demonstrates the effectiveness and superiority of the algorithm proposed in this study. Fig. 9 compares the accuracy of different algorithms as the number of neighbors in the data set grows.

Figure 9: Accuracy comparison of different algorithms
CNN-A algorithm has always maintained the best accuracy (Fig. 9). The accuracy is the maximum of 98.13%, there are10 neighbors. It drops to the lowest of 89.32% when the number of neighbors increases to 50. In comparison to the CNN algorithm, the accuracy of the CNN-A proposed in this study on the Movielens-100 K data set has significantly improved with the constant rise in the number of neighbors. CNN-A has a recommendation accuracy of 89.93% when there are 50 neighbors. This accuracy is 1.92% higher than the CNN algorithm, 2.41% higher than the ALS-CF algorithm, 2.68% higher than the CFGAN algorithm, and 2.49% higher than the SVD algorithm. This proves that the algorithm combining CNN and attention system proposed in this study can optimize the recommendation algorithm. Table 2 compares the diversity of the five algorithms on Movielens-100 K and Movielens-1 M datasets.

In Table 2, the diversity score of CNN-A algorithm is better than that of other algorithms. The highest diversity score of CNN-A algorithm is 0.934 and the lowest is 0.731. The highest diversity of CF is 0.855, and the lowest is 0.538. The highest diversity of CFGAN is 0.841, and the lowest is 0.497. The highest diversity of SVD is 0.797, and the lowest is 0.521. The data is shown in Fig. 10 as a line graph.
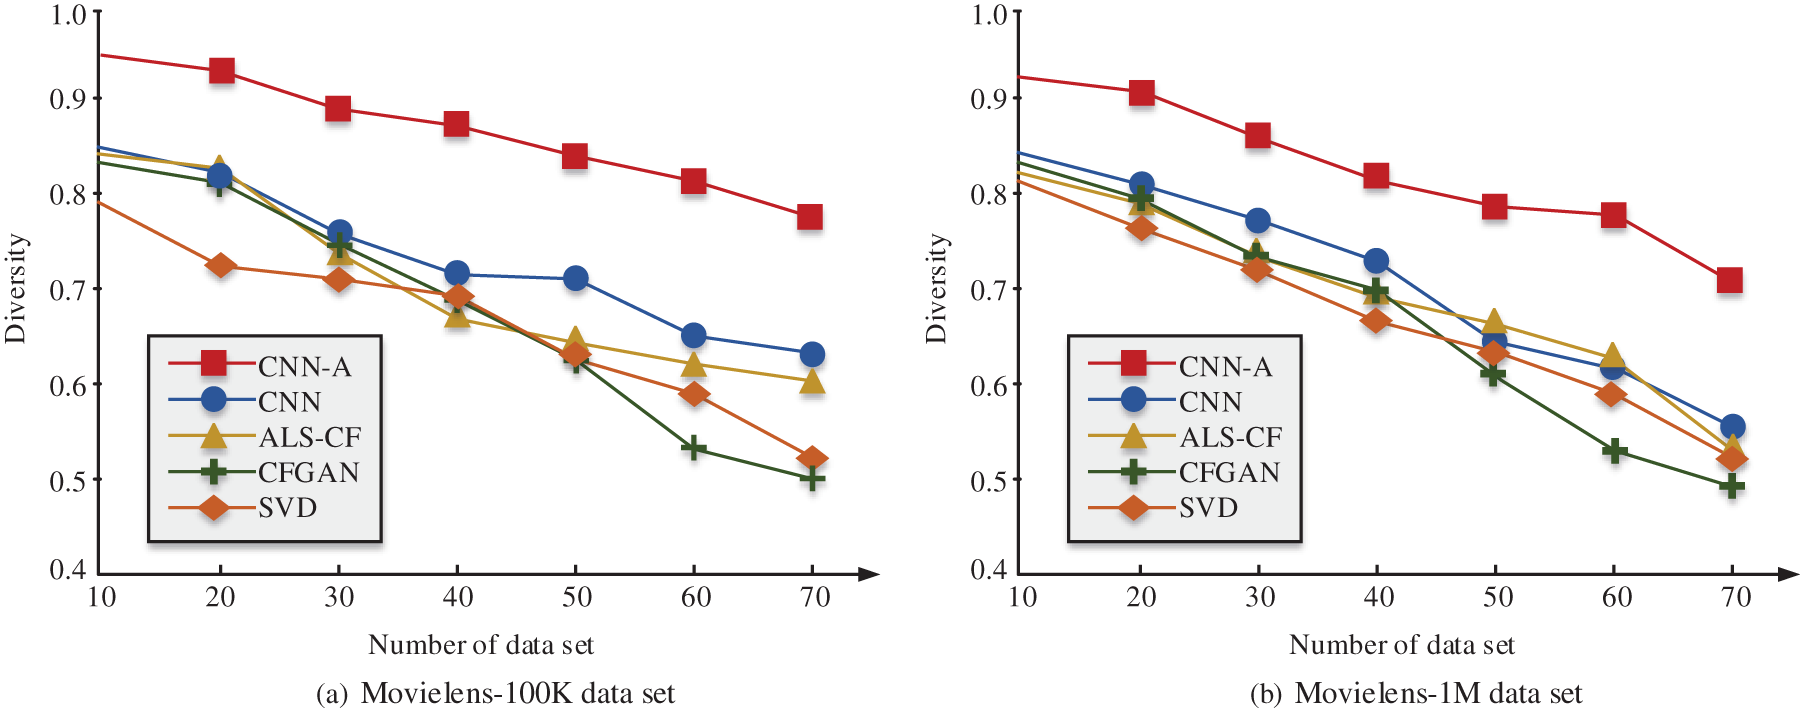
Figure 10: Variation of the diversity of different algorithms
Fig. 10 shows the diversity variation of different algorithms in different data sets as the data grows. In the two data sets, the diversity score of CNN-A algorithm in this study is superior to the other four types of algorithms. In the Movielens-100 K data set, the diversity of the five algorithms decreases as the recommendation list in the data set increases. Among the five algorithms, CNN-A shows the best diversity. When the number of lists is 10, the diversity score is 0.943, indicating that the CNN-A algorithm performs the best in the Movielens-100 K data set. In the Movielens-1 M data set, CNN-A is the most diverse, with a score of 0.925 when the number of lists is 10. Therefore, from the perspective of diversity performance, whether in the Movielens-100 K data set or the Movielens-1 M dataset, CNN-A outperforms several other algorithms. To further study the capability of the recommendation algorithm that integrates CNN and attention system in practical applications, the predicted user preferences of the two datasets are compared with the actual user preferences. Fig. 11 shows the results.

Figure 11: Compare predicted user preferences with actual user preferences
Fig. 11 shows the line analysis of the predicted preferences and the actual preferences of the CNN-A algorithm in the data set. In the Movielens-100 K data set, as the number of people increases, the user preferences are stabilized between 5 and 8. Meanwhile, the prediction results of CNN-A are between 5 and 8 points, and the overall preference prediction interval is consistent with the actual user preference interval. When CNN-A predicts user preferences, there will be an error of fewer than 1 point. When the number of users is 20, the predicted preference is closest to the actual preference, with a difference of 0.13 points. When the number of users is 50, the difference is 0.97 points, which is the biggest. Consequently, the CNN-A algorithm significantly outperforms other recommendation algorithms employed at this stage for the Movielens-100 K dataset. The user preference in the Movielens-1 M dataset stabilizes between 2 and 5 points, as the user base grows. At this time, the prediction result of CNN-A is between 2 and 5 points. The overall preference prediction interval is similar to that of actual users. Each time CNN-A predicts user preferences, there will be an error of fewer than 2 points. When the number of users is 35, the predicted preference is the closest to the actual preference, with a difference of 0.23 points. When the number of users is 15, the difference is 1.84 points, which is the largest. As a result, the CNN-A algorithm performs significantly better in the Movielens-100 K data when compared to other recommendation algorithms used at this stage.
As the era of big data and information arrives, traditional recommendation algorithms become unable to meet people’s various requirements on data. This study has optimized the recommendation algorithm based on the CNN algorithm and attention method and proposed a new framework for the recommendation algorithm. The research of data extraction adopts the algorithm. By comparing the performance of the algorithms, the CNN-A algorithm proposed in this study has reached 93.3% recognition rate. The number of iterations comes the 10th, almost converging ultimately, and the average time of a single iteration is 21 s. As the number of neighbors changes, the accuracy of the test is between 98.13∼89.32%. Compared with the other popular algorithms, it has a better accuracy and diversity in data extraction. Although the recommendation algorithm developed in this study has better performance and robustness, when user preferences change, the accuracy decreases. Moreover, the performance of the recommendation algorithm model in the research has not been verified in different kinds of product recommendation. Therefore, future studies should explore how to ensure the accuracy of the recommendation algorithm when the system meets complex conditions with multiple users and multiple commodities.
Funding Statement: The authors received no specific funding for this study.
Conflicts of Interest: The authors declare that they have no conflicts of interest to report regarding the present study.
References
1. J. Alzubi, A. Nayyar and A. Kumar, “Machine learning from theory to algorithms: An overview,” Journal of Physics: Conference Series, vol. 1142, no. 1, pp. 012012, 2018. [Google Scholar]
2. J. Bian, Y. Zhang, C. Tao, Y. S. Sung, R. W. Dravenstott et al., “Super order: Provider order recommendation system for outpatient clinics,” Health Informatics Journal, vol. 26, no. 2, pp. 999–1016, 2020. [Google Scholar]
3. A. Vulli, P. N. Srinivasu, M. S. K. Sashank, J. Shafi, J. Choi et al., “Fine-tuned densenet-169 for breast cancer metastasis prediction using fast AI and 1-cycle policy,” Sensors, vol. 22, no. 8, pp. 2988, 2022. [Google Scholar] [PubMed]
4. S. El-Sappagh, F. Ali, T. Abuhmed, J. Singh and J. M. Alonso, “Automatic detection of Alzheimer’s disease progression: An efficient information fusion approach with heterogeneous ensemble classifiers,” Neurocomputing, vol. 512, no. 1, pp. 203–224, 2022. [Google Scholar]
5. Y. Mao, Y. Zhu, Z. Tang and Z. Chen, “A novel airspace planning algorithm for cooperative target localization,” Electronics, vol. 11, no. 18, pp. 2950, 2022. https://doi.org/10.3390/electronics11182950 [Google Scholar] [CrossRef]
6. Q. Sun, “Evaluation model of classroom teaching quality based on improved RVM algorithm and knowledge recommendation,” Journal of Intelligent and Fuzzy Systems, vol. 40, no. 2, pp. 2457–2467, 2021. [Google Scholar]
7. A. Z. Jenei, G. Kiss, M. G. Tulics and D. Sztaho, “Separation of several illnesses using correlation structures with convolutional neural networks,” Acta Polytechnica Hungarica, vol. 18, no. 7, pp. 47–66, 2021. [Google Scholar]
8. Y. Chen and H. Zhao, “Depth estimation based on adaptive pixel-level attention model,” Journal of Applied Optics, vol. 41, no. 3, pp. 490–499, 2020. [Google Scholar]
9. B. S. Chandra, C. S. Sastry and S. Jana, “Robust heartbeat detection from multimodal data via CNN-based generalizable information fusion,” IEEE Transactions on Biomedical Engineering, vol. 66, no. 3, pp. 710–717, 2020. [Google Scholar]
10. R. Bhuiyan, J. Abdullah, N. Hashim, F. A. Farid and U. Jia, “Hajj pilgrimage video analytics using CNN,” Bulletin of Electrical Engineering and Informatics, vol. 10, no. 5, pp. 2598–2606, 2021. [Google Scholar]
11. Q. Zhou, “A stock price prediction model based on stock charts and deep CNN,” Finance, vol. 10, no. 4, pp. 334–342, 2020. [Google Scholar]
12. B. Chen, J. U. Xingwang, Y. Gao and J. Wang, “A quaternion two-stream R-CNN network for pixel-level color image splicing localization,” Chinese Journal of Electronics, vol. 30, no. 6, pp. 1069–1079, 2021. [Google Scholar]
13. Z. Xu, F. Wu, X. Yang and Y. Li, “Measurement of gas-oil two-phase flow patterns by using CNN algorithm based on dual ECT sensors with venturi tube,” Sensors, vol. 20, no. 4, pp. 1200–1218, 2020. [Google Scholar] [PubMed]
14. I. Gabbay, B. Shapira and L. Rokach, “Isolation forests and landmarking-based representations for clustering algorithm recommendation using meta-learning,” Information Sciences, vol. 574, no. 1, pp. 473–489, 2021. [Google Scholar]
15. S. Li, Y. Yan, J. Ren, Y. Zhou and Y. Zhang, “A Sample-efficient actor-critic algorithm for recommendation diversification,” Chinese Journal of Electronics, vol. 29, no. 1, pp. 89–96, 2020. [Google Scholar]
16. C. Chen, L. Huang, Z. Lei and S. Wang, “Research on personalized recommendation hybrid algorithm for interactive experience equipment,” Computational Intelligence, vol. 36, no. 3, pp. 1348–1373, 2020. [Google Scholar]
17. A. M. Ali, “Development of an algorithm for optimizing nitrogen fertilization in wheat using Green Seeker proximal optical sensor,” Experimental Agriculture, vol. 56, no. 5, pp. 688–698, 2020. [Google Scholar]
18. D. Wang and Y. Chen, “A novel cascade hybrid many-objective recommendation algorithm incorporating multistake holder concerns,” Information Sciences, vol. 577, no. 10, pp. 105–127, 2021. [Google Scholar]
19. Z. Tang, H. Zhang, C. M. Pun, M. Yu and X. Zhang, “Robust image hashing with visual attention model and invariant moments,” IET Image Processing, vol. 14, no. 5, pp. 901–908, 2020. [Google Scholar]
20. H. Duan, L. Wang, C. Zhang, L. Guo and J. Li, “Retrosynthesis with attention-based NMT model and chemical analysis of “wrong” predictions,” RSC Advances, vol. 10, no. 3, pp. 1371–1378, 2020. [Google Scholar] [PubMed]
21. X. Zhou, Y. Wang, Q. Zhu, J. Mao, C. Xiao et al., “A surface defect detection framework for glass bottle bottom using visual attention model and wavelet transform,” IEEE Transactions on Industrial Informatics, vol. 16, no. 4, pp. 2189–2201, 2020. [Google Scholar]
22. R. Schaffert, J. Wang, P. Fischer, A. Borsdorf and A. Maier, “Learning an attention model for robust 2-D/3-D registration using point-to-plane correspondences,” IEEE Transactions on Medical Imaging, vol. 39, no. 10, pp. 3159–3174, 2020. [Google Scholar] [PubMed]
23. C. Liu, H. Xie, Z. Zha, L. Yu, Z. Chen et al., “Bidirectional attention-recognition model for fine-grained object classification,” IEEE Transactions on Multimedia, vol. 22, no. 7, pp. 1785–1795, 2020. [Google Scholar]
24. M. M. Patil, P. M. Rekha, A. Solanki, A. Nayyar and B. Qureshi, “Big data analytics using swarm-based long short-term memory for temperature forecasting,” CMC-Computers Materials & Continua, vol. 71, no. 2, pp. 2347–2361, 2022. [Google Scholar]
25. Q. Wang, D. Li, S. Mei, Z. Lai and Y. Dou, “Optimizing winograd-based fast convolution algorithm on phytium multi-core CPUs,” Journal of Computer Research and Development, vol. 57, no. 6, pp. 1140–1151, 2020. [Google Scholar]
26. D. Zhang, E. Stewart, J. Ye, M. Entezami and C. Roberts, “Roller bearing degradation assessment based on a deep mlp convolution neural network considering outlier regions,” IEEE Transactions on Instrumentation and Measurement, vol. 69, no. 6, pp. 2996–3004, 2020. [Google Scholar]
27. A. Alhussainy, “A new pooling layer based on wavelet transform for convolutional neural network,” Journal of Advanced Research in Dynamical and Control Systems, vol. 24, no. 4, pp. 76–85, 2020. [Google Scholar]
28. B. Zhao, X. Li and X. Lu, “CAM-RNN: Co-attention model based rnn for video captioning,” IEEE Transactions on Image Processing, vol. 28, no. 99, pp. 5552–5565, 2019. [Google Scholar] [PubMed]
29. F. Wang, J. F. Yang, M. Y Wang, C. Y. Jia, X. X. Shi et al., “Graph attention convolutional neural network model for chemical poisoning of honey bees’ prediction,” Science Bulletin, vol. 65, no. 14, pp. 1184–1191, 2020. [Google Scholar] [PubMed]
30. X. Wang, “Personalized recommendation framework design for online tourism: Know you better than yourself,” Industrial Management & Data Systems, vol. 120, no. 11, pp. 2067–2079, 2020. [Google Scholar]
Cite This Article
 Copyright © 2023 The Author(s). Published by Tech Science Press.
This work is licensed under a Creative Commons Attribution 4.0 International License , which permits unrestricted use, distribution, and reproduction in any medium, provided the original work is properly cited.
 Downloads
 Citation Tools