
 Submit a Paper
 Propose a Special lssue
 Open Access
ARTICLE

An Innovative Bispectral Deep Learning Method for Protein Family Classification
Biomedical Systems and Informatics Engineering Department, Hijjawi Faculty for Engineering Technology, Yarmouk University, Irbid, 21163, Jordan
* Corresponding Author: Amjed Al Fahoum. Email:
Computers, Materials & Continua 2023, 75(2), 3971-3991. https://doi.org/10.32604/cmc.2023.037431
Received 03 November 2022; Accepted 02 February 2023; Issue published 31 March 2023
 View Full Text
 Download PDF
Abstract
Proteins are essential for many biological functions. For example, folding amino acid chains reveals their functionalities by maintaining tissue structure, physiology, and homeostasis. Note that quantifiable protein characteristics are vital for improving therapies and precision medicine. The automatic inference of a protein’s properties from its amino acid sequence is called “basic structure”. Nevertheless, it remains a critical unsolved challenge in bioinformatics, although with recent technological advances and the investigation of protein sequence data. Inferring protein function from amino acid sequences is crucial in biology. This study considers using raw sequencing to explain biological facts using a large corpus of protein sequences and the Globin-like superfamily to generate a vector representation. The power of two representations was used to identify each amino acid, and a coding technique was established for each sequence family. Subsequently, the encoded protein numerical sequences are transformed into an image using bispectral analysis to identify essential characteristics for discriminating between protein sequences and their families. A deep Convolutional Neural Network (CNN) classifies the resulting images and developed non-normalized and normalized encoding techniques. Initially, the dataset was split 70/30 for training and testing. Correspondingly, the dataset was utilized for 70% training, 15% validation, and 15% testing. The suggested methods are evaluated using accuracy, precision, and recall. The non-normalized method had 70% accuracy, 72% precision, and 71% recall. 68% accuracy, 67% precision, and 67% recall after validation. Meanwhile, the normalized approach without validation had 92.4% accuracy, 94.3% precision, and 91.1% recall. Validation showed 90% accuracy, 91.2% precision, and 89.7% recall. Note that both algorithms outperform the rest. The paper presents that bispectrum-based nonlinear analysis using deep learning models outperforms standard machine learning methods and other deep learning methods based on convolutional architecture. They offered the best inference performance as the proposed approach improves categorization and prediction. Several instances show successful multi-class prediction in molecular biology’s massive data.Keywords
An amino acid is like a word, a protein sequence is like a book, and a motif is like a sentence. Mining the relationship between them would yield higher-level information on the functional features of the physical things matching the sequences. Therefore, finding the amino acid residues that distinguish the protein families is a topic of ongoing research in biomolecular science. Scientists define protein families as collections of proteins with related functions in this procedure.
In contrast to defined proteins, however, uncharacterized proteins still need to be identified or categorized in various areas of bioinformatics study. Protein families are defined by scientists in this approach as groupings of proteins having similar activities. As a result, determining how to identify proteins and use functions to demonstrate their understanding of physicochemical processes is a critical challenge in practical research [1–4]. Classifying protein sequences involves engineering-related approaches to extract discrete or continuous features manually. After that, standard machine learning techniques are employed to determine how the characteristics of the hidden patterns will behave once they have been retrieved. To create clusters and assign labels to each cluster, unsupervised learning is a traditional machine learning methodology. On the other hand, genetic trait matching to protein sequences is another well-liked method for finding common patterns in protein sequences. However, this common motif comparison method depends on biological specialists and domain experts for functional motif identification [5,6]. The modification of the protein’s cell sequence requires analysis to identify the protein’s primary function. Consequently, the technique produces a generalized series of gaussian process regression to calculate the total number of variables [7]. Accuracy and outcomes of function analysis may be attained by training the sequencing data of several proteins [8].
Computer models built on neural networks (NN) have recently excelled in simulating highly complicated issues. Because of its advantage, NN-based designs may be employed in several domains connected to biology [9,10]. Natural Language Processing (NLP), like word2vec, is one of these applications [11], whereas others come from deep NN and model architectures [12]. A Recurrent Neural Network (RNN) is one of these NN-based designs that may be applied to tackle sequence learning. Issues such as handwriting recognition, speech recognition, and machine translation while keeping the hidden states’ long-term interdependence [4]. CNN, in particular, has quickly emerged as the method of choice for addressing various issues linked to the smooth automatic exploitation of features and performance tweaking, streamlining traditional image analysis pipelines. Recently, CNNs have been utilized to predict the secondary structure of proteins [13,14]. Prediction in [13] was based on the position-specific score matrix profile (produced by PSI-BLAST), whereas in [14], features relating to the amino acid sequence were subjected to kernel moves in 1 direction (1D) convolution. Additionally, [15] suggested a deep CNN architecture to forecast protein characteristics as this design produced fully dense per-position predictions on protein sequences using a multilayer shift-and-stitch approach. Alternatively, [16] creates models that predict enzymatic function based on the structure by utilizing deep learning algorithms and empirically gathered structural knowledge about enzymes. In [17], they employed a protein mapping technique to encode amino acid sequences to numerical representations, which they only used for protein family prediction.
The bispectral analysis is a sophisticated signal processing approach that measures quadratic nonlinearities (phase-coupling) between signal components. Due to their interdependencies, it revealed unambiguity in many biomedical signals, such as the electrocardiogram (ECG) and electroencephalogram (EEG) [18–24]. Note that the features obtained using these methods may enhance the performance of the deep learning algorithm.
This paper employs the numerically coded protein sequences represented as bispectrum images to feed a well-designed CNN model classifier to obtain a novel technique for identifying the protein family within the Globin-like superfamily. The paper is organized as follows: Section 2 will describe the methodology of this work by introducing the coding, bispectrum, and details of the deep learning architecture of CNNs. Conversion of amino acid sequences to the numbers with the proposed method is also provided. Section 4 explains the data used in this work and depicts the application results of the paper. Section 5 discusses the results and provides potential usage areas of the proposed method. Finally, the paper concludes the results with a light shed on future work.
The proposed system is based on the steps for classifying protein sequence families shown in Fig. 1.

Figure 1: The proposed classification method design
2.1 The Selected Protein Sequence Superfamily
The present paper uses the superfamilies information available on the InterPro site (the new home of Pfam). It is a database of protein families, domains, and functional sites utilized to analyze protein sequences based on their identifiable features. These are called signatures extracted from prediction models such as Hidden Markov models. InterPro’s ability to collect protein signatures from these member databases into a single searchable resource and take advantage of the unique capabilities of each database to create an integrated database and a powerful diagnostic tool, as well as one of its main benefits [25].
The Globin-like superfamily, with InterPro accession number (IPR009050), was chosen in this study to validate the proposed classification system. This superfamily includes Globin-like proteins with six helices arranged in a partially opened, folded leaf structure and truncated Globins missing the first helix. This applies to both the Globins and the phycobilisome proteins resembling phycocyanin. Phycobilisome proteins are oligomers of two distinct Globin-like component types that bind a bilin chromophore and have two additional helices at the N terminus. They are found in cyanobacteria and red algae employed to collect light [25,26]. Other than that, Globins are heme-containing globular proteins that bind and/or carry oxygen and are a member of a sizable, extensively researched family widely present in several organisms [27]. From this superfamily, the following families were selected for testing our proposed classification system. Table 1 presents the protein’s family, the number of protein sequences, and the accession number.
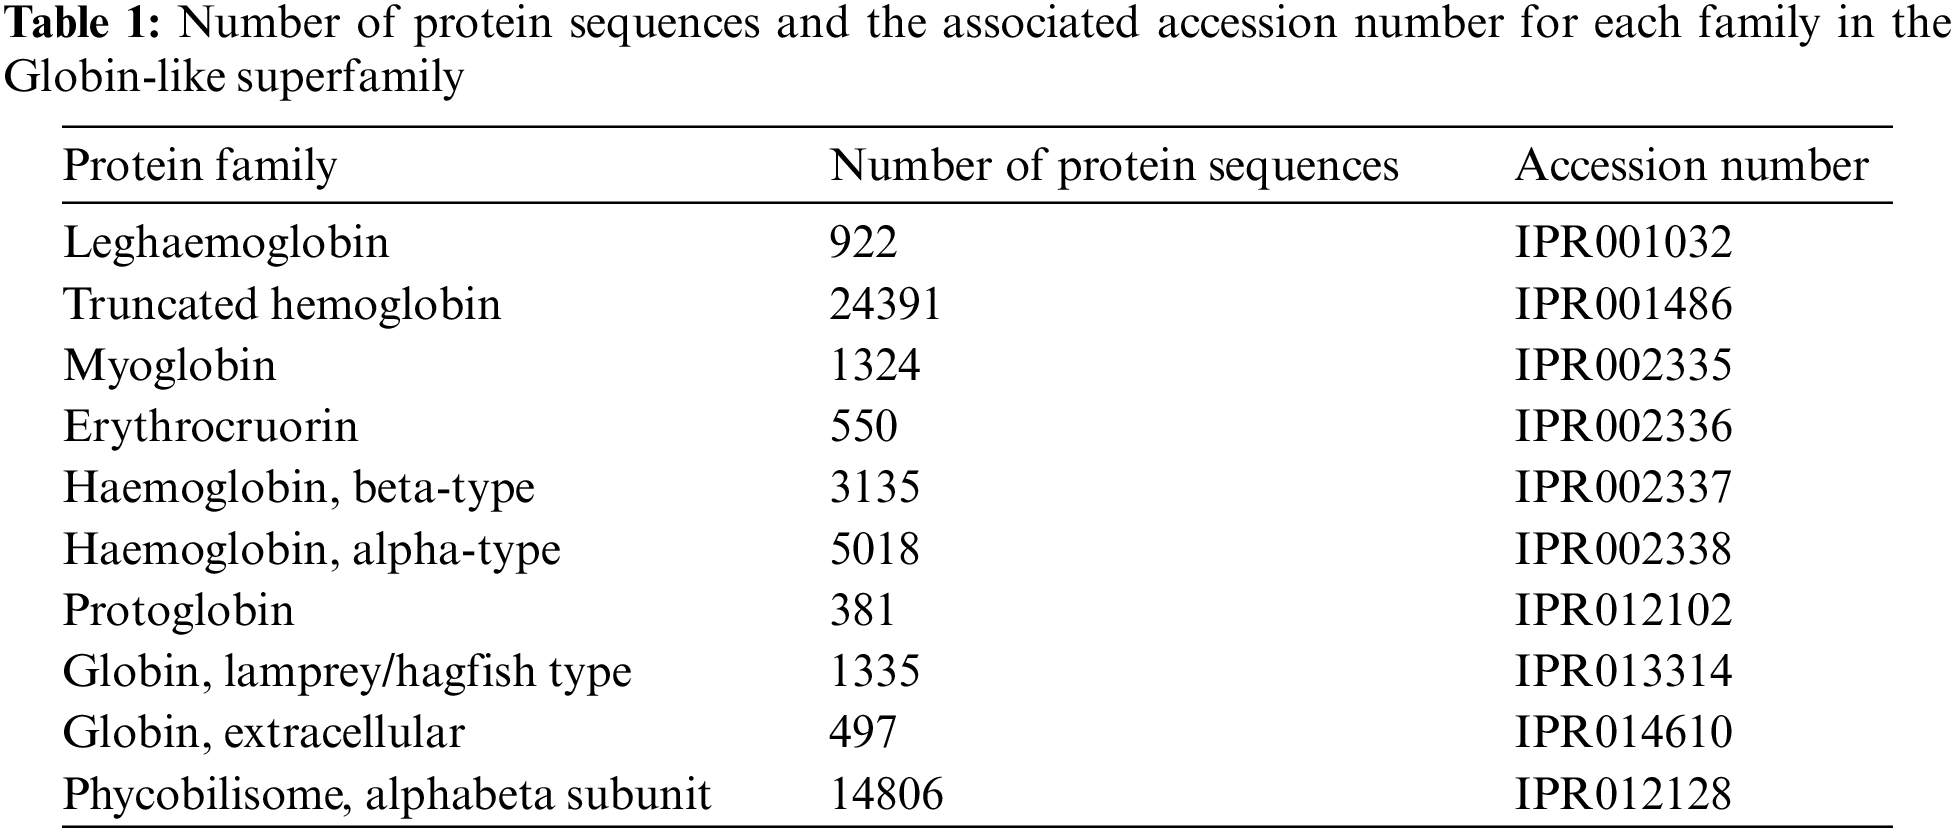
The number of sequences selected for representing each family was equal to the number of sequences in the lowest-sequence number family after performing multiple shuffles (381 protein sequences from each family).
Encoding is a term used to describe data conversion. This article exploited a protein-encoding system, presented in [28], to convert the character sequence representation to numerical vectors that are used finally for classification. The twenty letters of the amino acid alphabet are typically used to represent protein character sequences, where this representation can only be processed directly after first being translated to digital form [29].
The digital representation of amino acids is usually known as feature extraction, amino acid encoding scheme, or residue encoding scheme [29]. The amino acid encoding adopted in this study is the power of two encoding methods. Each amino acid character of the twenty standard amino acids is represented by a twenty-dimensional power of 2. Specifically, the twenty standard amino acids are fixed in a specific order. Subsequently, the ith amino acid type is represented by the power of 2 of the ith position from 0 to 19. For example, the twenty standard amino acids are sorted as [‘A’, ‘R’, ‘N’, ‘D’, ‘C’, ‘E’, ‘Q’, ‘G’, ‘H’, ‘I’, ‘L’, ‘K’, ‘M’, ‘F’, ‘P’, ‘S’, ‘T’, ‘W’, ‘Y’, ‘V’] the code of A is 20, R is 21 and so on. The classification accuracy of the adopted encoding method may be enhanced if its outputs are normalized using the mean value and the standard deviation of the encoded amino acid distribution in each family as in Eq. (1):
Bispectrum is one of the most well-known higher-order spectral analyses of the signals. Therefore, it is employed to analyze bio signals; Electromyogram (EMG), Electroencephalogram (EEG), Electrocardiogram (ECG), and heart sounds [30–34]. Furthermore, it reveals the nonlinearities in the signals. It discovers the non-gaussian components in the signals. It measures quadratic phase coupling (QPC) levels and nonlinearity interactions in non-stationary signals. Other than that, it strengthens the QPC due to its ability to suppress all phase coupling relations. It defines the Fourier Transform (FT) of the third cumulants of the signal. The first cumulant is the mean, the second cumulant is the variance, and the third cumulant is the skewness. Therefore, the FT of skewness is the bispectrum. The corresponding equations describe the bispectrum relations [32–34]:
where
Taking FT for both sides of Eq. (2) will yield:
where
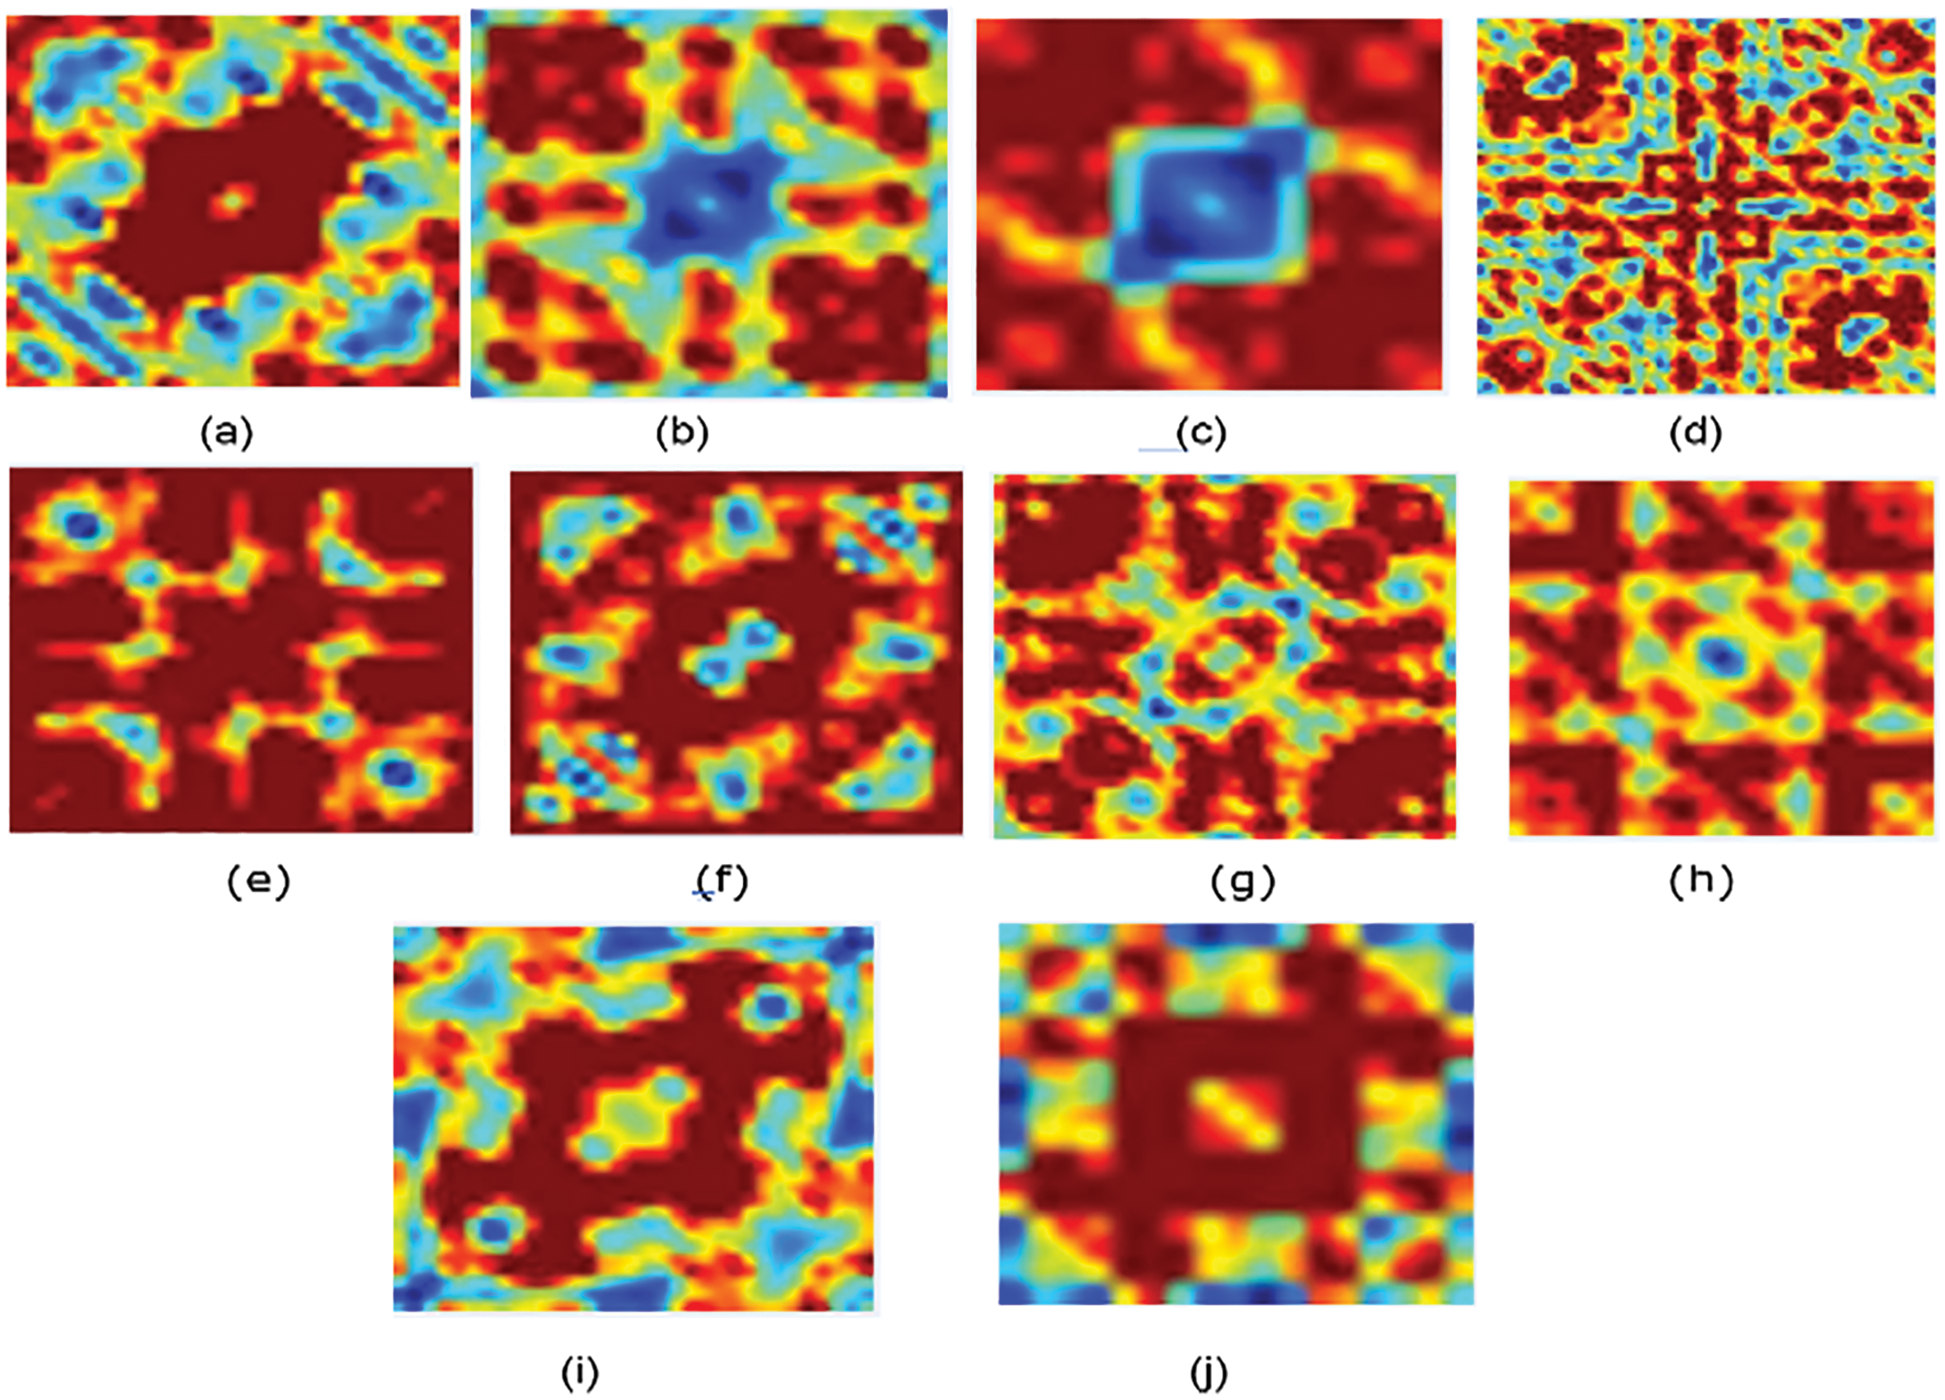
Figure 2: Bispectrum for some protein sequence in each family/class for non-normalized encoding approach (a) Family 1, (b) Family 2, (c) Family 3, (d) Family 4, (e) Family 5, (f) Family 6, (g) Family 7, (h) Family 8, (i) Family 9, (j) Family 10
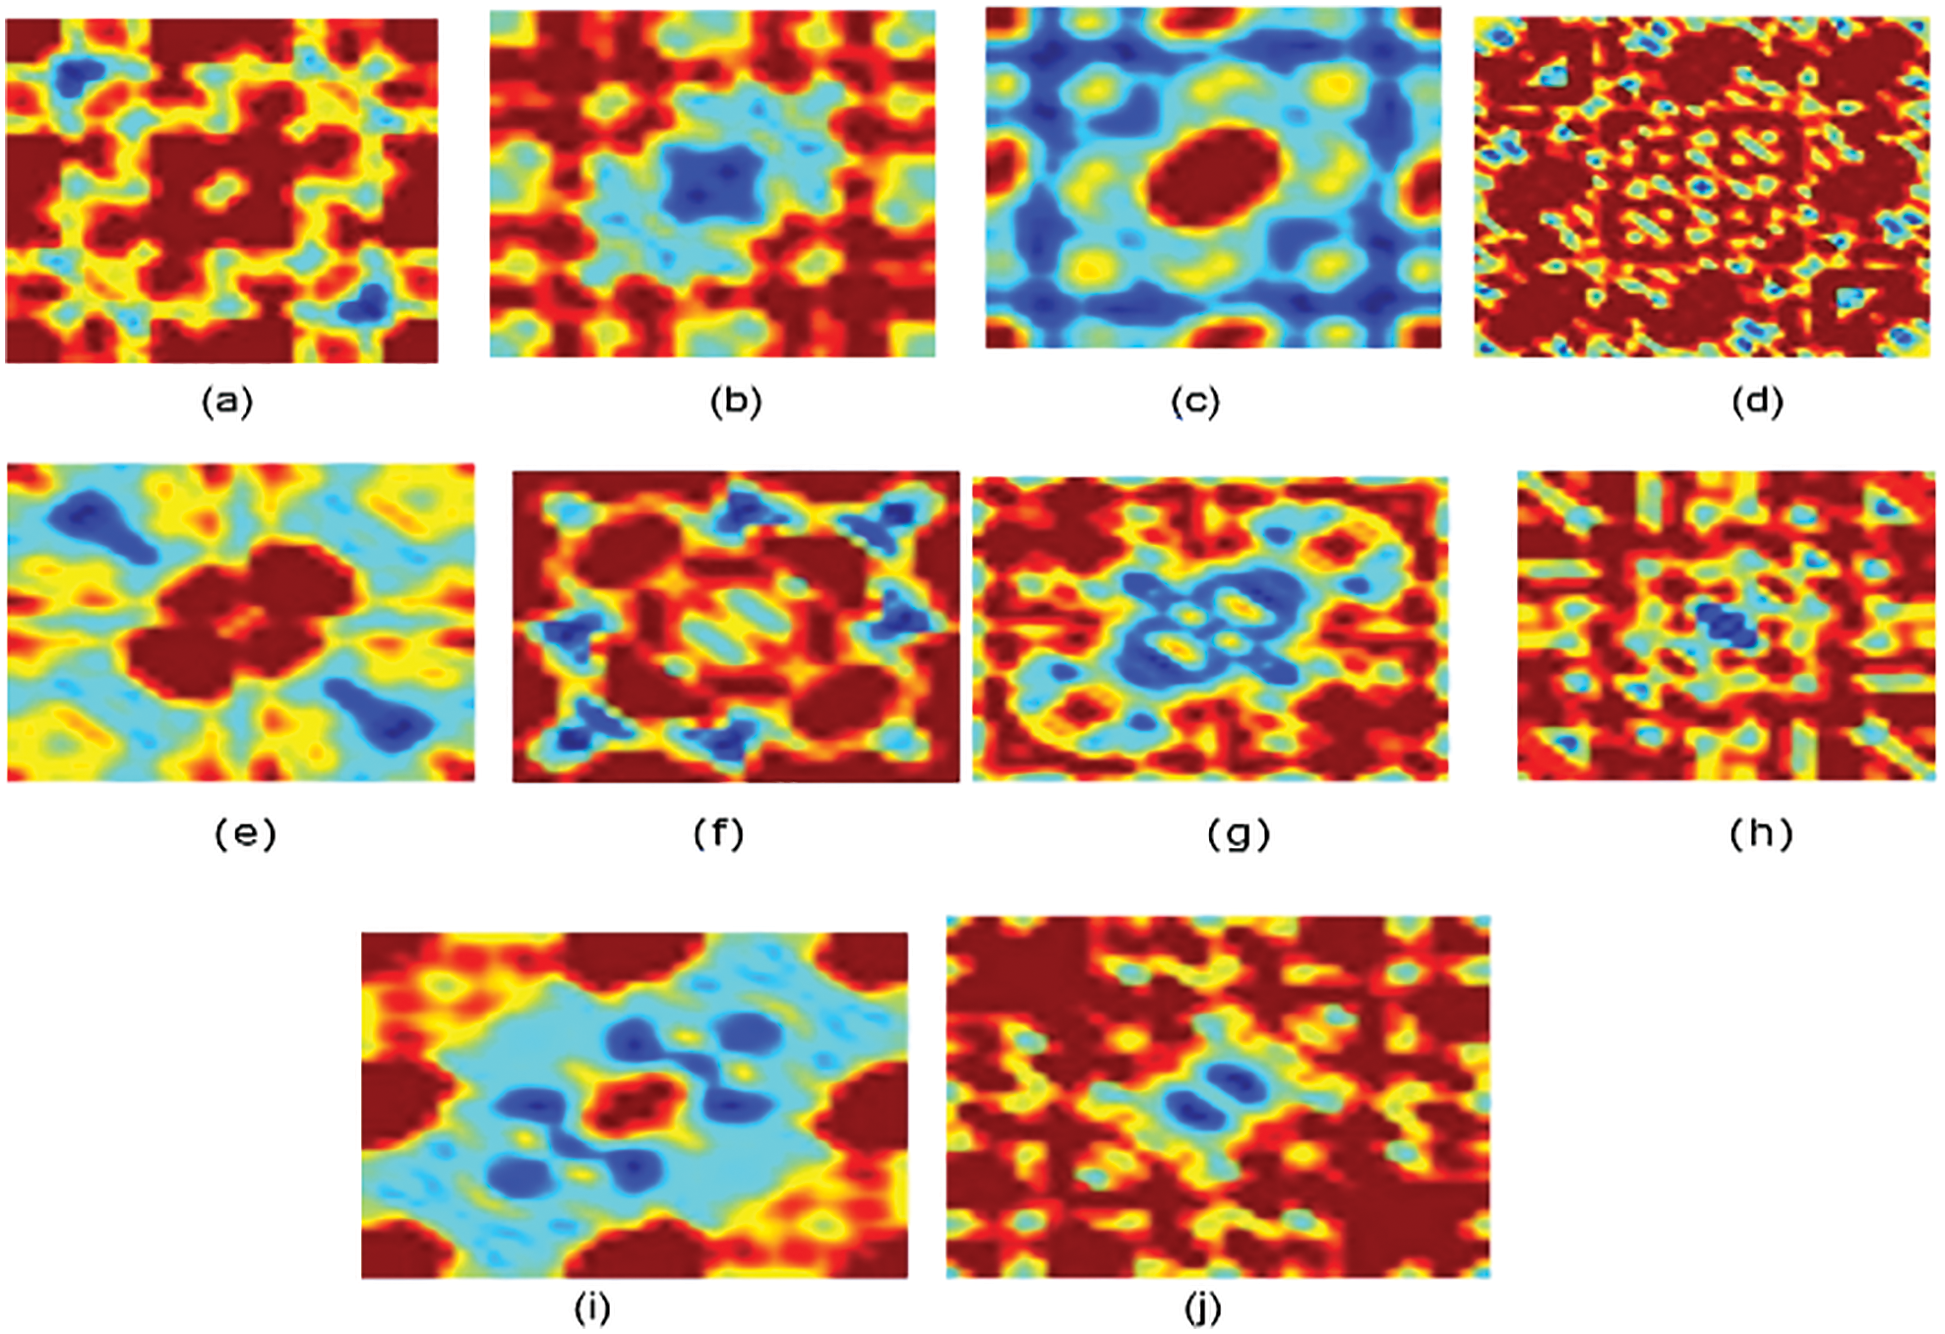
Figure 3: Bispectrum for some protein sequences in each class for normalized encoding approach (a) Family 1, (b) Family 2, (c) Family 3, (d) Family 4, (e) Family 5, (f) Family 6, (g) Family 7, (h) Family 8, (i) Family 9, (j) Family 10
Fig. 3 displays the bispectrum images for the normalized coding approach. The pattern for each family is distinguished.
Deep Learning is a subfield of Artificial Intelligence (AI). It is a state-of-art technology that learns from the available data without requiring explicit extracting features and pre-processing stages. The main challenge of deep learning is the availability of big datasets to learn. Therefore, there is a need to increase the availability of data in medical fields. The main point to solve that obstacle is the usage of pertained networks on large datasets such as ImageNet and utilizing the benefits of transfer learning to be compatible with the presented task for classification of the available dataset [35].
CNN is one of the most known deep learning models for image classification patterns based on extracting features from low to high levels automatically and adaptively. It consists of different layers, such as (convolutional layers, pooling layers, and fully connected layers). Note that the first two layers extract the descriptors, while the last map features their appropriate output classes [35,36].
Residual Networks are types of CNNs deep learning structures, presented in 2015 by Kaiming He. It differs from existing CNNs by its residual blocks that focus on skipping some layers and solving the vanishing gradient issues of the existing CNNs due to the high numbers of deep layers. Depending on the number of layers used to build Residual Neural Network (ResNet) models, multiple versions of ResNet depend on the number of layers in deep learning codded as ResNet-Number of layers. For example, ResNet-18, ResNet-50, ResNet-101, and ResNet-152. In this paper, ResNet-101 is utilized with transfer learning techniques for the last fully connected layer to be compatible with ten classes [36]. Table 2 describes the detailed structure of ResNet-101 [37].
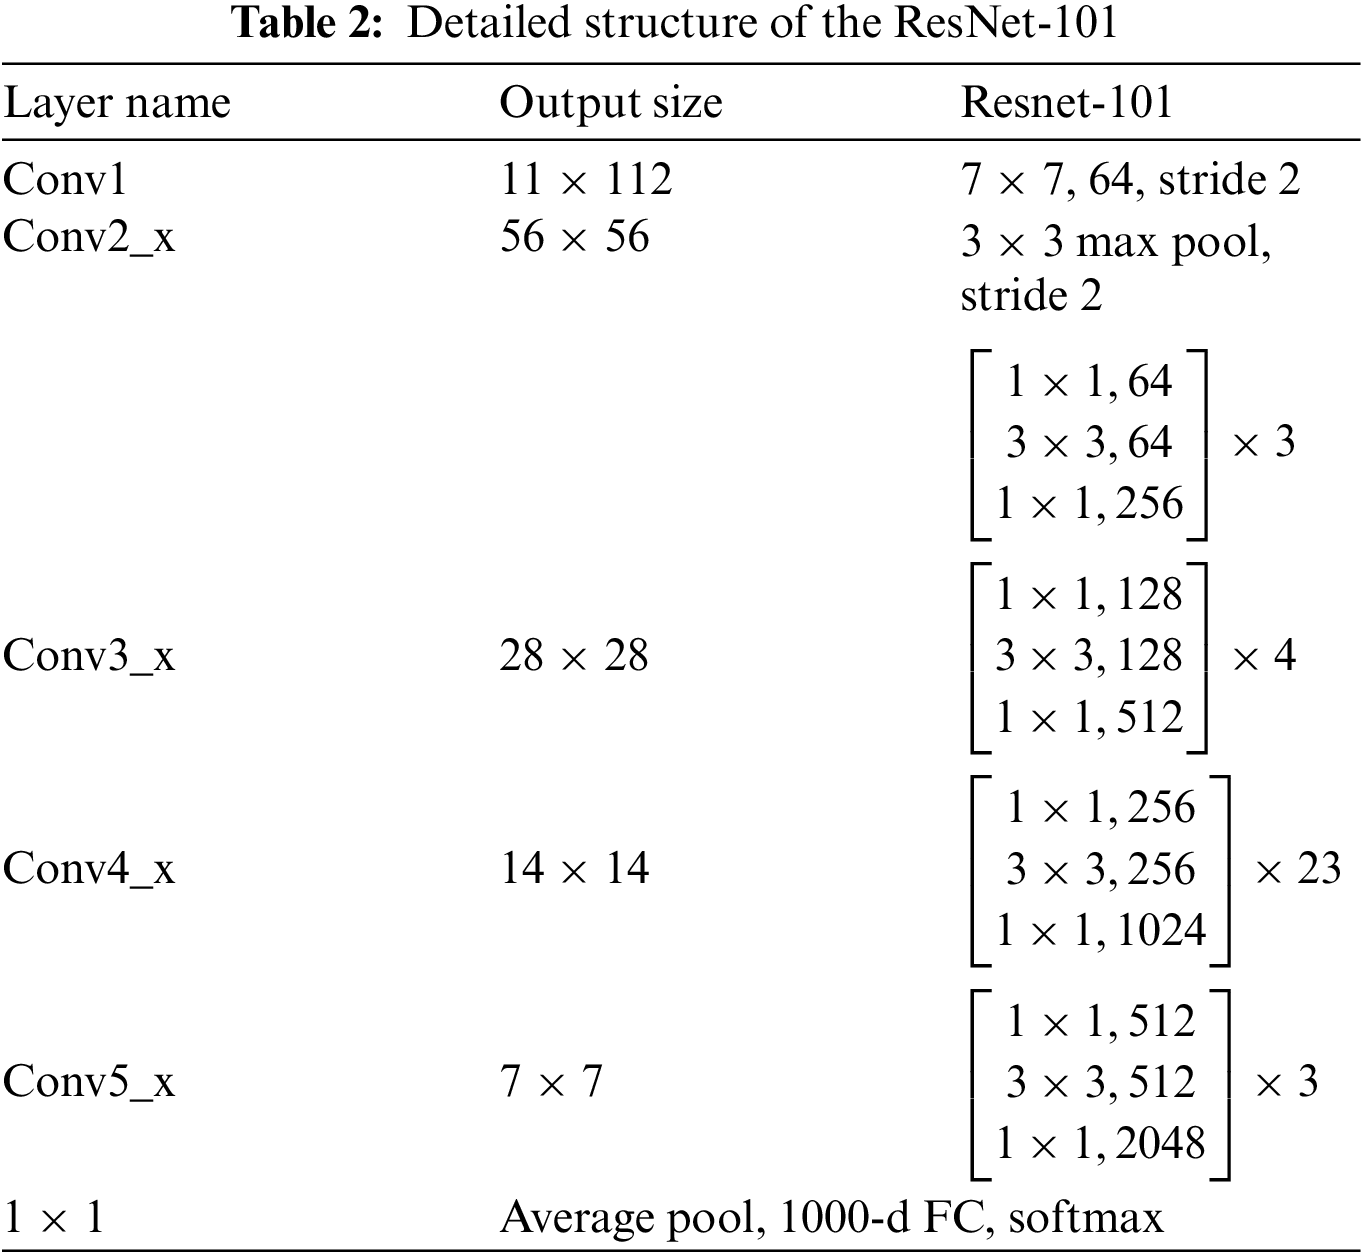
The size of input images is 224
The generated images for all protein sequence families are passed to the pre-trained deep learning structure ResNet-101. Other than that, transfer learning is employed in the structure to obtain the same class number in the last fully connected layer. Ten families are recognized using the proposed deep learning model approach.
For both normalized and non-normalized encoding systems, the confusion matrix is generated. The confusion matrix in Fig. 4 illustrates the results for non-normalized encoding systems. It explains the performance of the ResNet-101 deep learning model in the classification of the resultant bispectrum images for each protein’s sequence in the selected 10 families. From Fig. 4, 90 sequences are distinguished from 114 in Family 1, with a sensitivity that does not exceed 79.8% and a precision of 72.2%. Meanwhile, Family 2 obtains a lower recall value of 52.6% for 60 correctly classified sequences among 114. Its positive predictive value is 57.1%. However, Family 3 is discriminated by 84 sequences from 114. The true positive rate does not exceed 73.7%, while the precision is 86.6%. The worst discriminated family is Family 4, with a sensitivity reaching 48.2% and a precision of 42.6%. In other words, only 55 sequences are correctly classified from 114. On top of that, 91 cases are classified correctly among 114 total cases from Family 5. The recall is 79.8%, and PPV is 78.4%. The performance of the deep learning structure in discriminate Family 6 among all families is as follows; only 86 cases are correct from 114 with a sensitivity of 75.4% and precision of 86%. The proposed approach attempts to distinguish Family 7 with the highest sensitivity reaching 93.9%, and the best precision reaching 94.7%. The number of correctly classified sequences is 107 from 114. In Family 8, the performance is moderate, achieving a 78.9% true positive rate and a positive predictive value of 80.4%, where 99 cases are addressed correctly from 114. Furthermore, only 57 cases are discriminated against in Family 9 from 114 sequences. Therefore, the performance is 47.5% in Family 9 and recall does not exceed 50%. The performance in Family 10 is better than 9, with a higher number of correctly classified cases, almost 83 from 114, having a sensitivity of 72.8% and a precision of 68%. The results for a non-normalized encoding system with a deep learning approach are summarized in terms of overall accuracy, which does not exceed 70.5%.
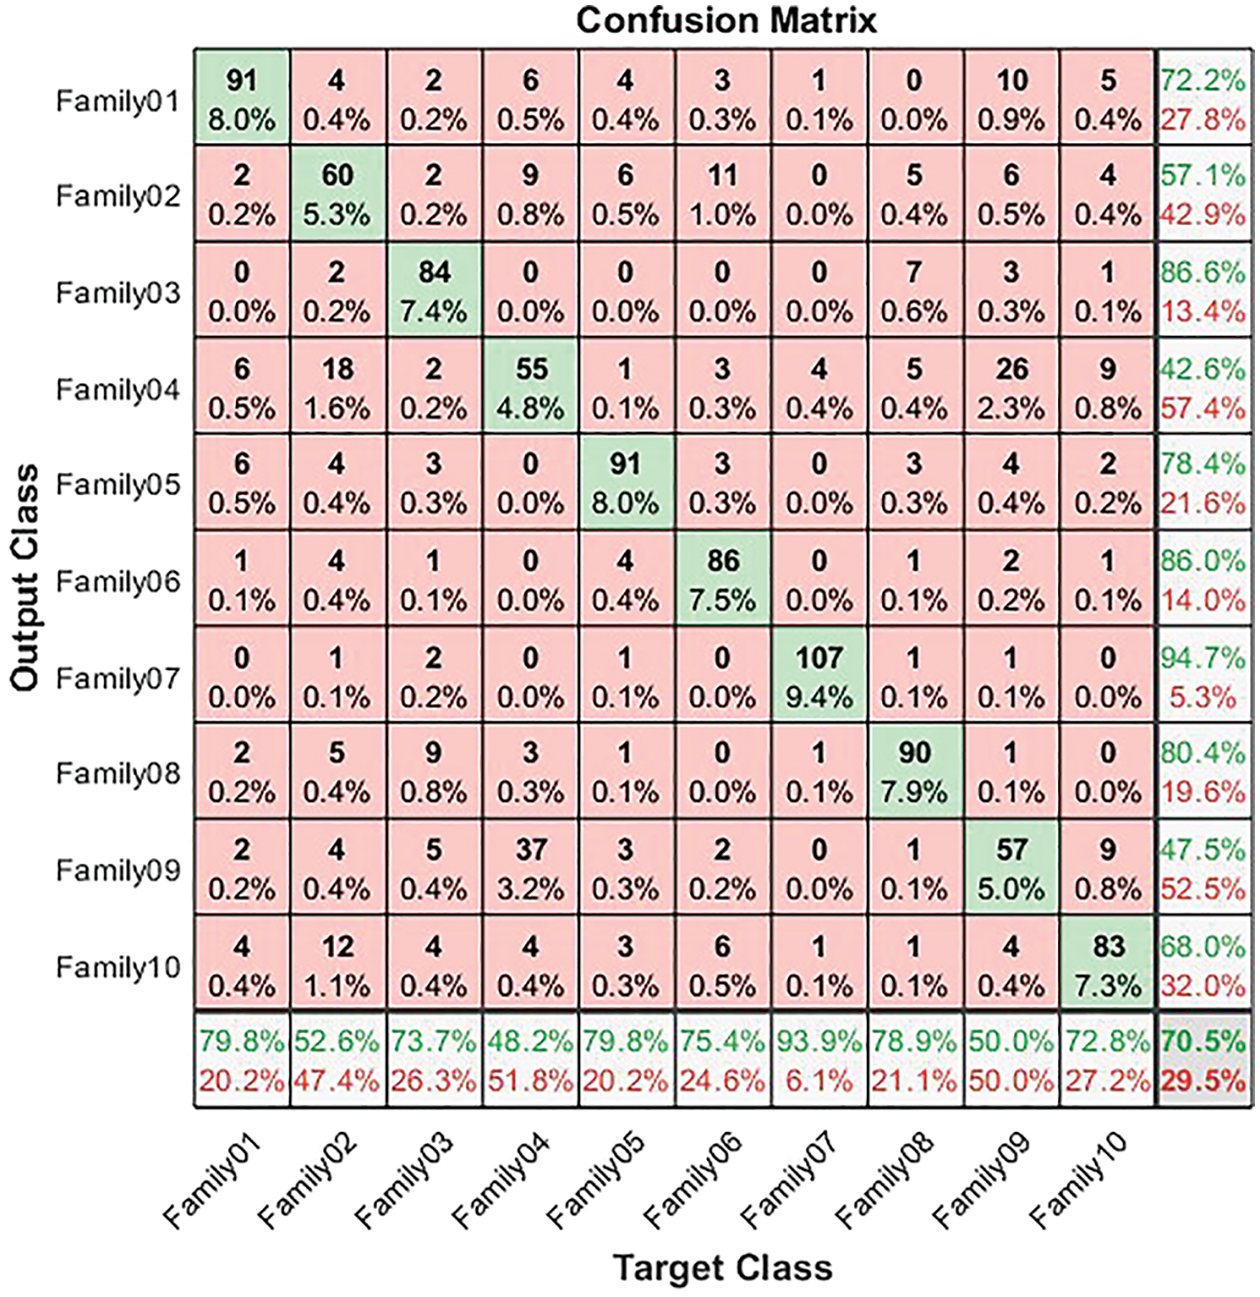
Figure 4: Confusion matrix for non-normalized coding system
Fig. 5 summarizes the results of the normalized approach.
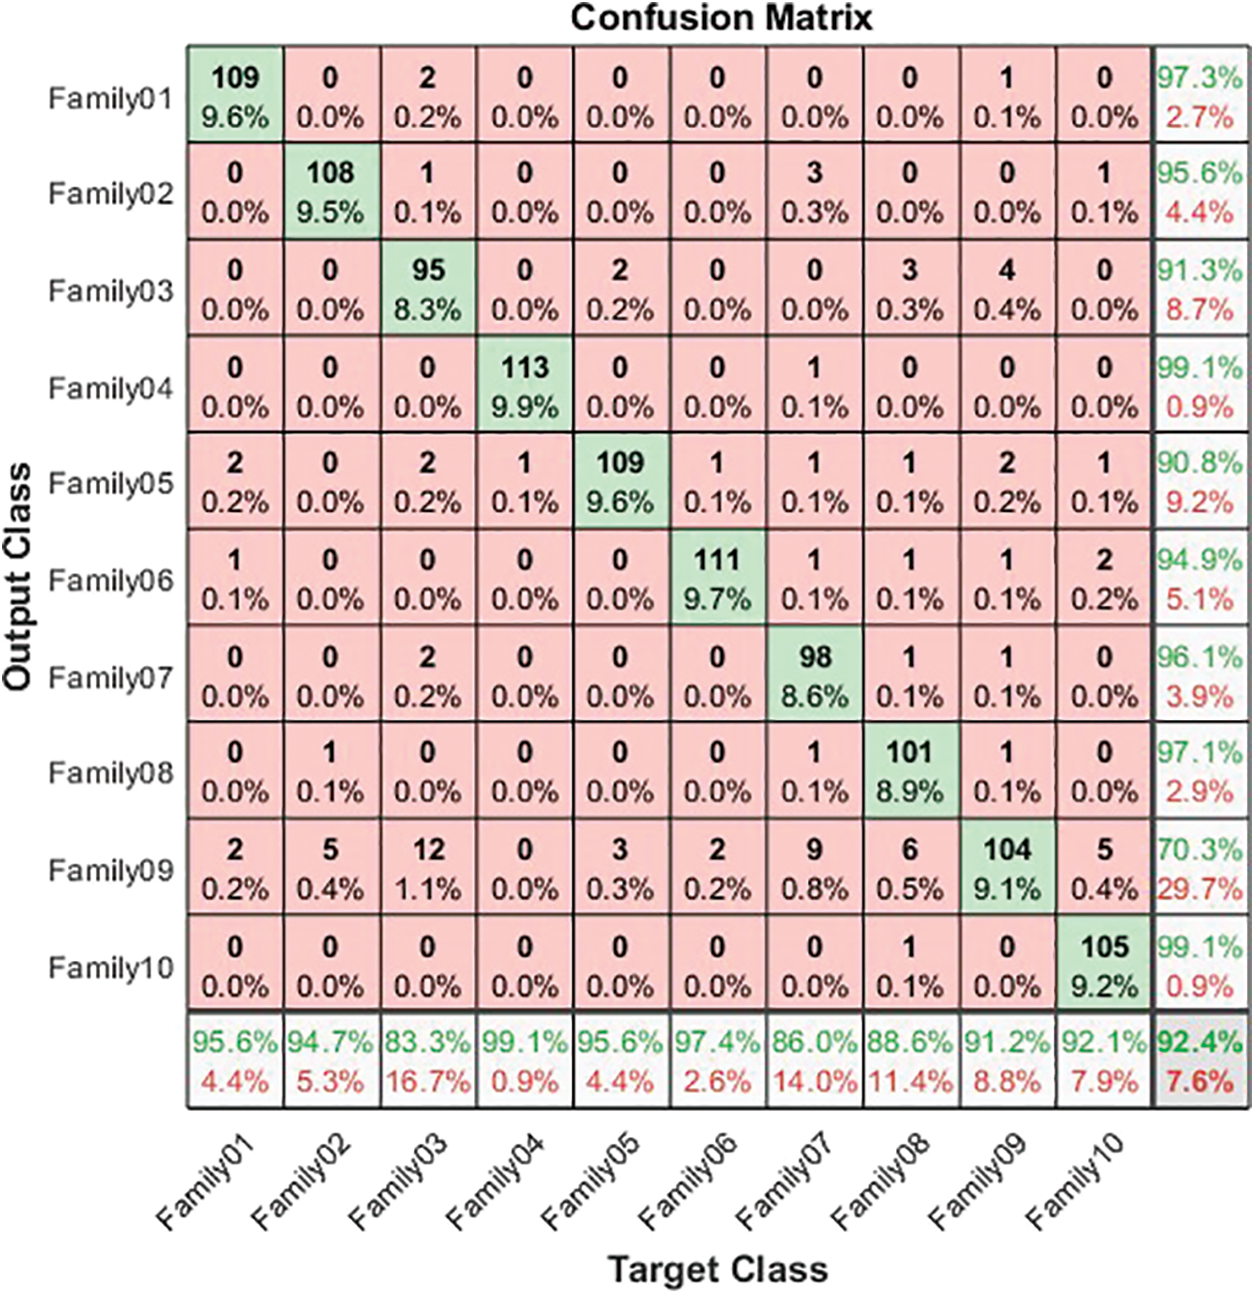
Figure 5: Confusion matrix for normalized coding system
The normalized case results show that 109 sequences out of 114 in Family 1 are correctly classified, with a sensitivity of 95.6% and a misclassification rate of 4.4%, with a precision of 97.3%. Family 2 has a lower sensitivity of 94.7% for 108 correctly classified sequences out of 114. Their precision is 95.6%. However, Family 3 performs the worst of all protein families, with only 95 of 104 sequences correctly separated, having a precision of 92.3% and a sensitivity of 83.3%. Type 4 is the most discriminated family, with a sensitivity and precision of 99.1% and a misclassification rate of 0.01. In contrast, 109 of the 114 cases identified in Family 5 are correctly classified. The sensitivity is 95.6%, and the precision is 90.8%. The pre-trained CNN structure performs better in distinguishing Family 6 from all families. Its output is 111 correct cases out of 114, with a sensitivity of 97.4% and a precision of 94.9%. The proposed method attempts to distinguish Family 7 with 86% sensitivity and 96.1% precision. From a total of 114 sequences, 93 have been correctly classified. Family 8 performs better, with a true positive rate of 88.6% and a positive predictive value of 97.1%. Families 9 and 10 have almost identical results regarding sensitivity. Nonetheless, Family 9 is the worst regarding precision, whereas Family 10 is the best in positive predictive value. The overall accuracy of the proposed system is 92.4%. Table 3 summarizes the results regarding sensitivity and precision for two encoding methods. On the other hand, Fig. 6 demonstrates the resultant performance for two scenarios.
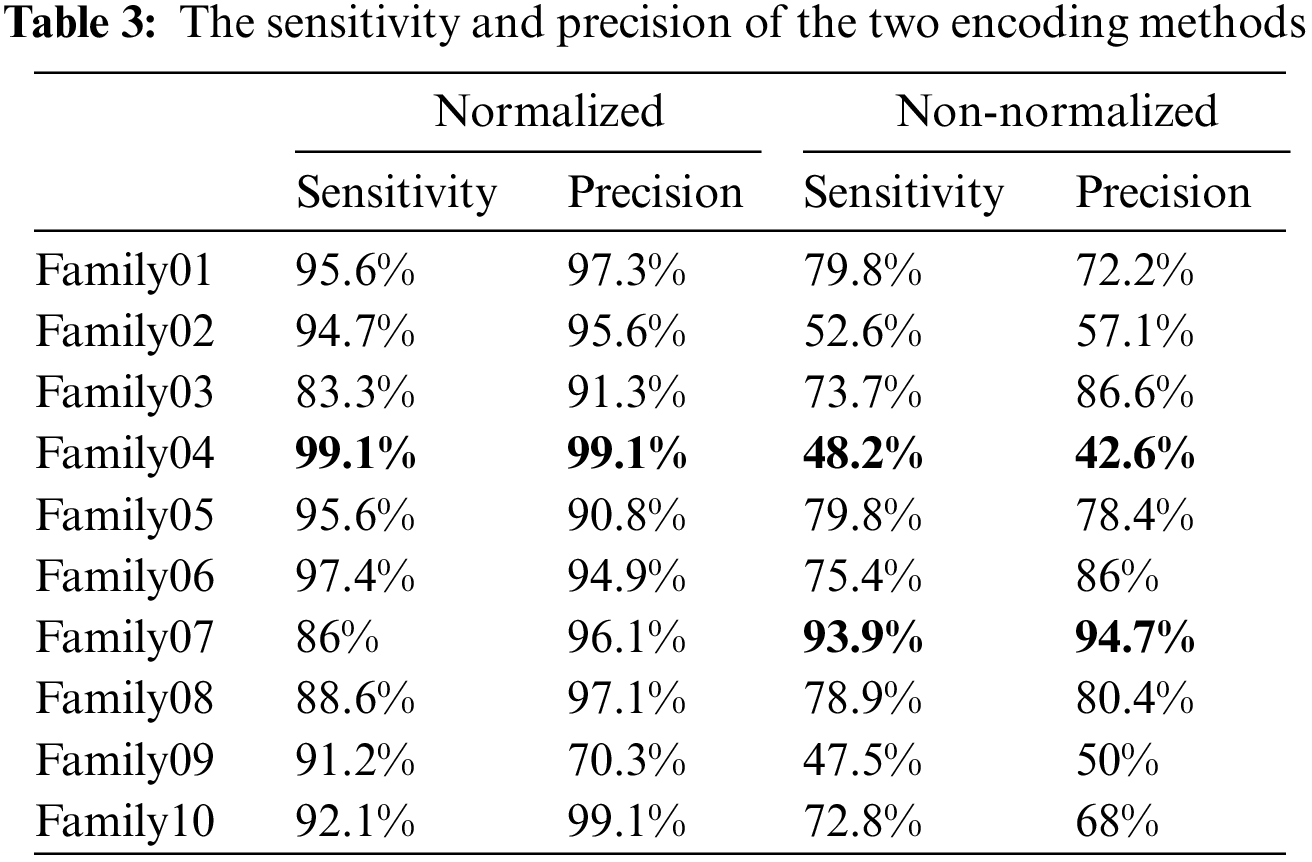
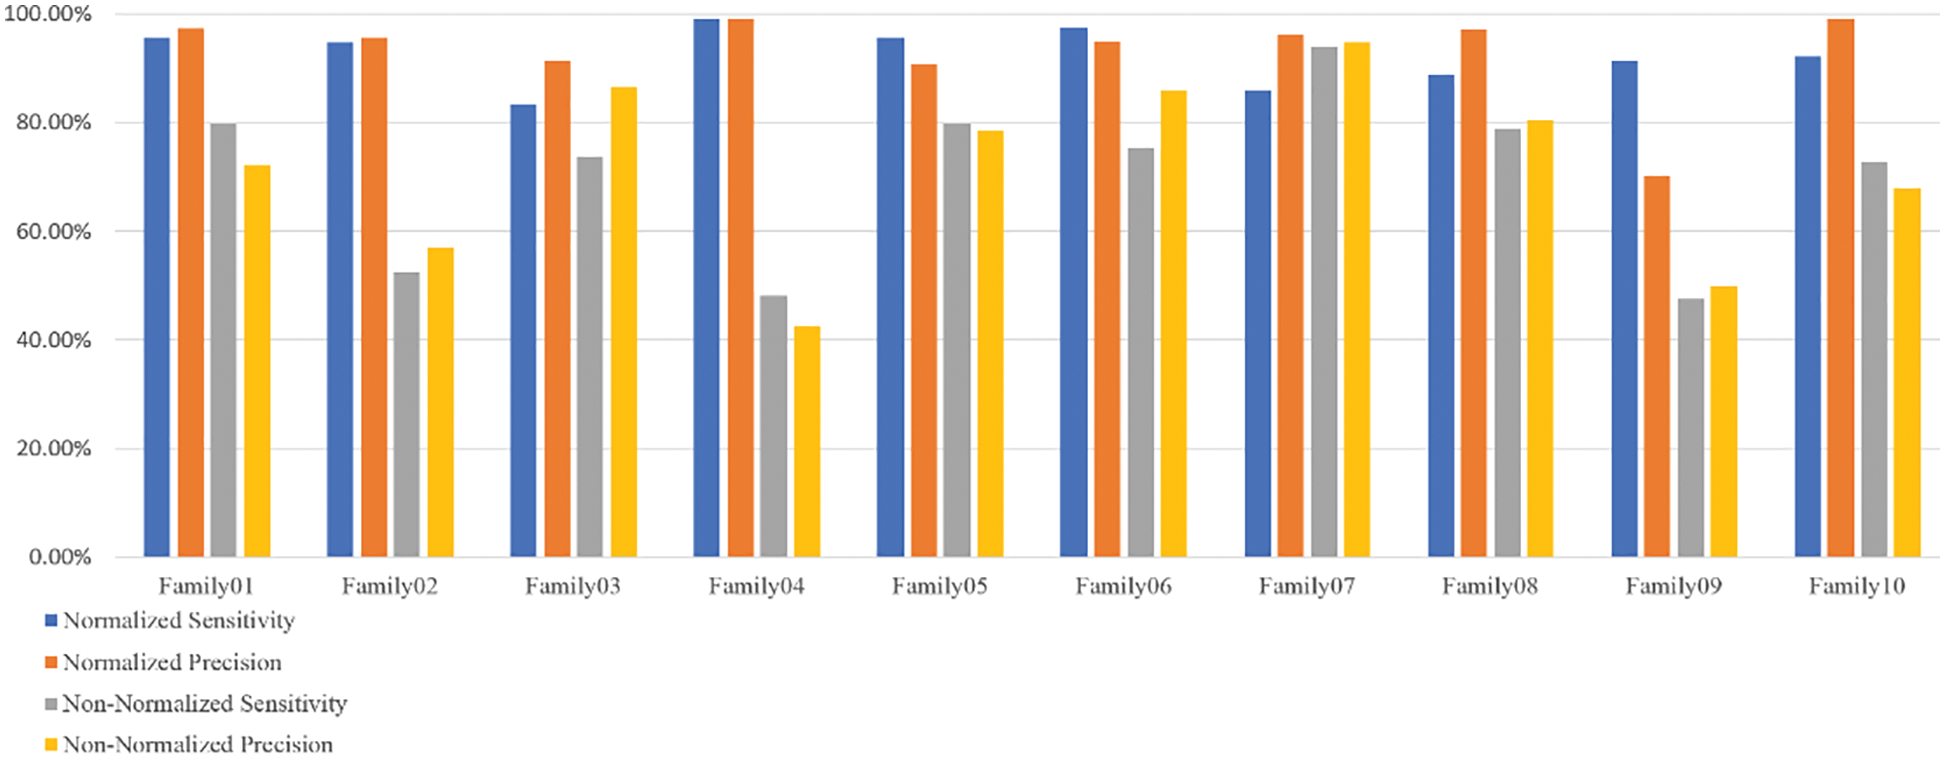
Figure 6: The sensitivity and precision of two encoding systems
Table 3 displays that Family 4 has the lowest sensitivity and precision for a non-normalized encoding system. However, the performance of the deep learning structure is the best for the normalized encoding approach, following the resultant bispectrum images of Family 4 sequences. Therefore, it leads to extracting more representative features than other families. In contrast, the issue is the lowest for the non-normalized, where the resultant images lack details, and the deep learning model could not extract more representative descriptors.
Another scenario was also explored to test the robustness of the achieved results. In this scenario, the total number of generated images is 3790 for ten families, with 379 for each family. The resultant bispectrum images were divided into 70% training (2650), 15% validation (570), and 15% testing (570). Ten families are recognized employing the proposed deep learning model approach for both non-normalized and normalized encoding methods. The parameters of the deep learning network are kept as in the previous scenario.
The corresponding confusion matrix presents the test results for the non-normalized encoding approach. The confusion matrix in Fig. 7 illustrates the results for non-normalized encoding systems. As is clear from Fig. 7, 46 sequences are distinguished from 57 in Family 1, with a sensitivity that does not exceed 80.7% and a precision of 71.9%. Meanwhile, Family 2 obtains a lower recall value of 73.7% for 42 correctly classified sequences among 57. Its positive predictive value is 50%. However, 46 of the 57 sequences distinguish Family 3. The true positive rate does not exceed 80.7%, while the precision is 78%. The worst-discriminated family is type 4, with a sensitivity reaching 43.9% and a precision of 49%. In other words, only 25 of the 57 sequences are correctly classified. On top of that, 39 cases are classified correctly among the 57 total cases in Family 5. The recall is 68.4%, and the PPV is 79.6%. The performance of the deep learning structure in discriminating Family 6 among all families is as follows: only 43 cases out of 57 are correct, with a sensitivity of 75.4% and a precision of 84.3%. The proposed method attempts to distinguish family 7, which has the highest sensitivity (98.2%) and precision (75.7%). The number of correctly classified sequences is 56 out of 57. In Family 8, the performance is moderate, which achieves a 73.7% true positive rate and a positive predictive value of 89.4%, where 42 cases are addressed correctly from 57. Furthermore, only 22 out of 57 are discriminated against in Family 9. As a result, the PPV performance is 46.8%, and the recall is less than 38.6%. Moreover, the performance in Family 10 is better than in Family 9, with a higher number of correctly classified cases, comprising almost 28 out of 57. Their sensitivity is 49.1%, and their precision is 63.6%. The results for a non-normalized encoding system with a deep learning approach are summarized in terms of overall accuracy, which does not exceed 68.2%. Moreover, the validation accuracy is 70.5%.
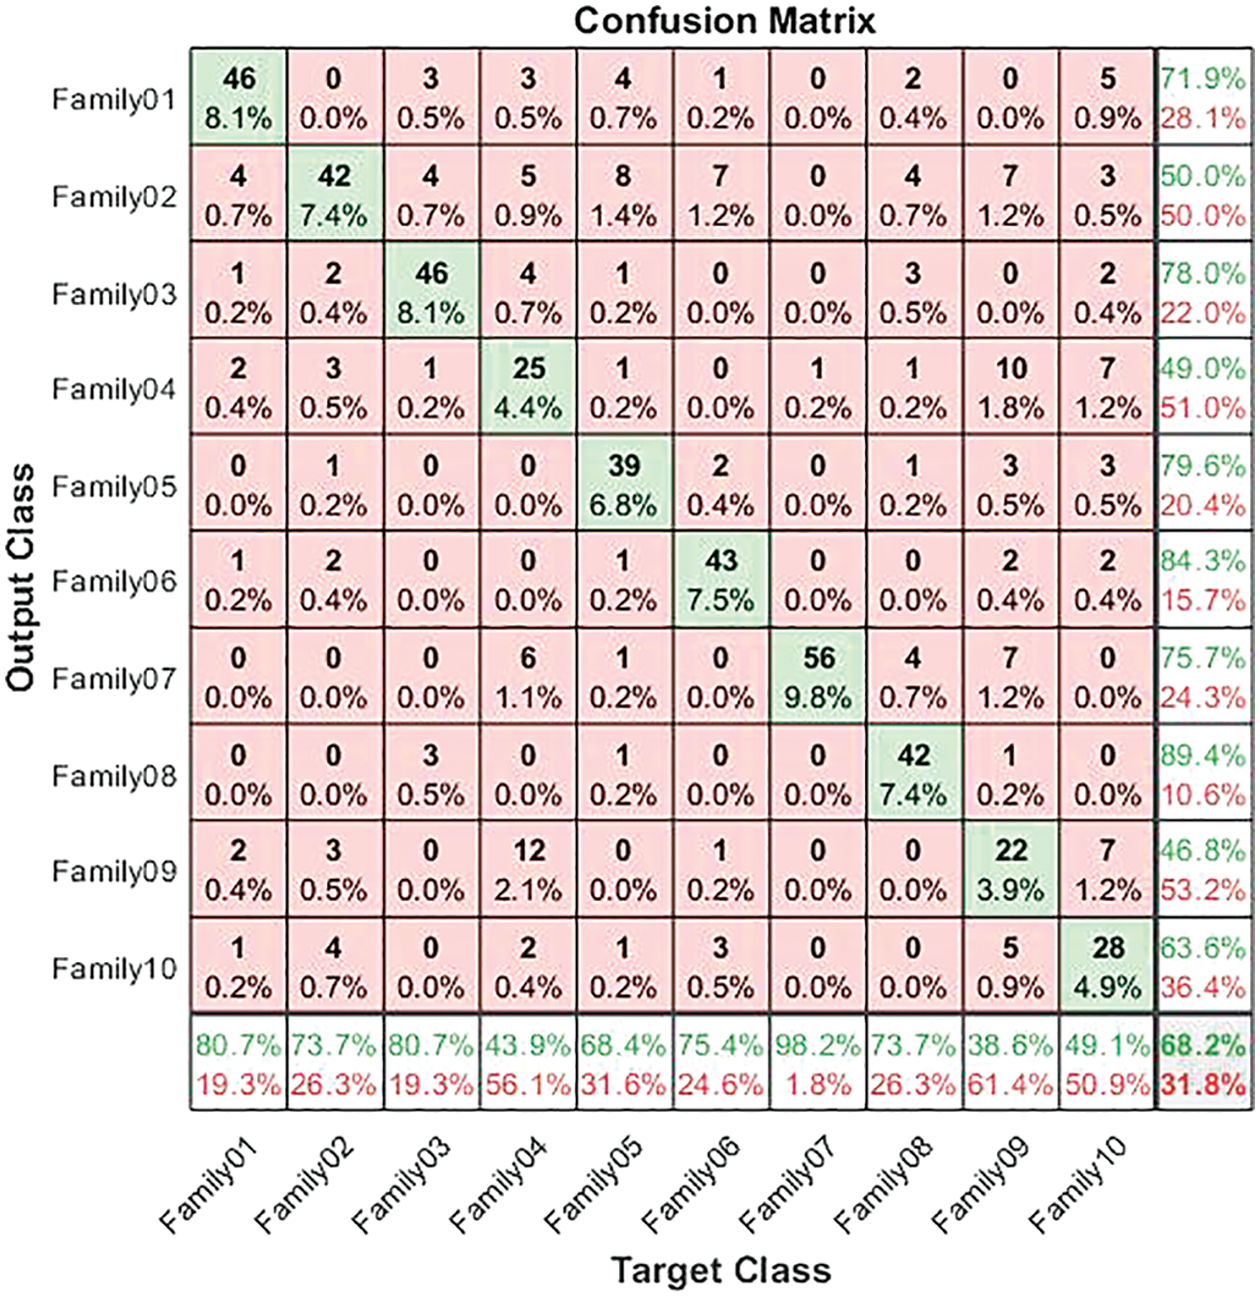
Figure 7: Confusion matrix for non-normalized coding system
The receiver operating characteristics (ROC) describe the relationship between the sensitivity (true positive rate) and the specificity (false positive rate) for each class, as shown in Fig. 8. The area under the curve (AUC) is computed for each family separately. As AUC is close to 1, the designed classifier is much more sensitive to the specific class. Table 4 presents the AUC for each class. Family 7 has the highest AUC value, reaching almost 1, and the lowest AUC values are for Family04 and Family 9. Fig. 9 explains the precision-recall (PR) curve for the non-normalized approach, where the x-axis demonstrates the recall and the y-axis represents the precision. As is apparent, all classes have low values in both. The normalized, generated bispectrum images were utilized for training the pre-trained CNN model, with 70% training, 15% validation, and 15% testing. The corresponding confusion matrix describes the results of the normalized approach.
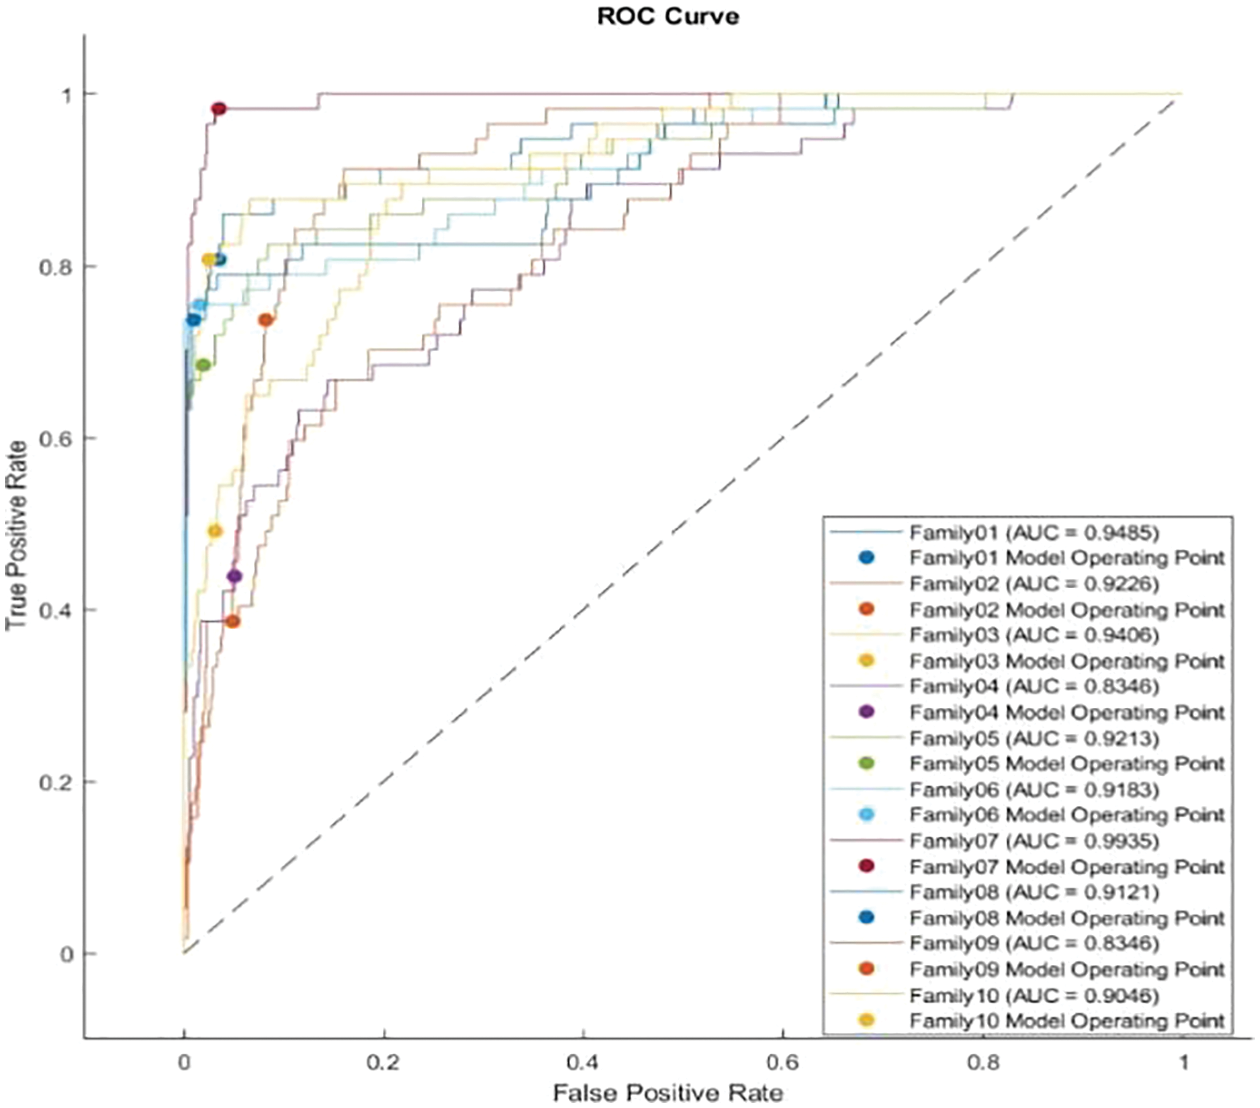
Figure 8: ROC curve for non-normalized encoding method
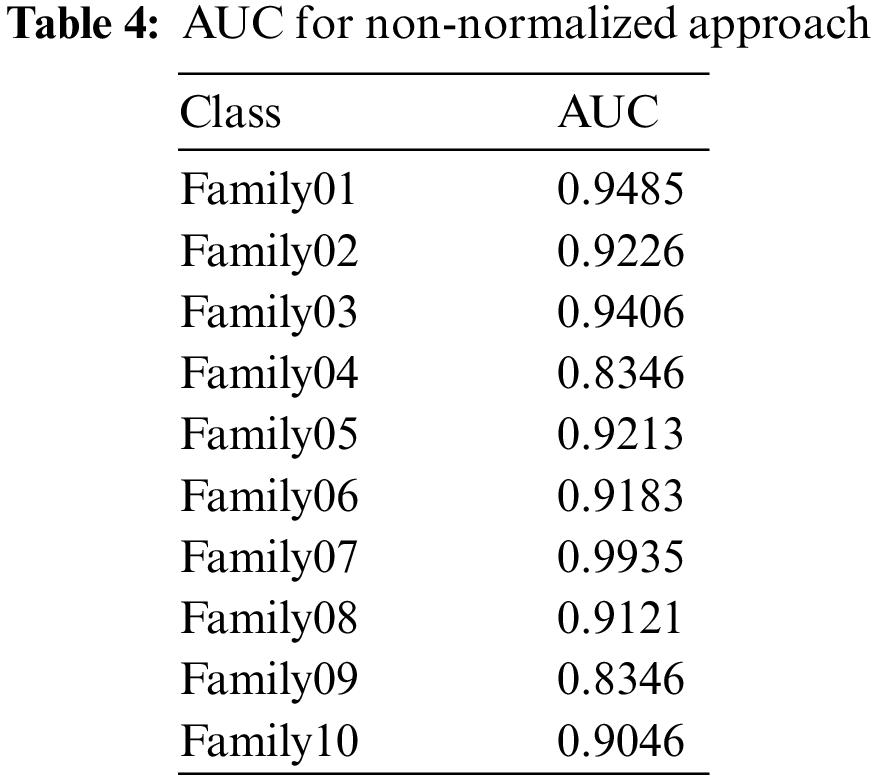
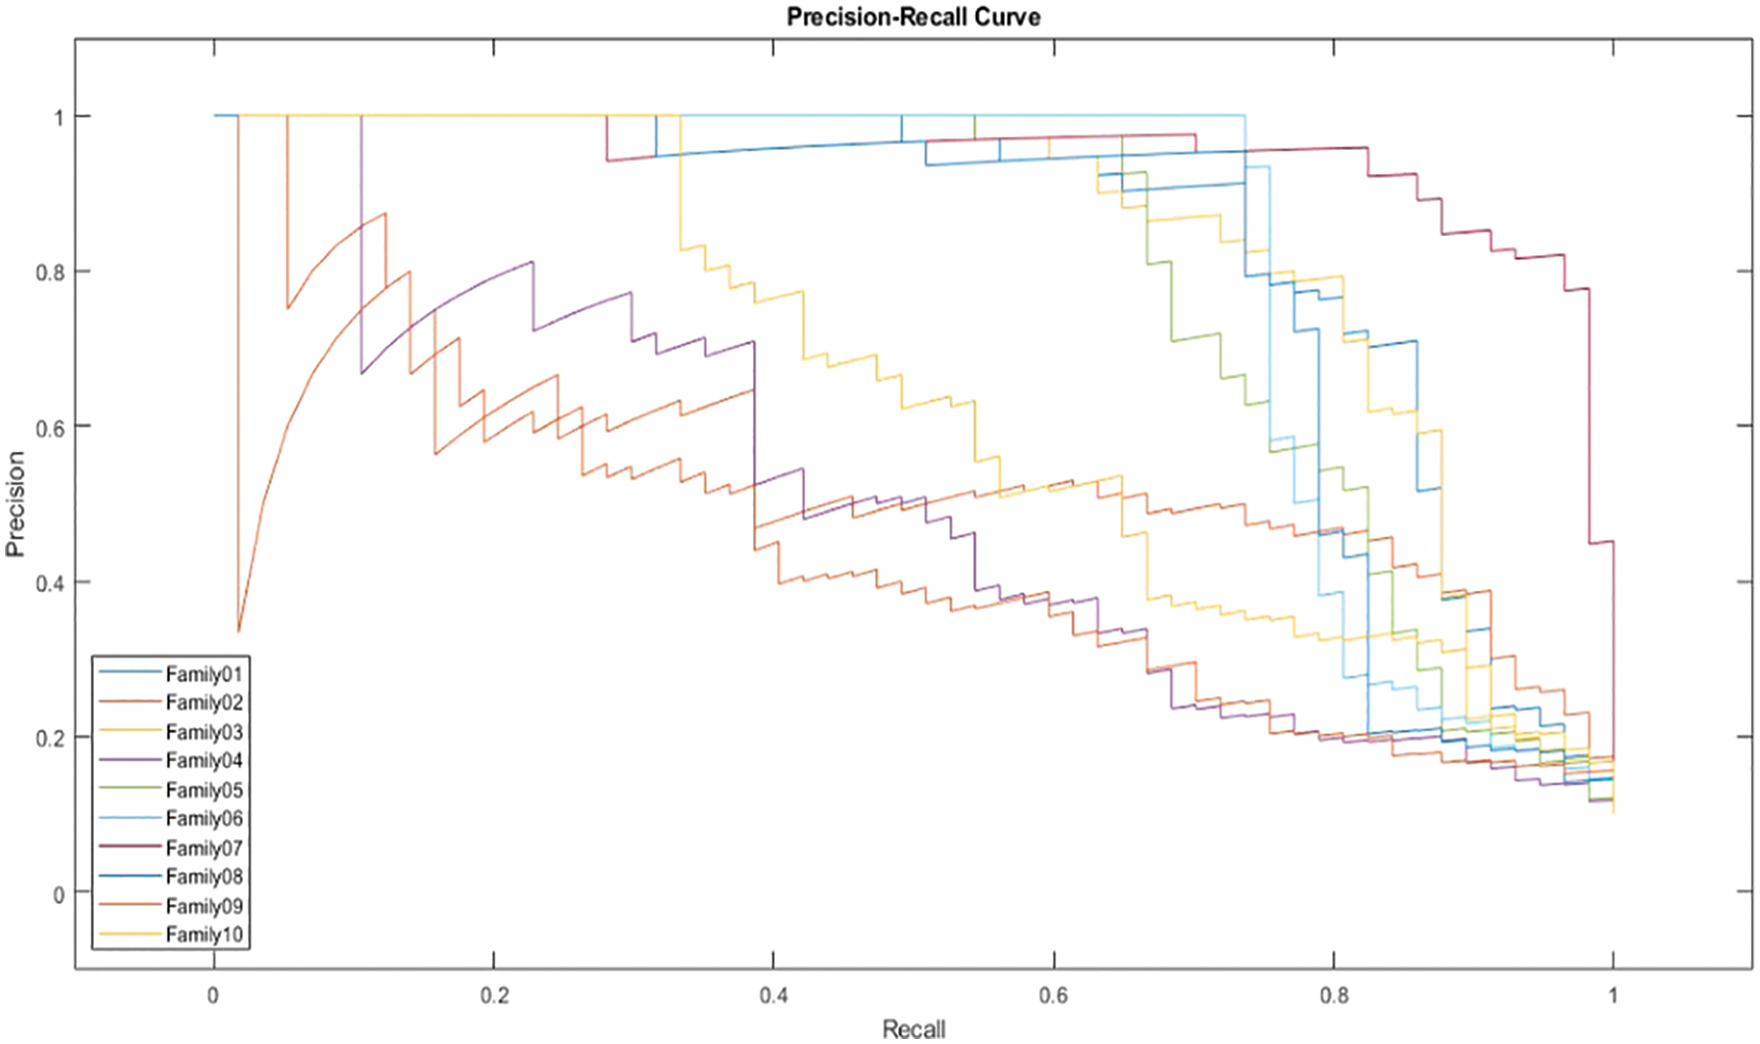
Figure 9: PR curve of non-normalized encoding method
The confusion matrix in Fig. 10 illustrates the results for non-normalized encoding systems.
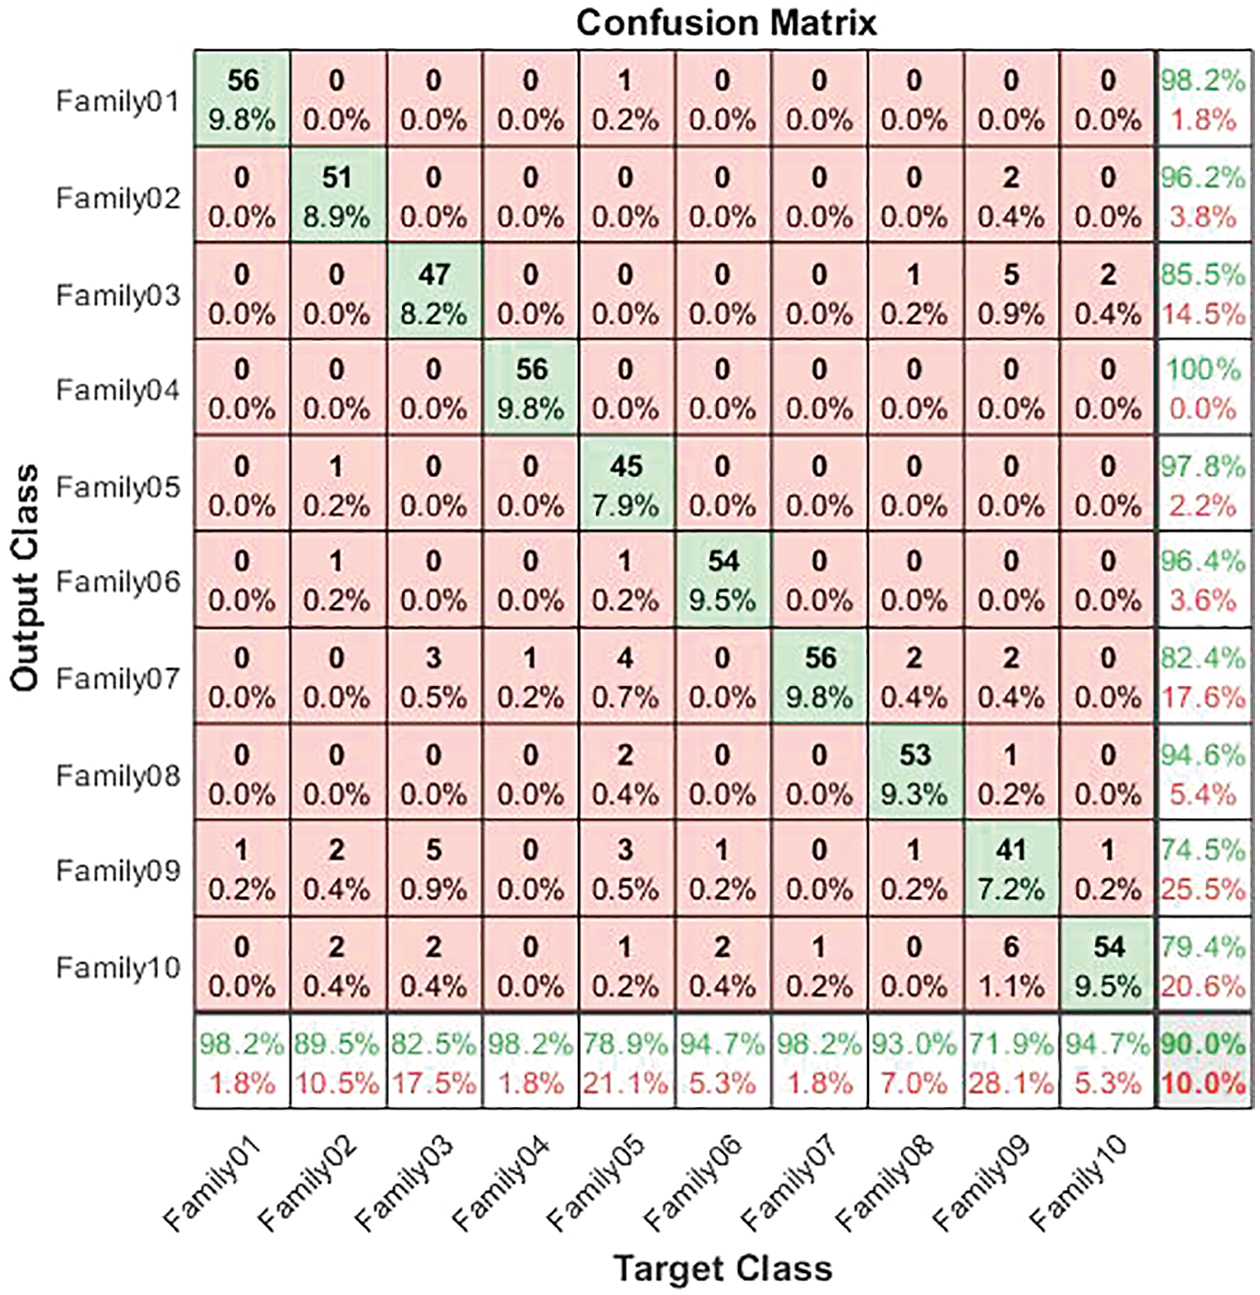
Figure 10: Confusion matrix for normalized coding system
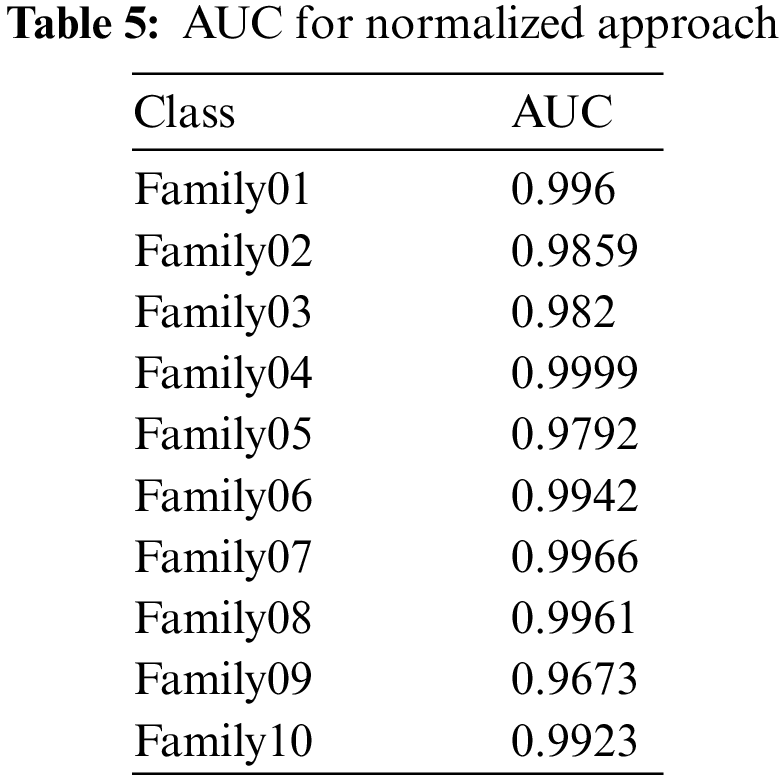
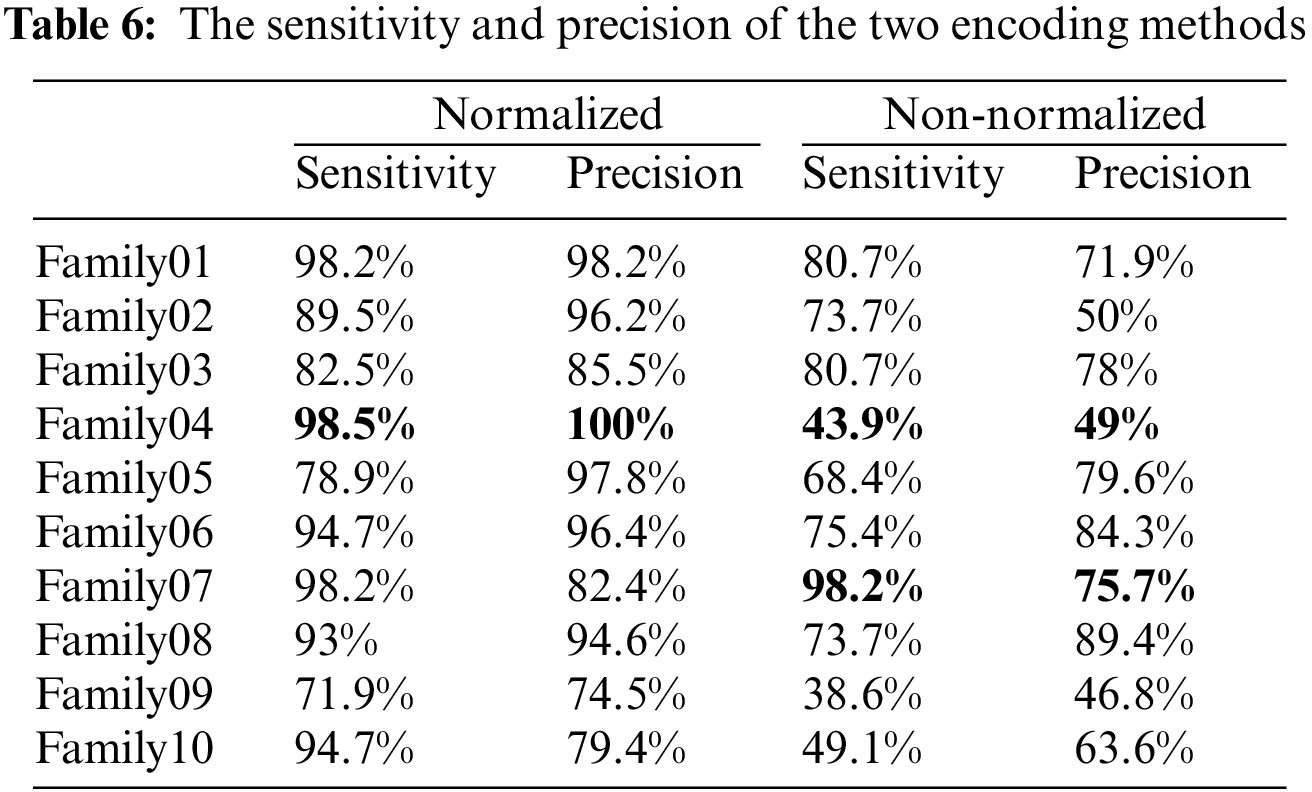
The normalized case results indicate that 56 sequences out of 57 in Family 1 are correctly classified, with a sensitivity of 98.2%, a misclassification rate of 1.8%, and an accuracy rate being 98.2%. Family 2 has a lower sensitivity of 89.5% for 51 correctly classified sequences out of 57. Their precision is 96.2%. However, Family 3 performs the worst of all protein families, with only 47 of 57 sequences correctly separated. It has a precision of 85.5% and a sensitivity of 82.5%. Family 4 is the most discriminated family, with a sensitivity of 98.2%, a precision of 100%, and a misclassification rate of 1.8%. In contrast, 45 of the 57 cases identified in Family 5 are correctly classified. The sensitivity is 78.9%, and the precision is 97.8%. The pre-trained CNN structure performs better at distinguishing Family 6 among all families. Its output is 54 correct cases out of 57, with a sensitivity of 94.7% and a precision of 96.4%. The proposed method attempts to distinguish Family 7 with 98.2% sensitivity and 82.4% precision. From a total of 57 sequences, 56 have been correctly classified. Nonetheless, Family 8 performs better, with a true positive rate of 93% and a positive predictive value of 94.6%. Families 9 and 10 have almost identical results in terms of sensitivity. However, Family 9 is the worst of all in terms of precision, whereas Family 10 is the best in terms of positive predictive value. The overall accuracy of the proposed system is 90%. Moreover, the validation accuracy is 91.5%. Fig. 11 demonstrates the results for the ROC curve in a normalized approach. The x-axis represents the false positive rate, and the y-axis is devoted to the true positive rate. Fig. 11 illustrates that all classes have nearly higher values of the true positive rate and higher values of the AUC, as described in Table 5.
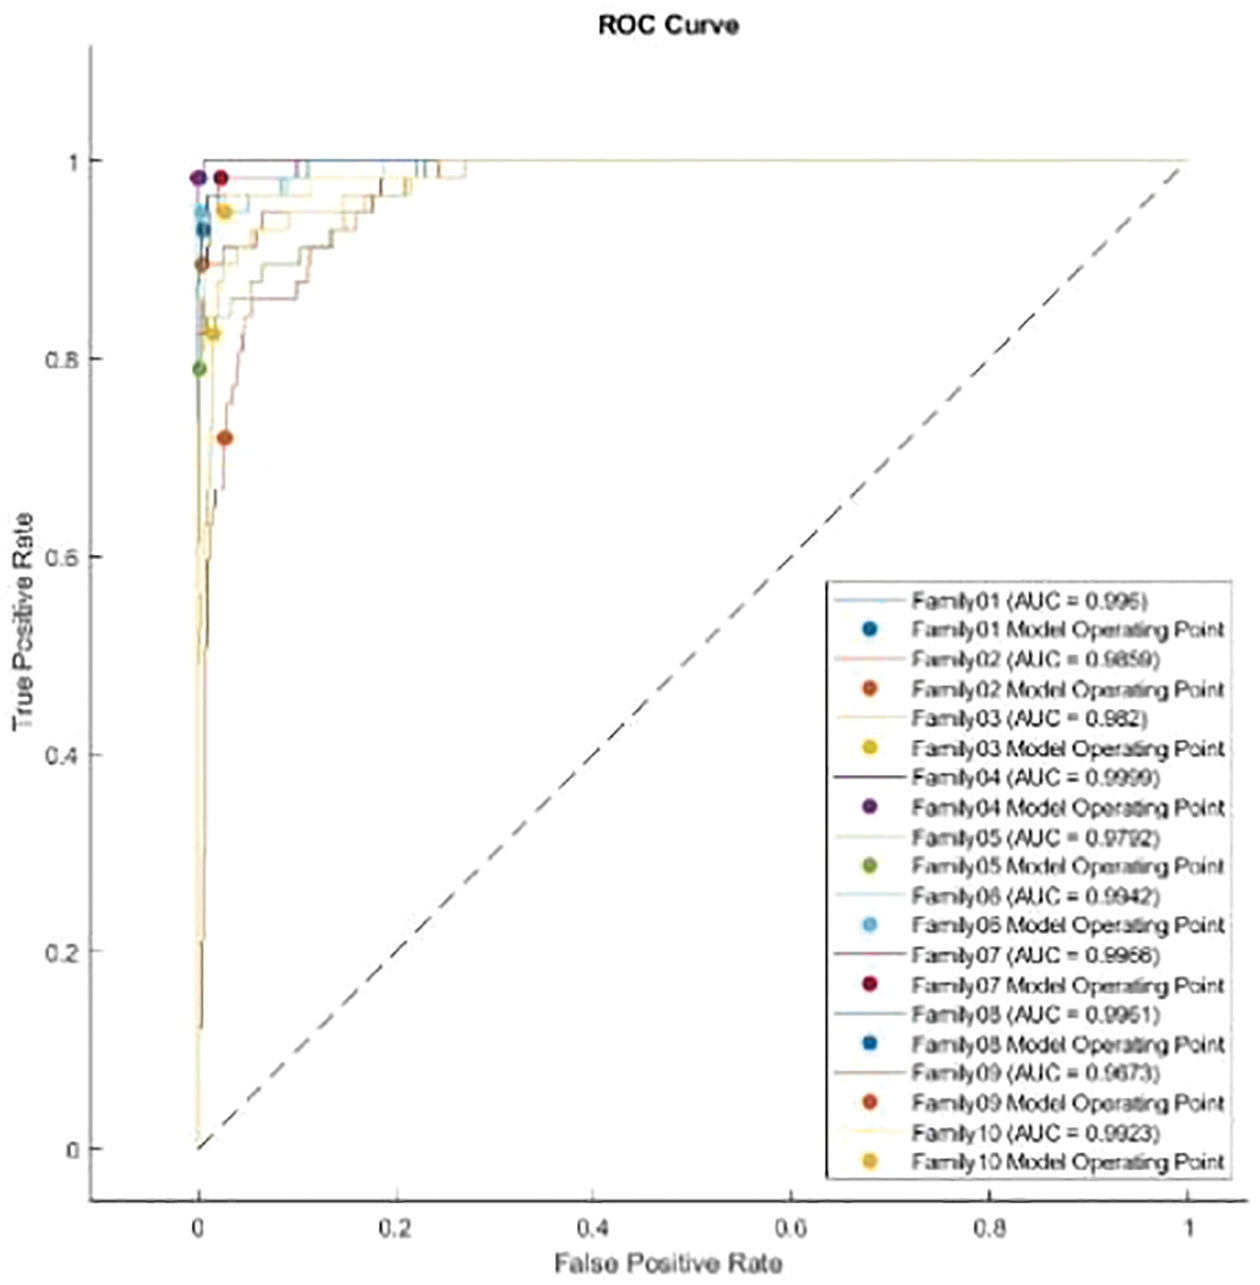
Figure 11: ROC curve for normalized approach
In Fig. 12, the PR curve is presented. The recall on the x- and y-axes describes the accuracy of all protein families. Fig. 13 illustrates how the proposed normalized encoding method enhances classification accuracy.
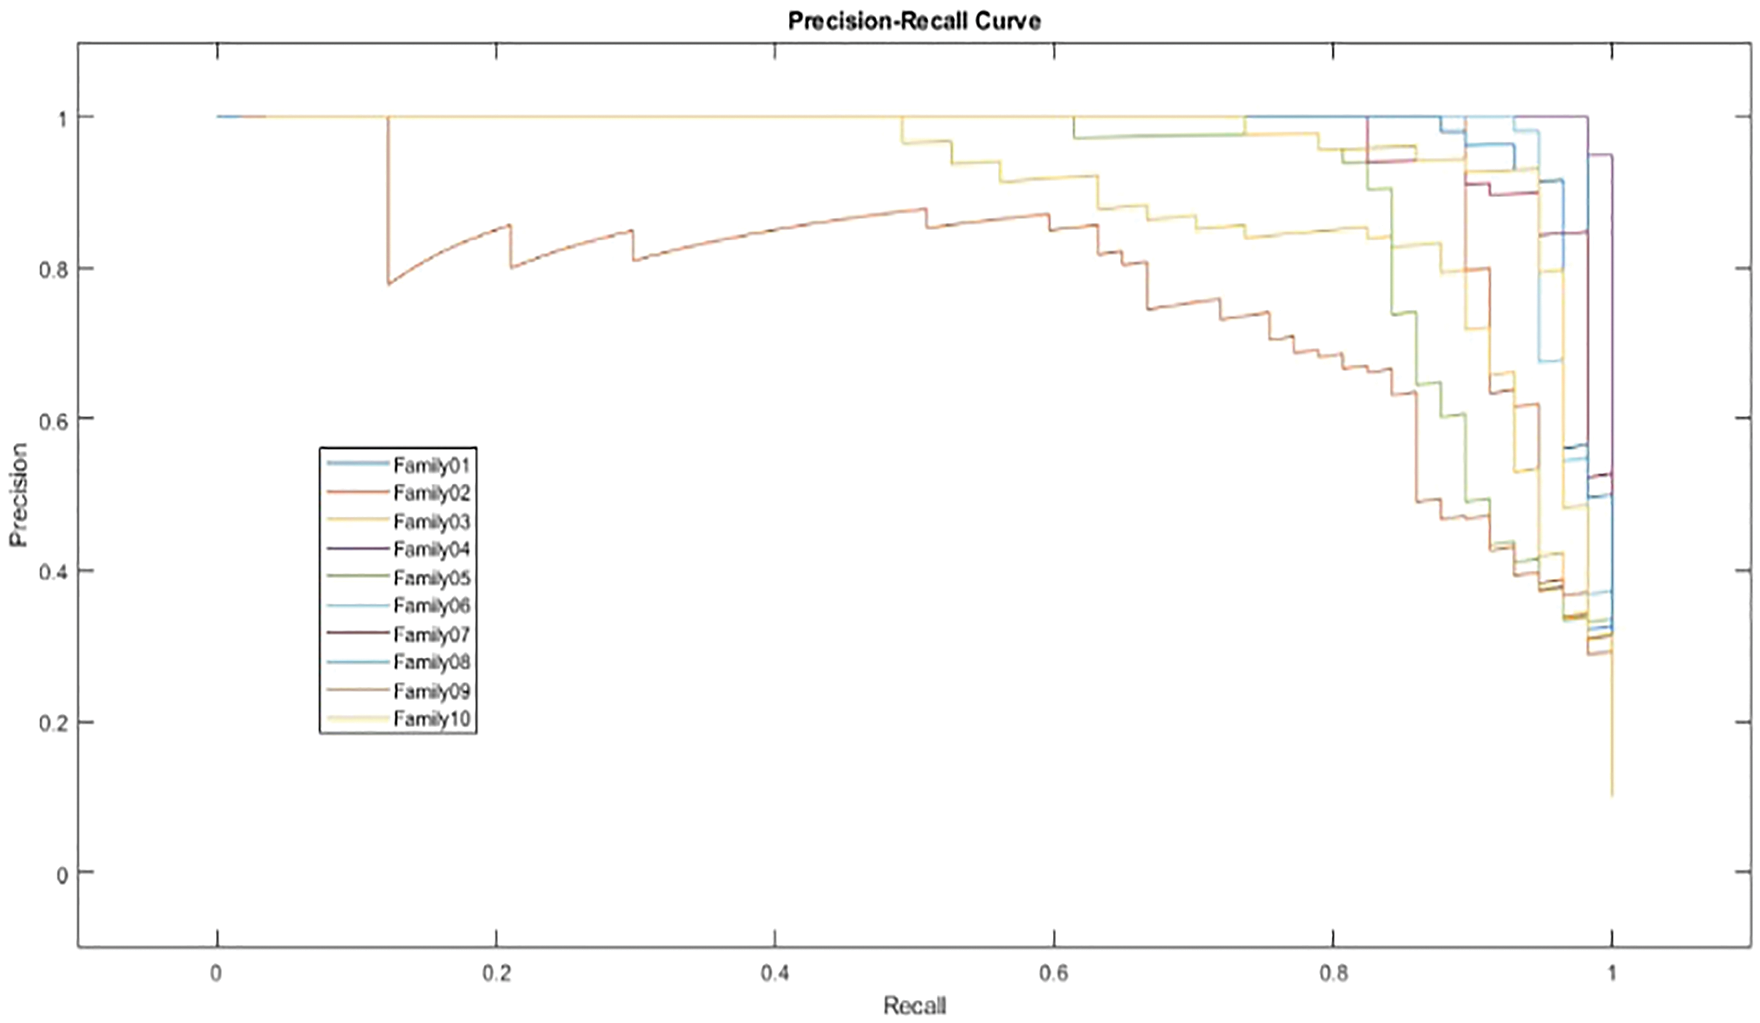
Figure 12: PR-curve for normalized approach
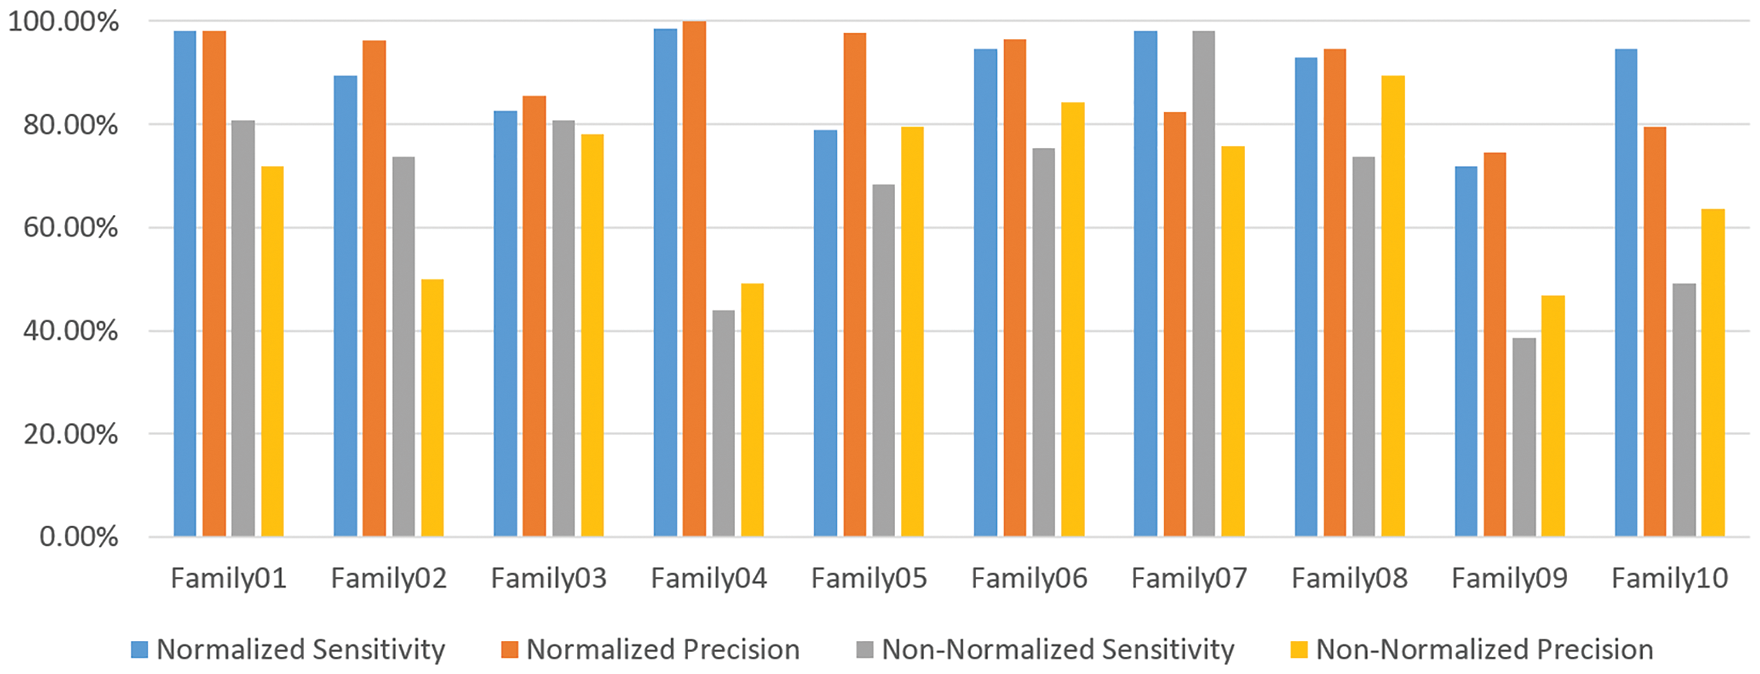
Figure 13: The sensitivity and precision of the two encoding systems
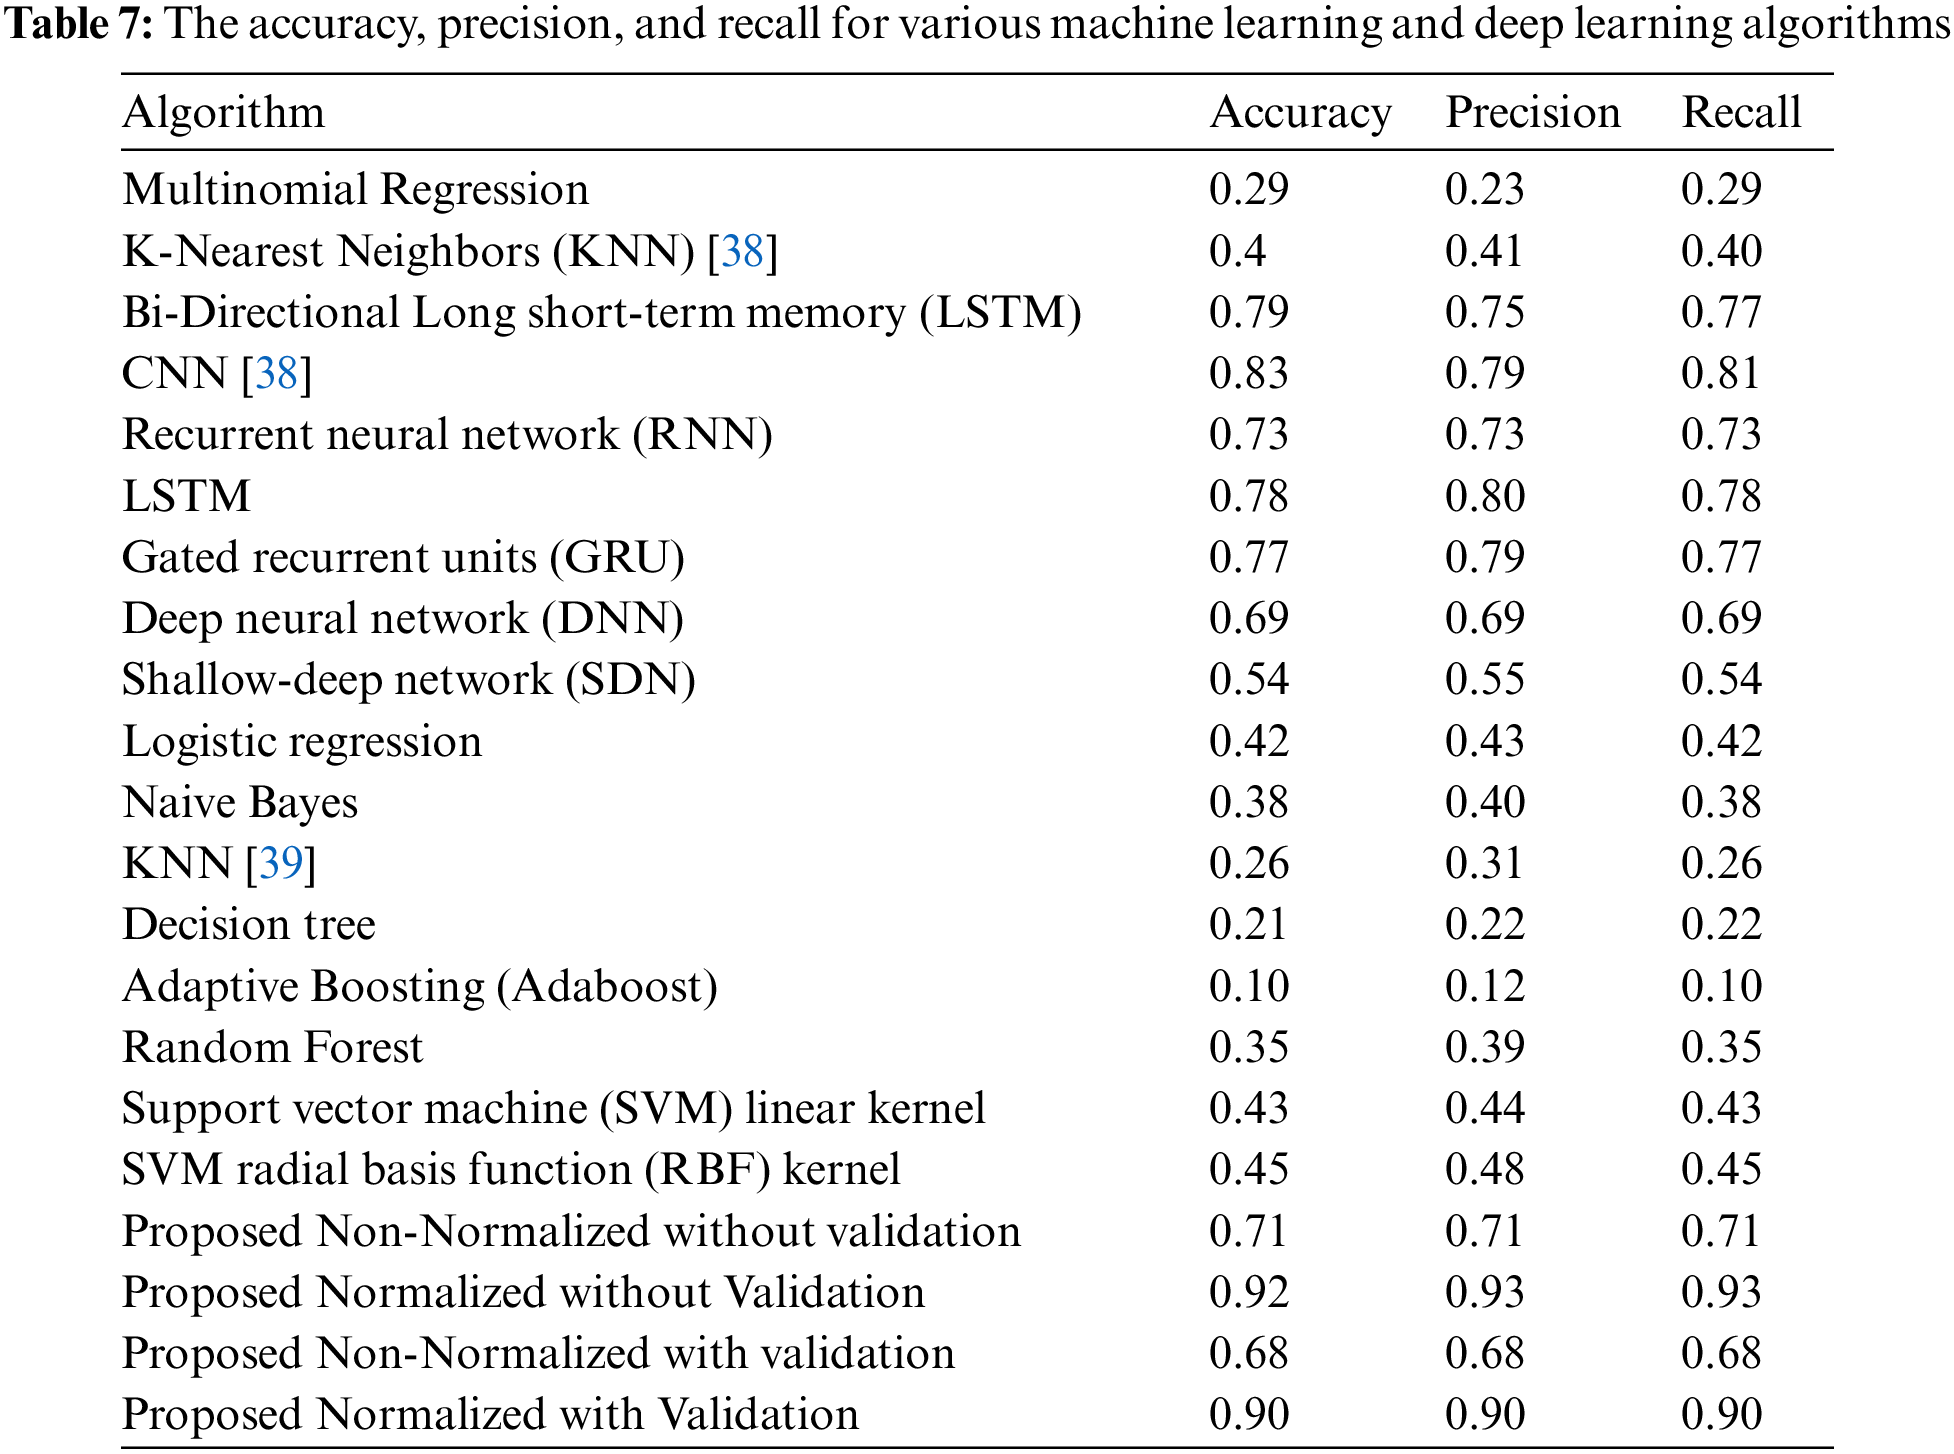
Table 6 compares the two methods in terms of sensitivity and precision, and it is clear that the normalized method outperforms the non-normalized one. Table 6 exhibits that Family 4 has the lowest sensitivity and precision for a non-normalized encoding system. However, the performance of the deep learning structure is best for the normalized encoding approach, following the resultant bispectral images of Family 4 sequences. Therefore, it results in more representative features than other families. In contrast, the issue is the lowest for the non-normalized images, where the resultant images lack details and the deep learning model could not extract more representative descriptors. Fig. 13 provides a visual description of both proposed approaches. Meanwhile, Table 7 summarizes the results of classifications for several algorithms. Comparing the findings of the provided algorithms to those in [38–40] and their references demonstrates their significance and reliability.
Overall, the proposed strategy for classifying protein sequence families is effective. It is implemented by translating the protein sequence into high-contrast colored pictures and using a pre-training deep-learning algorithm to provide a more robust classification model. However, it is important to note that alterations can be further utilized if the feature extraction procedure is further investigated as described in [41–44] or by employing additional deep learning strategies that can be attained by modifying the methods described in [45,46].
This study created a novel protein classification technique that predicts protein families using bispectrum images and CNNs. To compare the functional similarity of two proteins using numerical techniques, it is essential first to create a numerical representation of amino acids. Modern numerical representations of amino acids exhibit decadence due to their design. In contrast to earlier encoding techniques, our strategy uses the strength of the power of two encoding techniques to address the index values of amino acid codes. It has been shown that normalized encoding numbers are distinctive representations of protein families. Fractal behavior can be extrapolated from this pattern using the suggested encoding method from this pattern. In light of this information, a unique protein mapping strategy based on the normalized power of two encoding methods was created. The peculiarity of the amino acid number representation served as our driving force. Other than that, a unique feature extraction-based bispectrum analysis was created to divide the amino acid dataset into a trained data set, validation dataset, and test dataset. The bispectrum images of the ten families are then fed into the ResNet-101 CNN to be compatible with ten classes. Note that the ResNet-101 was created to forecast the protein families. Our method saves time by employing bispectrum images as the raw data instead of other methods that manually generate and choose features. The classification of bispectrum textures was accomplished utilizing encoding and normalized features. Since there is no need for pre-processing, the bispectral technique can even be used when there is data unpredictability and speckle variance.
Similarly, the bispectral analysis can discriminate between these various structures by computing robust features for texture classification because the formation of unique protein structures in clinical illnesses may be represented as a nonlinear process. This research generated two algorithms: a non-normalized and a normalized encoding method. Standard metrics such as precision, recall, and accuracy are applied to evaluate the performance of the proposed algorithms. The non-normalized approach achieved 70% accuracy, 72% precision, and 71% recall without validation. After validation, its accuracy was 68%, its precision was 67%, and its recall was 67%. In contrast, the normalized technique without validation produced an accuracy of 92.4%, a precision of 94.3%, and a recall of 91.1%. After validation, it obtained 90% accuracy, 91.2% precision, and 89.7% recall. The results indicate that both methods outperform the other algorithms indicated. The paper demonstrates that feature sets generated by the bispectrum-based nonlinear analysis technique in conjunction with deep learning models outperform traditional machine learning methods and other deep learning methods based on convolutional architecture. Furthermore, it resulted in superior inference performance by employing the proposed method to improve classification and more accurate predictions. The findings present that bispectrum calculations successfully classify textures using the deep learning method.
In the future, the classification of various protein structures and the application of this bispectrum and bicoherence texture can be researched further. Additionally, the recommended approach may be utilized with diverse data sequences, and the normalization can be improved by increasing sample sizes. Likewise, the proposed vector’s bispectrum images demonstrate that its distribution has broad tails, indicating a potential for improvement in evaluating different encodings. Performing bicoherence changes to the proposed vectors may bring the distribution of the final vectors closer to the normal distribution. Similarly, there is a category imbalance problem with protein families. Apart from that, a regular discriminant analysis that balances accuracy and precision can improve classification performance. By drawing inspiration from the similarity between the pattern of prime numbers and the number of codons in amino acids, future work may further focus on proposing a novel method for the numerical representation of amino acids. Moreover, it may introduce a framework to combine multiple coding schemes to enhance their spectral variation, which can be captured using higher-order spectral analysis methods. If more representations are assessed in the weighted scenario, similar to ensemble learning, it might do even better in other protein functional groups.
Acknowledgement: The authors would thank the authors of the dataset for making it available online. Also, they would like to thank the anonymous reviewers for contributing to enhancing this paper.
Funding Statement: The authors received no specific funding for this study.
Conflicts of Interest: The authors declare that they have no conflicts of interest to report regarding the present study.
References
1. N. P. Nguyen, M. Nute, S. Mirarab and T. Warnow, “HIPPI: Highly accurate protein family classification with ensembles of HMMs,” BMC Genomics, vol. 17, no. 10, pp. 89–100, 2016. [Google Scholar]
2. Y. H. Qu, H. Yu, X. J. Gong, J. H. Xu and H. S. Lee, “On the prediction of DNA-binding proteins only from primary sequences: A deep learning approach,” PloS One, vol. 12, no. 12, pp. e0188129, 2017. [Google Scholar] [PubMed]
3. N. Dawson, I. Sillitoe, R. L. Marsden and C. A. Orengo, “The classification of protein domains,” Bioinformatics, Part of the Methods in Molecular Biology book series (MIMBvol. 1525, pp. 137–164, 2017. [Google Scholar]
4. D. Zhang and M. R. Kabuka, “Protein family classification from scratch: A CNN based deep learning approach,” IEEE/ACM Transactions on Computational Biology and Bioinformatics, vol. 18, no. 5, pp. 1996–2007, 2020. [Google Scholar]
5. D. Kimothi, A. Soni, P. Biyani and J. M. Hogan, “Distributed representations for biological sequence analysis,” arXiv preprint arXiv:1608.05949, 2016. [Google Scholar]
6. T. K. Lee and T. Nguyen, “Protein family classification with neural networks,” Accessed: October, 10, 2022, 2016. https://cs224d.stanford.edu/reports/LeeNguyen.pdf [Google Scholar]
7. I. Krasteva, N. F. Inglis, F. Sacchini, R. Nicholas, R. Ayling et al., “Proteomic characterization of two strains of Mycoplasma mycoides subsp. mycoides of differing pathogenicity,” J. Proteomics Bioinform. S, vol. 13, no. 2, pp. 1–12, 2014. [Google Scholar]
8. E. Asgari and M. R. Mofrad, “Continuous distributed representation of biological sequences for deep proteomics and genomics,” PloS One, vol. 10, no. 11, pp. 1–15, 2015. [Google Scholar]
9. B. Szalkai and V. Grolmusz, “Near perfect protein multi-label classification with deep neural networks,” Methods, vol. 132, no. 6, pp. 50–56, 2018. [Google Scholar] [PubMed]
10. D. Quang and X. Xie, “DanQ: A hybrid convolutional and recurrent deep neural network for quantifying the function of DNA sequences,” Nucleic Acids Research, vol. 44, no. 11, pp. 1–6, 2016. [Google Scholar]
11. T. Mikolov, I. Sutskever, K. Chen, G. S. Corrado and J. Dean, “Distributed representations of words and phrases and their compositionality,” Advances in Neural Information Processing Systems, vol. 26, pp. 1–9, 2013. [Google Scholar]
12. B. Alipanahi, A. Delong, M. T. Weirauch and B. J. Frey, “Predicting the sequence specificities of DNA-and RNA-binding proteins by deep learning,” Nature Biotechnology, vol. 33, no. 8, pp. 831–838, 2015. [Google Scholar] [PubMed]
13. M. Spencer, J. Eickholt and J. Cheng, “A deep learning network approach to ab initio protein secondary structure prediction,” IEEE/ACM Transactions on Computational Biology and Bioinformatics, vol. 12, no. 1, pp. 103–112, 2014. [Google Scholar] [PubMed]
14. Y. Li and T. Shibuya, “Malphite: A convolutional neural network and ensemble learning based protein secondary structure predictor,” in 2015 IEEE Int. Conf. on Bioinformatics and Biomedicine (BIBM), Washington, DC, USA, pp. 1260–1266, 2015. [Google Scholar]
15. Z. Lin, J. Lanchantin and Y. Qi, “MUST-CNN: A multilayer shift-and-stitch deep convolutional architecture for sequence-based protein structure prediction,” in Proc. of the AAAI Conf. on Artificial Intelligence, Phoenix, Arizona, USA, vol. 30, pp. 27–34, 2016. [Google Scholar]
16. E. I. Zacharaki, “Prediction of protein function using a deep convolutional neural network ensemble,” PeerJ Computer Science, vol. 3, no. 12, pp. 1–11, 2017. [Google Scholar]
17. T. B. Alakuş and İ. Türkoğlu, “A novel Fibonacci hash method for protein family identification by using recurrent neural networks,” Turkish Journal of Electrical Engineering and Computer Sciences, vol. 29, no. 1, pp. 370–386, 2021. [Google Scholar]
18. L. Khadra, A. Al-Fahoum and S. Binajjaj, “A new quantitative analysis technique for cardiac arrhythmia using bispectrum and bicoherency,” in (IEMBS) 26th Annual Int. Conf. of the IEEE Engineering in Medicine and Biology Society (IEMBS), San Francisco, CA, USA, vol. 1, pp. 13–16, 2004. [Google Scholar]
19. A. Al-Fahoum and L. Khadra, “Combined bispectral and bicoherency approach for catastrophic arrhythmia classification,” in 2005 IEEE Engineering in Medicine and Biology 27th Annual Conf. (IEMBS), Shanghai, China, pp. 332–336, 2006. [Google Scholar]
20. A. Al-Fahoum, A. Al-Fraihat and A. Al-Araida, “Detection of cardiac ischemia using bispectral analysis approach,” Journal of Medical Engineering & Technology, vol. 38, no. 6, pp. 311–316, 2014. [Google Scholar]
21. A. M. Alqudah, H. Alquran and I. A. Qasmieh, “Classification of heart sound short records using bispectrum analysis approach images and deep learning,” Network Modeling Analysis in Health Informatics and Bioinformatics, vol. 9, no. 1, pp. 1–16, 2020. [Google Scholar]
22. T. Yamanashi, K. J. Crutchley, N. E. Wahba, E. J. Sullivan, M. Kajitani et al., “Evaluation of point-of-care thumb-size bispectral electroencephalography device to quantify delirium severity and predict mortality,” The British Journal of Psychiatry, vol. 220, no. 6, pp. 322–329, 2022. [Google Scholar]
23. R. Wakabayashi, “A call for real-time bispectral index and electroencephalogram monitoring in a patient undergoing aortic surgery,” Journal of Cardiothoracic and Vascular Anesthesia, vol. 36, no. 8, pp. 2558–2562, 2022. [Google Scholar] [PubMed]
24. J. A. Stewart, M. O. Särkelä, J. Wennervirta and A. P. Vakkuri, “Novel insights on association and reactivity of Bispectral index, frontal electromyogram, and autonomic responses in nociception-sedation monitoring of critical care patients,” BMC Anesthesiology, vol. 22, no. 353, pp. 1–13, 2022. [Google Scholar]
25. InterPro, InterPro, www.ebi.ac.uk/interpro/about/interpro. Accessed 10 Oct., 2022. [Google Scholar]
26. J. Y. Liu, T. Jiang, J. P. Zhang and D. C. Liang, “Crystal structure of allophycocyanin from red AlgaePorphyra yezoensis at 2.2-Å resolution,” Journal of Biological Chemistry, vol. 274, no. 24, pp. 16945–16952, 1999. [Google Scholar] [PubMed]
27. S. N. Vinogradov, D. Hoogewijs, X. Bailly, K. Mizuguchi, S. Dewilde et al., “A model of globin evolution,” Gene, vol. 398, no. 1–2, pp. 132–142, 2007. [Google Scholar] [PubMed]
28. W. Zhang and M. Ke, “Protein Encoding: A Matlab toolbox of representing or encoding protein sequences as numerical vectors for bioinformatics,” J. Chemical and Pharmaceutical Research, vol. 6, no. 7, pp. 2000–2007, 2014. [Google Scholar]
29. X. Jing, Q. Dong, D. Hong and R. Lu, “Amino acid encoding methods for protein sequences: A comprehensive review and assessment,” IEEE/ACM Transactions on Computational Biology and Bioinformatics, vol. 17, no. 6, pp. 1918–1931, 2019. [Google Scholar]
30. P. A. Kaplanis, C. S. Pattichis, L. J. Hadjileontiadis and S. M. Panas, “Bispectral analysis of surface EMG,” in 2000 10th Mediterranean Electrotechnical Conf. Information Technology and Electrotechnology for the Mediterranean Countries. Proc. MeleCon 2000 (Cat. No. 00CH37099), Lemesos, Cyprus, vol. 2, pp. 770–773, 2000. [Google Scholar]
31. J. W. Johansen, P. S. Sebel and D. M. Fisher, “Development and clinical application of electroencephalographic bispectrum monitoring,” The Journal of the American Society of Anesthesiologists, vol. 93, no. 5, pp. 1336–1344, 2000. [Google Scholar]
32. A. M. Alqudah, S. Qazan, L. Al-Ebbini, H. Alquran and I. A. Qasmieh, “ECG heartbeat arrhythmias classification: A comparison study between different types of spectrum representation and convolutional neural networks architectures,” Journal of Ambient Intelligence and Humanized Computing, vol. 13, no. 10, pp. 4877–4907, 2022. [Google Scholar]
33. H. Alquran, A. M. Alqudah, I. Abu-Qasmieh, A. Al-Badarneh and S. Almashaqbeh, “ECG classification using higher order spectral estimation and deep learning techniques,” Neural Network World, vol. 29, no. 4, pp. 207–219, 2019. [Google Scholar]
34. A. M. Alqudah, H. Alquran and I. A. Qasmieh, “Classification of heart sound short records using bispectrum analysis approach images and deep learning,” Network Modeling Analysis in Health Informatics and Bioinformatics, vol. 9, no. 1, pp. 1–16, 2020. [Google Scholar]
35. H. Alquran, W. A. Mustafa, I. A. Qasmieh, Y. M. Yacob, M. Alsalatie et al., “Cervical cancer classification using combined machine learning and deep learning approach,” Computers, Materials & Continua, vol. 72, no. 3, pp. 5117–5134, 2022. [Google Scholar]
36. R. Yamashita, M. Nishio, R. K. G. Do and K. Togashi, “Convolutional neural networks: An overview and application in radiology,” Insights into Imaging, vol. 9, no. 4, pp. 611–629, 2018. [Google Scholar] [PubMed]
37. K. He, X. Zhang, S. Ren and J. Sun, “Deep residual learning for image recognition,” in Proc. of the IEEE Conf. on Computer Vision and Pattern Recognition (ICCVPR), Las Vegas, NV, USA, pp. 770–778, 2016. [Google Scholar]
38. A. Wang, “Deep learning methods for protein family classification on PDB sequencing data,” arXiv preprint arXiv:2207.06678, 2022. [Google Scholar]
39. Da Zhang and M. Kabuka, “Protein family classification with multi-layer graph convolutional networks,” in 2018 IEEE Int. Conf. on Bioinformatics and Biomedicine (BIBM), Madrid, Spain, pp. 2390–2393, 2018. [Google Scholar]
40. A. Vazhayil, R. Vinayakumar and K. Soman, “Deep Proteomics: Protein family classification using shallow and deep networks,” arXiv:1809.04461, pp. 1–17, 2018. [Google Scholar]
41. N. Le, “Potential of deep representative learning features to interpret the sequence information in proteomics,” Proteomics, vol. e2100232, no. 1–2, pp. 1–2, 2022. [Google Scholar]
42. X. Yu, A. Aouari, R. Mansour and S. Su, “A hybrid algorithm based on PSO and GA for feature selection,” Journal of Cybersecurity JCS, vol. 3, no. 2, pp. 117–124, 2021. [Google Scholar]
43. F. Abukhodair, W. Alsaggaf, A. Jamal, S. Abdel-Khalek and R. Mansour, “An intelligent metaheuristic binary pigeon optimization-based feature selection and big data classification in a MapReduce environment,” Mathematics, vol. 9, no. 20, 2627, pp. 1–14, 2021. [Google Scholar]
44. P. Nagaraj, P. Deepalakshmi, R. F. Mansour and A. Almazroa, “Artificial flora algorithm-based feature selection with gradient boosted tree model for diabetes classification,” Diabetes, Metabolic Syndrome and Obesity, Targets and Therapy, vol. 14, pp. 2789–2806, 2021. [Google Scholar]
45. J. Sua, S. Lim, M. Yulius, X. Su, E. Yapp et al., “Incorporating convolutional neural networks and sequence graph transform for identifying multilabel protein Lysine PTM sites,” Chemometrics and Intelligent Laboratory Systems, vol. 206, pp. 104171, 2020. [Google Scholar]
46. N. Le, Q. Ho, E. Yapp, Y. Ou and H. Yeh, “Deep ETC: A deep convolutional neural network architecture for investigating and classifying electron transport chain's complexes,” NeuroComputing, vol. 375, no. 1, pp. 71–79, 2020. [Google Scholar]
Cite This Article
 Copyright © 2023 The Author(s). Published by Tech Science Press.
This work is licensed under a Creative Commons Attribution 4.0 International License , which permits unrestricted use, distribution, and reproduction in any medium, provided the original work is properly cited.
 Downloads
 Citation Tools