
 Submit a Paper
 Propose a Special lssue
 Open Access
ARTICLE

Biometric Finger Vein Recognition Using Evolutionary Algorithm with Deep Learning
1 Department of Management Information Systems, Faculty of Economics and Administration, King Abdulaziz University, Jeddah, 21589, Saudi Arabia
2 Optus Centre for AI, Curtin University, Perth, 6102, Australia
3 Department of Business Administration, Faculty of Economics and Administration, King Abdulaziz University, Jeddah, 21589, Saudi Arabia
4 Department of Management Information Systems, College of Business Administration, Taibah University, Al-Madinah, 42353, Saudi Arabia
* Corresponding Author: Mohammad Yamin. Email:
Computers, Materials & Continua 2023, 75(3), 5659-5674. https://doi.org/10.32604/cmc.2023.034005
Received 04 July 2022; Accepted 28 September 2022; Issue published 29 April 2023
 View Full Text
 Download PDF
Abstract
In recent years, the demand for biometric-based human recognition methods has drastically increased to meet the privacy and security requirements. Palm prints, palm veins, finger veins, fingerprints, hand veins and other anatomic and behavioral features are utilized in the development of different biometric recognition techniques. Amongst the available biometric recognition techniques, Finger Vein Recognition (FVR) is a general technique that analyzes the patterns of finger veins to authenticate the individuals. Deep Learning (DL)-based techniques have gained immense attention in the recent years, since it accomplishes excellent outcomes in various challenging domains such as computer vision, speech detection and Natural Language Processing (NLP). This technique is a natural fit to overcome the ever-increasing biometric detection problems and cell phone authentication issues in airport security techniques. The current study presents an Automated Biometric Finger Vein Recognition using Evolutionary Algorithm with Deep Learning (ABFVR-EADL) model. The presented ABFVR-EADL model aims to accomplish biometric recognition using the patterns of the finger veins. Initially, the presented ABFVR-EADL model employs the histogram equalization technique to pre-process the input images. For feature extraction, the Salp Swarm Algorithm (SSA) with Densely-connected Networks (DenseNet-201) model is exploited, showing the proposed method’s novelty. Finally, the Deep-Stacked Denoising Autoencoder (DSAE) is utilized for biometric recognition. The proposed ABFVR-EADL method was experimentally validated using the benchmark databases, and the outcomes confirmed the productive performance of the proposed ABFVR-EADL model over other DL models.Keywords
Biometric identification mechanisms validate the individuals’ unique physical or behavioural features to recognize them and provide access to secure places. However, it is challenging to develop such mechanisms for industrial and scientific communities [1]. Some of the commonly-used physical biometric traits include fingerprints, face, iris and hand geometric signs. In contrast, keystroke patterns, signature, gait and voice are some examples of behavioural modalities [2]. In general, many modalities are prone to spoof attacks. So, the demand for developing a user-friendly and a secure biometric approach is high. Biometrics such as palm, finger, and hand cannot be forged easily. Further, these biometrics cannot easily be obtained from an individual against their willingness [3]. The vein images are generally captured with the help of near-infrared-related optical imaging mechanisms. The illumination mechanism produces the infrared light that either passes through the hands or gets reflected. These vein patterns are obtained using infrared cameras, whereas the haemoglobin, present in the blood, absorbs the infrared light and emerges as dark lines in the captured image [4]. Generally, the biometric recognition mechanisms have four modules such as decision-making, sensor, matching and feature extraction. Two kinds of biometric recognition mechanisms are followed, such as multimodal and unimodal. The unimodal mechanism employs a single biometric trait to recognize an individual [5]. Further, in literature, the unimodal mechanism has been proved to be a trustworthy and better mechanism than the conventional techniques. However, it has limitations, such as noise in intra-class and the sensed data, vulnerability to spoofing attacks, inter-class similarity and non-universality problems.
Various authors have studied biometric recognition mechanisms for user recognition based on Machine Learning (ML) techniques [6]. In general, the ML techniques require feature extraction methods to extract the features from raw biometric data and convert them into a suitable form for data classification. In addition, the ML techniques require a few more pre-processing steps that should be executed before the feature extraction process [7]. Moreover, certain extraction techniques do not work successfully at times with different kinds of biometrics or distinct datasets of the same biometrics. Some of the techniques cannot be used in the case of biometric image transformation, for instance, rotation and zooming. Currently, Deep Learning (DL) methods substantially affect the outcomes while producing outstanding results in terms of biometric mechanisms [8]. The DL methods have overcome several limitations found in other ML approaches, especially in terms of feature extraction methods. These techniques can accomplish biometric image transformation and derive the features from the raw data. Convolutional Neural Network (CNN) is one of the standard and broadly-utilized DL methods in image classification applications. It has three distinct types of layers such as the Fully Connected (FC) layer, the convolutional layer and the pooling layer. Mostly, the CNN technique is fed with an input image, sent via CNN layers, for feature detection and recognition, after which the classification result is obtained.
The current study presents an Automated Biometric Finger vein Recognition using Evolutionary Algorithm with Deep Learning (ABFVR-EADL) model. The presented ABFVR-EADL model employs the Histogram Equalization (HE) technique initially to pre-process the input images. The Salp Swarm Algorithm (SSA) with Densely-connected Networks (DenseNet-201) model is exploited for feature extraction. At the final stage, the Deep Stacked Denoising Autoencoder (DSAE) model is utilized for the purpose of recognition. The proposed ABFVR-EADL model was experimentally validated using the benchmark databases.
Feng et al. [8] introduced an effectual feature extraction model called Principal Component Local Preservation Projection (PCLPP). This model integrated both Principal Component Analysis (PCA) and Locality Preserving Projection (LPP) and derived a projection matrix to hold both global as well as local image features to achieve high security. In the study conducted earlier [9], the authors explained three cases based on the 2-Dimension Gabor Filter (2D-GF), Local Binary Pattern (LBP) and a fusion of 2DGF+LBP to derive the feature vectors. The experimental results inferred that a hybrid of 2DGF and LBP attained the optimal outcomes. Jiang et al. [10] introduced a Cloud-enabled 3-factor Authentication and Key Agreement protocol (CT-AKA) by integrating passwords, biometrics and smart cards to provide secure cloud and autonomous vehicles access. In this study, three conventional biometric encryption methods, such as the fuzzy vault, fuzzy commitment and the fuzzy extractor, were integrated to accomplish a three-factor authentication process without compromising the biometric privacy of the users.
In literature [11], a hybrid verification algorithm was devised based on biometric and encryption mechanisms. To develop a strong and a secure approach, an advanced encryption standard was used in this study as a reliable encryption mechanism. Further, fingerprint biometrics was used in this study. The first and foremost objective of this study was to prevent the data from unauthorized users who attempt to access the data using cloud information stockpiling concentrates. The new data security mechanism could offer an effective authentication of the Cloud Computing (CC) network. Ibrahim et al. [12] offered a cancellable face and fingerprint recognition method related to optical encryption and 3D jigsaw transformation. This method implemented the Fractional Fourier Transform (FRFT) process with a single random phase mask in the optical encryption technique. The presented cancellable biometric recognition method used the optical image encryption technique based on the two cascaded phases of the 2D-FRFT, which had separable kernels in both measurements.
Jeon et al. [13] introduced an enhanced technique to accelerate the process of inner-pairing product computation. The authors implemented a technique to expedite the decryption operations of Functional Encryption (FE) and achieve a rapid remote biometric verification. Two significant observations were taken as a base for this enhancement, i.e., the decryption function does not often vary over multiple authentication sessions. The other argument was that the mechanism has to assess the product of multiple pairings instead of individual pairings. Morampudi et al. [14] devised a new privacy-preserving iris authentication method using a fully-homomorphic encoding process. This method assured the templates’ confidentiality and prevented data leakage from templates. Further, the proposed technique increased the recognition accuracy by producing rotation-invariant iris codes and reduced the computational period with the help of a batching method.
Taheri et al. [15] formulated a structure for fully privacy-preserving biometric verification in which the computation tasks were outsourced to public clouds. At first, the trained images were encoded in this study to ensure the data privacy for biometric verification. Then, to protect the privacy of the biometric verification method, the computation phase of every correlating filter and the verification phase was executed over the encoded biometric images on the server side. At last, the privacy of the biometric verification outcomes was protected by transmitting it to the client for further study. El-Hameed et al. [16] proposed a method based on chaos-related image encryption process with various chaotic maps. In order to preserve the authentication performance, the trained images were convolved with random kernels to construct the encoded biometric templates. In this study, it was made possible to acquire multiple templates from similar biometrics by changing the chaotic map employed in the generation of convolution kernels.
3 The Proposed Biometric Verification System
In this study, a novel ABFVR-EADL algorithm has been developed for biometric recognition using finger veins. In the presented ABFVR-EADL model, the HE approach is employed initially to pre-process the input images. Next, the SSA is exploited with the DenseNet-201 technique to generate a set of useful feature vectors. For recognition, the DSAE model is utilized in this study. Fig. 1 depicts the overall processes of the ABFVR-EADL approach.
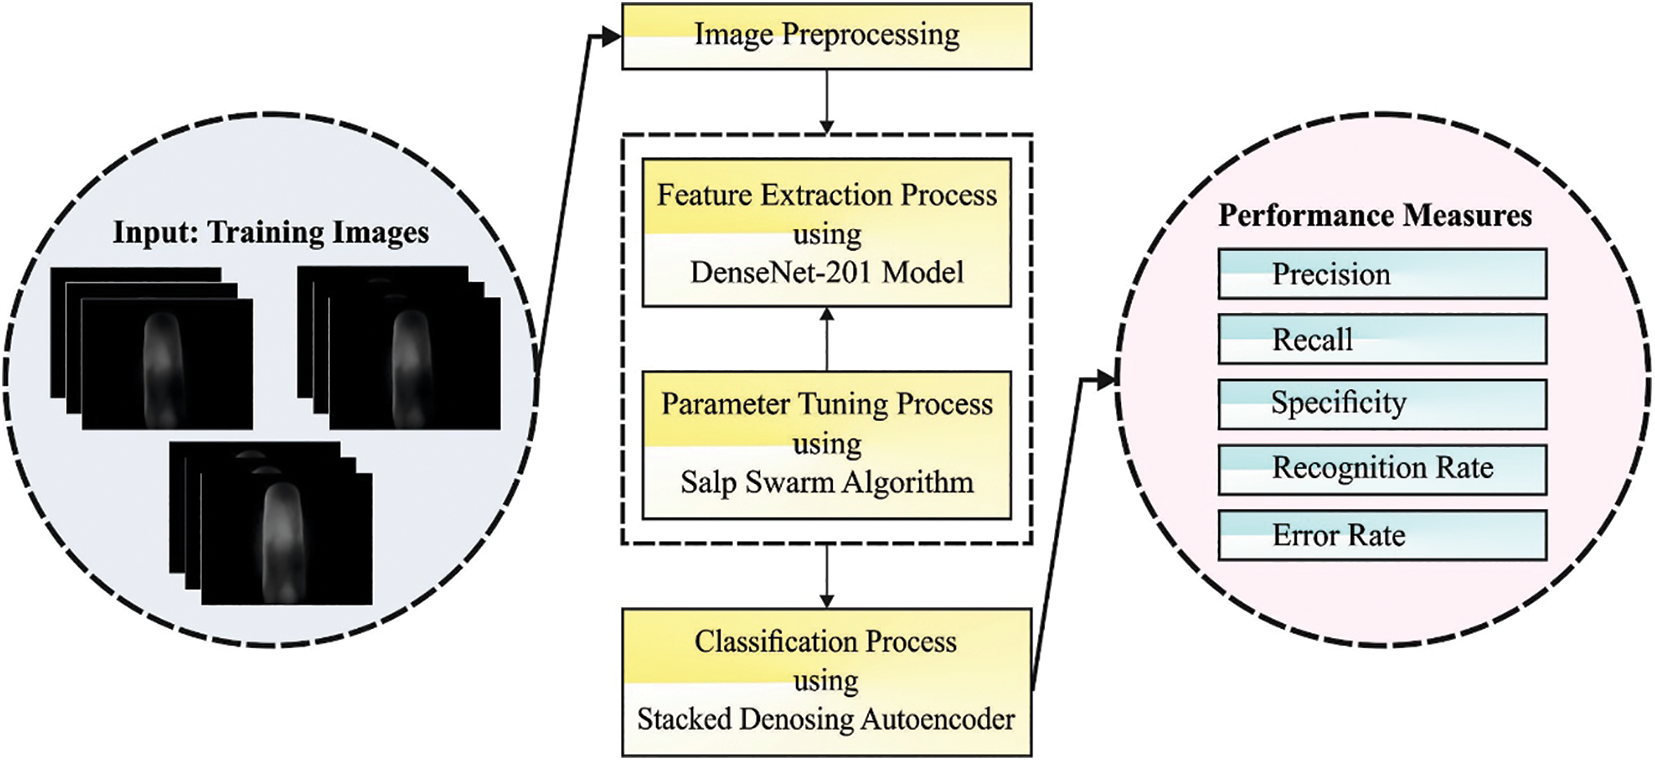
Figure 1: Overall processes of the ABFVR-EADL approach
In general, the image enhancement approach is utilized to improve the quality of images. In order to ensure the optimum understanding and examination of the images, there is a need to enhance the contrast of the medicinal images. The HE technique is a conventional approach employed to achieve this task in the current study. In this approach, the intensity of the image pixels is slightly adjusted. The steps followed during the HE process are provided in Algorithm 1.

3.2 DenseNet Feature Extraction
In this stage, the DenseNet-201 method is exploited to generate useful feature vectors. In order to extract the features from the data, a pre-trained DenseNet-201 is utilized, whereas the deep CNN (DCNN) method is also utilized for classification [17]. Due to ‘feature reuse probability’ by multiple layers, the DenseNet-201 method leverages the condensed network to provide easy training, improved execution and expand the varieties in the input layer since it is an extremely-efficient parametrical model. Then, a direct connection is added from every preceding layer to the next layer to boost the connectivity in the DenseNet-201 method, for which the mathematical expression is as follows.
Here,
In Eq. (2), the input layer channel is represented by
Now, the Bernoulli function randomly generates a vector
3.3 Hyperparameter Tuning Using SSA
To adjust the hyperparameters, the SSA model is exploited in the current study. Salps are transparent and barrel-shaped marine organisms that swim forward by sucking seawater into its body and expelling it [18]. The knowledge of SSA remains in its performance as a collection of chain, i.e., the mutual effect among the nearby individuals. Some of the individual salps are categorized as leaders and followers, in which the leader is at the front end of chains and makes an optimum decision based on the nearby environment. The following steps explain the SSA process in detail.
Step 1: Initialization of the population. Based on the upper as well as lower limits of all the dimensions of the searching space, the place of the salps
Here, the population size of the salps is denoted by N, whereas the dimensions of the problems are represented by
Step 2: Calculate the fitness of all the salp individuals based on their objective function.
Step 3: Choose the primary place of the food source. Then, sort the salps based on their fitness values. Then, record the location of the optimum salps as the place of the food source.
Step 4: Define leader as well as the follower. A primary chain of half salps is designated as leaders, whereas the other half salps are categorized as followers.
Step 5: Upgrade the location of the leader salps.
Here,
Step 6: Upgrade the place of follower salps.
Here, t refers to the present iteration number,
Step 7: Implement boundary processing on all the dimensions of the upgraded individual and upgrade the location of the food sources based on the location of the upgraded novel global optimum salps. The procedure of executing the boundary processing is explained in this step. When established, the location exceeds both the upper as well as the lower limits of all the dimensions of the searching space. If the places of all the dimensions of the individuals are upgraded, then the place coordinates are clipped and restored to the boundary again. For sample, when the place co-ordinates exceed the upper limit
Step 8: Verify if the number of iterations is obtained. Then, check for resultant output; otherwise, skip to step 4 to continue the iterative evolution procedure.
Finally, the extracted features are passed onto the DSAE model for the recognition process. The DAE model is stacked upon one another to construct a deep network with multiple hidden layers [19]. The DSAE architecture involves two encoder and decoder layers. Initially, the output is chosen as the input dataset for the following encoder layer. Fig. 2 displays the infrastructure of the SDAE model. Assume that there exists a L hidden layer in the encoder for which the activation function of
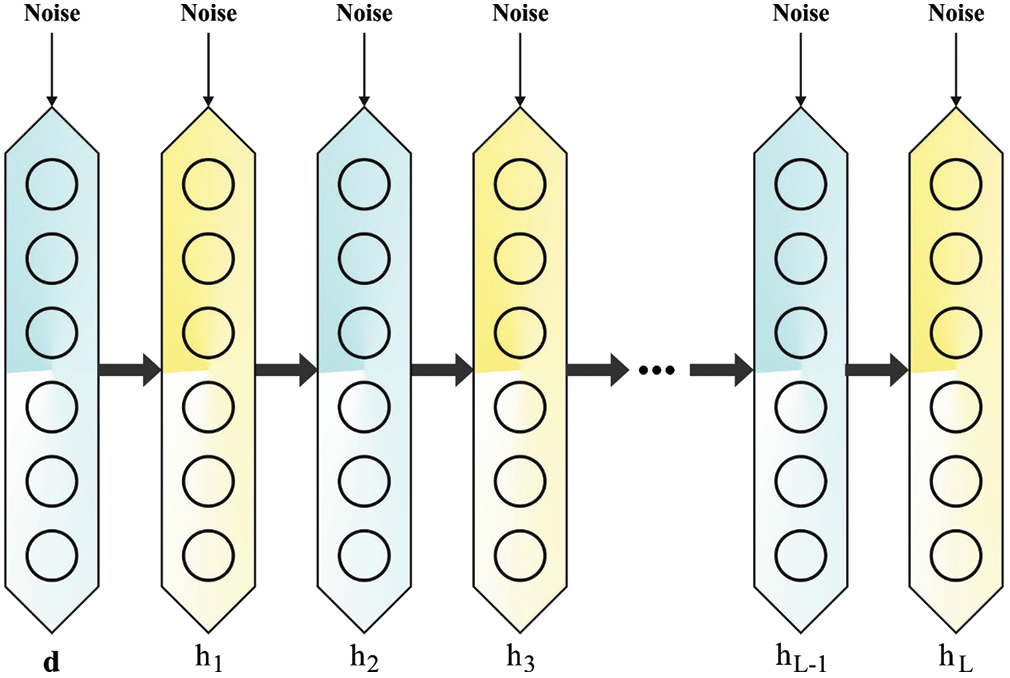
Figure 2: Structure of SDAE
In Eq. (8), the input
In Eq. (9), the input
Step 1. Select the input dataset that is arbitrarily designated from a hyperspectral image.
Step 2. Train the initial DAE model that involves an initial encoder layer and a latter decoder layer. Acquire the network weight
Step 3. Apply
In this section, the authors discuss the experimental validation of the proposed ABFVR-EADL method under a distinct number of epochs and runs [20]. Fig. 3 demonstrates some of the sample images. The proposed model was simulated using Python tool.
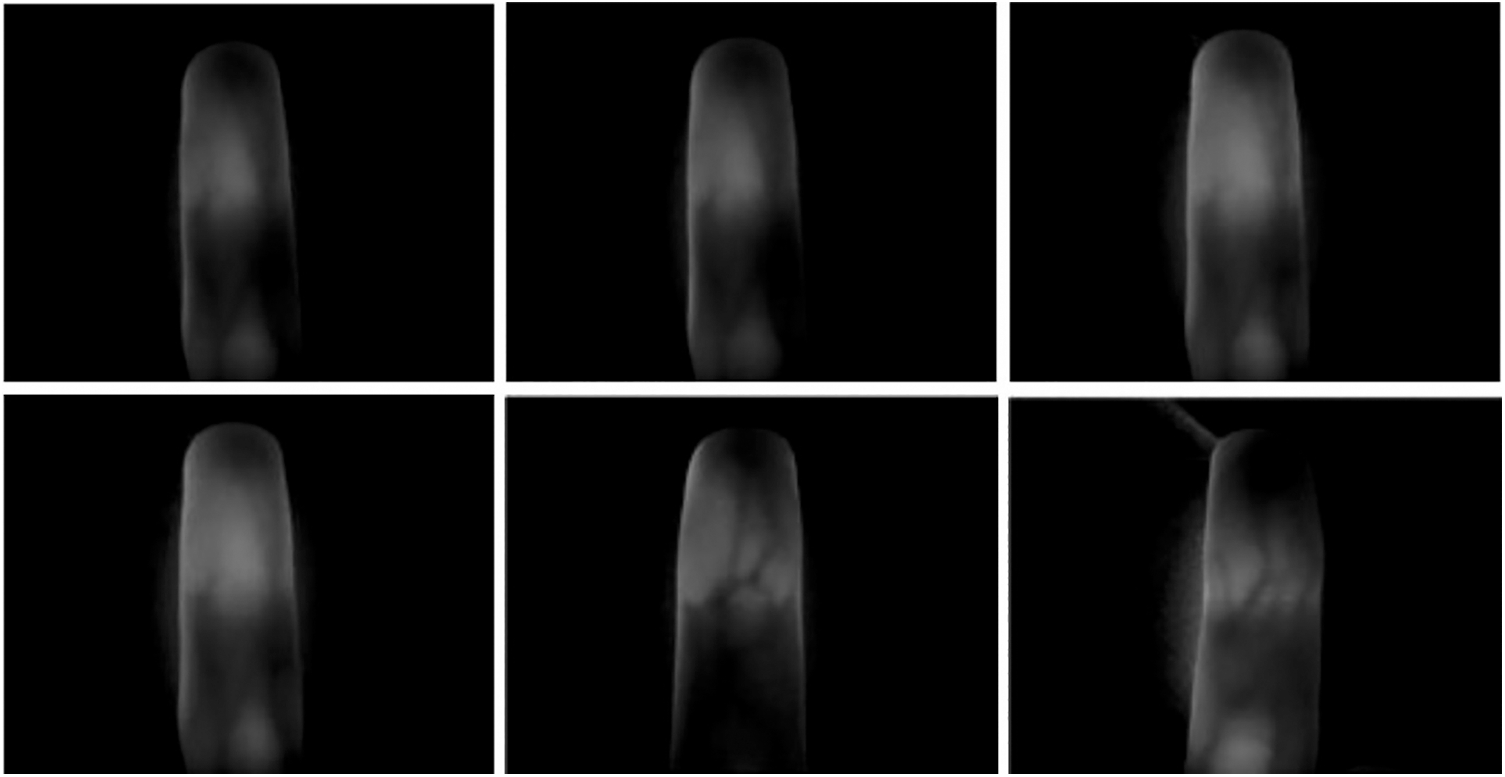
Figure 3: Sample images
Table 1 shows the results achieved by the proposed ABFVR-EADL model on 1,000 epochs under diverse runs. Fig. 4 shows the
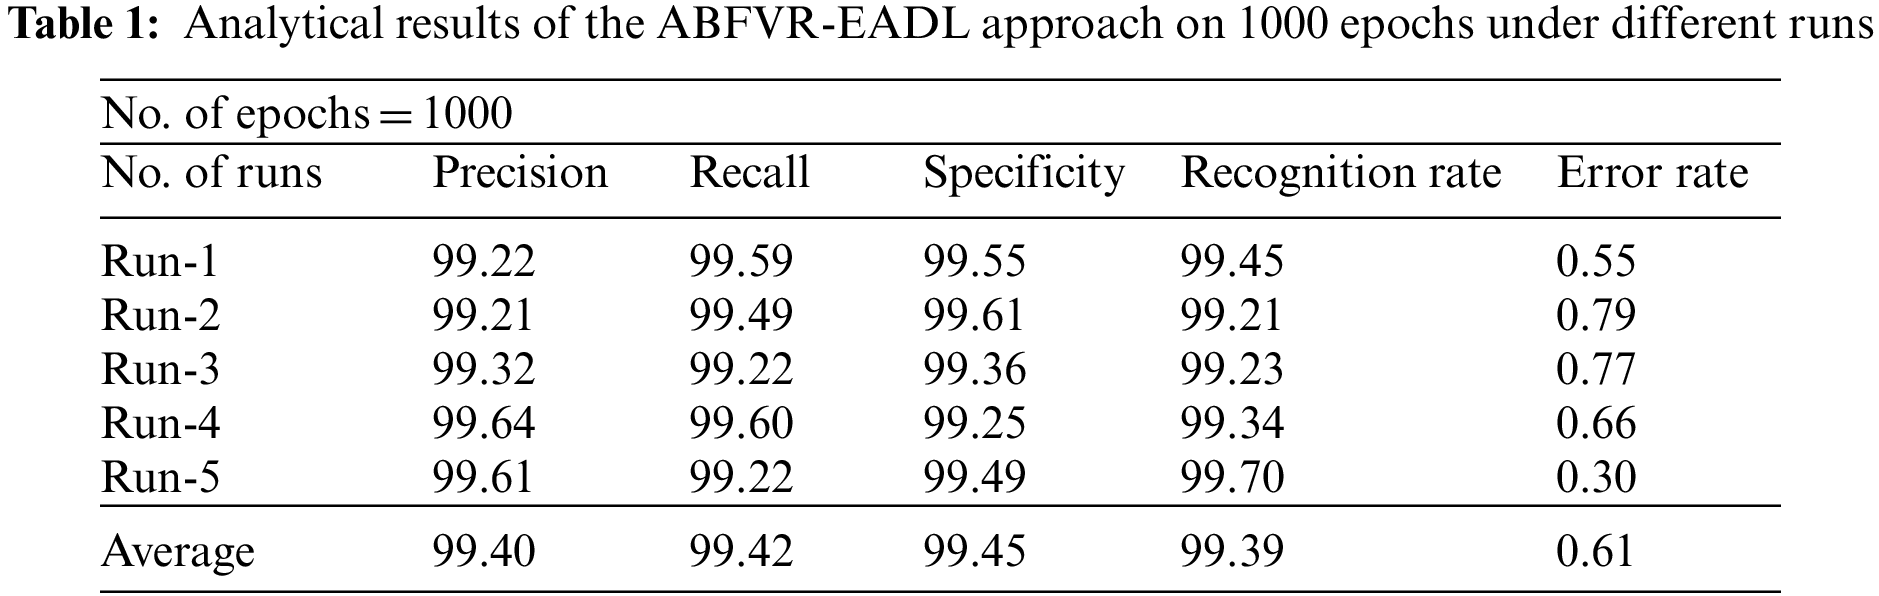
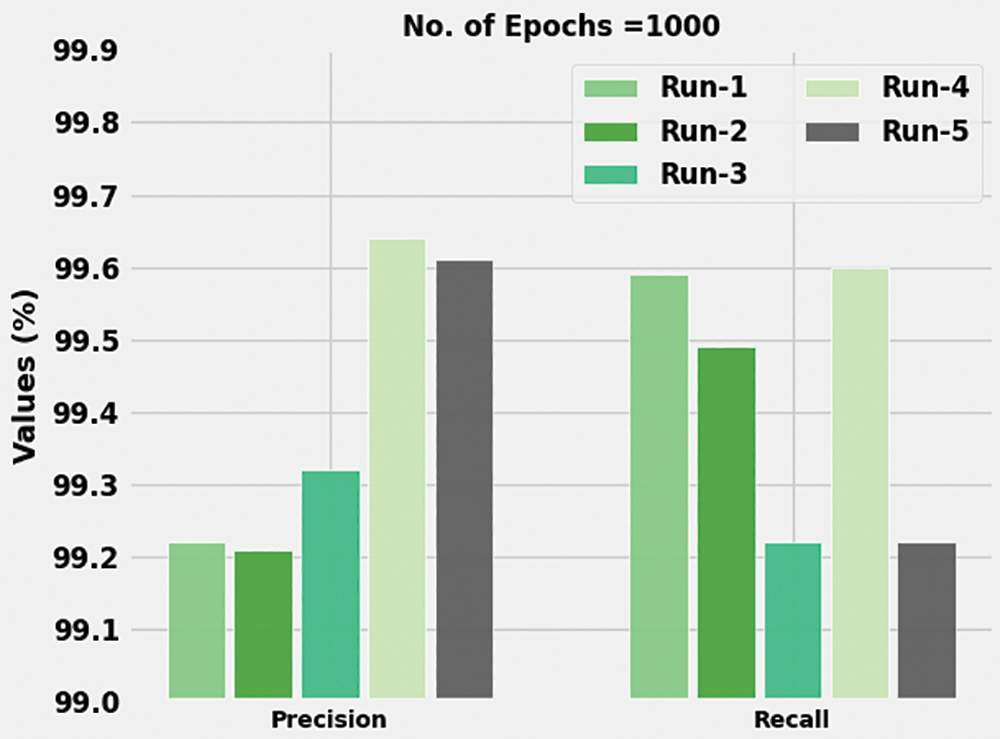
Figure 4:
Fig. 5 portrays the

Figure 5:
Both Training Accuracy (TA) and Validation Accuracy (VA) values, achieved by the proposed ABFVR-EADL method under 1000 epochs, are shown in Fig. 6. The experimental outcomes infer that the proposed ABFVR-EADL algorithm reached the maximal TA and VA values. To be specific, the VA values were higher than the TA values.

Figure 6: TA and VA analyses results of the ABFVR-EADL approach under 1000 epochs
Both Training Loss (TL) and Validation Loss (VL) values, acquired by the proposed ABFVR-EADL method under 1000 epochs, are presented in Fig. 7. The experimental outcomes denote that the proposed ABFVR-EADL algorithm established the least TL and VL values while the VL values were lesser than the TL values.
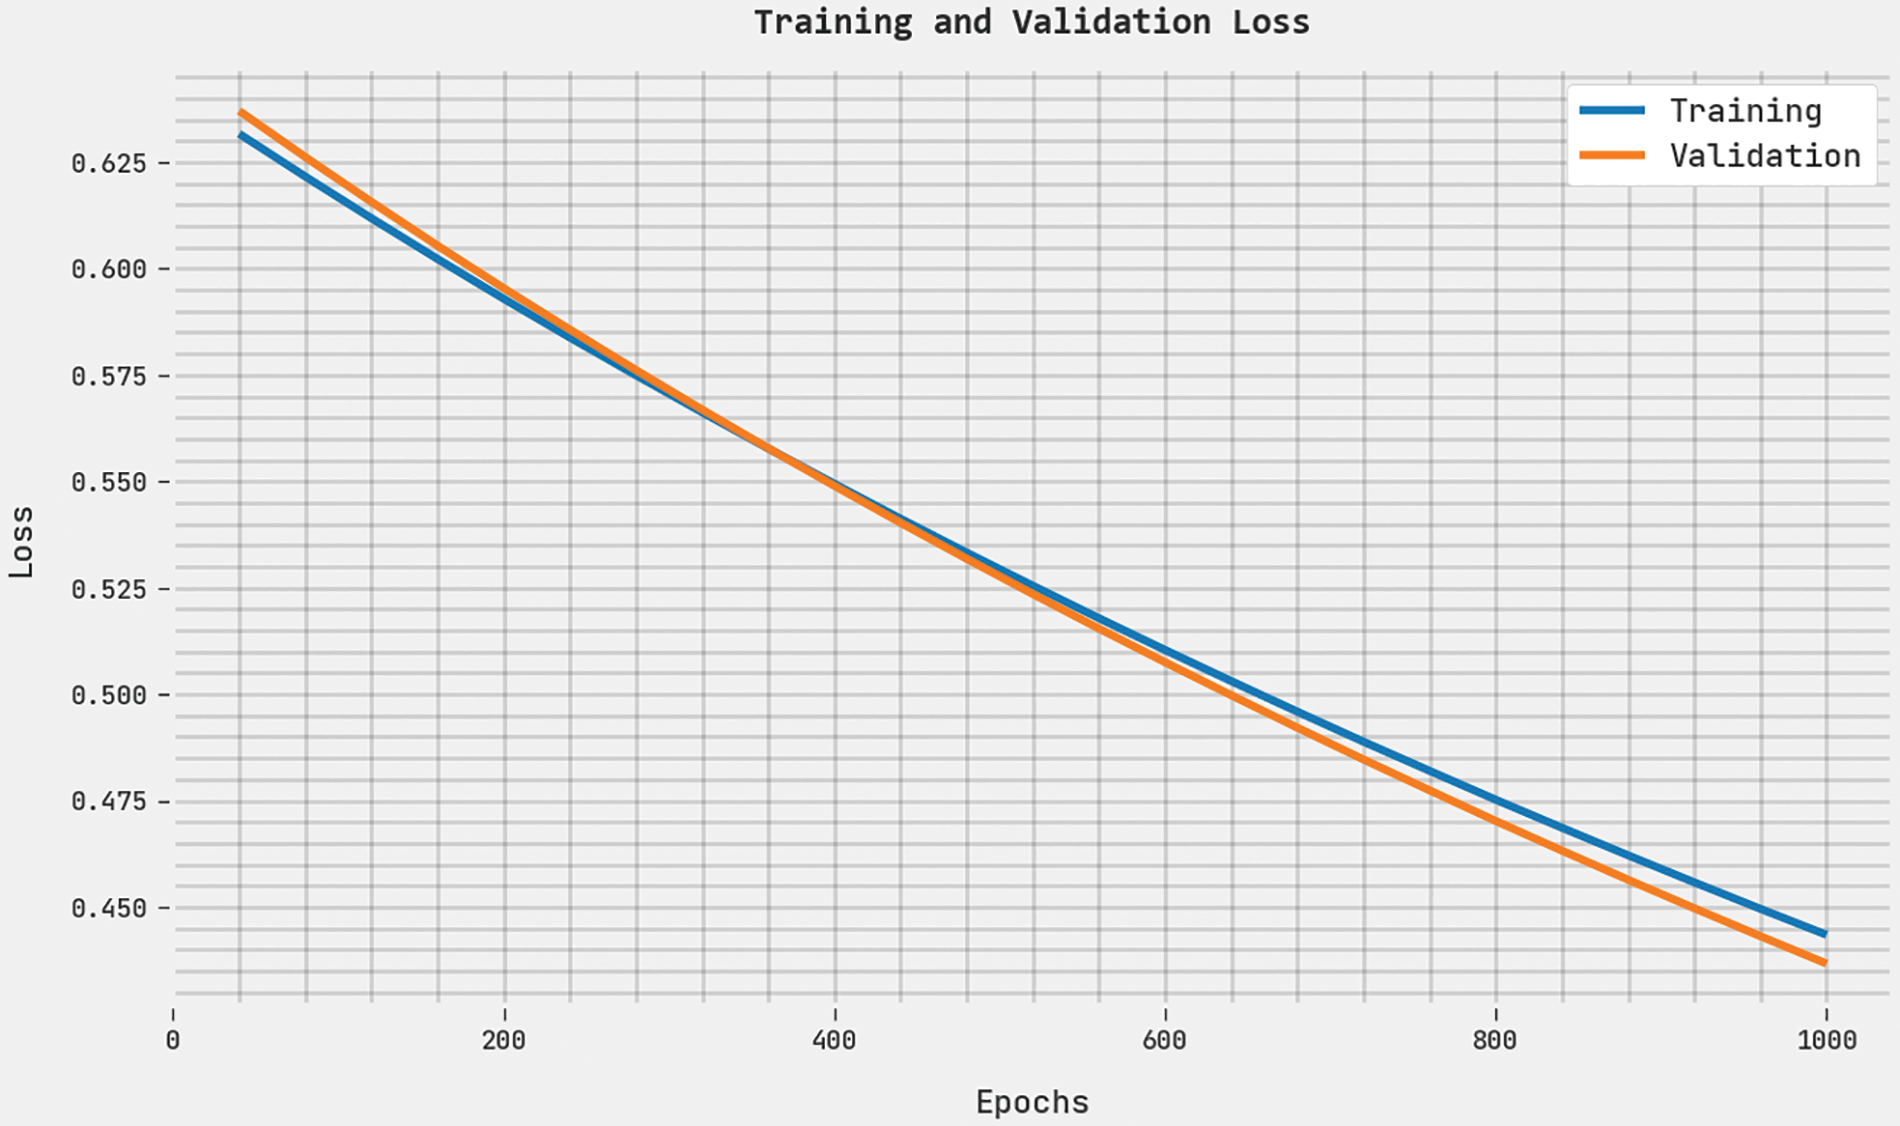
Figure 7: TL and VL analyses results of the ABFVR-EADL approach under 1000 epochs
Table 2 is a brief overview of the analytical results attained by the proposed ABFVR-EADL model on 1000 epochs under diverse runs. Fig. 8 portrays the
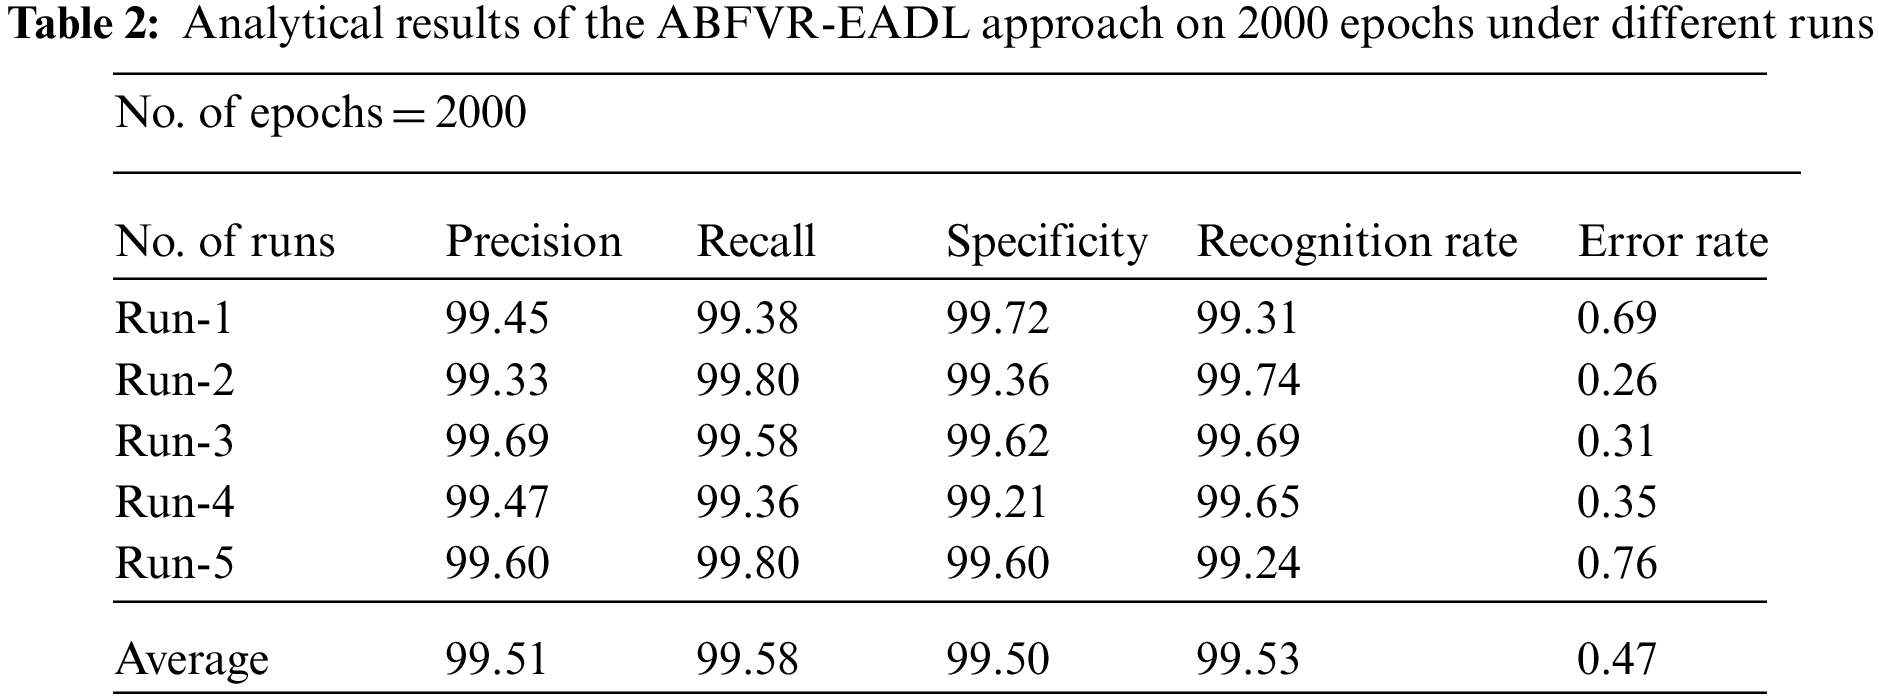
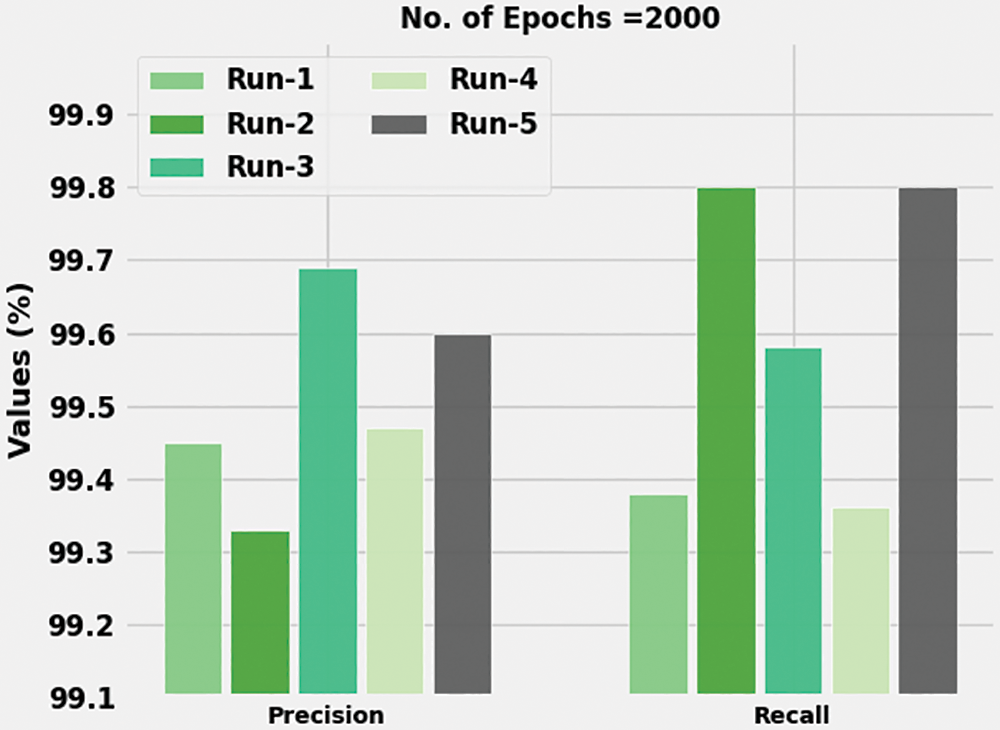
Figure 8:
Fig. 9 shows the

Figure 9:
Both TA and VA values, acquired by the proposed ABFVR-EADL method under 2000 epochs, are demonstrated in Fig. 10. The experimental outcomes imply that the proposed ABFVR-EADL technique achieved the maximal TA and VA values while the VA values were superior to the TA values.
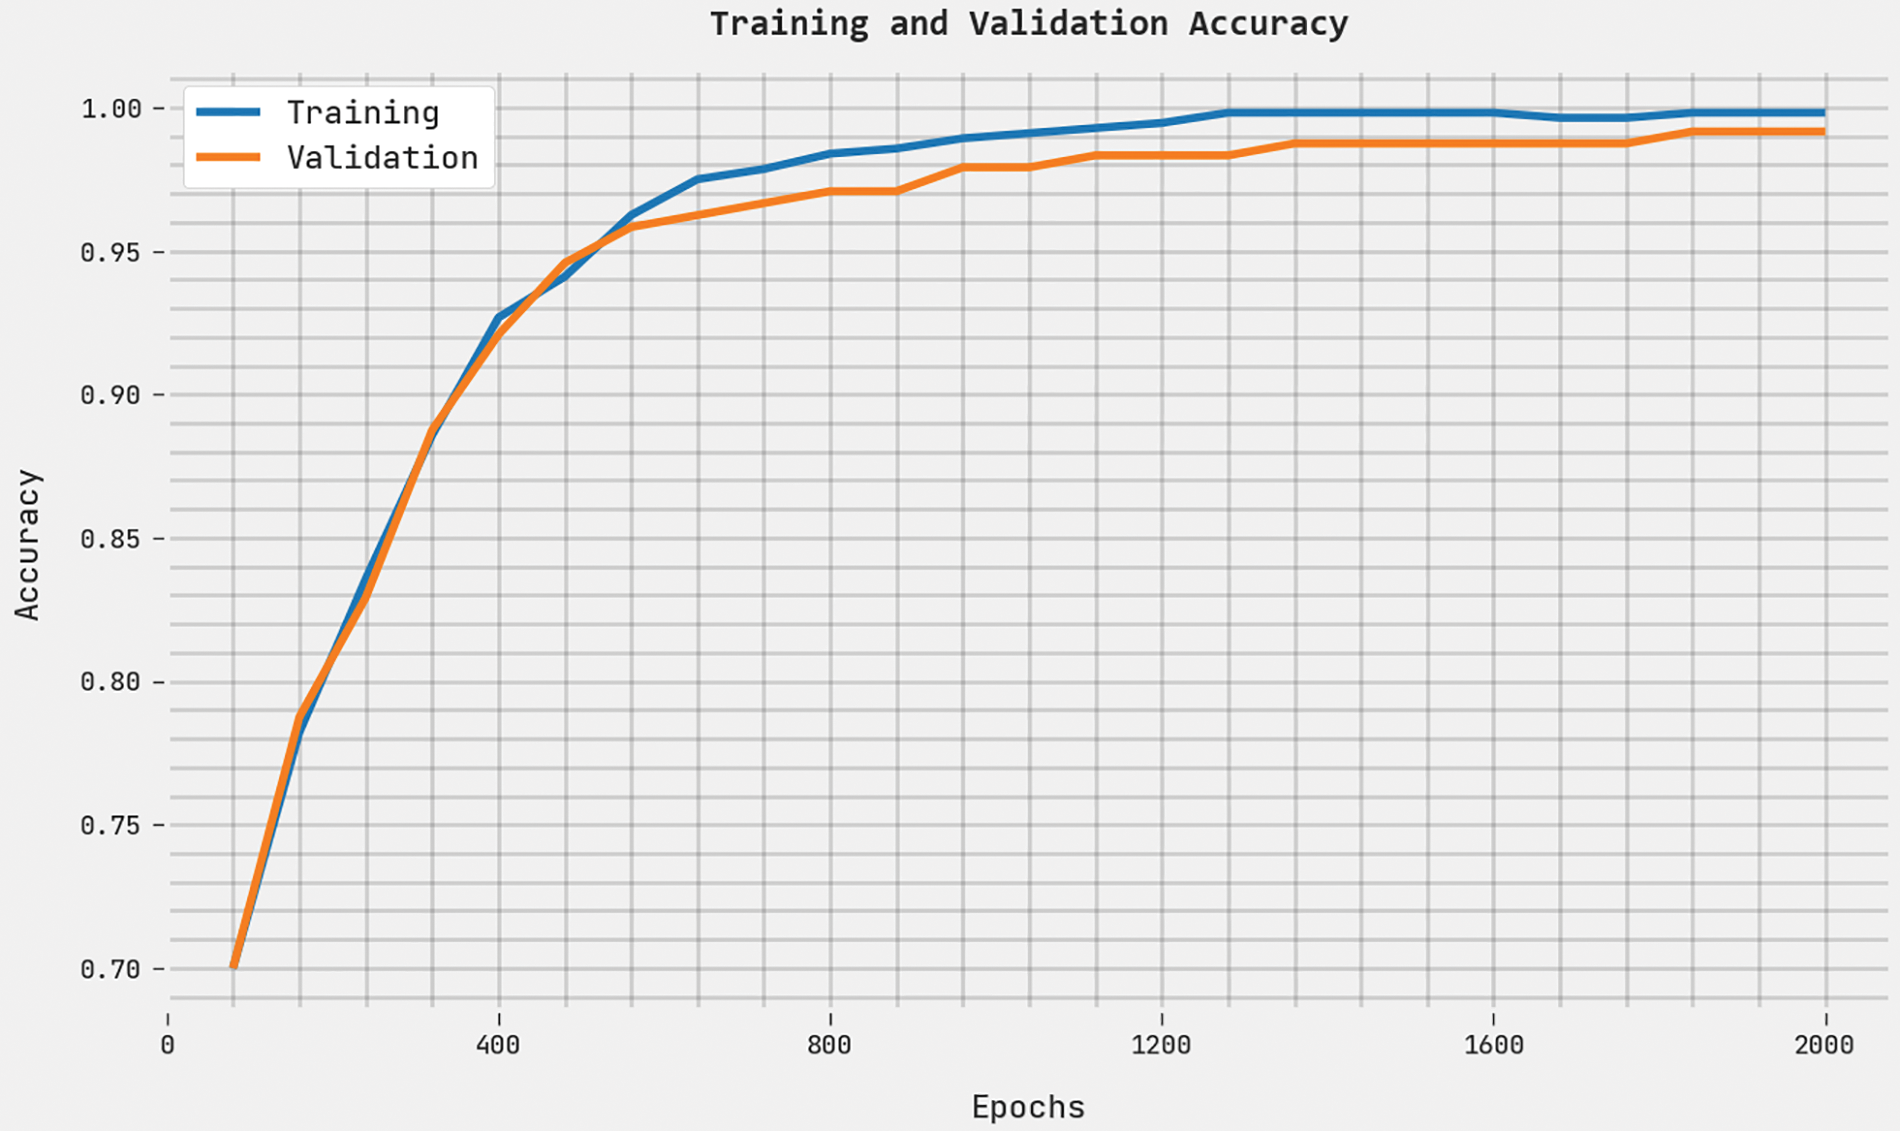
Figure 10: TA and VA analyses results of the ABFVR-EADL approach under 2000 epochs
Both TL and VL values, attained by the proposed ABFVR-EADL approach under 2000 epochs, are exhibited in Fig. 11. The experimental outcomes denote that the proposed ABFVR-EADL algorithm exhibited the least TL and VL values while the VL values were lesser than the TL values.
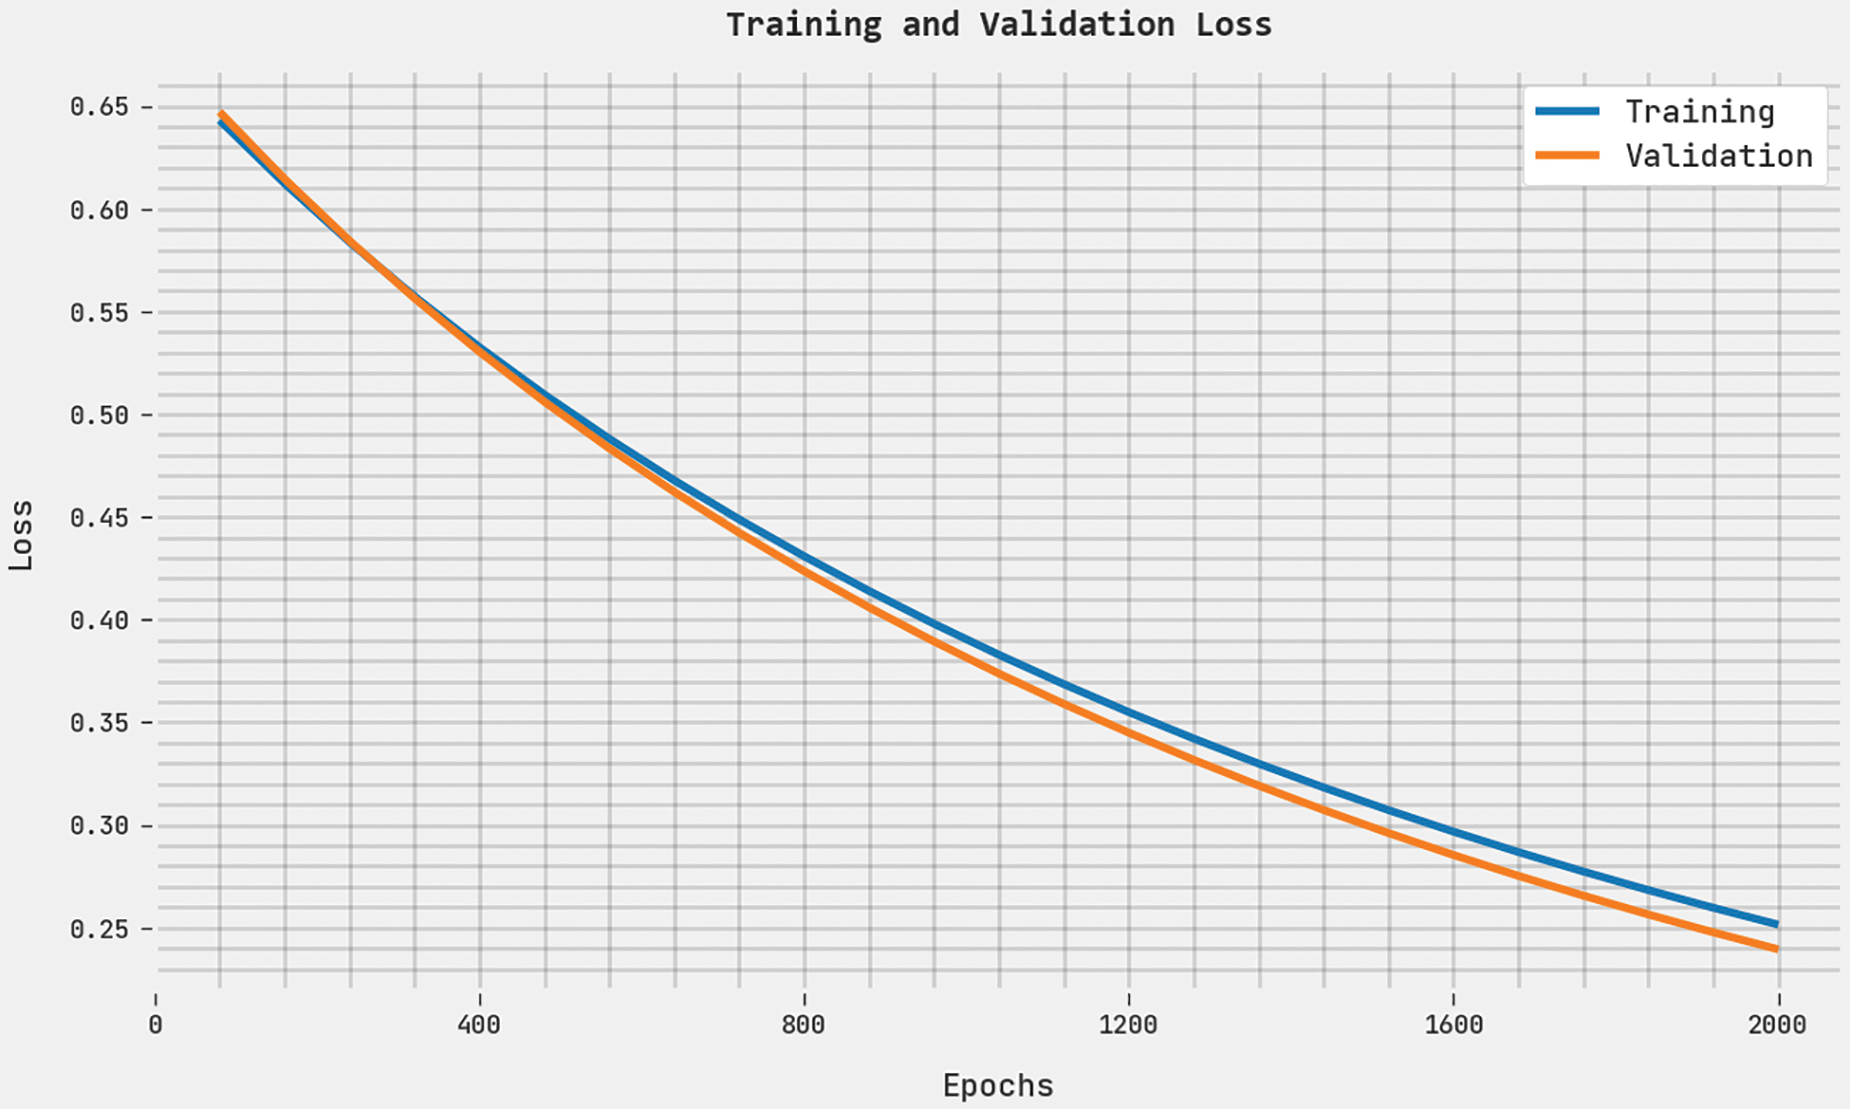
Figure 11: TL and VL analyses results of the ABFVR-EADL approach under 2000 epochs
Table 3 provides the comparative RR and ER results of the proposed ABFVR-EADL model and other recent biometric verification approaches [21]. Fig. 12 portrays the detailed RR outcomes of the proposed ABFVR-EADL model and other existing models. The figure infers that the Poly-SVM kernel and RBF-SVM kernel models achieved the least RR values such as 96% and 96.18% respectively. Next, the SWG and DWP techniques reported slightly enhanced RR values such as 96.42% and 96.46% respectively. Though the Linear SVM kernel model achieved a reasonable RR of 97.76%, the proposed ABFVR-EADL model outperformed all other models with a maximum RR of 99.53%.
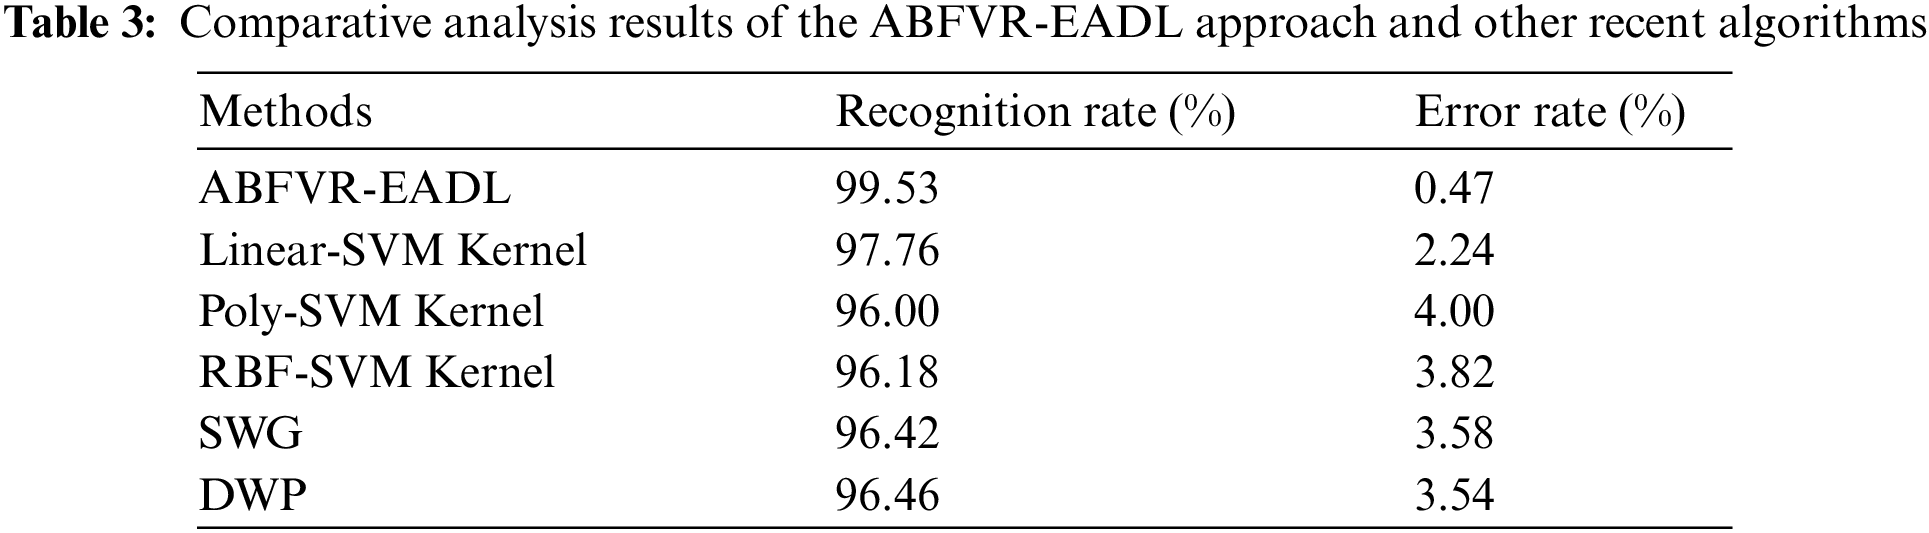
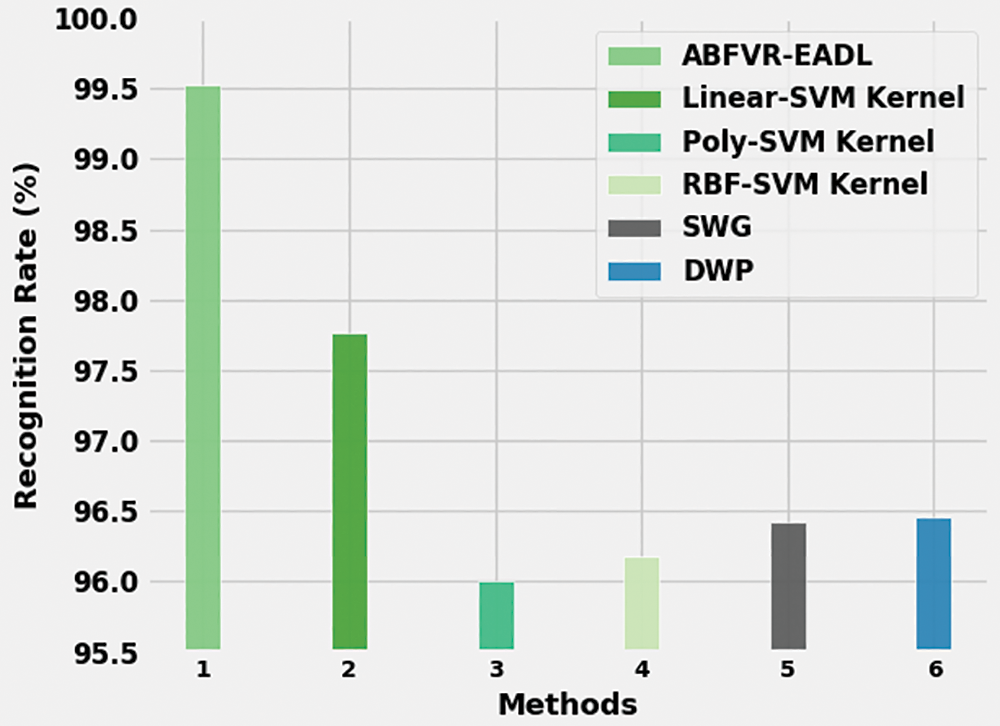
Figure 12: RR analysis results of the ABFVR-EADL approach and other recent algorithms
Fig. 13 portrays the ER analysis results of the ABFVR-EADL model and other existing models. The figure implies that the Poly-SVM kernel and RBF-SVM kernel models exhibited the maximum ER values such as 4.00% and 3.82% correspondingly. Next, the SWG and DWP methods reported slightly reduced ER values such as 3.58% and 3.54% correspondingly. Though the Linear SVM kernel model achieved a reasonable ER of 2.24%, the proposed ABFVR-EADL model attained improved results with a minimum ER of 0.47%.
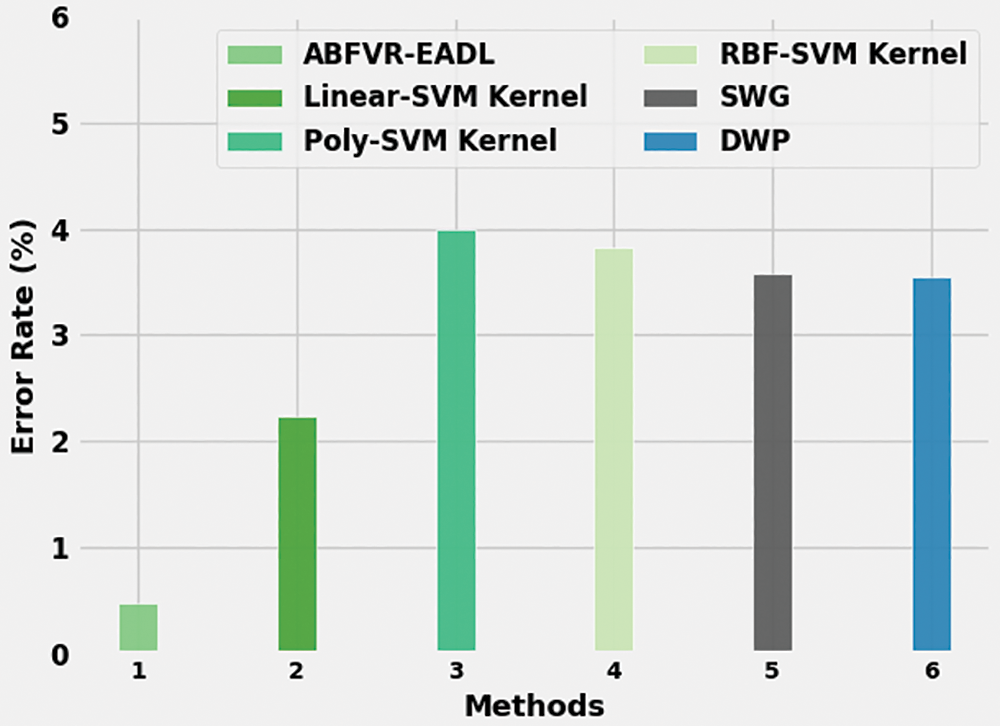
Figure 13: ER analysis results of the ABFVR-EADL approach and other recent algorithms
From the results, it is clear that the proposed ABFVR-EADL model is a superior performer than the rest of the approaches, in terms of biometric verification.
In this study, a new ABFVR-EADL model has been developed for biometric recognition using the patterns of the finger veins. The presented ABFVR-EADL model employs the HE approach initially to pre-process the input images. Next, the SSA is exploited with the DenseNet-201 model to generate a valuable feature vector set. For recognition process, the DSAE method is utilized in the current study. The proposed ABFVR-EADL method was experimentally validated using a benchmark dataset, and the results confirmed the effectual outcomes of the proposed ABFVR-EADL model compared to other DL models. Thus, the ABFVR-EADL technique can be exploited in the future to accomplish proficient biometric recognition outcomes. Further, the performance of the proposed ABFVR-EADL technique can be validated upon multimodal biometric verification systems in real-time applications.
Funding Statement: The Deanship of Scientific Research (DSR) at King Abdulaziz University (KAU), Jeddah, Saudi Arabia has funded this project, under Grant No. KEP-3-120-42.
Conflicts of Interest: The authors declare that they have no conflicts of interest to report regarding the present study.
References
1. B. P. Yadav, Ch. S. S. Prasad, C. Padmaja, S. N. Korra and E. Sudarshan, “A coherent and privacy-protecting biometric authentication strategy in cloud computing,” IOP Conference Series: Materials Science and Engineering, vol. 981, no. 2, pp. 022043, 2020. [Google Scholar]
2. A. Tarannum, Z. U. Rahman, L. K. Rao, T. Srinivasulu and A. Lay-Ekuakille, “An efficient multimodal biometric sensing and authentication framework for distributed applications,” IEEE Sensors Journal, vol. 20, no. 24, pp. 15014–15025, 2020. [Google Scholar]
3. H. Zong, H. Huang and S. Wang, “Secure outsourced computation of matrix determinant based on fully homomorphic encryption,” IEEE Access, vol. 9, pp. 22651–22661, 2021. [Google Scholar]
4. V. Kakkad, M. Patel and M. Shah, “Biometric authentication and image encryption for image security in cloud framework,” Multiscale and Multidisciplinary Modeling, Experiments and Design, vol. 2, no. 4, pp. 233–248, 2019. [Google Scholar]
5. A. H. Mohsin, A. A. Zaidan, B. B. Zaidan, O. S. Albahri, A. S. Albahri et al., “Based medical systems for patient’s authentication: Towards a new verification secure framework using cia standard,” Journal of Medical Systems, vol. 43, no. 7, pp. 192, 2019. [Google Scholar] [PubMed]
6. S. K. Rajput and O. Matoba, “Optical multimodal biometric encryption that uses digital holography,” Journal of Optics, vol. 22, no. 11, pp. 115703, 2020. [Google Scholar]
7. A. D. Algarni, G. M. El Banby, N. F. Soliman, F. E. A. El-Samie and A. M. Iliyasu, “Efficient implementation of homomorphic and fuzzy transforms in random-projection encryption frameworks for cancellable face recognition,” Electronics, vol. 9, no. 6, pp. 1046, 2020. [Google Scholar]
8. D. Feng, S. He, Z. Zhou and Y. A. Zhang, “A finger vein feature extraction method incorporating principal component analysis and locality preserving projections,” Sensors, vol. 22, pp. 1–13, 2022. [Google Scholar]
9. W. Dahea and H. S. Fadewar, “Finger vein recognition system based on multi-algorithm of fusion of gabor filter and local binary pattern,” in 2020 Fourth Int. Conf. on I-SMAC (IoT in Social, Mobile, Analytics and Cloud) (I-SMAC), Palladam, India, pp. 403–410, 2020. [Google Scholar]
10. Q. Jiang, N. Zhang, J. Ni, J. Ma, X. Ma et al., “Unified biometric privacy preserving three-factor authentication and key agreement for cloud-assisted autonomous vehicles,” IEEE Transactions on Vehicular Technology, vol. 69, no. 9, pp. 9390–9401, 2020. [Google Scholar]
11. M. A. Hossain and Md. A. Al Hasan, “Improving cloud data security through hybrid verification technique based on biometrics and encryption system,” International Journal of Computers and Applications, vol. 44, no. 5, pp. 455–464, 2022. [Google Scholar]
12. S. Ibrahim, M. G. Egila, H. Shawky, M. K. Elsaid, W. El-Shafai et al., “Cancelable face and fingerprint recognition based on the 3D jigsaw transform and optical encryption,” Multimedia Tools and Applications, vol. 79, no. 19–20, pp. 14053–14078, 2020. [Google Scholar]
13. S. Y. Jeon and M. K. Lee, “Acceleration of inner-pairing product operation for secure biometric verification,” Sensors, vol. 21, no. 8, pp. 2859, 2021. [Google Scholar] [PubMed]
14. M. K. Morampudi, M. V. N. K. Prasad and U. S. N. Raju, “Privacy-preserving iris authentication using fully homomorphic encryption,” Multimedia Tools and Applications, vol. 79, no. 27–28, pp. 19215–19237, 2020. [Google Scholar]
15. M. Taheri, S. Mozaffari and P. Keshavarzi, “Privacy-preserving biometric verification with outsourced correlation filter computation,” Multimedia Tools and Applications, vol. 80, no. 14, pp. 21425–21448, 2021. [Google Scholar]
16. H. A. A. El-Hameed, N. Ramadan, W. El-Shafai, A. A. Khalaf, H. E. H. Ahmed et al., “Cancelable biometric security system based on advanced chaotic maps,” The Visual Computer, vol. 38, no. 6, pp. 2171–2187, 2022. [Google Scholar]
17. T. Lu, B. Han, L. Chen, F. Yu and C. Xue, “A generic intelligent tomato classification system for practical applications using DenseNet-201 with transfer learning,” Scientific Reports, vol. 11, no. 1, pp. 15824, 2021. [Google Scholar] [PubMed]
18. R. A. Ibrahim, A. A. Ewees, D. Oliva, M. Abd Elaziz and S. Lu, “Improved salp swarm algorithm based on particle swarm optimization for feature selection,” Journal of Ambient Intelligence and Humanized Computing, vol. 10, no. 8, pp. 3155–3169, 2019. [Google Scholar]
19. J. Yu, “Enhanced stacked denoising autoencoder-based feature learning for recognition of wafer map defects,” IEEE Transactions on Semiconductor Manufacturing, vol. 32, no. 4, pp. 613–624, 2019. [Google Scholar]
20. M. M. Asaari, S. Suandi and B. Rosdi, “Fusion of band limited phase only correlation and width centroid contour distance for finger-based biometrics,” Expert Systems with Applications, vol. 41, no. 7, pp. 3367–3382, 2014. [Google Scholar]
21. B. Hou and R. Yan, “Convolutional autoencoder model for finger-vein verification,” IEEE Transactions on Instrumentation and Measurement, vol. 69, no. 5, pp. 2067–2074, 2020. [Google Scholar]
Cite This Article
 Copyright © 2023 The Author(s). Published by Tech Science Press.
This work is licensed under a Creative Commons Attribution 4.0 International License , which permits unrestricted use, distribution, and reproduction in any medium, provided the original work is properly cited.
 Downloads
 Citation Tools