
 Submit a Paper
 Propose a Special lssue
 Open Access
ARTICLE

Multi-Classification of Polyps in Colonoscopy Images Based on an Improved Deep Convolutional Neural Network
1 College of Quality and Technical Supervision, Hebei University, Baoding, 071002, China
2 Hebei Technology Innovation Center for Lightweight of New Energy Vehicle Power System, Baoding, 071002, China
3 National & Local Joint Engineering Research Center of Metrology Instrument and System, Hebei University, Baoding, 071002, China
4 College of Electronic Information Engineering, Hebei University, Baoding, 071002, China
5 Department of Orthopedics, Affiliated Hospital of Hebei University, Baoding, 071002, China
6 State Key Laboratory of Molecular Vaccinology and Molecular Diagnostics, Center for Molecular Imaging and Translational Medicine, Department of Laboratory Medicine, School of Public Health, Xiamen University, Xiamen, 361102, China
* Corresponding Authors: Kun Yang. Email: ; Linyan Xue. Email:
Computers, Materials & Continua 2023, 75(3), 5837-5852. https://doi.org/10.32604/cmc.2023.034720
Received 25 July 2022; Accepted 20 October 2022; Issue published 29 April 2023
 View Full Text
 Download PDF
Abstract
Achieving accurate classification of colorectal polyps during colonoscopy can avoid unnecessary endoscopic biopsy or resection. This study aimed to develop a deep learning model that can automatically classify colorectal polyps histologically on white-light and narrow-band imaging (NBI) colonoscopy images based on World Health Organization (WHO) and Workgroup serrAted polypS and Polyposis (WASP) classification criteria for colorectal polyps. White-light and NBI colonoscopy images of colorectal polyps exhibiting pathological results were firstly collected and classified into four categories: conventional adenoma, hyperplastic polyp, sessile serrated adenoma/polyp (SSAP) and normal, among which conventional adenoma could be further divided into three sub-categories of tubular adenoma, villous adenoma and villioustublar adenoma, subsequently the images were re-classified into six categories. In this paper, we proposed a novel convolutional neural network termed Polyp-DedNet for the four- and six-category classification tasks of colorectal polyps. Based on the existing classification network ResNet50, Polyp-DedNet adopted dilated convolution to retain more high-dimensional spatial information and an Efficient Channel Attention (ECA) module to improve the classification performance further. To eliminate gridding artifacts caused by dilated convolutions, traditional convolutional layers were used instead of the max pooling layer, and two convolutional layers with progressively decreasing dilation were added at the end of the network. Due to the inevitable imbalance of medical image data, a regularization method DropBlock and a Class-Balanced (CB) Loss were performed to prevent network overfitting. Furthermore, the 5-fold cross-validation was adopted to estimate the performance of Polyp-DedNet for the multi-classification task of colorectal polyps. Mean accuracies of the proposed Polyp-DedNet for the four- and six-category classifications of colorectal polyps were 89.91% ± 0.92% and 85.13% ± 1.10%, respectively. The metrics of precision, recall and F1-score were also improved by 1%~2% compared to the baseline ResNet50. The proposed Polyp-DedNet presented state-of-the-art performance for colorectal polyp classifying on white-light and NBI colonoscopy images, highlighting its considerable potential as an AI-assistant system for accurate colorectal polyp diagnosis in colonoscopy.Keywords
Based on 2020 reports, Colorectal cancer (CRC) is a significant public health problem, the second leading cause of cancer-related death worldwide and the fifth leading cause of cancer-related death in China [1]. Colonoscopy is one of the most important and effective methods for the early detection and resection of colorectal neoplasms, which has been adopted in many countries to improve the detection rate of adenoma and reduce CRC mortality [2–4]. Studies have shown that about 85% of CRC is derived from adenomas, and endoscopic resection of colorectal polyps (CP) can reduce the incidence of CRC [5,6]. However, the results of colonoscopy tend to be affected by the doctor's clinical experience, fatigue and other subjective factors, which in turn, the diagnostic performance among clinicians is inconsistent [7]. Moreover, a few neoplastic lesions remain challenging to diagnose accurately, even for expert endoscopists [8].
To resolve these problems, researchers have been working to employ computerized methods. Computer-aided diagnosis (CAD) nowadays plays a significant role in clinical research and practice which began to develop in the mid-1980s and was first used for chest radiography and mammography for cancer detection and diagnosis [9]. Machine learning (ML)-based CAD techniques are characterized by hand-crafted features which rely heavily on expert experience. Therefore, these classification and detection methods illustrate poor performance in generalization. With the rapid development of artificial intelligence technology, deep neural networks with end-to-end learning have been increasingly exploited to design CAD systems for the automated diagnosis of medical diseases [10,11], including the auxiliary diagnosis of colorectal polyps.
Colorectal polyps can be categorized into conventional adenoma, hyperplastic polyp, sessile serrated adenoma/polyp (SSAP) based on the Workgroup serrAted polypS and Polyposis (WASP) classification criteria [12,13]. However, according to the World Health Organization (WHO) classification criteria for colorectal polyps, conventional adenomas are divided into tubular adenoma, villous adenoma, and villioustublar adenoma. Each type of polyps has a different chance of developing into CRC [12]. For example, several studies have shown that conventional adenomas and SSAP have different pathways to cancer but have a similar relatively high risk of developing CRC. On the contrary, the hyperplastic polyp can hardly develop into CRC [12,14].
We propounded a new deep learning network, Polyp-DedNet, to achieve more accurate four- and six-category classifications of colorectal polyps according to the WHO and WASP criteria during white light and narrow-band imaging colonoscopy. The four-category task divided the images into conventional adenoma, SSAP, hyperplastic polyp and normal. According to WHO criteria, our proposed network can further predict a colonoscopy image into one of the six categories: SSAP, hyperplastic polyp, tubular adenoma, villous adenoma, villioustublar adenoma and normal. Polyp-DedNet adopts the dilated residual network to retain more spatial information for improving image classification accuracy, an attentional mechanism to focus on the lesion area in the image and the regularization method named DropBlock [15] to prevent network overfitting. In the training process, Polyp-DedNet was performed as the basic network of colorectal polyp classification, and the transfer learning method was presented to improve the accuracy and rapidity of network training. Meanwhile, the Class-Balanced (CB) Loss [16] was used to address problems in imbalanced data learning.
The major contributions of our work are as follows: (1) A novel framework was proposed for WASP and WHO pathological classification under white light and narrow-band light, which increased the diversity of classification categories compared to previous studies on colon polyp classification; (2) We introduced the dilated convolution and the improved attention mechanism into the residual block to obtain more feature information of small polyps. And the effect of data imbalance in our collected datasets was alleviated by CB Loss; (3) The proposed Polyp-DedNet was efficient on four- and six-category classification of colorectal polyps and significantly superior to other state-of-the-art classification networks. A more diverse and accurate multi-classification network based on the WASP and WHO classification criteria can assist doctors in colonoscopy, avoid unnecessary resection and detect adenomatous polyps as early as possible.
Machine learning (ML)-based CAD techniques have been widely used in colorectal classification tasks. For example, Shin et al. [17] proposed a dictionary-based learning scheme, using support vector machines (SVM) for the patch-level images and a simple threshold method for the whole image to classify polyp and normal (no polyps) images. Tamaki et al. [18] presented a scale-invariant feature transform (SIFT) algorithm to extract local features of colonoscopy images and implemented SVM with radial basis function (RBF) kernel to classify hyperplastic polyp, tubular adenoma, and cancer under narrow-band light, achieving an accuracy rate of 94.1%. However, the feature extraction process of ML-based CAD is difficult due to the influence of limited illumination conditions, blurred fields and variations in viewpoint [19].
Nowadays, unlike the manual feature extraction of traditional ML networks, deep convolutional neural networks (DCNN) can automatically extract features to complete the task of classifying colorectal polyps. Wang et al. [20] combined the global average pooling (GAP) and the classical deep learning network ResNet to design a ResNet-GAP network to classify polyps and normal under white light, with a test accuracy of 98%. Chen et al. [21] established a computer-aided system named DNN-CAD based on NBI to classify adenomatous and hyperplastic polyps smaller than 5 mm with a sensitivity of 96.3% and a shorter classification time than experts. Byrne et al. [22] designed a deep learning model based on the Inception network to achieve the real-time classification of diminutive adenomas and hyperplastic polyps based on NBI, and the model’s accuracy was 94%. Ozawa et al. [23] adopted Single Shot Multi Box Detector (SSD) network to build an automatic multi-classification and detection system for colorectal polyps under white light, achieving a classification accuracy of 83%. In their study, the polyp types include adenoma, hyperplastic polyp, SSAP, cancer, the others and normal. Wang et al. [24] used ResNet50 to classify the four conditions of polyps, inflammation, tumor and normal under white light, obtaining an accuracy of 94.48%. Most studies have focused on improving deep learning network structures for binary classification and detection of adenomas/non-adenomas, or polyps/normal. However, very limited studies were done on the multi-classification of colorectal polyps according to both WASP and WHO criteria [12]. Furthermore, most previous studies ignored the data imbalance in the colon polyp multi-classification datasets, which may lead to a falsely high overall classification accuracy.
ResNet is an effective convolutional neural network that solves the degradation problem and reduces the difficulty of deep network training [25]. As shown in Fig. 1a, ResNet50 mainly consists of two residual modules: Conv Block and ID Block. To obtain a large receptive field, images and feature maps are down-sampled by the pooling layer (Max pool) of stage 1 and each convolutional layer with large strides in Conv Blocks of stages 2 to 5. However, the resolution of the image or feature map is reduced after down-sampling, leaving only less spatial information, which will result in the information loss of some small adenomas in colorectal images and performance decrease in polyp classification and localization. In this paper, we build an improved Polyp-DedNet based on ResNet50, which is shown in Fig. 1b. In Polyp-DedNet, dilated convolutions with the dilated factors of 2 and 4 are respectively applied in IDE block and Conv Block of stages 4 and 5 to keep the spatial resolution for deep neural network without costing too much time and memory, reduce the down-sampling factor and obtain an effective large receptive field. Efficient Channel Attention (ECA) modules are also used in IDE blocks and Conv Blocks of stages 2 to 5 to further improve the classification performance of the network. Furthermore, to eliminate gridding artifacts caused by dilated convolutions, two traditional convolutional layers are applied in stage 1 rather than the max pooling layer, and two dilated convolutional layers (ConvE-layer) with progressively decreasing dilation are added at the end of stage 5. Due to the inevitable imbalance of medical image data, a regularization method named DropBlock and the CB loss are performed to prevent network overfitting.

Figure 1: The architecture of (a) ResNet50 and (b) Polyp-DedNet. Here, d represents the dilation factor with the value of 4, 2 or 1
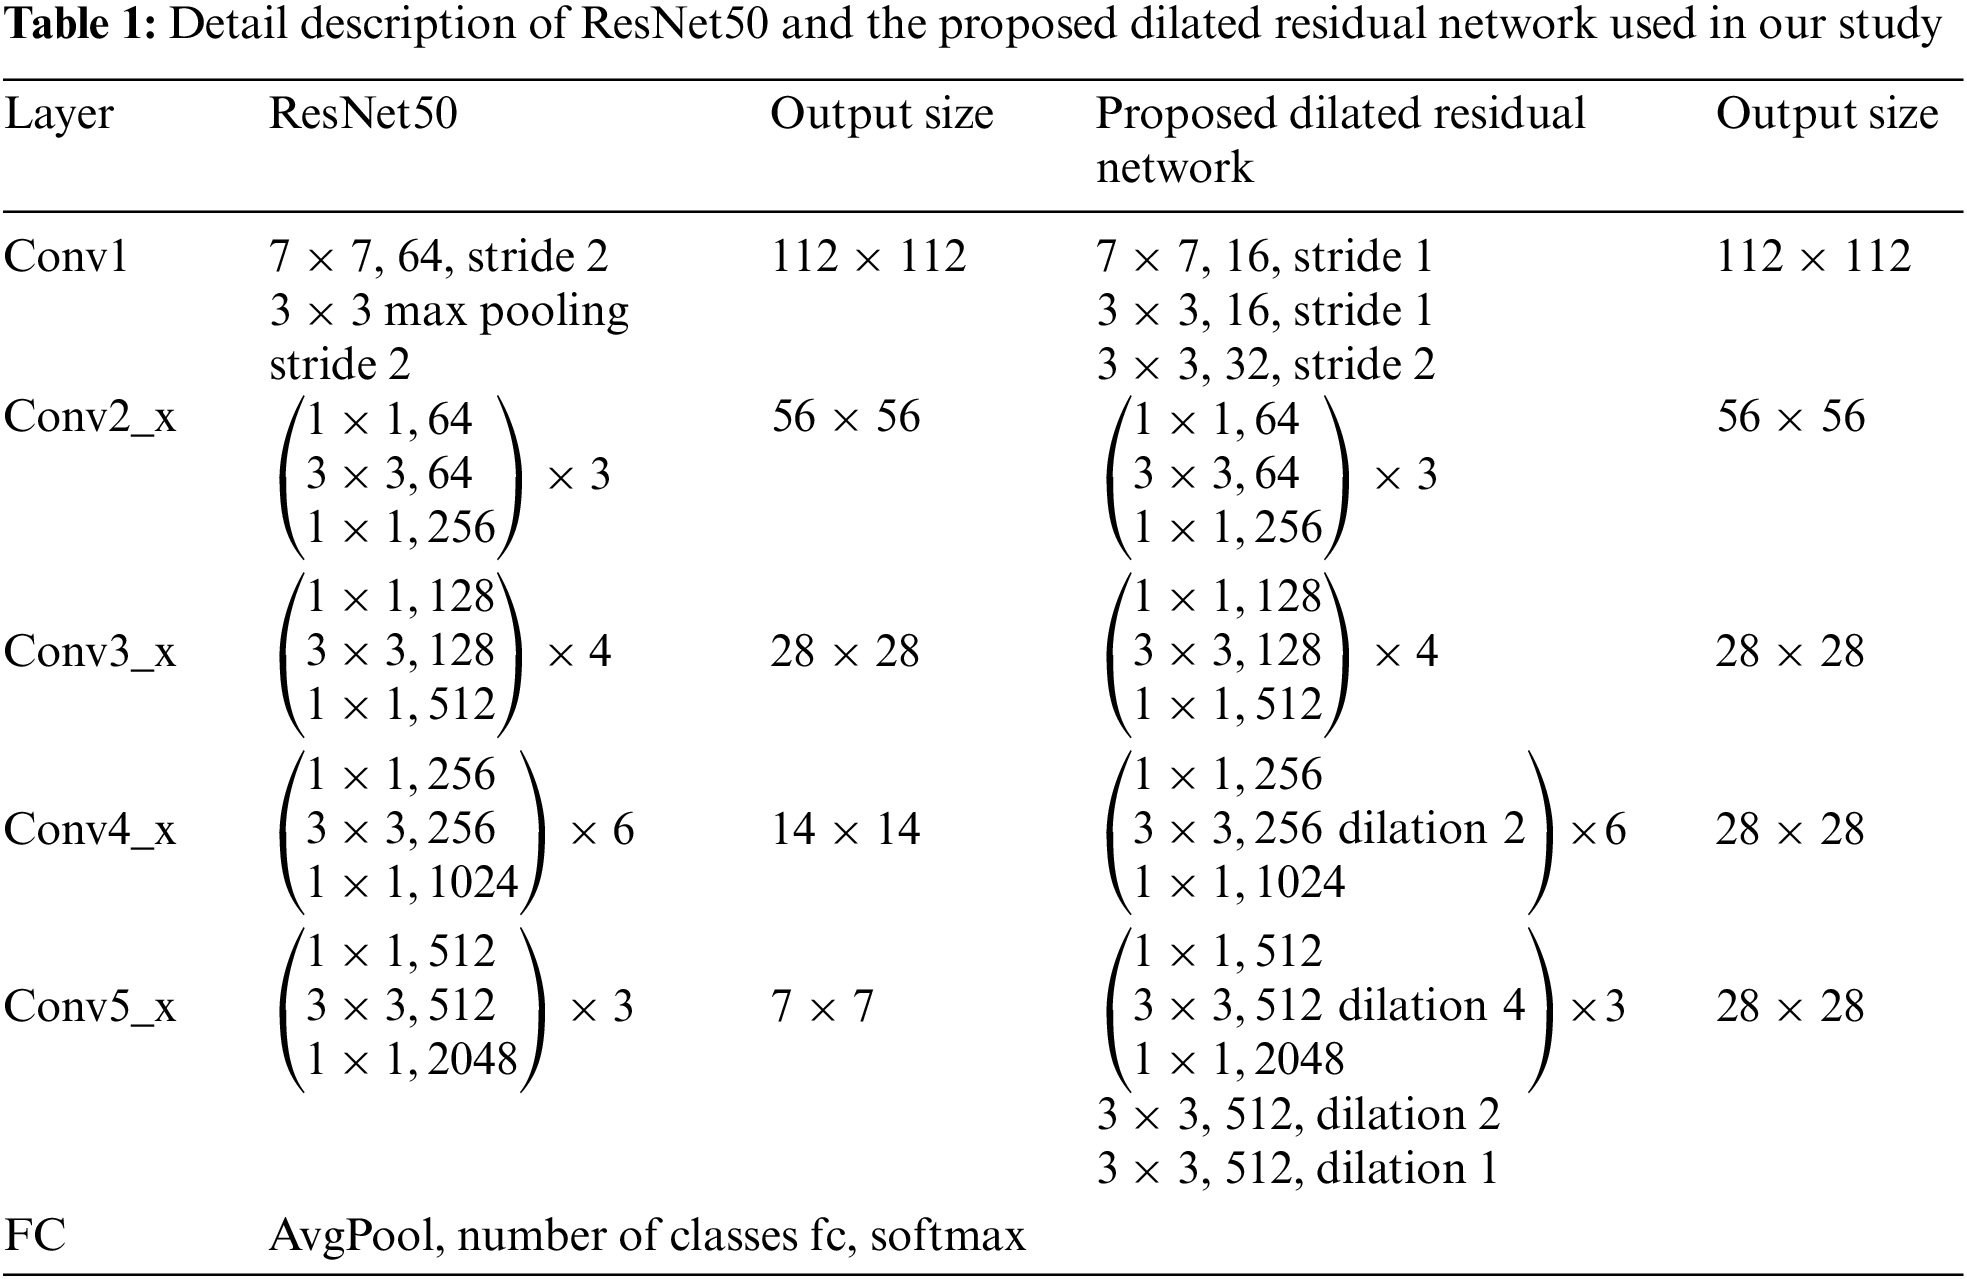
The detail description of ResNet50 is formed from five stages of convolutional layers presented in the left three columns of Table 1. The first layer in each stage performs a down-sampling process by striding. We define
where
To increase the resolution of output feature maps without reducing the receptive field of each output unit, dilated convolution is adopted in the final two stages,
For
where all
where all
However, employing dilated convolution may cause gridding artifacts, especially when a feature map has higher-frequency content than the sampling rate of the dilated convolution. Additionally, the max pooling layer after the initial 7 × 7 convolution, which leads to high-amplitude high-frequency activations, will also eventually aggravate gridding artifacts. In this case, we further modify the dilated residual network and replace the maximum pooling with convolution layers. In addition, we add two convolution layers with progressively decreasing dilation to the final group of the network, adopting filters of appropriate frequency, so that gridding artifacts are better eliminated. Compared to ResNet50 which has an output resolution of 7 × 7, the proposed dilated residual network with an output size of 28 × 28 can obtain more spatial information and identify small polyps without wasting unnecessary computational power to improve the classification performance of the network.
With the attention mechanism, the deep learning network can divert attention to the most important areas of an image while ignoring irrelevant parts, which can be treated as a dynamic weight adjustment process according to the features of the input image. To bring performance gain further for our proposed network and avoid high model complexity, we apply ECA [26], a lightweight channel attention module, to all the residual blocks of IDE and ConvE in our network. The residual block structures of IDE Block and ConvE Block with the incorporation of the ECA module are shown in Figs. 2a and 2b, respectively. As an improved attention mechanism based on Squeeze-and-Excitation Networks (SE) [27], ECA can effectively capture cross-channel interaction information without dimensionality reduction. The structure of the ECA module is presented in Fig. 2c.

Figure 2: The architectures of ECA and the residual blocks with ECA module in the proposed Polyp-DedNet. (a) ConvE block with the incorporation of ECA. (b) IDE block with the incorporation of ECA. (c) The structure of the ECA module
As illustrated in Fig. 2c, after adopting channel-level GAP to aggregate features without dimensionality reduction, a 1D convolution is implemented to capture local cross-channel interactions between each channel and the corresponding
where
In this study, the collected polyp datasets are unbalanced, and the amount of image data in some categories is relatively small, which is prone to over-fitting in the training process of the proposed network. Therefore, we adopt a regularization method DropBlock after convolution layers (ConvE-layer) and residual modules (IDE block) in stages 4 and 5 of the proposed network to improve generalization ability and reduce overfitting, which is shown in Fig. 1b.
DropBlock has two hyperparameters,
where
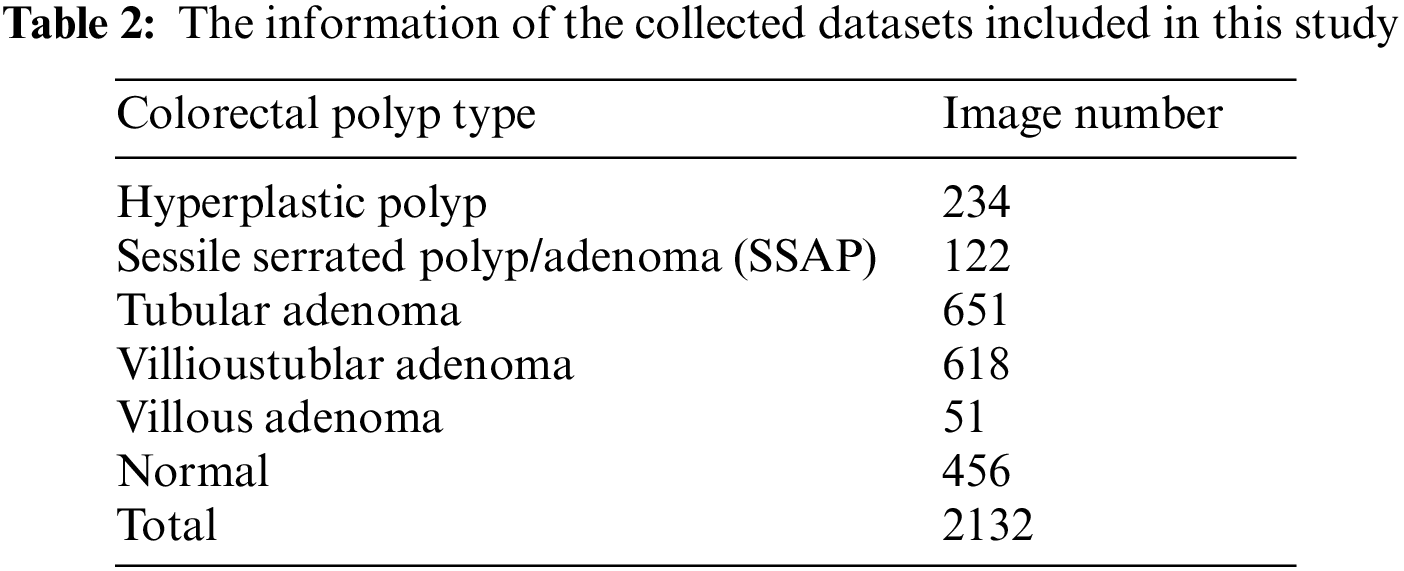
Colonoscopy images and pathological information were collected retrospectively from the Affiliated Hospital of Hebei University, from June 1, 2016 to June 1, 2019. All the specimens were examined by certified pathologists and histologically confirmed. Patients who had been histologically confirmed with conventional adenoma (tubular, villioustublar, villous), sessile serrated polyp/adenoma (SSAP), hyperplastic polyp and normal (no polyps), were included in this study. Only the unamplified images observed in conventional white-light or NBI mode were selected. In this study, insufficiently insufflated colorectal images and unclear images with stool residue, halation, or bleeding were excluded. Finally, we collected 2132 images from 436 patients that contain six types of endoscopic colorectal disease images, which are shown in Table 2.
In order to build the classification models, the above datasets were classified by patients and randomly divided into the training set and test set in a ratio of 4:1. To develop our deep learning network more effectively, the training set was increased by a factor of 4 with data augmentation methods of horizontal flip, vertical flip, noise, and rotation to 6823 images. Considering that the collected colonoscopy images ranged from 424 × 368 to 1920 × 1080 pixels, they were uniformly resized to 224 × 224 pixels according to the network training requirements.
The Polyp-DedNet was pre-trained using the ImageNet Large Scale Visual Recognition Challenge datasets, that is, using transfer learning to improve the classification performance of the network. The network parameters were optimized by the Adam algorithm with an initial learning rate of 0.0001. All programs were run on an Ubuntu 18.04.5 LTS PC with one RTX 2080Ti GPU and Intel (R) Core i7-7800X 3.5-GHz CPU.
Cross-entropy (CE) loss function is often used for deep learning network training. In this paper, to address the problem of training on imbalanced data, we adopted CB sigmoid cross-entropy loss by introducing a weighted factor that was inversely proportional to the effective number of samples. The CB sigmoid cross-entropy loss is formulated as:
where
To evaluate the classification performance of the Polyp-DedNet network, we introduced four metrics including accuracy, recall, precision, and F1 Score [28], which can be calculated by the following formulas:
where TP, FP, TN and FN denote the numbers of true positives, false positives, true negatives, and false negatives, respectively.
In this study, 5-fold cross-validation was used to analyze the network performance for four- and six-category classifications. The difference between the proposed model Polyp-DedNet and comparative models were calculated for each performance metric using the paired t-test. The p-value of <0.05 was considered to indicate a statistically significant difference between groups.
5.1 Evaluation of Loss Function During Training
To evaluate the effect of loss function on data imbalance during training, we compared two specific methods’ performance, including CE loss and CB sigmoid cross-entropy loss. As shown in Fig. 3, while the train loss and the test loss gradually converged to 0.20 ± 0.03 and 0.65 ± 0.03 when training with the proposed Polyp-DedNet with CE loss, they gradually converged to 0.04 ± 0.01 and 0.10 ± 0.01 with CB sigmoid cross-entropy loss. In this case, our Polyp-DedNet had a faster convergence rate and a lower value for final loss with the implementation of CB sigmoid cross-entropy loss for network training compared with the use of CE loss. To a certain extent, the performance degradation caused by data imbalance was alleviated, especially with CB sigmoid cross-entropy loss.

Figure 3: The dynamic changes of training loss and test loss during the training of Polyp-DedNet with CE loss and CB sigmoid cross-entropy loss
5.2 Testing of the Proposed Method
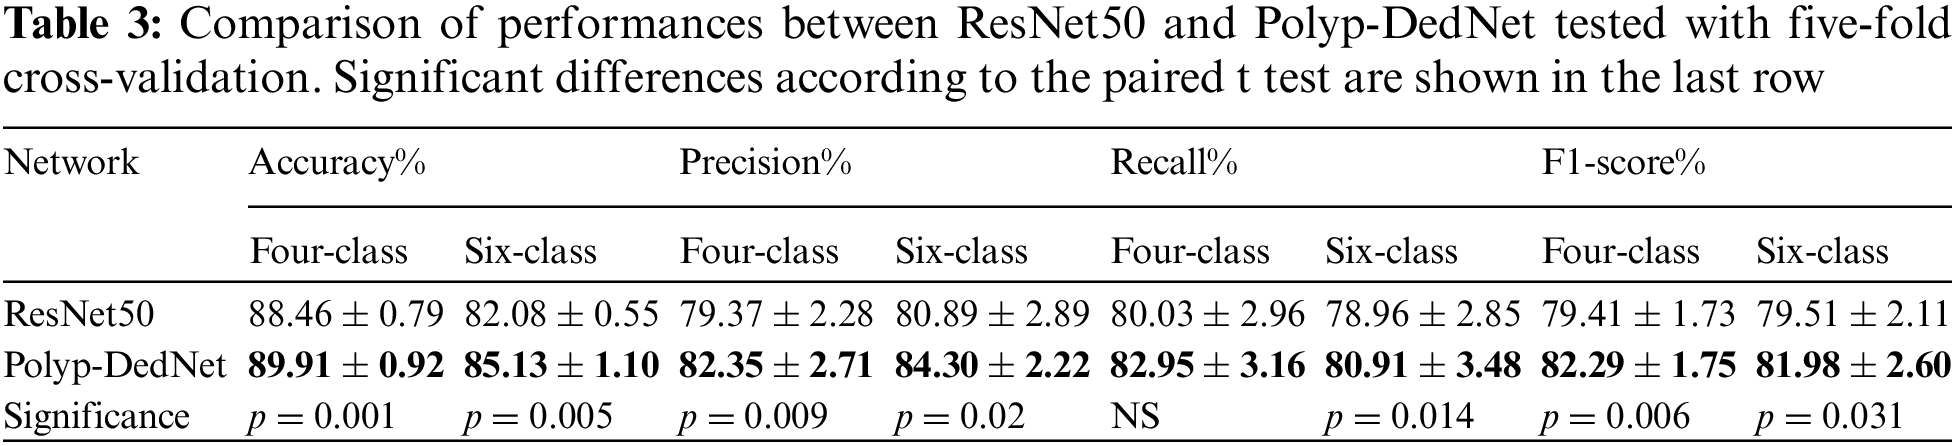
The four- and six-category performance tests on a test set of 426 images were performed on the ResNet50 and Polyp-DedNet, respectively. Results of the five-fold cross-validation for the classifications were listed in Table 3, in which the best for each metric was highlighted. For the four-category classification task, although Polyp-DedNet achieved insignificant increment in recall compared with the baseline ResNet50 (p = 0.068), the remaining metrics including accuracy (89.91 ± 0.92 vs. 88.46 ± 0.79, p = 0.001), precision (82.35 ± 2.71 vs. 79.37 ± 2.28, p = 0.009) and F1-score (82.29 ± 1.75 vs. 79.41 ± 1.73, p = 0.006) were significantly improved. Therefore, the overall performance of Polyp-DedNet for colorectal polyp classification was superior to that of ResNet50. For the six-category classification task, the cross-validation results illustrated the performance of the developed network was significantly improved in all evaluation metrics to varying degrees compared with the baseline network (p < 0.05). The above results confirmed that extracting more spatial features from the input colonoscopy images can facilitate the network’s effect on multi-classification.
5.3 Analysis of Confusion Matrix
In order to further compare the classification ability between ResNet50 and Polyp-DedNet, heat maps of the confusion matrix for the four- and six-category classifications were shown in Fig. 4, in which the row and column represented the actual category and predicted category, respectively.

Figure 4: Confusion matrix of ResNet50 and Polyp-DedNet for classification of colorectal polyps on 426 images in our test set. (a) Matrix of ResNet50 for four classes. (b) Matrix of Polyp-DedNet for four classes. (c) Matrix of ResNet50 for six classes. (d) Matrix of Polyp-DedNet for six classes
In the four-classification task, the proposed Polyp-DedNet outperformed ResNet50 in classifying colorectal polyp images of adenomas and normal, with similar performance in classifying hyperplastic polyps and sessile serrated adenoma/polyp (SSAP). In addition, both networks provided more than 90% achievable performance for the classifications of adenomas and normal. In contrast, the performances of classifying other categories of polyps were relatively lower with the fact that most of them were misclassified as adenomas (see Figs. 4a and 4b). It is worth mentioning that the training data for hyperplastic polyps and sessile serrated adenoma/polyp (SSAP) were much less than that of adenomas, and SSAP was more difficult to be distinguished than other polyps in clinical practice. In the six-category classification task, although our proposed framework provided comparable performance for the classifications of normal and villous adenomas with ResNet50, it achieved higher performance consistently for the classifications of hyperplasia, sessile serrated adenoma/polyp (SSAP), tubular adenoma and villoustubular adenoma with the improvements varied from 2% to 6%. In particular, the network Polyp-DedNet correctly classified more than 90% of normal and tubular adenoma images due to its increased focus on high-dimensional spatial information.
We further measured the standalone performance of the networks by the overall and class-specific ROC curves and the area under ROC curve (AUC) of four and six pathological types with an epoch set of 100, respectively. The larger the value of AUC, the better the performance of the network. The metric changes tend to level off after an average of 70 epochs. For the four-category classification, as shown in Figs. 5a and 5b, the Polyp-DedNet was almost at a higher classification level in adenoma, normal and SSAP. The AUCs were as follows: adenoma, 0.9645 vs. 0.9742, normal, 0.9949 vs. 0.9966, SSAP, 0.9576 vs. 0.9587. For the classification of hyperplastic polyps, Polyp-DedNet performed slightly worse than ResNet50 (AUC, 0.9073 vs. 0.9062).

Figure 5: Receiver Operating Characteristic (ROC) Curves for four and six classifications of ResNet50 and Polyp-DedNet in our test datasets (a) ROC of ResNet50 for four classes (b) ROC of Polyp-DedNet for four classes (c) ROC of ResNet50 for six classes (d) ROC of Polyp-DedNet for six classes
In the six-category classification, the AUCs of Polyp-DedNet were significantly higher than those of ResNet50 for the hyperplastic polyps, tubular, villioustublar and villious adenomas. However, the Polyp-DedNet performed slightly worse for normal and SSAP with lower AUCs than the pre-improved ResNet50. In addition, the improved network Polyp-DedNet showed overall competitive multi-classification performance with a mean AUC of 0.9593.
5.5 Analysis of Class Activation Map
To display the area of interest in the colonoscopy image more intuitively, representative class activation map (CAM) images of ResNet50 and Polyp-DedNet for multi-classification of polyps were generated, including hyperplastic polyps, (tubular, villioustublar and villious) adenomas and SSAP. As shown in Fig. 6, while both the networks ResNet50 and Polyp-DedNet could accurately localize hyperplastic polyps and villous adenomas (see the column (a) and (c) of Fig. 6), our proposed network Polyp-DedNet captured villioustublar adenomas (see the column (b) of Fig. 6) and tubular adenomas (see the column (e) of Fig. 6) more accurately. It can be also observed that when the point of interest contained distinct categories of targets (i.e., a SSAP indicated by the red arrow and a non-SSAP polyp indicated by the yellow dashed box in the column (d) of Fig. 6), the attended areas of ResNet50 were broadly distributed on both of them, whereas the attention focus of Polyp-DedNet was more precise on the characteristic area of SSAP, thereby extracting pathological features of colorectal polyps more effectively. Therefore, the extracted classification discrimination area of the proposed Polyp-DedNet was more consistent with the cognition of experts, which partially enhanced the applicability of deep learning.

Figure 6: Class activation maps of ResNet50 and Polyp-DedNet for classification of several colorectal polyps. (a) Hyperplastic polyp. (b) Villioustublar adenoma. (c) Villous adenoma. (d) SSAP. (e) Tubular adenoma. The red arrows highlight the locations of polyps
5.6 Comparative Analysis with Other Networks
In order to further verify the colorectal polyp classification performance of Polyp-DedNet, we performed comparative experiments with several state-of-the-art methods in terms of accuracy, precision, recall and F1-score, in which all the deep learning networks were built based on pre-trained ImageNet. In order to ensure the fairness of test results comparison, each network was trained under the same condition and tested on the same datasets. The six-category test results from five-fold cross-validation for each network were presented in Table 4. It can be seen that Polyp-DedNet achieved the best performance in terms of selected evaluation indicators, which yielded an accuracy of 85.13% ± 1.10%, a precision of 84.30% ± 2.22%, a recall of 80.91% ± 3.48% and an F1-score of 81.98% ± 2.60%. As shown in Fig. 7, Polyp-DedNet was remarkably superior to MobileNetV3 according to all four indicators (p < 0.01, paired t test). Besides, the precision of Polyp-DedNet was significantly higher than that of EfficientNetV2, and the metrics of recall and F1-score were consistently higher than those of RegNet (p < 0.01). In addition, compared with EfficientNetV2, Polyp-DedNet enhanced in various indicators and achieved a statistically significant improvement in the average precision (1.64%; p < 0.05) of multi-classification. In summary, with the more effective ability of feature extraction, the proposed Polyp-DedNet has excellent recognition ability for colorectal polyps with varying pathological types.
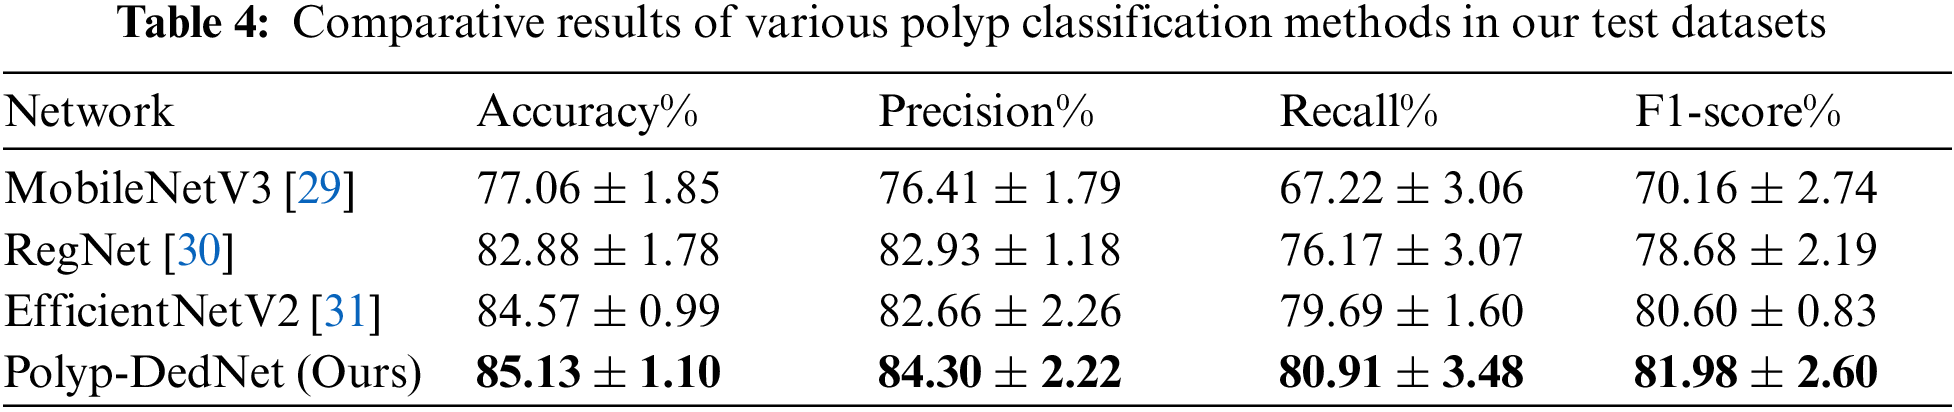

Figure 7: Performance comparison between the Polyp-DedNet and contrast networks of MobileNet, RegNet and EffcientNetV2, in which * denotes p < 0.05, ** denotes p < 0.01 and *** denotes p < 0.001
In this paper, we proposed a convolutional neural network named Polyp-DedNet, which is applied to the task of four- and six-category classifications of colorectal polyps based on the WASP and WHO medical classification standards under white light and narrow-band light. The experimental results of the four- and six-category classifications showed that the developed Polyp-DedNet could be used in the multi-classification task of common colorectal polyps, which helps to reduce superfluous resection and improve the sensitivity for the defection of early lesions in the clinical field. In the future, we will need to rationally validate the network through randomized clinical trials to help accurately classify colorectal polyps in actual colorectal examinations and assist doctors in choosing the best treatment strategy.
Funding Statement: This work was funded by the Research Fund for Foundation of Hebei University (DXK201914), the President of Hebei University (XZJJ201914), the Post-graduate’s Innovation Fund Project of Hebei University (HBU2022SS003), the Special Project for Cultivating College Students' Scientific and Technological Innovation Ability in Hebei Province (22E50041D), Guangdong Basic and Applied Basic Research Foundation (2021A1515011654), and the Fundamental Research Funds for the Central Universities of China (20720210117).
Conflicts of Interest: We declare that we do not have any commercial or associative interest that represents a conflict on interest in connection with the work submitted.
References
1. W. Cao, H. Da Chen, Y. W. Yu, N. Li and W. Q. Chen, “Changing profiles of cancer burden worldwide and in China: A secondary analysis of the global cancer statistics 2020,” Chinese Medical Journal, vol. 134, no. 7, pp. 783–791, 2021. [Google Scholar] [PubMed]
2. A. G. Zauber, S. J. Winawer, M. J. O’Brien, I. Lansdorp-Vogelaar, M. van Ballegooijen et al., “Colonoscopic polypectomy and long-term prevention of colorectal-cancer deaths,” New England Journal of Medicine, vol. 366, no. 8, pp. 687–696, 2012. [Google Scholar] [PubMed]
3. D. K. Rex, C. R. Boland, J. A. Dominitz, F. M. Giardiello, D. A. Johnson et al., “Colorectal cancer screening: Recommendations for physicians and patients from the U.S. multi-society task force on colorectal cancer,” The American Journal of Gastroenterology, vol. 112, no. 7, pp. 1016–1030, 2017. [Google Scholar] [PubMed]
4. B. I. Lee, S. P. Hong, S. E. Kim, S. H. Kim, H. S. Kim et al., “Korean guidelines for colorectal cancer screening and polyp detection,” Clinical Endoscopy, vol. 45, no. 1, pp. 25–43, 2012. [Google Scholar] [PubMed]
5. W. B. Strum, “Colorectal adenomas,” New England Journal of Medicine, vol. 374, no. 11, pp. 1065–1075, 2016. [Google Scholar] [PubMed]
6. K. Bibbins-Domingo, D. C. Grossman, S. J. Curry, K. W. Davidson, J. W. Epling Jr et al., “Screening for colorectal cancer: US preventive services task force recommendation statement,” JAMA, vol. 315, no. 23, pp. 2564–2575, 2016. [Google Scholar] [PubMed]
7. M. A. Almadi, M. Sewitch, A. N. Barkun, M. Martel and L. Joseph, “Adenoma detection rates decline with increasing procedural hours in an endoscopist’s workload,” Canadian Journal of Gastroenterology = Journal Canadien de Gastroenterologie, vol. 29, no. 6, pp. 304–308, 2015. [Google Scholar]
8. M. Yamada, T. Sakamoto, Y. Otake, T. Nakajima, A. Kuchiba et al., “Investigating endoscopic features of sessile serrated adenomas/polyps by using narrow-band imaging with optical magnification,” Gastrointestinal Endoscopy, vol. 82, no. 1, pp. 108–117, 2015. [Google Scholar] [PubMed]
9. M. L. Giger, K. Doi and H. MacMahon, “Image feature analysis and computer-aided diagnosis in digital radiography. 3. Automated detection of nodules in peripheral lung fields,” Medical Physics, vol. 15, no. 2, pp. 158–166, 1988. [Google Scholar] [PubMed]
10. S. Fan, L. Xu, Y. Fan, K. Wei and L. Li, “Computer-aided detection of small intestinal ulcer and erosion in wireless capsule endoscopy images,” Physics in Medicine and Biology, vol. 63, no. 16, pp. 1–10, 2018. [Google Scholar]
11. M. A. Khan, T. Akram, M. Sharif, K. Javed, M. Rashid et al., “An integrated framework of skin lesion detection and recognition through saliency method and optimal deep neural network features selection,” Neural Computing and Applications, vol. 32, no. 20, pp. 15929–15948, 2019. [Google Scholar]
12. J. E. G. IJspeert, B. A. Bastiaansen, M. E. van Leerdam, G. A. Meijer, S. van Eeden et al., “Development and validation of the WASP classification system for optical diagnosis of adenomas, hyperplastic polyps and sessile serrated adenomas/polyps,” Gut, vol. 65, no. 6, pp. 963–970, 2016. [Google Scholar] [PubMed]
13. C. C. Göret and N. E. Göret, “Histopathological analysis of 173 consecutive patients with colorectal carcinoma: A pathologist’s view,” Medical Science Monitor: International Medical Journal of Experimental and Clinical Research, vol. 24, pp. 6809–6815, 2018. [Google Scholar]
14. J. E. G. Ijspeert, R. Bevan, C. Senore, M. F. Kaminski, E. J. Kuipers et al., “Detection rate of serrated polyps and serrated polyposis syndrome in colorectal cancer screening cohorts: A European overview,” Gut, vol. 66, no. 7, pp. 1225–1232, 2017. [Google Scholar] [PubMed]
15. G. Ghiasi, T. Y. Lin and Q. V. Le, “DropBlock: A regularization method for convolutional networks,” Advances in Neural Information Processing Systems, vol. 2018-December, pp. 10727–10737, 2018. [Google Scholar]
16. Y. Cui, M. Jia, T. -Y. Lin, Y. Song and S. Belongie, “Class-balanced loss based on effective number of samples,” in Proc. of the IEEE Conf. on Computer Vision and Pattern Recognition, Long Beach, CA, USA, pp. 9260–9269, 2019. [Google Scholar]
17. Y. Shin and I. Balasingham, “Automatic polyp frame screening using patch based combined feature and dictionary learning,” Computerized Medical Imaging and Graphics, vol. 69, pp. 33–42, 2018. [Google Scholar] [PubMed]
18. T. Tamaki, J. Yoshimuta, T. Takeda, B. Raytchev, K. Kaneda et al., “A system for colorectal tumor classification in magnifying endoscopic NBI images,” Lecture Notes in Computer Science (including subseries Lecture Notes in Artificial Intelligence and Lecture Notes in Bioinformatics), vol. 6493 LNCS, no. PART 2, pp. 452–463, 2011. [Google Scholar]
19. S. Poudel, Y. J. Kim, D. M. Vo and S. W. Lee, “Colorectal disease classification using efficiently scaled dilation in convolutional neural network,” IEEE Access, vol. 8, pp. 99227–99238, 2020. [Google Scholar]
20. W. Wang, J. Tian, C. Zhang, Y. Luo, X. Wang et al., “An improved deep learning approach and its applications on colonic polyp images detection,” BMC Medical Imaging, vol. 20, no. 1, pp. 1–15, 2020. [Google Scholar]
21. P. J. Chen, M. C. Lin, M. J. Lai, J. C. Lin, H. H. S. Lu et al., “Accurate classification of diminutive colorectal polyps using computer-aided analysis,” Gastroenterology, vol. 154, no. 3, pp. 568–575, 2018. [Google Scholar] [PubMed]
22. M. F. Byrne, N. Chapados, F. Soudan, C. Oertel, M. Linares Pérez et al., “Real-time differentiation of adenomatous and hyperplastic diminutive colorectal polyps during analysis of unaltered videos of standard colonoscopy using a deep learning model,” Gut, vol. 68, no. 1, pp. 94–100, 2019. [Google Scholar] [PubMed]
23. T. Ozawa, S. Ishihara, M. Fujishiro, Y. Kumagai, S. Shichijo et al., “Automated endoscopic detection and classification of colorectal polyps using convolutional neural networks,” Therapeutic Advances in Gastroenterology, vol. 13, pp. 1–13, 2020. [Google Scholar]
24. Y. Wang, Z. Feng, L. Song, X. Liu and S. Liu, “Multiclassification of endoscopic colonoscopy images based on deep transfer learning,” Computational and Mathematical Methods in Medicine, vol. 2021, pp. 1–12, 2021. [Google Scholar]
25. K. He, X. Zhang, S. Ren and J. Sun, “Deep residual learning for image recognition,” in Proc. of the IEEE Conf. on Computer Vision and Pattern Recognition, Las Vegas, NV, USA, pp. 770–778, 2016. [Google Scholar]
26. Q. Wang, B. Wu, P. Zhu, P. Li, W. Zuo et al., “ECA-Net: Efficient channel attention for deep convolutional neural networks,” in Proc. of the IEEE Conf. on Computer Vision and Pattern Recognition, Seattle, WA, USA, pp. 11531–11539, 2020. [Google Scholar]
27. J. Hu, L. Shen, S. Albanie, G. Sun and E. Wu, “Squeeze-and-excitation networks,” IEEE Transactions on Pattern Analysis and Machine Intelligence, vol. 42, no. 8, pp. 2011–2023, 2020. [Google Scholar] [PubMed]
28. D. M. W. Powers, “Evaluation: From precision, recall and F-measure to ROC, informedness, markedness and correlation,” Journal of Machine Learning Technologies, vol. 2, no. 1, pp. 37–63, 2011. [Google Scholar]
29. A. Howard, M. Sandler, B. Chen, W. Wang, L. C. Chen et al., “Searching for MobileNetV3,” in Proc. of the IEEE Conf. on Computer Vision and Pattern Recognition, Long Beach, CA, USA, pp. 1314–1324, 2019. [Google Scholar]
30. I. Radosavovic, R. P. Kosaraju, R. Girshick, K. He and P. Dollár, “Designing network design spaces,” in Proc. of the IEEE Conf. on Computer Vision and Pattern Recognition, Seattle, WA, USA, pp. 10425–10433, 2020. [Google Scholar]
31. M. Tan and Q. V. Le, “EfficientNetV2: Smaller models and faster training,” in Proc. of the 38th Int. Conf. on Machine Learning, vol. 139, pp. 10096–10106, 2021. [Google Scholar]
Cite This Article
 Copyright © 2023 The Author(s). Published by Tech Science Press.
This work is licensed under a Creative Commons Attribution 4.0 International License , which permits unrestricted use, distribution, and reproduction in any medium, provided the original work is properly cited.
 Downloads
 Citation Tools