
 Submit a Paper
 Propose a Special lssue
 Open Access
ARTICLE

Sine Cosine Optimization with Deep Learning-Based Applied Linguistics for Sentiment Analysis on COVID-19 Tweets
1 Department of Computer and Self Development, Preparatory Year Deanship, Prince Sattam bin Abdulaziz University, AlKharj, Saudi Arabia
2 Department of Applied Linguistics, College of Languages, Princess Nourah bint Abdulrahman University, P.O. Box 84428, Riyadh, 11671, Saudi Arabia
3 Department of English, College of Science and Arts at Mahayil, King Khalid University, Muhayil, 63763, Saudi Arabia
4 Department of Computer Sciences, College of Computing and Information System, Umm Al-Qura University, Makkah, 24211, Saudi Arabia
5 Department of Digital Media, Faculty of Computers and Information Technology, Future University in Egypt,New Cairo, 11845, Egypt
6 Department of English, College of Science & Humanities, Prince Sattam bin Abdulaziz University, AlKharj, Saudi Arabia
* Corresponding Author: Abdelwahed Motwakel. Email:
Computers, Materials & Continua 2023, 75(3), 4767-4783. https://doi.org/10.32604/cmc.2023.034840
Received 29 July 2022; Accepted 15 November 2022; Issue published 29 April 2023
 View Full Text
 Download PDF
Abstract
Applied linguistics is an interdisciplinary domain which identifies, investigates, and offers solutions to language-related real-life problems. The new coronavirus disease, otherwise known as Coronavirus disease (COVID-19), has severely affected the everyday life of people all over the world. Specifically, since there is insufficient access to vaccines and no straight or reliable treatment for coronavirus infection, the country has initiated the appropriate preventive measures (like lockdown, physical separation, and masking) for combating this extremely transmittable disease. So, individuals spent more time on online social media platforms (i.e., Twitter, Facebook, Instagram, LinkedIn, and Reddit) and expressed their thoughts and feelings about coronavirus infection. Twitter has become one of the popular social media platforms and allows anyone to post tweets. This study proposes a sine cosine optimization with bidirectional gated recurrent unit-based sentiment analysis (SCOBGRU-SA) on COVID-19 tweets. The SCOBGRU-SA technique aimed to detect and classify the various sentiments in Twitter data during the COVID-19 pandemic. The SCOBGRU-SA technique follows data pre-processing and the Fast-Text word embedding process to accomplish this. Moreover, the BGRU model is utilized to recognise and classify sentiments present in the tweets. Furthermore, the SCO algorithm is exploited for tuning the BGRU method’s hyperparameter, which helps attain improved classification performance. The experimental validation of the SCOBGRU-SA technique takes place using a benchmark dataset, and the results signify its promising performance compared to other DL models.Keywords
Social media plays a vital role and infuses everyone. It links individuals to the outside world. It offers a way to display our lives separately, comfortably, and on our terms [1]. Individuals highly depend on the tweets and posts shared on mass media platforms such as Instagram®, Twitter®, and Facebook®. It is expected that social networking sites must guide persons in receiving accurate and correct data on coronavirus disease (COVID-19) cases; however, examining the posts, it was seen that many had misled individuals by posting false figures and data [2]. COVID-19 has severely impacted the daily lives of individuals across the globe. People worldwide use online media to state their viewpoints and general feelings concerning this phenomenon that has assumed control over the world by storm. Social media platforms like Twitter have experienced exponential growth in tweets related to the pandemic in a short period. Social networking sites are not permitting people to get through this disaster; instead, the opinions and tweets on coronavirus infection turned out to be a dangerous and major cause that required managing misleading data from various origins [3]. The COVID-19 global pandemic has become a catastrophic event with a huge effect on the world’s economy that caused a rise in depression, unemployment, and psychological problems [4]. The short social, economic, and travel variations have inspired research from several domains, wherein computational modelling with machine learning (ML) was prominent, but it went through several difficulties because of the reporting and testing of cases. Deep learning (DL) techniques are important in predicting coronavirus infection trends in several parts of the world [5].
During the increase in coronavirus infection cases and strict lockdowns, people encountered various sentiments on social media like Twitter [6]. Social networking sites have played a significant role during the coronavirus infection, which has driven authors to analyze ML and natural language processing (NLP) approaches [7]. Sentiment analysis (SA) includes using NLP techniques to methodically learn emotional understanding and affective states of social groups or persons. It is noted that DL is an ML approach that was utilized for NLP tasks [8]. Excluding psychology studies, SA contains several applications, like framing better prediction models for trading stocks, and understanding customer behaviour and elections. Currently, there is a trend of utilizing DL-related language methods having trained data from Twitter for SA [9]. One of the previous studies started by employing NLP approaches like n-grams with hashtags to build trained data and ML approaches like Adaboost for classifying sentiment. DL techniques, namely convolutional neural networks (CNN), were employed for SA on Twitter [10].
This study presents a sine cosine optimization with bidirectional gated recurrent unit-based SA (SCOBGRU-SA) on COVID-19 tweets. The SCOBGRU-SA technique aimed to detect and classify the various types of sentiments that exist in Twitter data during the COVID-19 pandemic. To accomplish this, the SCOBGRU-SA technique follows data pre-processing and the Fast-Text word embedding process. Moreover, the BGRU model is utilized to recognise and classify sentiments present in the tweets. Furthermore, the SCO algorithm is exploited for tuning the BGRU model’s hyperparameter, which helps attain improved classification performance. The experimental validation of the SCOBGRU-SA technique takes place using a benchmark dataset.
In [11], an analysis of Twitter data can be made by the R programming language. The author collected Twitter data related to hashtag keywords, including COVID-19, new cases, coronavirus, deaths, and recovery rate. In this work, the author devised a Hybrid Heterogeneous Support Vector Machine (H-SVM), executed the sentiment classifiers, and categorized them negative, neutral, and positive sentiment scores. Alkhaldi et al. [12] offer a novel sunflower optimization with DL-driven sentiment analysis and classification (SFODLD-SAC) on COVID-19 tweets. The SFODLD-SAC techniques focused on detecting the people’s sentiment at the time of the COVID-19 pandemic. For this purpose, the SFODLD-SAC method pre-processes the tweets in different means, like removing stopwords, stemming, usernames, numerals, and link punctuations. Further, the term frequency-inverse document frequency (TF-IDF) can be implemented for the valuable feature extraction from the preprocessed data. Additionally, the cascaded recurrent neural network (CRNN) approach can be used for classifying and analyzing sentiments.
Pano et al. [13] modelled various text preprocessing approaches to correlate the sentiment scores of Twitter text with Bitcoin prices at the time of coronavirus infection. The author explored the effect of various preprocessing operations, structures, and time lengths of data over the correlating outcomes. The author finds that splitting sentences, eliminating Twitter-specific tags, or amalgamation usually enhances the relation of volume polarity scores with Bitcoin prices and sentiment scores out of 13 techniques. Chandrasekaran et al. [14] identify the sentiment linked with the pandemic by using tweets related to COVID-19 and utilizing the python libraries for performing the task. The author examines the people’s sentiment when COVID-19 infection has achieved a peak level utilizing the machine, TextBlob, and DL approach. The Author has categorized the sentiments into negative and positive classes by leveraging the ML techniques and DL-related bidirectional long short-term memory(Bi-LSTM) method.
In [15], the author executes Covid-19 tweets SA using a supervised ML technique. Detection of Covid19 sentiments from tweets will permit informed choices for superior management of the present pandemic situation. The employed dataset can be derived from Twitter utilizing IDs as offered by the IEEE data port. Tweets were derived by an in-house constructed flatterer that employs the Tweepy library. In [16], these tweets were derived from Twitter utilizing a Twitter API verification token. The raw tweets were saved and processed utilizing NLP. The data was then categorized utilizing a supervised k-nearest neighbor (KNN) classifier approach. Such classes denote the sentiment of people whose Tweets were derived for analysis. In [17], research conducted in various Spanish-speaking nations (Spain, Chile, Peru, and Mexico) was offered that addresses how the development of the epidemic had impacted the emotions articulated by persons on Twitter from March 2020 to March 2021. The author employed 3 million tweets to achieve this task. The Author uses a renowned structure named EmoWeb for capturing dynamic variations in the sentiment value of pandemic-based terms.
This study has developed a SCOBGRU-SA approach for SA on COVID-19 tweets. The SCOBGRU-SA technique aimed to detect and classify the sentiment in the Twitter data at the time of the COVID-19 pandemic. Fig. 1 depicts the overall working process of the SCOBGRU-S approach. Initially, the social media data is pre-processed to transform it to a useful format. Then, the word embedding process is performed. Next, the sentiments are classified by the use of BGRU model and the hyperparameter tuning process is carried out by the SCO algorithm.

Figure 1: Overall process of SCOBGRU-SA approach
Primarily, the SCOBGRU-SA technique follows data pre-processing and the Fast-Text word embedding process.
Initially, we detached every form of a symbol, like numbers #, @, !, $, %, &, and HTML tags, involved in the entire dataset. We employed a common expression model from the Python language to implement this phase [18].
The gathered dataset comprises upper and lower-case words. Then, transform each word into a lower case word.
Tokenization: This procedure splits the textual dataset into tokens (small portions) and removes each punctuation from the text dataset. nltk.tokenize model (inherent function in the nltk library) was applied in the study for tokenization.
Stop Words Removal: Stop word is a little word in a language that affects the performance, accuracy, and efficiency of the ML algorithm. This word is frequently applied in sentences to connect expressions or complete sentences. Some pronouns, Conjunctions, articles, and prepositions are stop-words. There exist around 400–500 stop-words in English, such as an, a, where, until does, above, who, will, that, when, but, what, on, by, once, about, after, again, too, all, am, against, and any, etc. Those terms would be removed from every document, and the processed document would be transferred to the following stage.
Stemming: This can be the procedure to transform a word’s grammatical forms, like its adjective, noun, adverb, verb, etc., into root form (termed lemma). The major aim is to acquire the elementary form of the term with a similar meaning. For instance, words like selection, select, selective, selections, selected, and selecting are stemmed from a lemma, that is, the word “select”. It is performed by the porter stemmer model from the Natural Language Toolkit (NLTK) library, which the stemming model often employs.
Feature extraction is utilized for improving the model performance. Inappropriate features in a dataset might reduce model performance and accuracy when improving trained costs. Selecting a massive number of features could improve the training time of the model. Here, the feature extraction method adapted is the count vectorizer. The scikit-learn toolkit in Python has greater effectiveness, termed CountVectorizer. It converts a text into a vector according to the frequency (count) of every word in the text. Also, it enables pre-processing of a provided textual dataset beforehand, generating the vector representation, which makes them a very flexible text feature demonstration module.
This method is the same as word2vec and gains a dense word vector. But the operational procedure of GloVe embedding is somewhat dissimilar from word2vec and is trained on aggregated word-word
3.2 Sentiment Analysis Using BGRU Model
In this study, the BGRU model is utilized to recognise and classify sentiments present in the tweets. A prominent type of recurrent neural network (RNN) is a gated recurrent unit (GRU), and to measure problems such as long-term memory and gradient in the backpropagation procedure, this method was exploited to resolve the problems, and it is relatively the same as long short-term memory (LSTM) [19]. Using consecutive datasets as input, recursion can be done in the evolutionary direction of a sequence using the category of RNN and the association of each neuron. The data is popular through the neuron from the own historical moment owing to the cyclic factor adding in the hidden state. The qualities of sharing memory and parameter exist in the RNN. The RNN gradient vanishing is a major challenge. Thus, long-term historic load features could not learn, and LSTM is projected through researcher workers, as the relationship data is learnt amidst the long short-term sequential dataset. GRU has been obtained to manage LSTM and its enormous parameter and moderate or slow convergence speed. Therefore, a well-known alternative to LSTM is GRU, as it has fewer parameters and may obtain a good learning performance and higher convergence rate. The GRU models comprise reset and update gates. Forget, and input gates of LSTM are substituted with the updating gate of GRU. The influence of output data of hidden layers was characterized as updating the gate at a previous instant in the hidden neuron state of existing moments. The impact rate is relatively higher if the values of the update gate are larger. At the last moment, the hidden neuron layer output is specified as the reset gate, and insufficient data is usually disregarded while the reset gate value is great.
The subsequent formula evaluates the hidden state:
Here,
The sigmoid function is signified as
The computation is shown below:
The calculation of
The hidden state
For the classifier problems, the execution of the cross-entropy loss function was generally performed. The likelihood of every class is calculated using the cross-entropy, and it mostly embodies
The following function is attained when the sigmoid function
The sigmoid function curve becomes smooth when the value of
Now, the label of sample
Furthermore, the SCO algorithm is exploited for tuning the hyperparameter of the BGRU model. in general terms, population-related optimizing methods initiate the optimizing procedure with random solutions set. This random set can be assessed repetitively by an objective function and enhanced by a rule set i.e., the core of an optimizing method [20]. As population-related optimisation approaches seek the optimisation of complexities stochastically, solutions cannot be found on a single run. But there comes a possibility of finding the global optimum rises because of the adequate number of random solutions and optimizing steps. Irrespective of the variances among methods in stochastic population-related optimization, the common was partitioning the optimizing procedure into 2 stages: exploitation and exploration. In the previous stage, an optimizing technique compiles the random solutions in the solution set shortly, having a higher rate of randomness for finding the promising areas of the search space. There were gradual variations in the random solution in the exploitation stage, and random differences were relatively lesser than those in the exploration stage. Fig. 2 exhibits the flowchart of SCO algorithm.

Figure 2: Flowchart of SCA
The SCO algorithm is a recent methodology which belongs to the family of population-based optimization techniques. The particularity of these algorithms lies in the movement of a search agent that makes use of two arithmetical operators based on the sine and cosine functions as follows:
Now,
The
In Eq. (10),
The technique will save the optimal solutions gained till now and allot it to destiny, and makes an update to other solutions. Simultaneously, ranges of cosine and sine functions were updated to highlight search space exploitation as the iteration counter rises [21]. The SCO approach will terminate the optimizing procedure if the iteration counter becomes high compared to the maximal quantity of iterations by default. But any other terminating condition is considered, like the precision of the global optimum obtained or a maximal number of function assessments. With the above operators, the presented method theoretically can fix the global optimum optimizing issues because of the following reasons:
• SCO technique forms and enhances a random solution set for an issue which is presented; thereby, it intrinsically aids from local optima avoidance and high exploration than individual-related techniques.
• Various areas of the search space were explored when the cosine and sine functions returned a value less than −1 or more than 1.
• Promising areas of the search space can be used if cosine and sine return values within −1 and 1.
• The SCA approach smoothly transfers from exploration to exploitation utilizing adaptive range in the cosine and sine functions.
• The optimal calculation of the global optimum was saved in a variable as the destiny point and never lost at the time of optimization.
• As the solutions continuously upgrade their places around the optimal solution gained till now, there comes a tendency on the optimal areas of the search spaces at the time of optimization.
• As the presented method will consider optimizing issues as black boxes, it can be voluntarily includable to complexities in various domains accounts to appropriate problem formulation.
The experimental assessment of the SCOBGRU-SA model is validated using a set of COVID-19 tweets. The dataset holds 6000 samples with three classes, as demonstrated in Table 1.
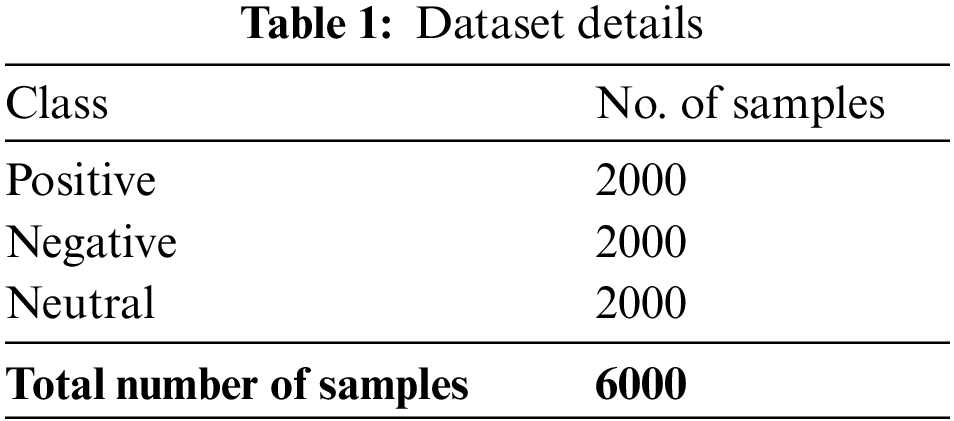
Fig. 3 shows the confusion matrix depicted by the SCOBGRU-SA model on the entire dataset. The figure indicated that the SCOBGRU-SA model had categorized 1940 samples into positive class, 1979 samples into negative class, and 1937 samples into neutral class.

Figure 3: Confusion matrix of SCOBGRU-SA approach under the entire dataset
Table 2 and Fig. 4 report a brief set of SA outcomes of the SCOBGRU-SA model on the entire dataset. The SCOBGRU-SA model has categorized positive samples with
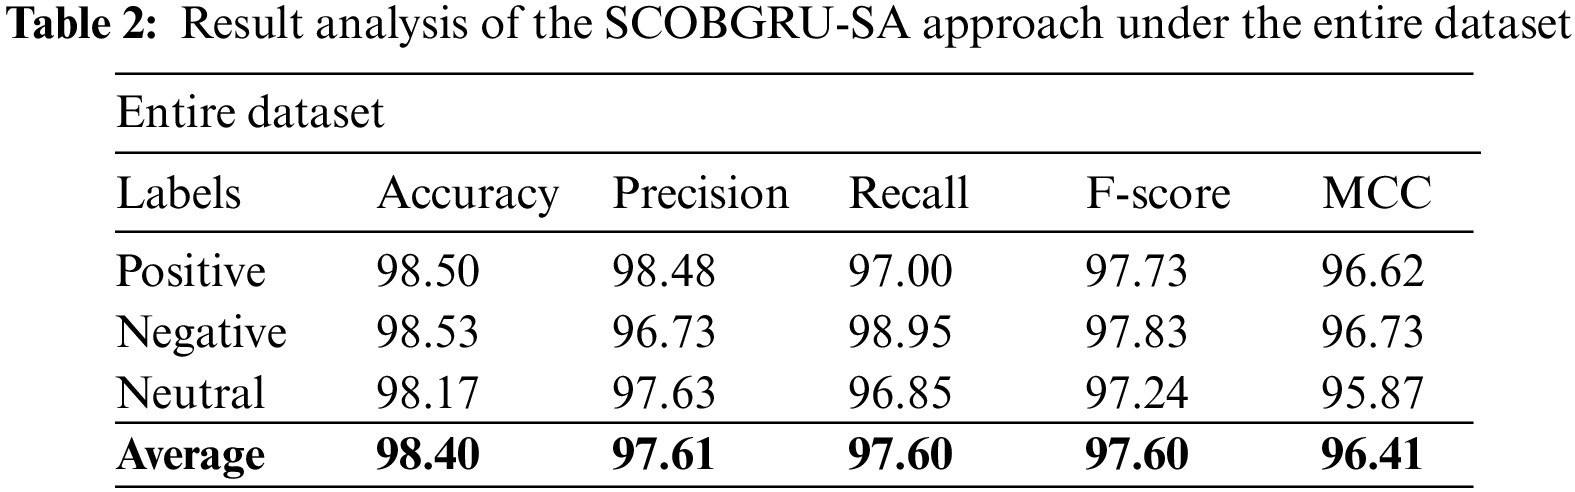

Figure 4: Result analysis of the SCOBGRU-SA approach under the entire dataset
Fig. 5 presents the confusion matrix portrayed by the SCOBGRU-SA methodology on 70% of training (TR) data. The figure denoted the SCOBGRU-SA approach has categorized 1353 samples into positive class, 1395 samples into negative class, and 1344 samples into neutral class.

Figure 5: Confusion matrix of SCOBGRU-SA approach under 70% of TR data
Table 3 and Fig. 6 portray a detailed set of SA outcomes of the SCOBGRU-SA approach on 70% of TR dataset. The SCOBGRU-SA methodology has categorized positive samples with
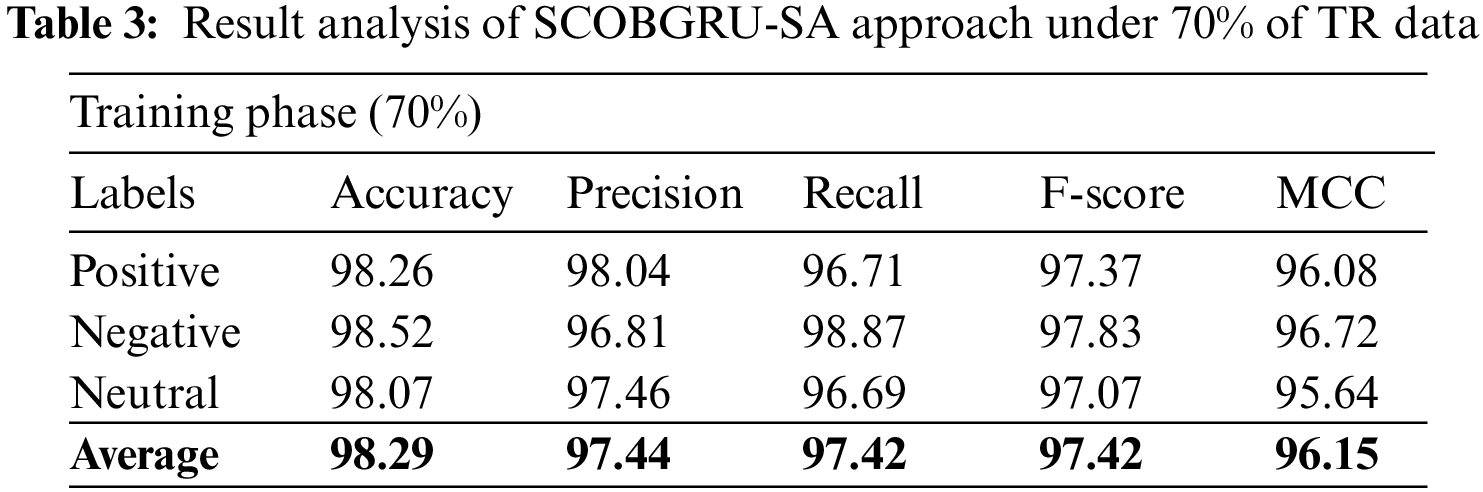

Figure 6: Result analysis of SCOBGRU-SA approach under 70% of TR data
Fig. 7 illustrates the confusion matrix the SCOBGRU-SA method on 30% of testing (TS) data. The figure specified the SCOBGRU-SA approach had categorized 587 samples into the positive class, 584 samples into the negative class, and 593 samples into the neutral class.

Figure 7: Confusion matrix of SCOBGRU-SA approach under 70% of TR data
Table 4 and Fig. 8 demonstrate a detailed set of SA outcomes of the SCOBGRU-SA approach on 30% of TS dataset. The SCOBGRU-SA algorithm has categorized positive samples with
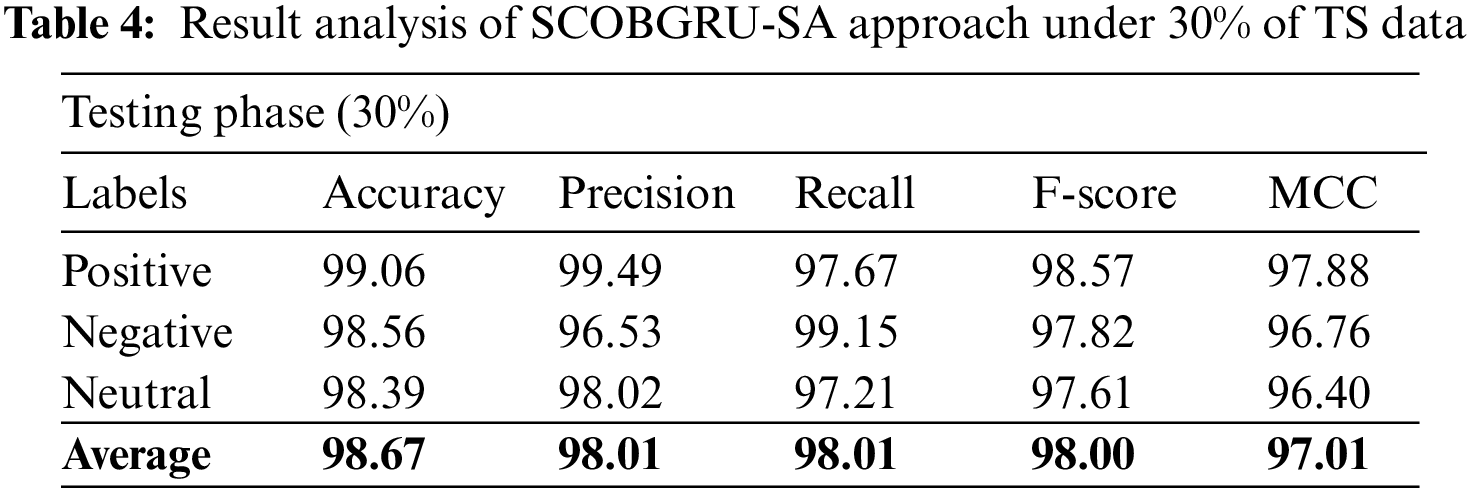

Figure 8: Result analysis of SCOBGRU-SA approach under 30% of TS data
The training accuracy (TRA) and validation accuracy (VLA) gained by the SCOBGRU-SA methodology on the test dataset is given in Fig. 9. The experimental outcome represents the SCOBGRU-SA approach maximal values of TRA and VLA. Seemingly the VLA is greater than TRA.

Figure 9: TRA and VLA analysis of the SCOBGRU-SA approach
The training loss (TRL) and validation loss (VLL) reached by the SCOBGRU-SA technique on the test dataset are displayed in Fig. 10. The experimental result denoted the SCOBGRU-SA technique has established the least values of TRL and VLL. Particularly, the VLL is lesser than TRL.

Figure 10: TRL and VLL analysis of the SCOBGRU-SA approach
A clear precision-recall analysis of the SCOBGRU-SA algorithm on the test dataset is shown in Fig. 11. The figure represents the SCOBGRU-SA methodology has resulted in enhanced precision-recall values under all classes.

Figure 11: Precision-recall analysis of the SCOBGRU-SA approach
A short receiver operating curve (ROC) study of the SCOBGRU-SA technique on the test dataset is portrayed in Fig. 12. The results denoted the SCOBGRU-SA method’s ability to categorize distinct classes on the test dataset.

Figure 12: ROC analysis of the SCOBGRU-SA approach
Table 5 offers detailed comparison results of the SCOBGRU-SA model with other recent models [22]. Fig. 13 provides a comparative
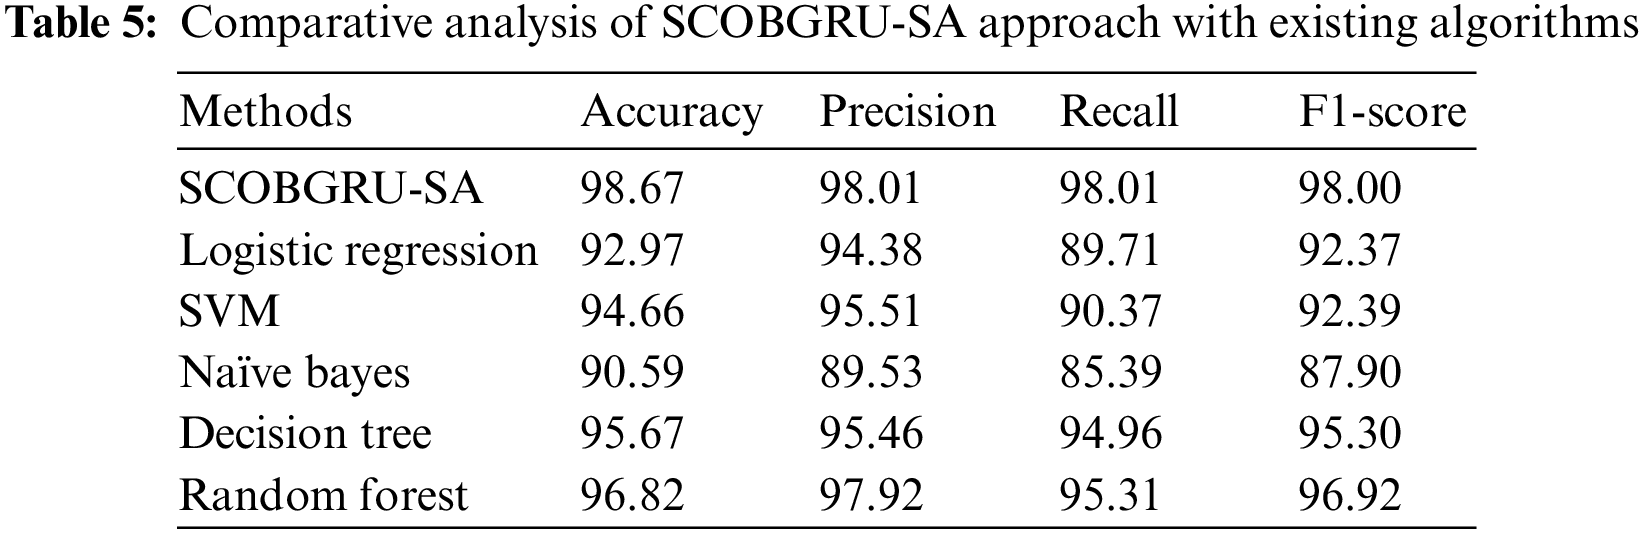

Figure 13:
Fig. 14 offers a detailed

Figure 14:
This article projected a SCOBGRU-SA approach for SA on COVID-19 tweets. The SCOBGRU-SA technique aimed to detect and classify the various types of sentiments in Twitter data during the COVID-19 pandemic. The SCOBGRU-SA technique follows data pre-processing and the Fast-Text word embedding process to accomplish this. Moreover, the BGRU model is utilized to recognise and classify sentiment in tweets. Furthermore, the SCO algorithm is exploited for tuning the BGRU method’s hyperparameter, which helps attain improved classification performance. The experimental validation of the SCOBGRU-SA technique takes place using a benchmark dataset, and the results signify its promising performance compared to other DL models with an accuracy of 98.67%. Therefore, the proposed model can be employed for accurate sentiment classification during COVID-19 pandemic. In the future, hybrid DL models can boost the classification results.
Funding Statement: The authors thank the Deanship of Scientific Research at King Khalid University for funding this work through Small Groups Project under grant number (120/43). Princess Nourah bint Abdulrahman University Researchers Supporting Project number (PNURSP2022R281), Princess Nourah bint Abdulrahman University, Riyadh, Saudi Arabia. The authors would like to thank the Deanship of Scientific Research at Umm Al-Qura University for supporting this work by Grant Code: (22UQU4331004DSR06).
Conflicts of Interest: The authors declare they have no conflicts of interest to report regarding the present study.
References
1. N. Chintalapudi, G. Battineni and F. Amenta, “Sentimental analysis of COVID-19 tweets using deep learning models,” Infectious Disease Reports, vol. 13, no. 2, pp. 329–339, 2021. [Google Scholar] [PubMed]
2. D. V. Cruz, V. F. Cortez, A. L. Chau and R. S. Almazán, “Does twitter affect stock market decisions? Financial sentiment analysis during pandemics: A comparative study of the h1n1 and the covid-19 periods,” Cognitive Computation, vol. 14, no. 1, pp. 372–387, 2022. [Google Scholar]
3. U. Naseem, I. Razzak, M. Khushi, P. W. Eklund and J. Kim, “COVIDSenti: A large-scale benchmark Twitter data set for COVID-19 sentiment analysis,” IEEE Transactions on Computational Social Systems, vol. 8, no. 4, pp. 1003–1015, 2021. [Google Scholar] [PubMed]
4. S. Boon-Itt and Y. Skunkan, “Public perception of the COVID-19 pandemic on Twitter: Sentiment analysis and topic modeling study,” JMIR Public Health and Surveillance, vol. 6, no. 4, pp. e21978, 2020. [Google Scholar]
5. R. Marcec and R. Likic, “Using twitter for sentiment analysis towards AstraZeneca/Oxford, Pfizer/BioNTech and Moderna COVID-19 vaccines,” Postgraduate Medical Journal, vol. 98, no. 1161, pp. 544–550, 2022. [Google Scholar]
6. D. Berkovic, I. Ackerman, A. M. Briggs and D. Ayton, “Tweets by people with arthritis during the COVID-19 pandemic: Content and sentiment analysis,” Journal of Medical Internet Research, vol. 22, no. 12,pp. e24550, 2020. [Google Scholar] [PubMed]
7. H. Yin, X. Song, S. Yang and J. Li, “Sentiment analysis and topic modeling for COVID-19 vaccine discussions,” World Wide Web-Internet and Web Information Systems, vol. 25, no. 3, pp. 1067–1083, 2022. [Google Scholar]
8. M. Aljabri, S. M. B. Chrouf, N. A. Alzahrani, L. Alghamdi, R. Alfehaid et al., “Sentiment analysis of Arabic tweets regarding distance learning in Saudi Arabia during the COVID-19 pandemic,” Sensors, vol. 21, no. 16, pp. 5431, 2021. [Google Scholar] [PubMed]
9. M. Turkyilmazoglu, “Explicit formulae for the peak time of an epidemic from the SIR model,” Physica D: Nonlinear Phenomena, vol. 422, pp. 132902, 2021. [Google Scholar] [PubMed]
10. O. Slobodin, I. Plochotnikov, I. C. Cohen, A. Elyashar, O. Cohen et al., “Global and local trends affecting the experience of US and UK healthcare professionals during COVID-19: Twitter text analysis,” International Journal of Environmental Research and Public Health, vol. 19, no. 11, pp. 6895, 2022. [Google Scholar] [PubMed]
11. H. Kaur, S. U. Ahsaan, B. Alankar and V. Chang, “A proposed sentiment analysis deep learning algorithm for analyzing COVID-19 tweets,” Information Systems Frontiers, vol. 23, no. 6, pp. 1417–1429, 2021. [Google Scholar] [PubMed]
12. N. A. Alkhaldi, Y. Asiri, A. M. Mashraqi, H. T. Halawani, S. Abdel-Khalek et al., “Leveraging tweets for artificial intelligence driven sentiment analysis on the covid-19 pandemic,” Healthcare, vol. 10, no. 5, pp. 910, 2022. [Google Scholar] [PubMed]
13. T. Pano and R. Kashef, “A complete VADER-based sentiment analysis of bitcoin (BTC) tweets during the era of COVID-19,” Big Data and Cognitive Computing, vol. 4, no. 4, pp. 33, 2020. [Google Scholar]
14. G. Chandrasekaran and J. Hemanth, “Deep learning and TextBlob based sentiment analysis for coronavirus (COVID-19) using twitter data,” International Journal on Artificial Intelligence Tools, vol. 31, no. 1, pp. 2250011, 2022. [Google Scholar]
15. F. Rustam, M. Khalid, W. Aslam, V. Rupapara, A. Mehmood et al., “A performance comparison of supervised machine learning models for Covid-19 tweets sentiment analysis,” PLoS One, vol. 16, no. 2, pp. e0245909, 2021. [Google Scholar] [PubMed]
16. F. M. J. M. Shamrat, S. Chakraborty, M. M. Imran, J. N. Muna, M. M. Billah et al., “Sentiment analysis on twitter tweets about COVID-19 vaccines using NLP and supervised KNN classification algorithm,” Indonesian Journal of Electrical Engineering and Computer Science, vol. 23, no. 1, pp. 463–470, 2021. [Google Scholar]
17. J. Cabezas, D. Moctezuma, A. F. Isabel and I. Martín de Diego, “Detecting emotional evolution on twitter during the covid-19 pandemic using text analysis,” International Journal of Environmental Research and Public Health, vol. 18, no. 13, pp. 6981, 2021. [Google Scholar] [PubMed]
18. A. Fesseha, S. Xiong, E. D. Emiru, M. Diallo and A. Dahou, “Text classification based on convolutional neural networks and word embedding for low-resource languages: Tigrinya,” Information-an International Interdisciplinary Journal, vol. 12, no. 2, pp. 52, 2021. [Google Scholar]
19. H. Gul, N. Javaid, I. Ullah, A. M. Qamar, M. K. Afzal et al., “Detection of non-technical losses using SOSTLink and bidirectional gated recurrent unit to secure smart meters,” Applied Sciences, vol. 10, no. 9, pp. 3151, 2020. [Google Scholar]
20. A. B. S. Yıldız, N. Pholdee, S. Bureerat, A. R. Yıldız and S. M. Sait, “Sine-cosine optimization algorithm for the conceptual design of automobile components,” Materials Testing, vol. 62, no. 7, pp. 744–748, 2020. [Google Scholar]
21. S. Mirjalili, “SCA: A sine cosine algorithm for solving optimization problems,” Knowledge-Based Systems, vol. 96, no. 63, pp. 120–133, 2016. [Google Scholar]
22. N. Yeasmin, N. I. Mahbub, M. K. Baowaly, B. C. Singh, Z. Alom et al., “Analysis and prediction of user sentiment on covid-19 pandemic using tweets,” Big Data and Cognitive Computing, vol. 6, no. 2, pp. 65, 2022. [Google Scholar]
Cite This Article
 Copyright © 2023 The Author(s). Published by Tech Science Press.
This work is licensed under a Creative Commons Attribution 4.0 International License , which permits unrestricted use, distribution, and reproduction in any medium, provided the original work is properly cited.
 Downloads
 Citation Tools