
 Submit a Paper
 Propose a Special lssue
 Open Access
ARTICLE

Hybrid Metaheuristics with Deep Learning Enabled Automated Deception Detection and Classification of Facial Expressions
Department of Computer Sciences, College of Computer Engineering and Sciences, Prince Sattam bin Abdulaziz University, Al Kharj, Saudi Arabia
* Corresponding Author: Haya Alaskar. Email:
Computers, Materials & Continua 2023, 75(3), 5433-5449. https://doi.org/10.32604/cmc.2023.035266
Received 14 August 2022; Accepted 08 February 2023; Issue published 29 April 2023
 View Full Text
 Download PDF
Abstract
Automatic deception recognition has received considerable attention from the machine learning community due to recent research on its vast application to social media, interviews, law enforcement, and the military. Video analysis-based techniques for automated deception detection have received increasing interest. This study develops a new self-adaptive population-based firefly algorithm with a deep learning-enabled automated deception detection (SAPFF-DLADD) model for analyzing facial cues. Initially, the input video is separated into a set of video frames. Then, the SAPFF-DLADD model applies the MobileNet-based feature extractor to produce a useful set of features. The long short-term memory (LSTM) model is exploited for deception detection and classification. In the final stage, the SAPFF technique is applied to optimally alter the hyperparameter values of the LSTM model, showing the novelty of the work. The experimental validation of the SAPFF-DLADD model is tested using the Miami University Deception Detection Database (MU3D), a database comprised of two classes, namely, truth and deception. An extensive comparative analysis reported a better performance of the SAPFF-DLADD model compared to recent approaches, with a higher accuracy of 99%.Keywords
The detection of human emotions has piqued researchers’ interest for generations. However, how well humans or machines ultimately perform in detecting deceptive speech is still an ongoing issue for criminal investigations. Generally, deception is integrated into day-to-day interactions, yet it is challenging for untrained people and trained professionals to detect deception accurately without using intrusive measures. Facial expressions, one of the main channels for understanding and interpreting emotions in social interactions, have been studied extensively in recent decades. Deception is sharing or conveying facts, ideas, or concepts transformed for advancement and personal gain. The process might range from fabricating information in a minor disagreement to manipulating the masses [1]. It is very complex to determine whether a statement is deceptive or genuine; therefore, it is important to utilize a deception detection technique to validate critical data. For this reason, many deception detection techniques and systems have been introduced [2].
Facial expressions help to reveal emotions that sometimes words do not sufficiently convey. From this principle, deception recognition based on facial expressions is derived [3]. It is easier to identify actions and emotions such as anger, laughter, and sadness, yet slight modifications can go completely unobserved by the inexperienced eye. Macro-expressions associated with fear, anger, sadness, happiness, and so on are apparent and understandable. They last between 0.5 and 5 s. Micro-expressions display a concealed emotion, occur unconsciously [4] and last less than 0.5 s. Anxiety, amusement, embarrassment, shame, relief, guilt, and pleasure are micro-expressions. While it is easy to categorize macro-expressions since they last longer and occur more frequently, micro-expressions go unobserved by the inexperienced eye for the opposite reasons [5]. Micro-expressions are portrayed by somebody trying to deceive someone else or hide any particular emotion.
A critical aspect of suitably conducting a lie-detection study is the public availability of a satisfactory dataset. This open innovation is one key component of accelerating the present study, as opposed to closed innovation, which relies on a private or closed dataset [6,7]. Despite existing progress, obtaining training and assessment material for lie recognition is a challenge, especially concerning the verification of ground truth to ascertain whether an individual is lying or not [8]. A major problem emerges since the ground truth collection knowledge is not beneficial when the scenario is simulated naively (for example, it is not satisfactory to train an individual to tell a lie merely) [9,10].
In [11], the authors presented a deep learning (DL) technique dependent upon an attentional convolutional network capable of concentrating on essential parts of faces and attaining improvement compared to preceding methods on several datasets, including FER-2013, CK+, FERG, and JAFFE. It also utilizes a visualization approach to recognize significant facial regions and identify emotions according to the classifier output. Li et al. [12] introduced a facial expression dataset, the Realistic Affective Face Database (RAF-DB), which comprises approximately 30,000 facial images with varied illumination and unconstrained poses from thousands of people of varied races and ages. An expectation-maximization system designed to evaluate the dependability of emotion labels revealed that real-time faces frequently express compound or mixed emotions. To address the detection of multiple modal expressions, a deep locality-preserving convolutional neural network (DLP-CNN) technique was presented to enhance the discrimination of in-depth features by maintaining the locality of the classes while maximizing interclass scatter.
Xie et al. [13] presented a new technique called deep comprehensive multiple patches aggregation CNN to resolve the facial expression recognition (FER) issue. The suggested technique is a deep-based architecture that mainly comprises 2 fields of CNN. One field extracts local features from the image patch, whereas another extract holistic features from the complete expressional image. Wang et al. [14] developed a facial expression detection methodology based on the CNN method. To simulate a hierarchic mechanism, an activation function is essential in the CNN method since the nonlinear capability of the activation function helps to design reliable AI. Among the activation functions, the rectified linear unit (ReLU) is a better technique; however, it needs improvement. Tsai et al. [15] developed a FER approach which involves a face detection technique that integrates the Haar-like feature approach with the self-quotient image (SQI) filter. Consequently, the FERS approach demonstrates the best detection rate since the face detection technique more precisely discovers the face region of the image.
Though several FER models are available in the literature, there is still required to improve the detection rate. Since manual and trial-and-error hyperparameter tuning is a tedious process, metaheuristic algorithms can be employed. Therefore, this study develops a new self-adaptive population-based firefly algorithm with a deep learning-enabled automated deception detection (SAPFF-DLADD) model for analyzing facial cues. The SAPFF-DLADD model examines facial cues to identify which are associated with truth or deception. Initially, the input video is separated into a set of video frames. Then, the SAPFF-DLADD model applies a MobileNet-based feature extractor to produce a useful set of features. SAPFF with a long short-term memory (LSTM) model is exploited for deception detection and classification. The experimental validation of the SAPFF-DLADD model is tested using the MU3D, a database comprising two classes, namely, truth and deception.
2 The Proposed SAPFF-DLADD Model
This study established a new SAPFF-DLADD approach to identify deception from facial cues. The input video is separated into a set of video frames at the primary level. Then, the SAPFF-DLADD model applies a MobileNet-based feature extractor to produce a useful set of features. For deception detection and classification, the LSTM model is exploited. In the final stage, the SAPFF technique is applied to alter the LSTM model’s hyperparameter values optimally.
In this study, the SAPFF-DLADD model applies a MobileNet-based feature extractor to produce useful features. The MobileNet method is a network model that uses depthwise separable convolution as its elementary component [16], consisting of depthwise and pointwise convolutions. Dense-MobileNet models consider the depthwise convolution and the point convolution layer as two individual convolution layers. Viz., the input feature map of every depthwise convolutional layer in the dense block is the superposition of the output feature map in the preceding convolutional layer. To tune the hyperparameters for the MobileNet approach, root means square propagation (RMSProp) optimization is utilized. RMSprop is an adaptive learning system that drives to increase the AdaGrad rate by taking the exponential moving average as opposed to AdaGrad’s cumulative sum of squared gradients.
where
2.2 Deception Classification Using the LSTM Model
LSTM is utilized for deception detection and classification. The LSTM model is an alternative form of the recurrent neural network (RNN) model. LSTMs substitute the hidden state computation with distinct gate functions [17]. This technique allows the LSTM network to capture the long-term series dependency in the temporal dataset. The operation of the LSTM mechanism is demonstrated in Fig. 1. In contrast to traditional RNNs, the LSTM network presents a novel flow, the cell state
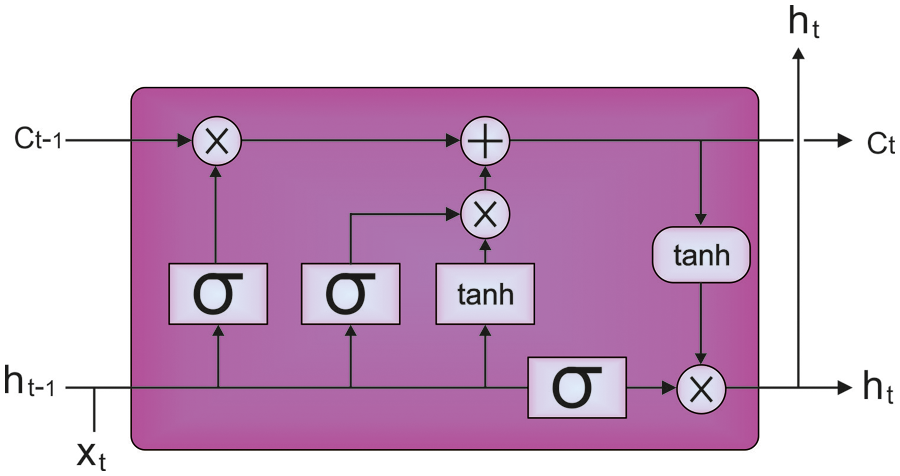
Figure 1: Structure of an LSTM
From these expressions, the variables
In these equations,
2.3 Hyperparameter Tuning Using the SAPFF-DLADD Model
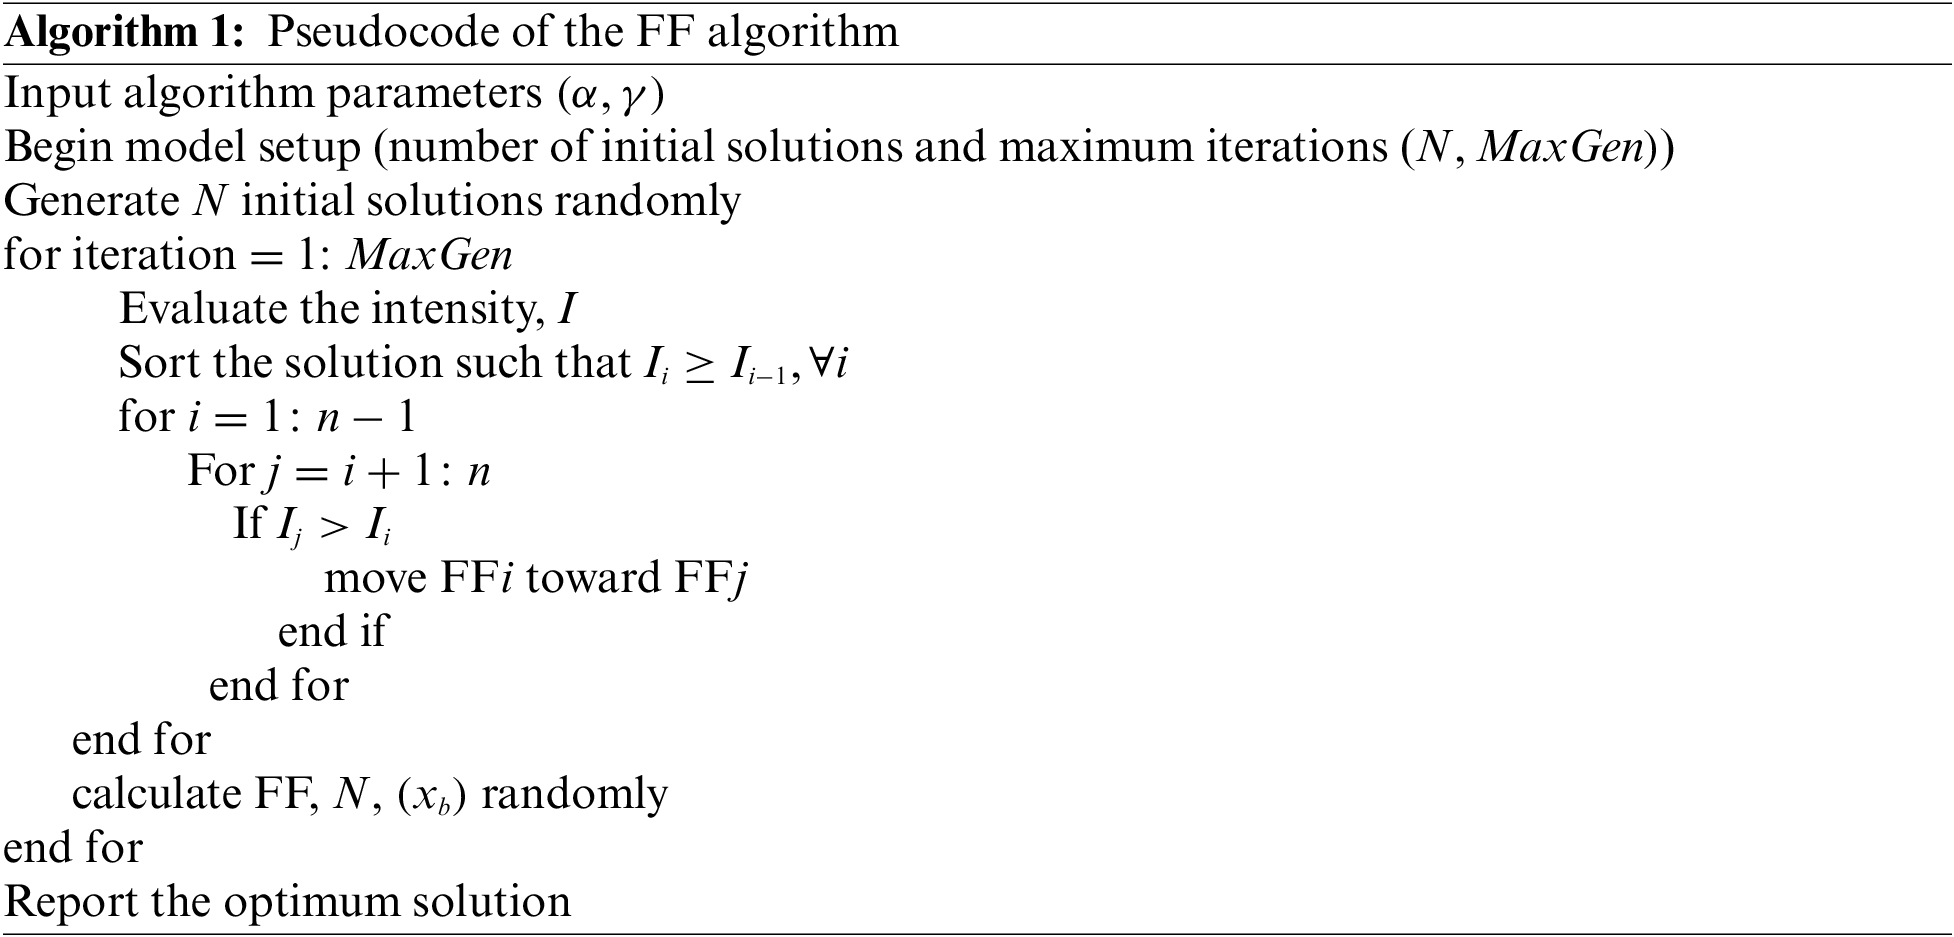
In the final stage, the SAPFF technique is applied to alter the LSTM model’s hyperparameter values optimally. The FF approach is a metaheuristic algorithm that optimizes using nature-inspired techniques based on the social (flashing) behaviours of lightning bugs, or fireflies, in the tropical temperature region. Insects, fish, and birds can exhibit swarming behaviour [18]. In particular, the FF approach has a collection of features in common with other approaches, but the FF concept is easier to understand and implement. According to a recent study, the approach is very efficient, and it outperforms distinct conventional methodologies, such as genetic algorithms (GA), to solve different optimization issues. The key advantage is that it mainly employs random real numbers and depends on global transmission among the swarming particles (fireflies). As a result, it seems very effective in multiobjective optimizations such as WS composition planning generation. Fig . 2 illustrated the flowchart of the FF algorithm.
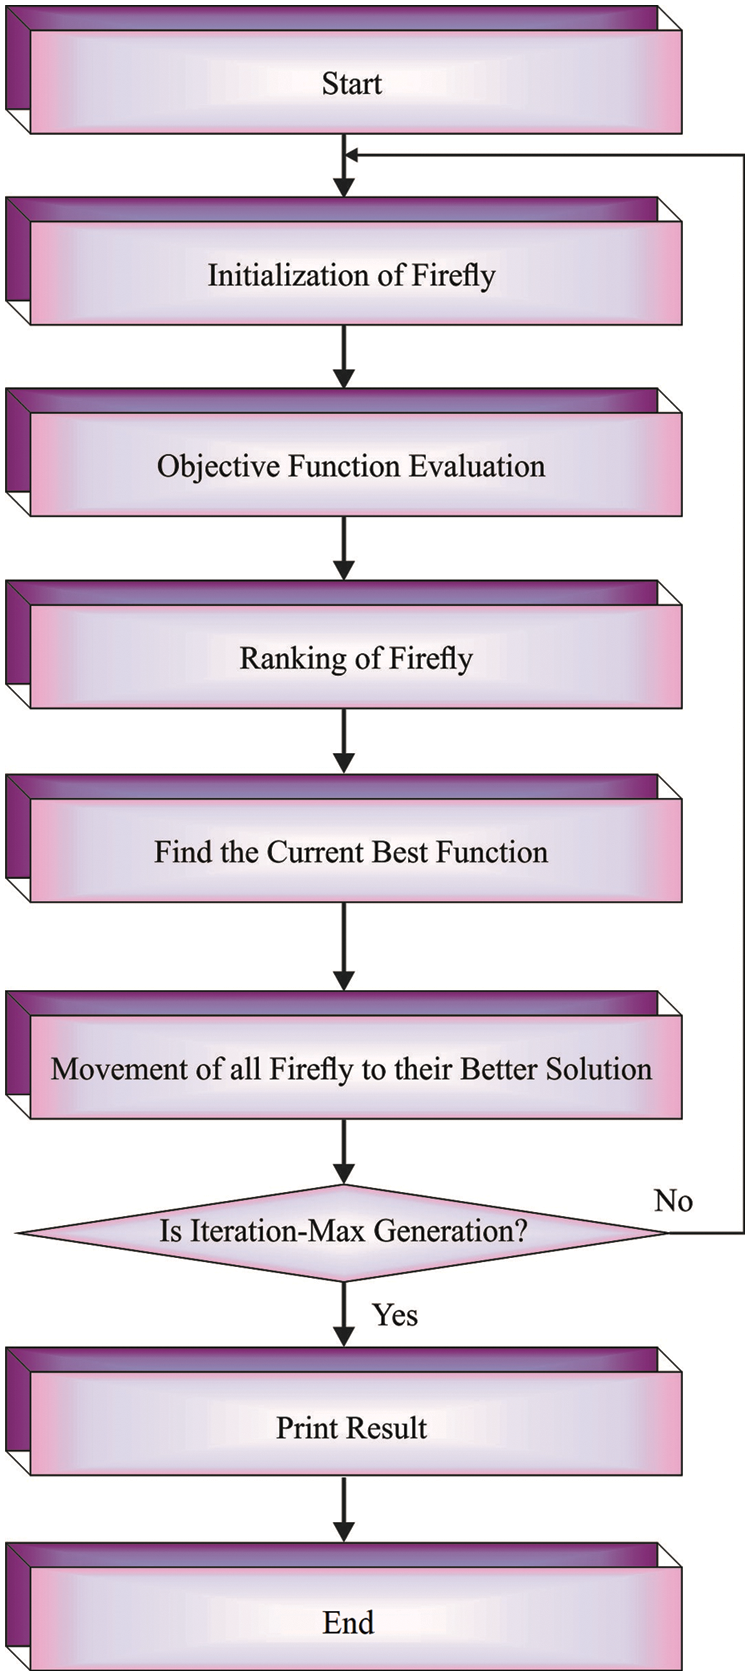
Figure 2: Flowchart of the FF algorithm
The FF method comprises 3 guidelines based on idealized flashing features of real fireflies. (1) Each firefly’s light intensity or brightness is related to the objective function of a presented challenge. (2) Each firefly is unisex; therefore, the attraction is only based on brightness. (3) The attraction to each firefly corresponds to its brightness, and the brightness decreases with increasing distance from other fireflies since air absorbs light. It moves randomly if there is no brighter firefly compared to a certain firefly.
Furthermore, the brightness decreases with distance due to the inverse square law, as shown below.
Once the light intensity reduction from traversing a medium with light absorption coefficient
The generalized reduction function for any constant
An arbitrarily produced feasible potential solution is assigned a brightness based on efficacy in the FF technique. This brightness is used to compute the brightness of each firefly, i.e., each firefly’s brightness is directly proportional to the brightness of the solution at that position. Once the brightness or intensity of the solution is assigned, each firefly follows a firefly with optimum brightness. A firefly’s brightness serves as the neighbourhood’s local subjective search parameter. Thus, for 2 fireflies,
In Eq. (13),
The location of each firefly is updated by iteration until one of the ending criteria is satisfied. The ending criteria are meeting the maximum iteration count, reaching a tolerance in the best value once it is predictable or obtaining no improvement in successive iterations. To improve the performance of the FF algorithm, the SAPFF is derived. Like other metaheuristic optimized techniques, the FF model is a population-based technique, and its optimization procedure begins with creating the primary population. Thus, it requires a control parameter for determining the population sizes. However, selecting the size of the population is a complex and challenging task. The self-adaptive population method alters the size of the populations from all the iterations. Since this important feature modifies the population size automatically from all the iterations, the user is not required to determine it. In the initial approach, the primary population size is determined by:
where
where
The SAPFF system resolves a fitness function for accomplishing maximal classifier performances. Here, the minimized classifier error rate is assumed to be the fitness function provided in Eq. (17).
The experimental validation of the SAPFF-DLADD model is tested using the MU3D [19], a database that comprises data samples of two classes. Table 1 shows a detailed description of the dataset.
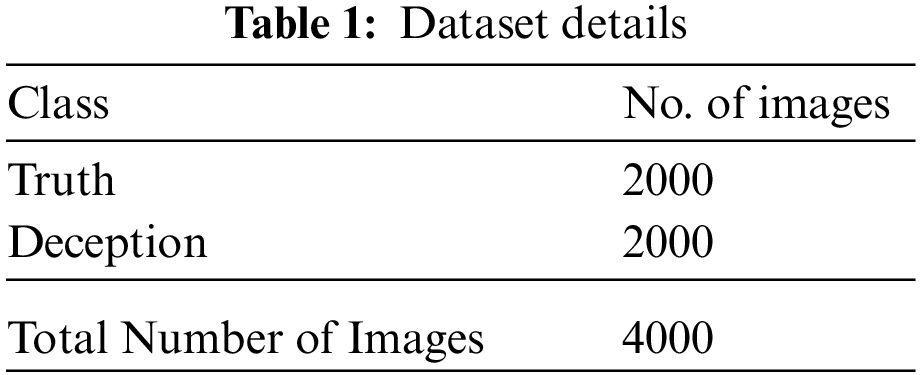
Fig. 3 depicts the confusion matrices formed by the SAPFF-DLADD model, with 90% of the data as training (TR) and 10% as testing (TS) data. With the 90% TR data, the SAPFF-DLADD model recognized 1737 samples in the truth class and 1755 in the deception class. Likewise, with the 10% TS data, the SAPFF-DLADD approach recognized 193 samples in the truth class and 199 in the deception class.
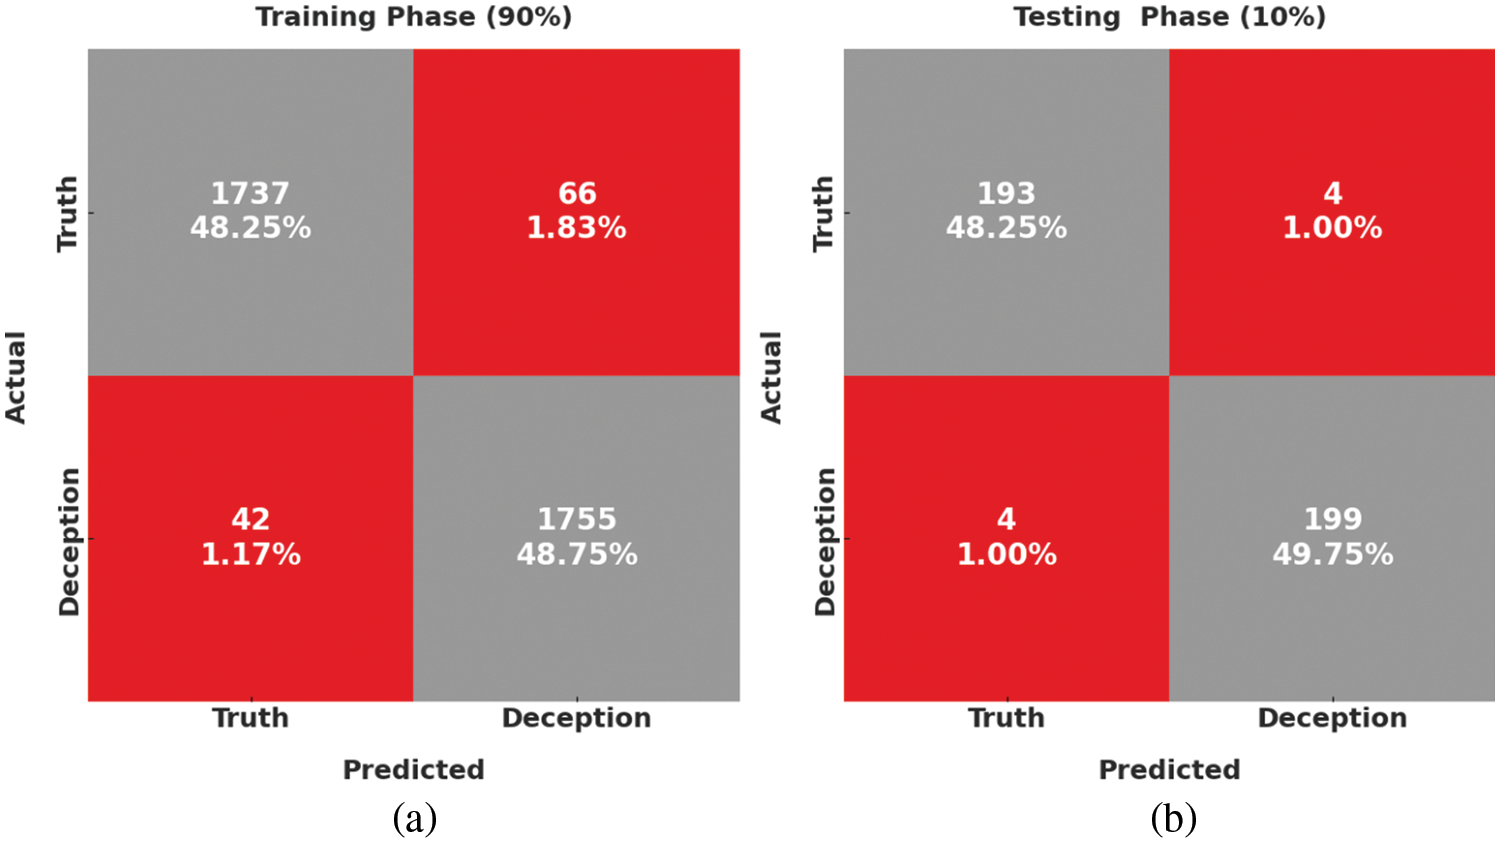
Figure 3: Confusion matrices of the SAPFF-DLADD approach: (a) 90% training data and (b) 10% test data
Table 2 and Fig. 4 report the comparative classifier results of the SAPFF-DLADD model on the 90% training TR data and 10% TS data. The results indicate that the SAPFF-DLADD model reached enhanced results in both cases. For instance, with the 90% TR data, the SAPFF-DLADD model attained an average
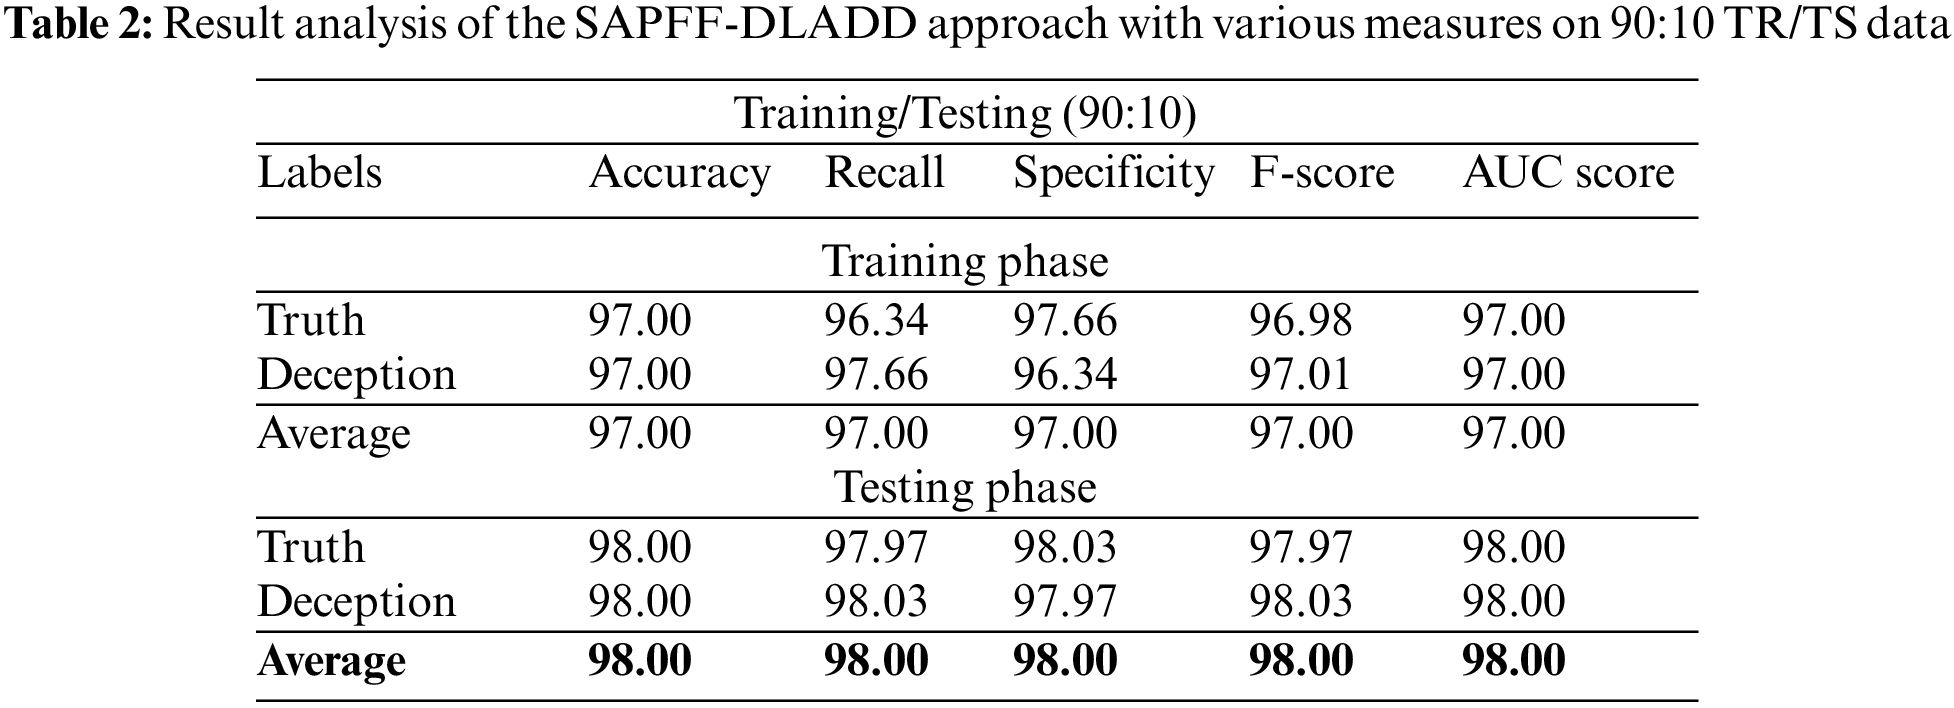
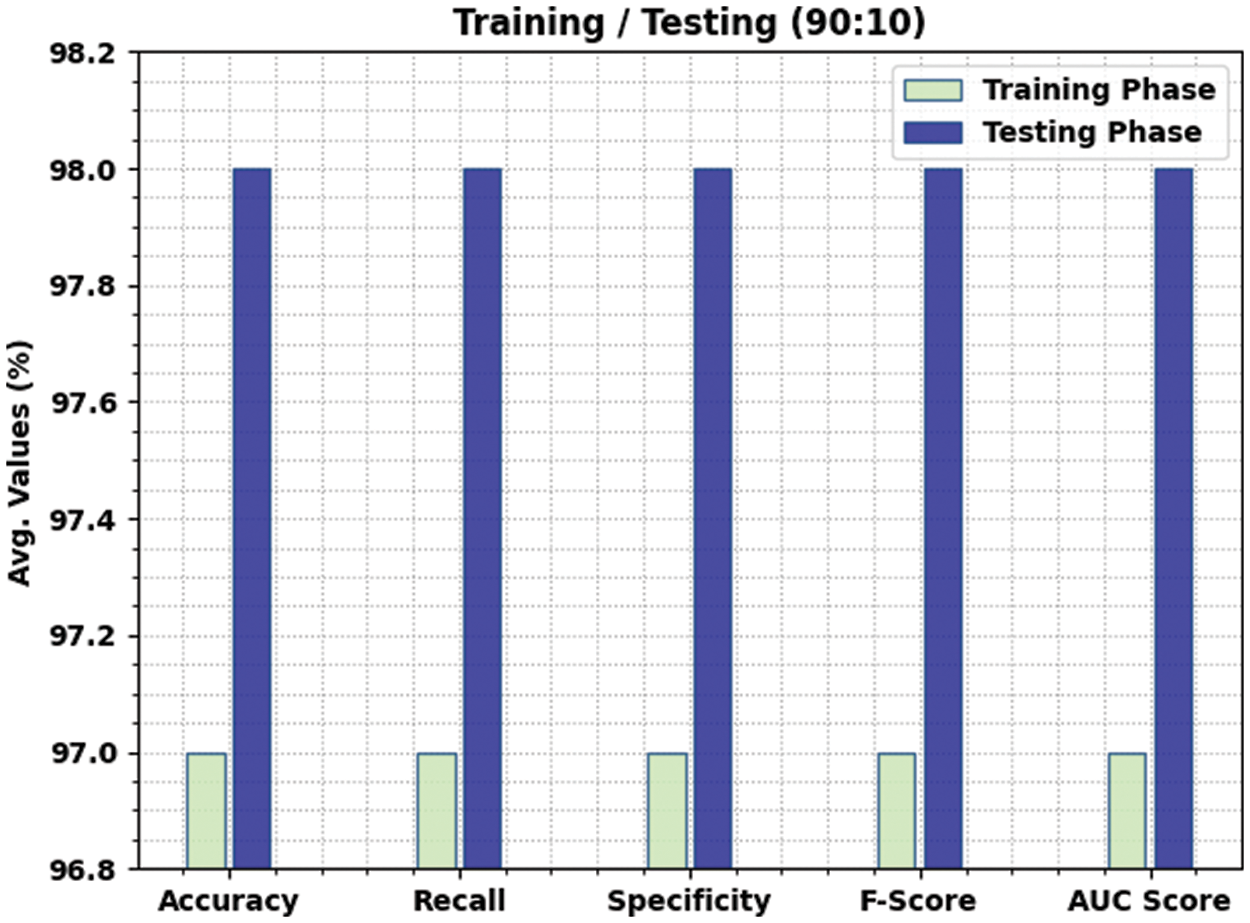
Figure 4: Result analysis of the SAPFF-DLADD approach for 90:10 TR/TS data
Fig. 5 illustrates the confusion matrices formed by the SAPFF-DLADD approach, with 80% of the data as TR data and 20% as TS data. With the 80% TR data, the SAPFF-DLADD system recognized 1583 samples in the truth class and 1597 samples in the deception class. Similarly, with the 20% TS data, the SAPFF-DLADD algorithm recognized 396 samples in the truth class and 396 samples in the deception class.

Figure 5: Confusion matrices of the SAPFF-DLADD approach: (a) 80% TR data and (b) 20% TS data
Table 3 and Fig. 6 report the comparative classifier outcome of the SAPFF-DLADD approach on the 90% TR data and 10% TS data. The outcome indicates that the SAPFF-DLADD technique achieved better results in both respects. For example, with the 80% TR data, the SAPFF-DLADD system attained an average
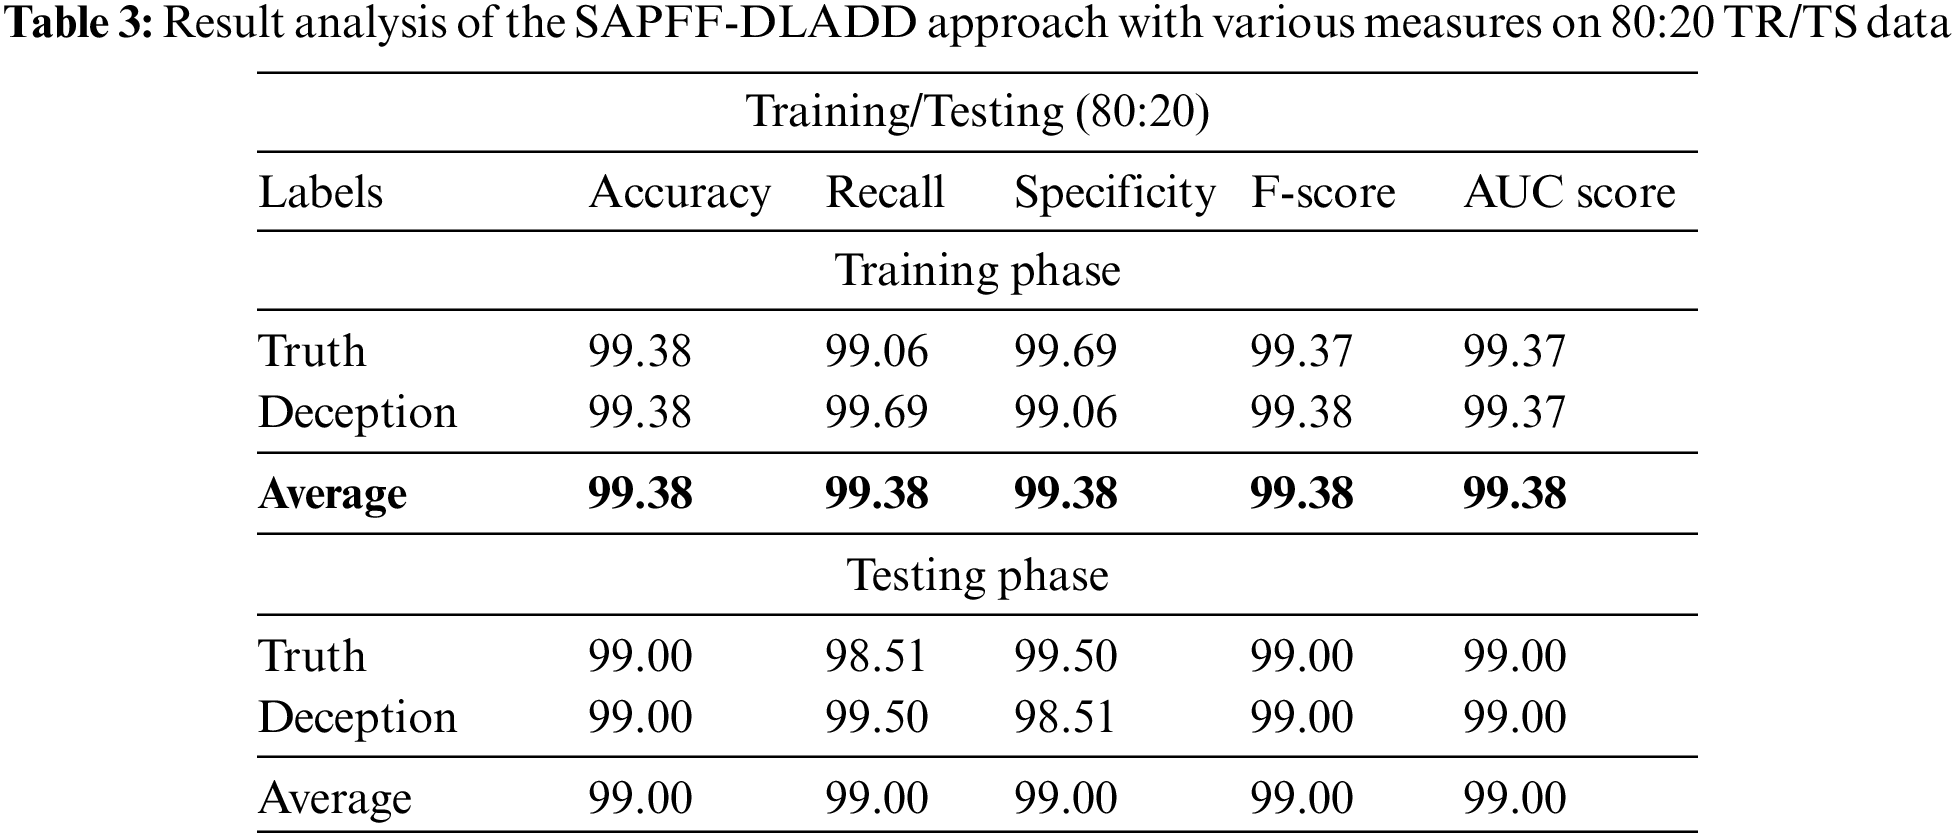
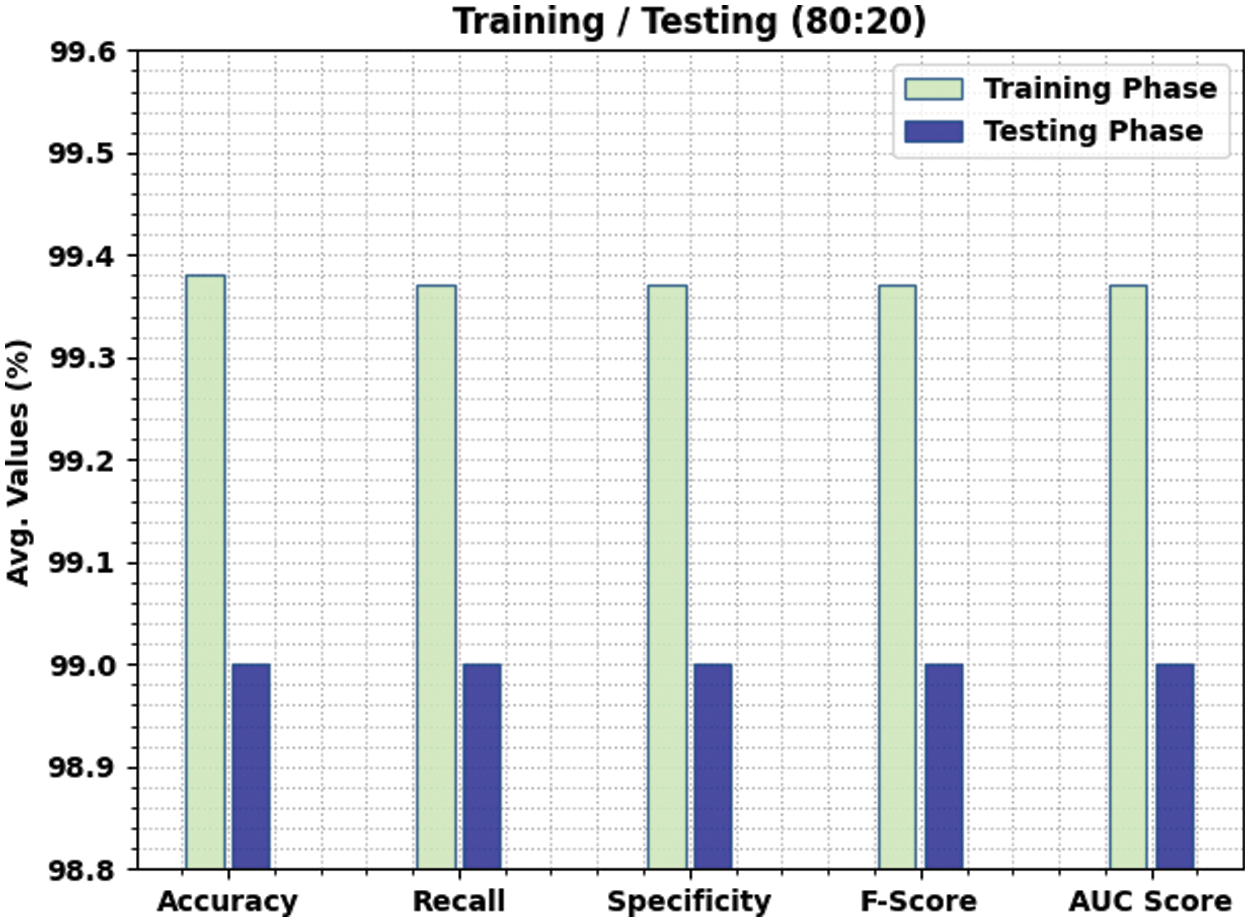
Figure 6: Result analysis of the SAPFF-DLADD approach for 80:20 TR/TS data
Fig. 7 illustrates the confusion matrices formed by the SAPFF-DLADD technique using 70% of the data as TR data and 30% of the data as TS data. With the 70% TR data, the SAPFF-DLADD approach recognized 1387 samples in the truth class and 1382 in the deception class. At the same time, with the 30% TS data, the SAPFF-DLADD system recognized 595 samples in the truth class and 584 samples in the deception class.

Figure 7: Confusion matrices of the SAPFF-DLADD approach: (a) 70% TR data and (b) 30% TS data
Table 4 and Fig. 8 depict the comparative classifier outcome of the SAPFF-DLADD algorithm on the 70% TR data and 30% TS data. The outcomes of this SAPFF-DLADD system attained superior outcomes in both sets. With the 70% TR data, the SAPFF-DLADD algorithm attained an average
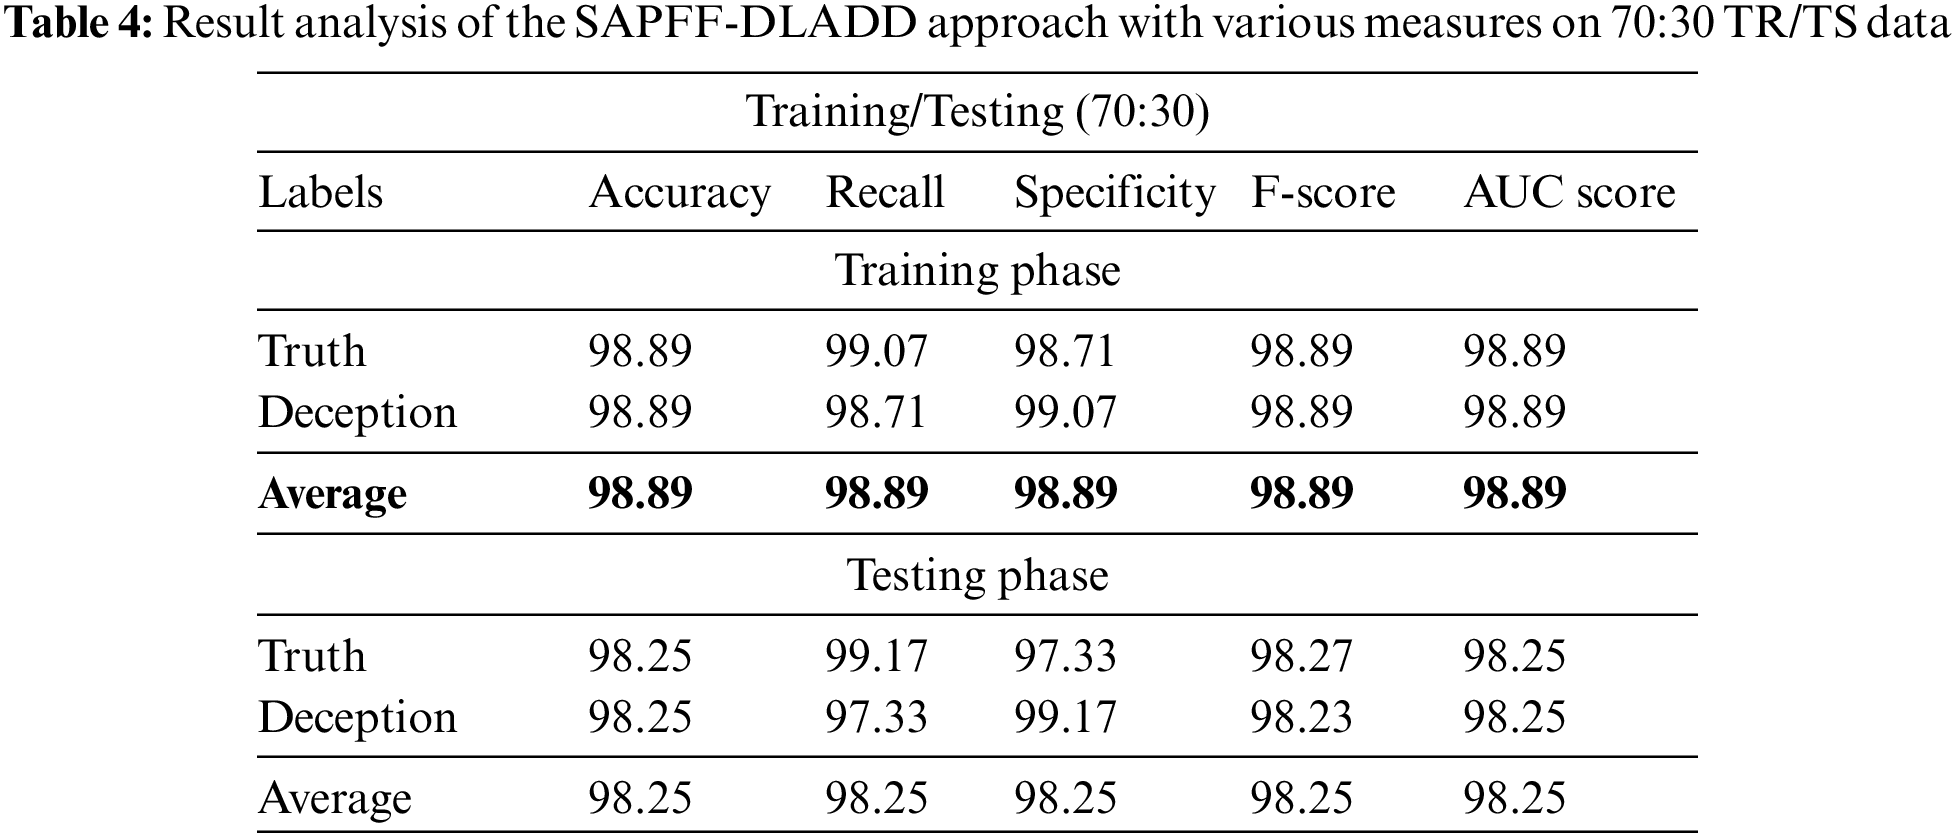
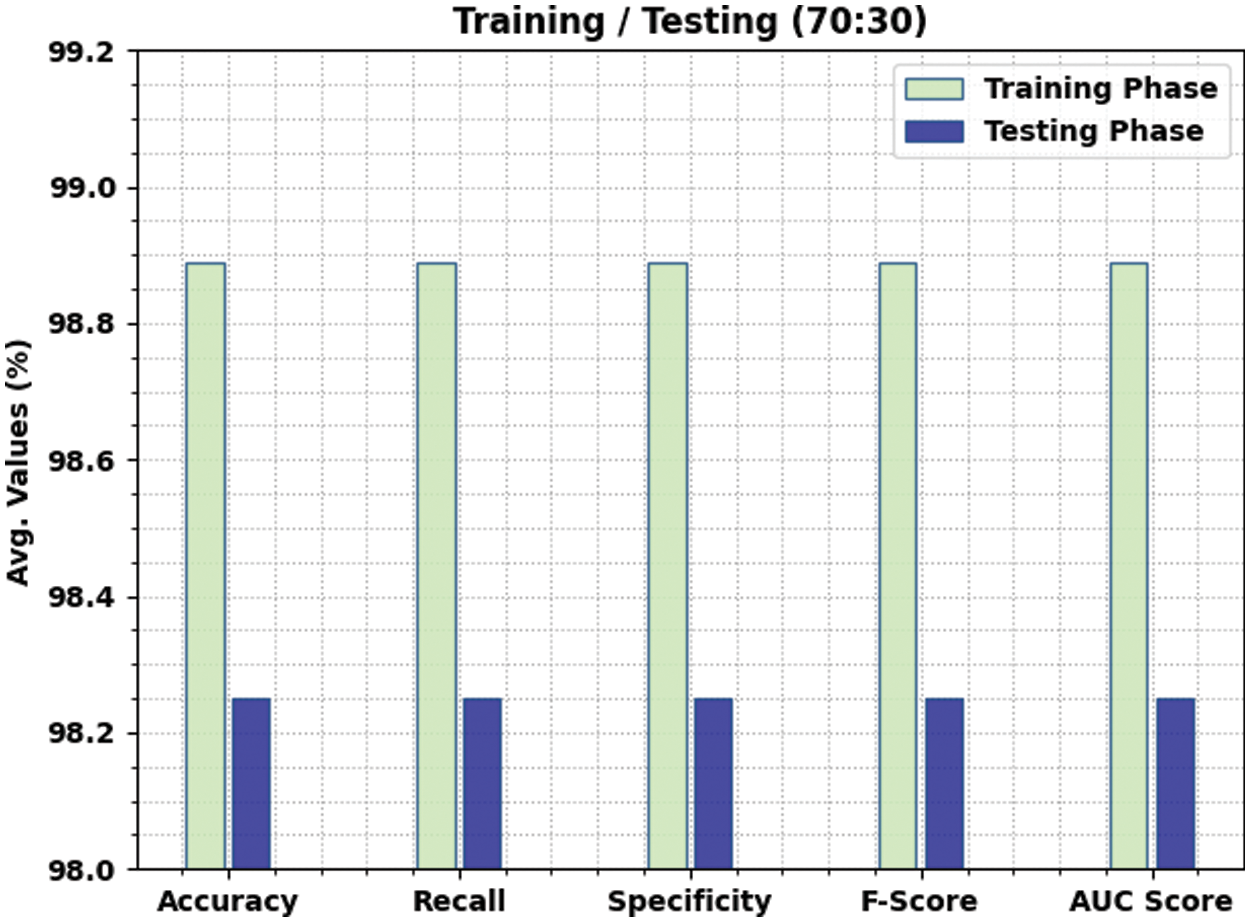
Figure 8: Result analysis of the SAPFF-DLADD approach for 70:30 TR/TS data
Fig. 9 shows the confusion matrices formed by the SAPFF-DLADD algorithm using 60% of the data as TR and 40% as TS data. With the 60% TR data, the SAPFF-DLADD technique recognized 1197 samples in the truth class and 1159 samples in the deception class. Moreover, with the 40% TS data, the SAPFF-DLADD methodology recognized 778 samples in the truth class and 798 samples in the deception class.

Figure 9: Confusion matrices of the SAPFF-DLADD approach: (a) 60% TR data and (b) 40% TS data
Table 5 and Fig. 10 report the comparative classifier outcome of the SAPFF-DLADD technique on the 60% TR data and 40% TS data. The results show that the SAPFF-DLADD approach gained maximal outcomes in both respects. With the 60% TR data, the SAPFF-DLADD system attained an average
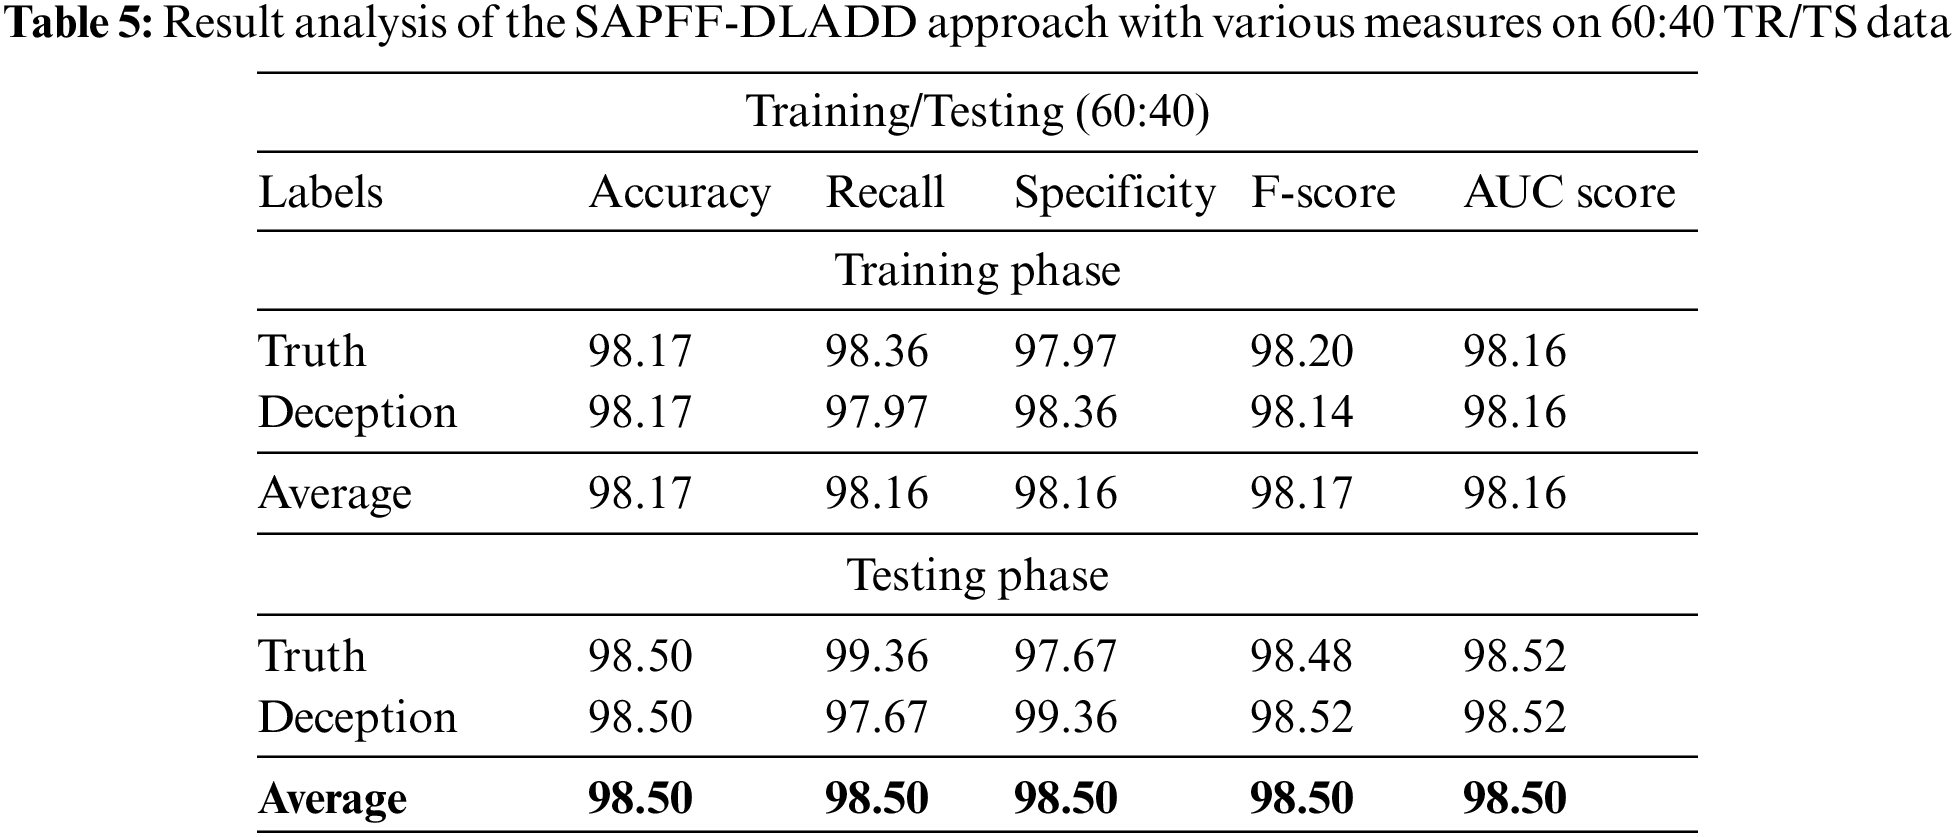
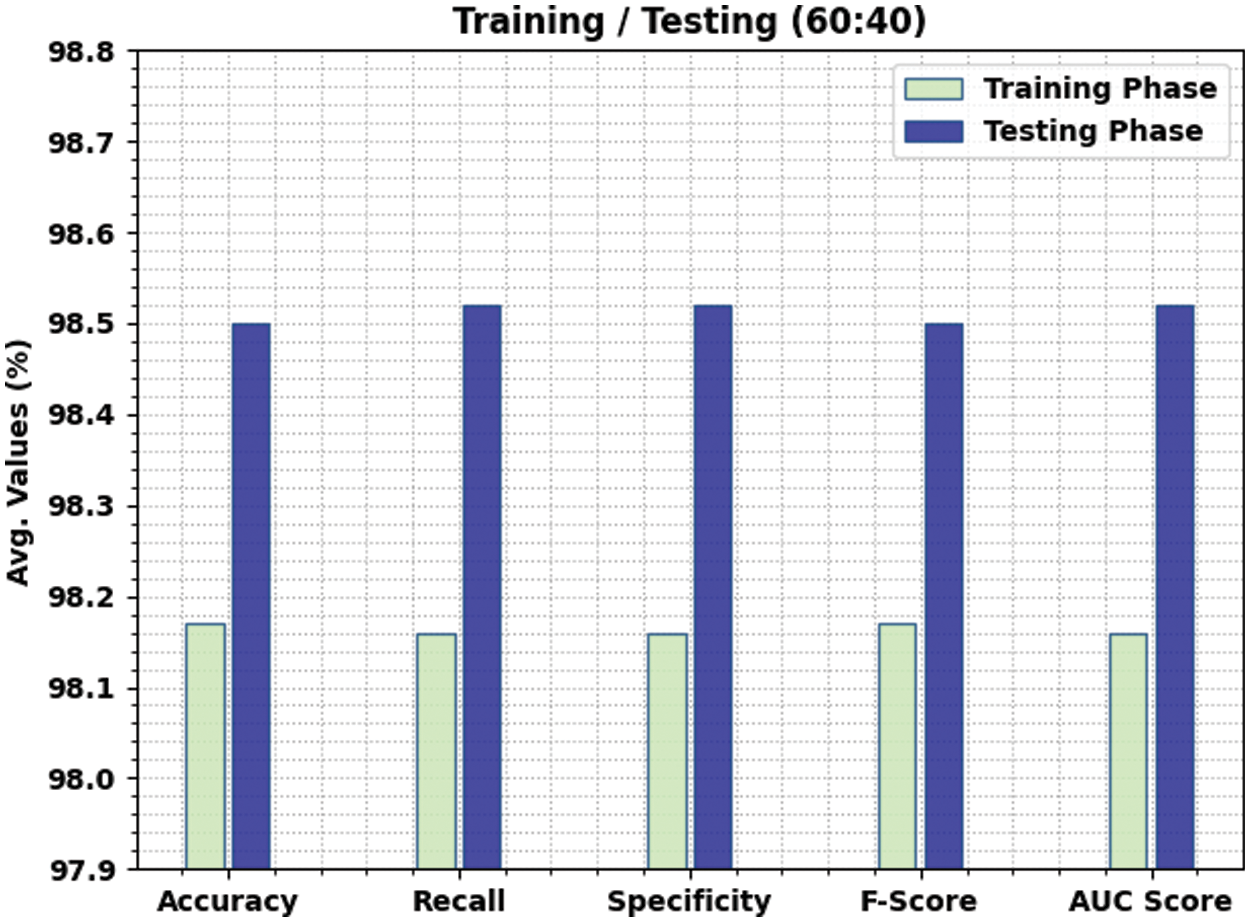
Figure 10: Result analysis of the SAPFF-DLADD approach for 60:40 TR/TS data
The training accuracy (TA) and validation accuracy (VA) achieved by the SAPFF-DLADD methodology on the test dataset is illustrated in Fig. 11. The experimental outcome reveals that the SAPFF-DLADD technique attained higher values of TA and VA. In particular, VA outperformed TA.
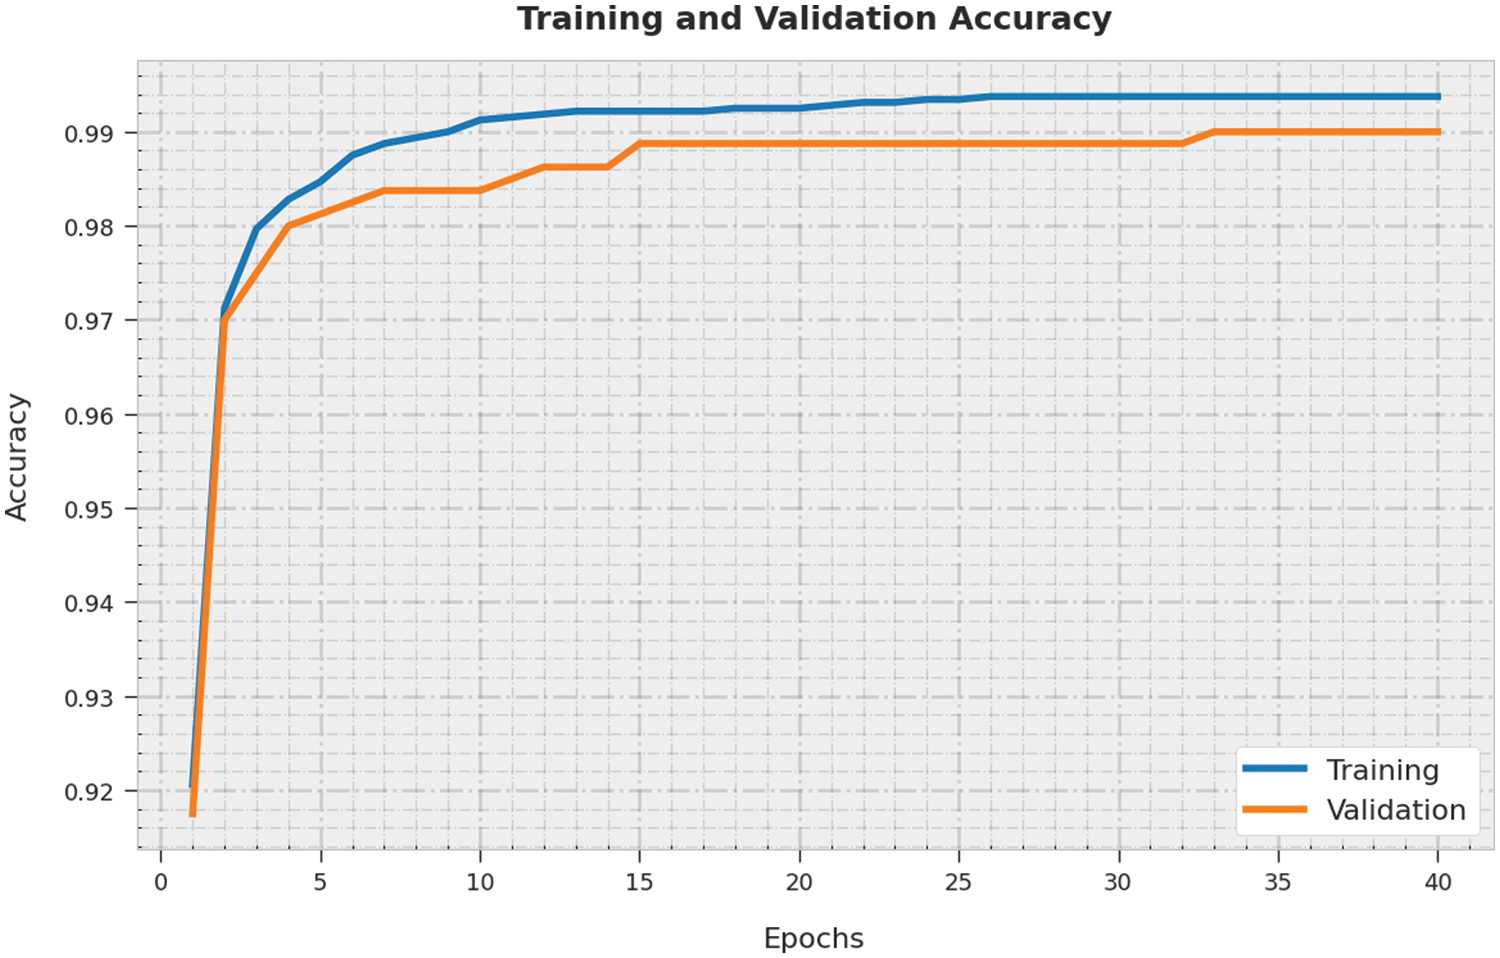
Figure 11: TA and VA analysis of the SAPFF-DLADD algorithm
The training loss (TL) and validation loss (VL) gained by the SAPFF-DLADD system on the test dataset are depicted in Fig. 12. The experimental outcome reveals the TL and VL values for the SAPFF-DLADD algorithm decreased. Specifically, VL is less than TL.
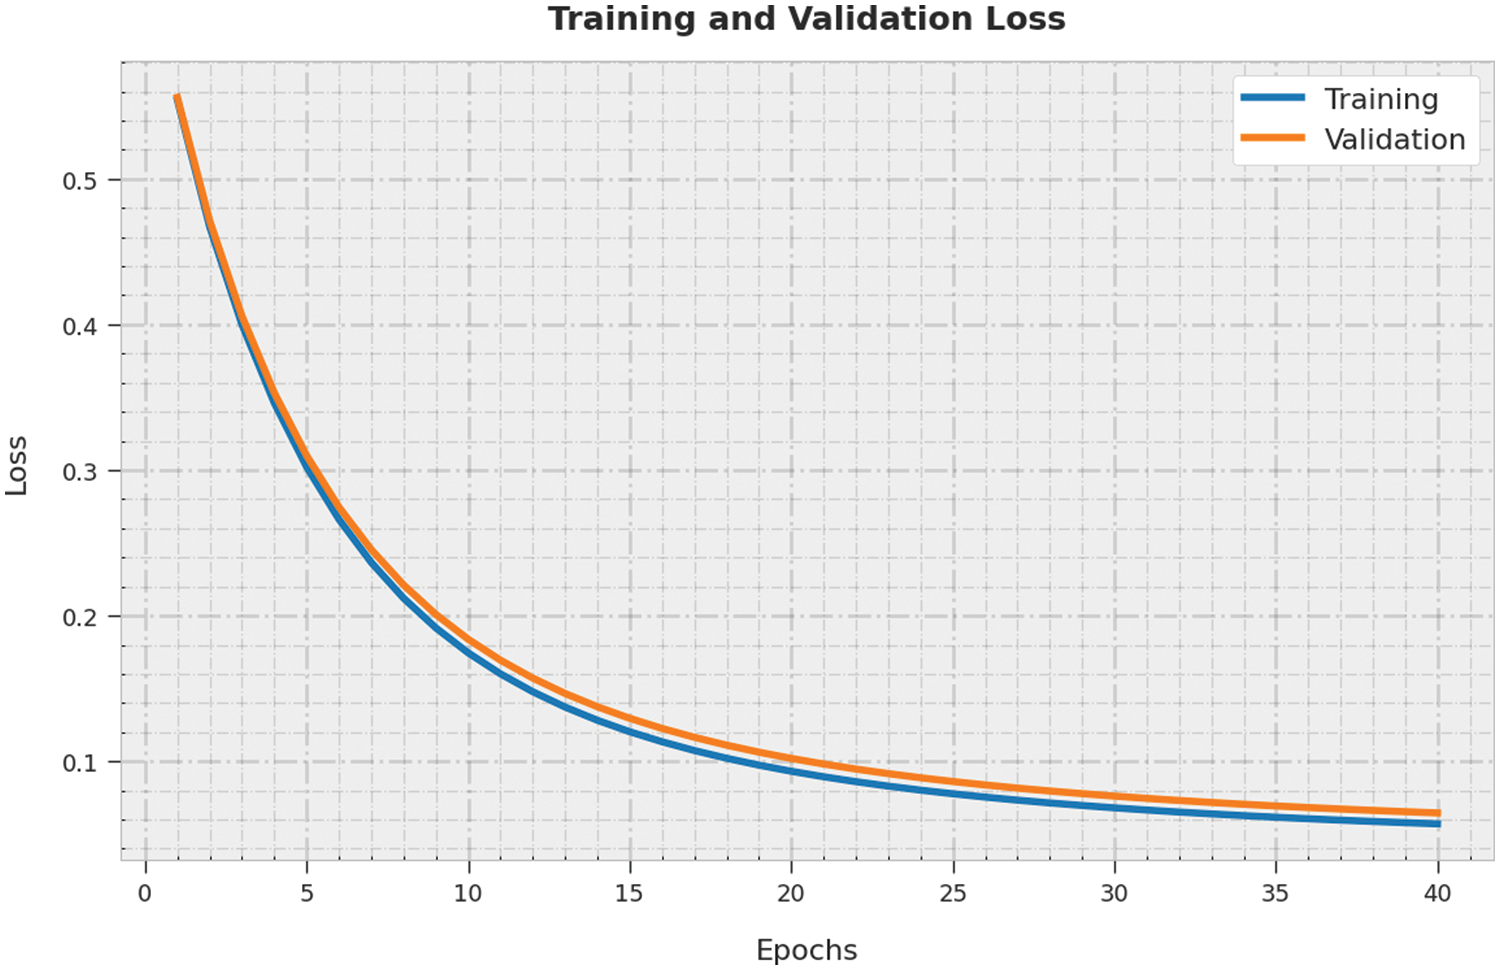
Figure 12: TL and VL analysis of the SAPFF-DLADD algorithm
To demonstrate the accuracy of the SAPFF-DLADD model, a brief comparative
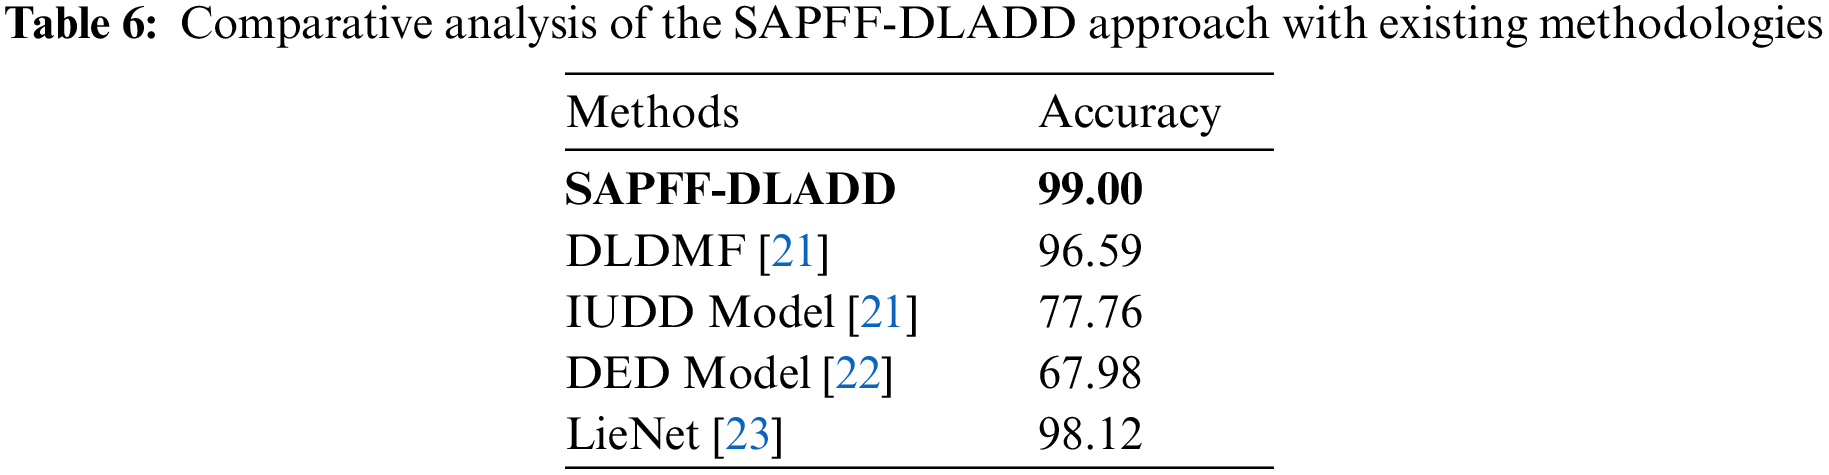
However, the SAPFF-DLADD model results in a higher
This study established a novel SAPFF-DLADD approach to identify deception from facial cues. First, the input video was separated into a set of video frames. Then, the SAPFF-DLADD model applied a MobileNet-based feature extractor to produce a useful set of features. For deception detection and classification, the LSTM model was exploited. In the final stage, the SAPFF technique was executed to alter the LSTM model’s hyperparameter values optimally. The experimental validation of the SAPFF-DLADD system was tested utilizing the MU3D, a database comprising two classes, namely, truth and deception. The extensive comparative analysis reported better performance of the SAPFF-DLADD model compared to recent approaches with a higher accuracy of 99%. In the future, an ensemble of DL-based fusion techniques will be designed to improve detection performance.
Acknowledgement: I would like to thank Prince Sattam Bin Abdulaziz University for supporting me during this research.
Funding Statement: The author received no specific funding for this study.
Conflicts of Interest: The author declares that they have no conflicts of interest to report regarding the present study.
References
1. K. Kottursamy, “A review on finding efficient approach to detect customer emotion analysis using deep learning analysis,” Journal of Trends in Computer Science and Smart Technology, vol. 3, no. 2, pp. 95–113, 2021. [Google Scholar]
2. W. B. Shahid, B. Aslam, H. Abbas, H. Afzal and S. B. Khalid, “A deep learning assisted personalized deception system for countering web application attacks,” Journal of Information Security and Applications, vol. 67, no. 1, pp. 103169, 2022. [Google Scholar]
3. F. Zhang, T. Meng, D. Xiang, F. Ma, X. Sun et al., “Adversarial deception against SAR target recognition network,” Journal of Selected Topics in Applied Earth Observations and Remote Sensing, vol. 15, pp. 4507–4520, 2022. [Google Scholar]
4. H. Bingol and B. Alatas, “Chaos enhanced intelligent optimization-based novel deception detection system,” Chaos, Solitons & Fractals, vol. 166, no. 8, pp. 112896, 2023. [Google Scholar]
5. Y. Huang, F. Chen, S. Lv and X. Wang, “Facial expression recognition: A survey,” Symmetry, vol. 11, no. 10, pp. 1189, 2019. [Google Scholar]
6. B. Sonawane and P. Sharma, “Review of automated emotion-based quantification of facial expression in Parkinson’s patients,” The Visual Computer, vol. 37, no. 5, pp. 1151–1167, 2021. [Google Scholar]
7. A. Kumar, A. Kaur and M. Kumar, “Face detection techniques: A review,” Artificial Intelligence Review, vol. 52, no. 2, pp. 927–948, 2018. [Google Scholar]
8. L. Leng, J. Zhang, G. Chen, M. K. Khan and K. Alghathbar, “Two-directional two-dimensional random projection and its variations for face and palmprint recognition,” in Int. Conf. on Computational Science and Its Applications, Berlin, Heidelberg, Springer, pp. 458–470, 2021. [Google Scholar]
9. L. Leng, J. Zhang, X. Jing, M. K. Khan and K. Alghathbar, “Dynamic weighted discrimination power analysis in DCT domain for face and palmprint recognition,” in 2010 Int. Conf. on Information and Communication Technology Convergence (ICTC), Jeju, pp. 467–471, 2010. [Google Scholar]
10. Y. S. Su, H. Y. Suen and K. E. Hung, “Predicting behavioral competencies automatically from facial expressions in real-time video-recorded interviews,” Journal of Real-Time Image Processing, vol. 18, no. 4, pp. 1011–1021, 2021. [Google Scholar]
11. S. Minaee, M. Minaei and A. Abdolrashidi, “Deep-emotion: Facial expression recognition using attentional convolutional network,” Sensors, vol. 21, no. 9, pp. 3046, 2021. [Google Scholar] [PubMed]
12. S. Li and W. Deng, “Reliable crowdsourcing and deep locality-preserving learning for unconstrained facial expression recognition,” IEEE Transactions on Image Processing, vol. 28, no. 1, pp. 356–370, 2019. [Google Scholar] [PubMed]
13. S. Xie and H. Hu, “Facial expression recognition using hierarchical features with deep comprehensive multipatches aggregation convolutional neural networks,” IEEE Transactions on Multimedia, vol. 21, no. 1, pp. 211–220, 2019. [Google Scholar]
14. Y. Wang, Y. Li, Y. Song and X. Rong, “The influence of the activation function in a convolution neural network model of facial expression recognition,” Applied Sciences, vol. 10, no. 5, pp. 1897, 2020. [Google Scholar]
15. H. H. Tsai and Y. C. Chang, “Facial expression recognition using a combination of multiple facial features and support vector machine,” Soft Computing, vol. 22, no. 13, pp. 4389–4405, 2018. [Google Scholar]
16. P. Udayakumar and N. Rajagopalan, “Blockchain enabled secure image transmission and diagnosis scheme in medical cyber-physical systems,” Journal of Electronic Imaging, vol. 31, no. 6, pp. 062002, 2022. [Google Scholar]
17. X. Yuan, L. Li, K. Wang and Y. Wang, “Sampling-interval-aware lstm for industrial process soft sensing of dynamic time sequences with irregular sampling measurements,” IEEE Sensors Journal, vol. 21, no. 9, pp. 10787–10795, 2021. [Google Scholar]
18. P. Mandal, A. U. Haque, J. Meng, A. K. Srivastava and R. Martinez, “A novel hybrid approach using wavelet, firefly algorithm, and fuzzy ARTMAP for day-ahead electricity price forecasting,” IEEE Transactions on Power Systems, vol. 28, no. 2, pp. 1041–1051, 2013. [Google Scholar]
19. Miami University Deception Detection Database. [Online]. Available: http://hdl.handle.net/2374.MIA/6067 [Google Scholar]
20. M. Gogate, A. Adeel and A. Hussain, “Deep learning driven multimodal fusion for automated deception detection,” in 2017 IEEE Symp. Series on Computational Intelligence (SSCI), Honolulu, HI, United States, pp. 1–6, 2017. [Google Scholar]
21. L. M. Ngo, W. Wang, B. Mandira, S. Karaoglu, H. Bouma et al., “Identity unbiased deception detection by 2D-to-3D face reconstruction,” in 2021 IEEE Winter Conf. on Applications of Computer Vision (WACV), Waikoloa, HI, USA, pp. 145–154, 2021. [Google Scholar]
22. W. Khan, K. Crockett, J. O’Shea, A. Hussain and B. M. Khan, “Deception in the eyes of deceiver: A computer vision and machine learning based automated deception detection,” Expert Systems with Applications, vol. 169, no. 5, pp. 114341, 2021. [Google Scholar]
23. M. Karnati, A. Seal, A. Yazidi and O. Krejcar, “LieNet: A deep convolution neural networks framework for detecting deception,” IEEE Transactions on Cognitive and Developmental Systems, pp. 1, 2021. https://doi.org/10.1109/TCDS.2021.3086011 [Google Scholar] [CrossRef]
Cite This Article
 Copyright © 2023 The Author(s). Published by Tech Science Press.
This work is licensed under a Creative Commons Attribution 4.0 International License , which permits unrestricted use, distribution, and reproduction in any medium, provided the original work is properly cited.
 Downloads
 Citation Tools