
 Submit a Paper
 Propose a Special lssue
 Open Access
ARTICLE

Google Scholar University Ranking Algorithm to Evaluate the Quality of Institutional Research
1 Department of Computer Science, Government College University, Faisalabad 38000, Pakistan
2 Department of Information Sciences, Division of Science and Technology, University of Education, Lahore, 54000, Pakistan
3 Department of Software Engineering, Government College University, Faisalabad 38000, Pakistan
4 Institute of IR4.0, Universiti Kebangsaan Malaysia, Bangi, Selangor, 43600, Malaysia
* Corresponding Author: Muhammad Murad Khan. Email:
Computers, Materials & Continua 2023, 75(3), 4955-4972. https://doi.org/10.32604/cmc.2023.037436
Received 03 November 2022; Accepted 17 February 2023; Issue published 29 April 2023
 View Full Text
 Download PDF
Abstract
Education quality has undoubtedly become an important local and international benchmark for education, and an institute’s ranking is assessed based on the quality of education, research projects, theses, and dissertations, which has always been controversial. Hence, this research paper is influenced by the institutes ranking all over the world. The data of institutes are obtained through Google Scholar (GS), as input to investigate the United Kingdom’s Research Excellence Framework (UK-REF) process. For this purpose, the current research used a Bespoke Program to evaluate the institutes’ ranking based on their source. The bespoke program requires changes to improve the results by addressing these methodological issues: Firstly, Redundant profiles, which increased their citation and rank to produce false results. Secondly, the exclusion of theses and dissertation documents to retrieve the actual publications to count for citations. Thirdly, the elimination of falsely owned articles from scholars’ profiles. To accomplish this task, the experimental design referred to collecting data from 120 UK-REF institutes and GS for the present year to enhance its correlation analysis in this new evaluation. The data extracted from GS is processed into structured data, and afterward, it is utilized to generate statistical computations of citations’ analysis that contribute to the ranking based on their citations. The research promoted the predictive approach of correlational research. Furthermore, experimental evaluation reported encouraging results in comparison to the previous modification made by the proposed taxonomy. This paper discussed the limitations of the current evaluation and suggested the potential paths to improve the research impact algorithm.Keywords
Despite the limitations that originate from ranking, it is a debatable subject all around the world. Rankings are considered crucial for preserving and enhancing the institutional status and reputation, both at the local and global level [1]. Initially, a variety of sources exist that evaluate universities globally, thus elevating the regional standing of the university in question. The Ranking sources, World University Rankings (WUR) (https://www.timeshighereducation.com/world-universityrankings) and Times Higher Education (THE) collaborate with governments all across the world to understand their performance, which includes analyzing ranking performance, simulation services, along with a variety of assessment, research, and analytical solutions [2]. The Quacquarelli Symonds (QS) world ranking (https://www.topuniversities.com/qs-world-university-rankings) follows the framework compiled by implementing six standards, i.e., Academic Reputation, Employer Reputation, Faculty/Student Ratio, Citation per Faculty, International Faculty Ratio, Worldwide Student Ratio to determine university’s accomplishment [3].
The state-of-the-art discoveries in information technologies and the digital education have made it easier than ever to gather, transmit, and share information about educational institutions. Emerging sectors of academic analytics and data mining has opened up new opportunities for collecting, analyzing, and presenting data. As a result, institutes may soon be able to leverage these new data sources to better assess and communicate with scholars and institutes [4]. For this purpose, data mining methods can be employed for data identification and data extraction process for the large datasets. The data mining method can be used for academic profiling and grouping in data items to uncover correlations. In the field of education, data mining techniques have the potential to provide valuable insights, which is needed for other associations and institutes positions on their record [5].
Improving the transparency of institutional rankings is another innovative strategy, as previous studies have left room for many ambiguities in their methodology and were criticized by geographic experts for lacking in the fundamental elements [6]. This approach focuses on evaluating criteria such as the quality of research, publication records, and co-author contributions. This method has gained widespread popularity and has become practical for many institutions to utilize. A number of databases collect information related to innovation factors based on Reputation, Research Quality, Status, Teaching, Academic Impact, and Social Impact. As a result, these circumstances combined to create an institution resembling the central United Kingdom’s Research Excellence Framework (UK- REF) [7]. The UK-REF is a peer-to-peer assessment method used in the UK to evaluate the quality of educational institutions using various rating categories, including Grade Point Average (GPA) [8], Power, and Intensity [9]. Later, the project REF replaced by the first Research Assessment Exercise (RAE) [10], is conducting empirical research. The goal of 2014 in higher education is to rate institutions by developing profiles of their scholars and the potential of their research. 154 UK universities submitted 1,911 entries, which included 52,601 academic staff members, 191,150 research outputs, and 6,975 impact case studies. A small team reviewed the submissions to respective Units of Assessments (UOAs) and considered the evidence offered. Based on the three main REF criteria of Impact [11], Output Quality [12] and Environment [13], 36 UOAs were chosen [14]. Data was gathered from the UK-REF and compared with Google Scholar (GS) later in 2017 [15].
First, the data was collected based on UK-REF to analyze an institute’s ranking. On the other hand, institutional data was extracted from GS using an enhanced bespoke algorithm and then collaborated and preprocessed the data. Once the results are examined without enhancing its algorithm, the analysis shows less correlation. Second, modifying the code in which changes took place by excluding redundant profiles, theses and dissertations, and false ownership of the papers. As GS persistently identifies the largest proportion of citations across all disciplines, with a range of 93 to 96 percent, surpassing Scopus (which ranges from 35 to 77 percent) and Web of Science (WOS) (which ranges from 27 to 73 percent) [16–18].
This paper contributes a comprehensive overview of real-life scenarios from educational domains to evaluate the results. The following are the contributions of this research:
• Extended the existing algorithm for eliminating redundant profiles for generating output.
• Extended the existing algorithm to exclude theses and dissertations and retrieved the actual publications.
• Extended the existing algorithm to exclude the documents fake ownership from scholar’s profiles.
A range of programs have been utilized to achieve research goals. Data is obtained through scraping and then structured into a database, which is later evaluated in spreadsheets [19–21]. Data extraction was performed to obtain the institutes data from GS till 2021 [22]. The GS data was acquired through the university’s domain name. Eventually, the data consists of profile folders, Hypertext Markup Language (HTML) for document pages, and an excel file named Users. Rapid-Miner is used to design and organize processes. Rapid-Miner Studio is a powerful data mining tool that enables everything from data mining to model deployment and operations [23,24]. Rapid-Miner is one of the most popular data science tools, including various components known as operators. The operators include everything to build a data mining process, such as data access, data cleansing, modeling, validation, scoring, and programming using python. Python is used as a programming language in Rapid-Miner because python provides a variety of libraries for data operations and browser automation. This research uses Selenium library for browser automation. Selenium comprises of driver object that loads a browser and provides a programming interface for python language. Once all the tasks are complete, python returns data to Rapid-Miner for visualization [25].
The rest of the paper is organized as follows: A comprehensive literature review is presented in Section 2 where a deep analysis of educational mining technique is performed to find the best source coverage for data extraction. The proposed methodology is explained in Section 3, where an algorithm is extended by adding functionality to remove ambiguities and derive the results. Section 4 presents a detailed evaluation of the experiment conducted and obtained results further compared to identify the improvement in results and resolve the issues in recent trends. Lastly, in Section 5, provides a conclusion and presents potential future directions.
2 Previous Analysis of Coverage
This section aims to present the prior work that is closely related to the proposed methodology. A variety of popular applications for educational data mining purposes have been studied from multiple sources. It is widely acknowledged that some of these can be seen in various forms of academic data mining, such as at the institutional level, document extraction, and extraction for research groups. The use of data mining in academia is a growing field named educational data mining (EDM), which focuses on developing techniques for retrieving information and data from educational environments [26–28]. These traditional data mining techniques are not applied directly to such academic records for ranking them. Academic information can be stored in a large volume, gathered from multiple sources in varying formats.
Numerous sources have been analyzed that are used at the institution level, including WOS, Scopus, GS, Microsoft Academic, and Webometrics. Any index, including citation-based, h-index, and i10-based, may be used to rank the institutions. Different sources do not exhibit this bias when comparing scholars’ profiles or journal article rankings. Ranking based on indicators, however, leads to varying outcomes [29]. An analysis is performed, which resulted in GS as the most reliable source for data coverage among all other sources like WOS, Scopus, and Bibliometric.
Scopus and the WOS have lower citation-based correlation results than GS and Microsoft Academic. Microsoft Academic and GS continue to have the same impact on the data in the second examination, except for one cited institution where data from 145 universities were obtained from five distinct fields. Therefore, a substitute for WOS and Scopus is utilized to lessen the effect of Microsoft Academic. Some scholars should compare universities rankings using various samples before providing a definitive answer for Microsoft Academic. One year after the prelaunch, Microsoft Academic coverage is examined [30]. Recent studies compare all bibliometric sources on a cross-sectional level. Microsoft Academic searched for a better alternative to cover citations and discovered more citations than WOS and Scopus. However, GS is still quite inclusive [31–33].
Document extraction from educational data mining determined the goal of theses and dissertation and scholar’s profiles extraction from diverse sources for their validation process. This application is compared as an individual instead of a group. It collects cited data in a wide range against each individual, scholar’s profile, or anything published for an academic discipline. However, it filters out the most cited documents so that they can be verified and ranked to those institutes, scholars, and any associated group as illustrated in Table 1.

The objective of research group extraction is to identify similar clusters of instances based on specific characteristics shown in the following Table 1. Unlike traditional methods, this approach evaluates the groups as a whole instead of individuals. The correlation between groups is compared at two levels. The overall impact and strength of the group is assessed on an absolute level, and the educational impact and quality factors are evaluated based on the group size. Table 1 displays different research groups that have been extracted from journals, articles, and researchers from different extraction sources.
A study [8] was carried out in depth after reviewing the collected literature, which proposed a novel approach to compete with the UK-REF. REF is a research assessment exercise used in the United Kingdom to evaluate the quality of research conducted by universities. The study was conducted through peer review, with university departments submitting samples of their research outputs for evaluation by panels. Several challenges highlighted by the core study including the reliance on subjective judgment, high costs and time- consumption, and the lack of information about the methodology in the REF. To address these issues, the authors designed a bespoke algorithm that utilized readily available and accessible bibliometric data from GS to rank universities, providing a more credible and transparent evaluation of university research.
Although the existing paper presented a novel solution [8] but faced multiple issues Fig. 1. The first issue is profile redundancy, as GS accepts a proxy when retrieving Google citations with multiple profiles considered for the ranking. The second issue is that every citation is considered valid, even if they originate from theses, which lacks a mechanism to determine if the digitized documents are derived from theses and dissertation [34]. The third issue is that many scholars have papers not attached to their profiles, leading to ambiguous results when associating them [8,25]. These limitations can be improved by extending the algorithm. This paper plans to address these issues, and the methodology section highlights the approach.

Figure 1: Google Scholar issues using the bespoke program
3.1 Existing Bespoke Algorithm
This section highlights the procedure of the proposed model for institutes ranking using GS data. To understand the process, this research used the current version of the UK-REF dataset published in May 2022, named REF 2021. Moreover, our proposed model accelerates eliminating the deficiencies which reviewed [8]. There are two sources for collecting the current sample data: one is the UK-REF official website for the detailed version of the data (https://www.results2021.ref.ac.uk) along with complete submissions by an institute and scholar’s profile scoring research quality, and the second source is the ranking of REF 2021 from THE, which comprises of the final rank for each institute with other metrics of REF like GPA, Intensity, and Power.
According to the existing studies [35–39] bespoke code cannot handle the redundant profiles, theses and dissertations, and falsely owned citations of scholars to develop an efficient and reliable source for ranking institutes. The steps of the bespoke code are used as a baseline for processing data extraction from GS Fig. 2. The following stages take into consideration data obtained from GS in order to execute a range of tasks to prepare the data for further processing. During the data preprocessing, the Minimal Data reduction technique is applied to extract the best feature for the analysis.

Figure 2: Google Scholar updated ranking algorithm
1. First, a list of institutes is acquired from the current REF. The university checks all web pages through their Uniform Resource Locator (URLs) to ensure they have verified domain names, as shown in Fig. 2. All the organizations have collected a list of domain names to verify their websites individually.
2. On the other hand, after getting the list from REF, all registered institutions are processed through an interface designed by GS, which identifies the authors associated with an institution. Input data is taken from GS for further institutional ranking. To achieve this, the existing bespoke R program is used to retrieve a list of all institutes domain addresses from the GS data. To access any institute, type the domain name of the desired institute in the URL bar, e.g., http://www.gcuf.edu.pk, which will return the domain name of “Government College University” along with the web browser page.
3. The extracted data from GS institutional author listing interface can be used to find a list of institutes and scholars for each institute. This information can rank the institutes based on their research quality and citation analysis.
4. After obtaining the list of scholars affiliated from the list of domains, the original page for each scholar can be retrieved. Additionally, further pages can also be searched by clicking. During this step, GS interacts with the institutional author listing interface for collecting author profiles. When one clicks on a scholar’s profile, their personal information, institutional affiliation, research interest, and citation count are retrieved from the original page.
5. The process, “profile fetching,” downloads author profiles based on the provided URL of the university. This process continues until each citation for the scholar profile and each domain page is searched out after filtering and classifying them for the list. In contrast, the author profile interface collects data such as citations, h-index, and i10-index for each profile on the original page for extracting the list of papers, Citation hi-index, and documents belonging to the scholar profile or with any affiliation.
6. A GS list is obtained against each specified domain. “Information Extraction” from each domain to each page of the downloaded profiles. This information comprises of paper title, paper abstract, getting a list of papers, citation of the paper, citations of the author, 5-year citations of the author, h-index of the author, 5-year h-index of the author, i10-index, and 5-year i10-index of the author. This process continues to grasp the next level. Using these metrics, all measurements were performed on the data retrieved from GS.
7. Once the extraction process is completed, these metrics are further used to process information for generating the rank list for the institutes. The generated output list is compared with the REF UK-based ranking list. The compared list showed the results in correlation, Linear+ Non-Linearity of the institute, and how much the generated ranked list correlates with REF.
3.2 Methodological Modifications
Limitations of the existing methodology are related to the algorithm design decisions of authors who made to check how the methodology is implemented. Each will require different working hours to change, implement, and validate it. Some of them are easy to resolve during changing phase, whereas some become more difficult when changes are not adapted successfully. However, current code implementation addresses code-level issues by utilizing fewer resources to retrieve data from GS. GS returns the data we request and the goal is to measure the maximum number of unique records indexed in Google Scholar. If GS returns consistent results from our query under stable conditions, it leads to the reliability and correctness of our query. We rely on the correct factor estimation, which implicitly counts the hits, but GS explicitly provides ‘xxx results’, resulting in redundancy.
A. Elimination of Redundant Profiles (ERP)
Current algorithms generate output by checking the academic profiles of an institute, such as a single scholar having multiple profiles on Google Scholar. Part (A) of Fig. 3 shows the redundant profile for one scholar with the same name and affiliations but with different citation counts. However, Citation redundancy is caused when an author adds multiple copies of the same publication and when multiple authors of the same organization add the same publication to their credit [8]. For this purpose, a keyword vector matching approach in Fig. 3 first phase of the process, is applied to resolve the redundant profile issue in which three significant factors are used to identify the original profile of the scholar. The scholar profile consists of four factors: Personal Information, Research Interest, Institutional Affiliation, and scientific production. The first step is to check the scholar profile by his personal information, which significantly indicates the scholar name. After the scholar’s name, research interest is the keyword to retrieve his domain. Retrieved profiles by setting the keyword terms: Scholar’s Name, Titles, Institutional Affiliation, Citation Count. Two profiles having the same name will merge, citations with double count will be deleted and the rest of the irrelevant terms will exclude those that not belongs to the one’s profile. Following the process in Fig. 3, GS profiles were extracted again for the selective keywords terms.

Figure 3: Identification of redundant profile by Google Scholar
Scholar Name or affiliation carries high scoring criteria of the identification because it might be possible that one scholar left that institute and is now affiliated with the new one. He has not yet activated his profile on GS. However, the publication of a scholar’s profile can be verified using email and affiliation, but GS fails when the journal does not provide the author email.
B. Excluding Theses and Dissertations (ETDs)
It is related to document source validation, as GS does not provide any metrics to differentiate among the publications indexed in renowned authentic journals and published by the authors on social platforms such as research gate or their website. Universities ranking list obtained from GS includes the citation of theses and dissertations. The citation of a published paper should be considered only. So, there is a lack of built-in mechanism within GS to correctly determine whether digitized documents have been converted from theses and dissertations.
The issue with such citations is that respective publications do not go through a peer-review process. Second, the URL matching method is applied to verify the source of citations. Suppose the document matches any theses and dissertation cite or its URL matches any source. In that case, it is excluded from an author’s profile and counts as its unique citation only as shown in Fig. 4. Furthermore, it has been observed that the GS-based URL technique helps in assessing the institutional ranking when the official URL of the institution is acquired straight from the link (webometrics.info.en/Europe/Turkey) [8]. There are numerous theses archives available online from where we can validate the documents, which can be a part of theses or partially published as citation papers. These archives include Oatd, ProQuest, Libguides, Excluding Theses and Dissertations (ETD) search, ndltd, asc.ucalgary, Online Computer Library Center (OCLC), Guides.library and springer are online library platforms from where theses, book chapters, or any document can be checked, whether a research article is original or part of theses and dissertations.

Figure 4: Identification of redundant profile by Google Scholar
C. False Ownership Detection (FOD)
The existing bespoke program ignores papers that are not owned-authored by the academician, and this causes an increase in the citation, which is not a real citation of the organization. This limitation arises when an author adds a publication to his profile that he does not publish [8]. The GS user can add publications manually without having any mechanism to prove the publication’s authority, as presented in Fig. 5B. This limitation can be addressed by observing the publications research keywords and an author’s organizational research profile. Institutional affiliation, the third stage of the process, selects all profiles with the association of any institute or research center regardless of a scholar’s keywords or research interest. The similarity of the publications before declaring if both profiles belong to the same user. GS allows an author to affiliate with the organization. It can help in measuring the research output of the scholar. After selecting scholar profiles, it checks the domains belonging to their email addresses. In Fig. 5B, scholar profiles with verified email domains such as <gcuf.edu.pk> are selected and if ones profile is not verified by email domain or institutional affiliation will be ignored.

Figure 5: Identification criteria of false ownership by Google Scholar
Ranking institutional profiles based on the published articles and references associated with the author’s email address. The list of articles and index of references for each of these profiles shows all the published articles the author has collaborated on with their previous and current institutes. In this system, the institutional rankings are determined by the number of citations the author’s papers receive. However, if an author has multiple institutional profiles, only the profile with the highest citation count is considered in the selection phase. This means that it is possible for an author to falsely increase their citation count by creating multiple profiles, but this will not affect the final selection.
3.3 Key Metrics across the Entire Sample
The present study validated that various online reference sources can be used to rank universities as effectively as the UK-REF. We have highlighted the details of two datasets: UK-REF and GS data. It was first submitted to UK-REF, then extracted from GS, and finally mapped together. The dataset includes institutes with no profile associated with their domain name and in some cases, without a domain name obtained from its URL. On the other hand, some institutes have domain names with their URLs and scholar’s profiles, but they still cannot extract the citation. This could be because an institute has a verified domain name and scholars profiles, but its citations are not added to its profiles. To ensure the best results, the data must be preprocessed before the actual preprocessing starts. After analyzing the data, we came to the point that data extracted from GS is in imbalance form and balanced through the over-sampling technique. Table 2 shows the preprocessing of the data before experimental evaluation. We select UK-REF 2021 published data which is identical. This data set contains 7 features, including 3 leading labels: GPA, Power, and Intensity. Starting with the feature selection from the extracted data and discovering the best features in both GS and REF categories.

After the data extraction process, some institutes had missing information about their research and scholar profiles. Three different approaches were considered to handle these missing data elements. The first approach was to leave these patterns as is, without any missing data. The second approach was to enter data into the missing values in these spaces. The third approach was to eliminate the most repetitive aspect. In 2022, six institutions removed their domain names and displayed “no profiles found” suggesting that the scholars had not register or create their profiles on the institute’s official site. A GS profile suggests affiliation with the institute, research papers, and references. Institutions with the status “No profile found” have no value against the GS metrics, so they cannot be ranked among other entities and are excluded from the list. Rating bodies must have references, a scholar’s profile, and in-depth research criteria that meet the REF criteria. The Institute of Zoology does not have a domain name with an address bar, so it has been removed from the list. After the election, there were 120 institutions. Mined data is integrated with each institute by entering its address, current REF 2021 data, and GS data 2022, as presented in Table 2.
This section presents the results of the institutes ranking process using Google Scholar (GS) data extraction. The data used in this ranking process includes the institute list, citations, documents, theses, and dissertation for 2021. The study highlights that multiple profiles, theses and dissertations, and false ownership of articles can significantly impact the accuracy of the data used to assess the institute rankings. The ranking of institutes and scholars may remain the same or change due to the growth of other institutions and scholars. The analysis thoroughly examines all the changes that have been introduced and implemented.
This section incorporates the data from GS and REF, which have metrics to gauge the level of compliance between UK-REF and GS data to assess the strength of their correlation. This data can be used for further calculations. The data obtained from Google Scholar was unstructured with eight metrics named, i.e., Citation All, Citation 5 years, H-Index All, H-Index 5 years, I10 All, I10 5 years presented in Fig. 6. REF has three variables, GPA, Power, and Intensity, to compare the proposed method with GS evaluation metrics.GS, with its eight metrics combined with both variables 3 × 8, takes twenty-four combinations. Each institute file is analyzed individually, and the data from each institute is run and merged into one “status file” for the experiment.

Figure 6: Status file of data collection with metrics extracted through Google Scholar
4.1 Experimental Evaluation of GSURA for UK-REF 2021 and Google Scholar 2022
As concluded, the data obtained from GS was unstructured and had duplicated values. For this purpose, model data into more readable form by performing many functions, i.e., data conversion to numbers, redundancy removal, exclusion of theses and dissertations and false ownership of a scholar’s profile. Processed data is further used to rank the universities as GS was inadequate to automatically exclude redundancy and false ownership in profiles. However, the GS ranking algorithm is modified to overcome these issues as shown in Fig. 7, how the data is passed through the algorithm to exclude the factors which cause false results. The extracted data for each institute is in bulk quantity due to its redundant citation and false ownership in a scholar profile.

Figure 7: Google Scholar ranking algorithm modified techniques
4.1.1 Excluding Redundant Profiles through GSURA
When the same person creates two profiles and indexes different papers on both profiles, Data fetching from both profiles are treated as separate users in the current system. A keyword vector matching approach is added in the proposed method to resolve the redundant profile issue. This factor carries a moderate average of the identification because it might be possible that one scholar left that institute and is now affiliated with the new one. He has not yet activated his profile on GS. However, the publication of a scholar’s profile can be verified using email and affiliation, but GS fails when the journal does not provide the author’s email. For instance, if an author claims 100 citations and more than 50 citations match with an author’s name and 10% match with the author’s email if provided, this leads to selecting the profile that most likely matches. Therefore, the profile verification based on author names only marks a high probability of correctness. The subsequent prime division of the REF and GS metrics after excluding redundant profiles is shown in Table 3. Then after changing the model, the data have been extracted from GS and the duplicate entities are removed from each institute file and named with specified variable names.

1. First, the section indicates the metrics values of the existing system of REF 2021, which is regenerated. As REF has three combinations of its metrics, it generates their correlation, presenting how articulate they are (0.61–0.81).
2. The second section, where REF and GS are correlated with (lowest = 0.52 and highest 0.91), does not show a strong correlation among them.
3. In the third section, it is evident that GS metrics are highly skewed with their variables and show a high correlation. (Lowest = 0.53 and highest 0.97).
4.1.2 Eliminating Theses and Dissertations through GSURA
There are numerous theses archives available online from where we can validate the documents, which can be a part of theses or partially published as citation papers. These archives method and international repositories like Oatd, ProQuest, Libguides, Global ETD search, ndltd, asc.ucalgary, OCLC, Guides.library and springer are online library platforms from where theses, book chapters, or any document can be checked, whether a research article is original or part of theses and dissertations.
The succeeding division in Table 4 from the REF and GS metrics is:
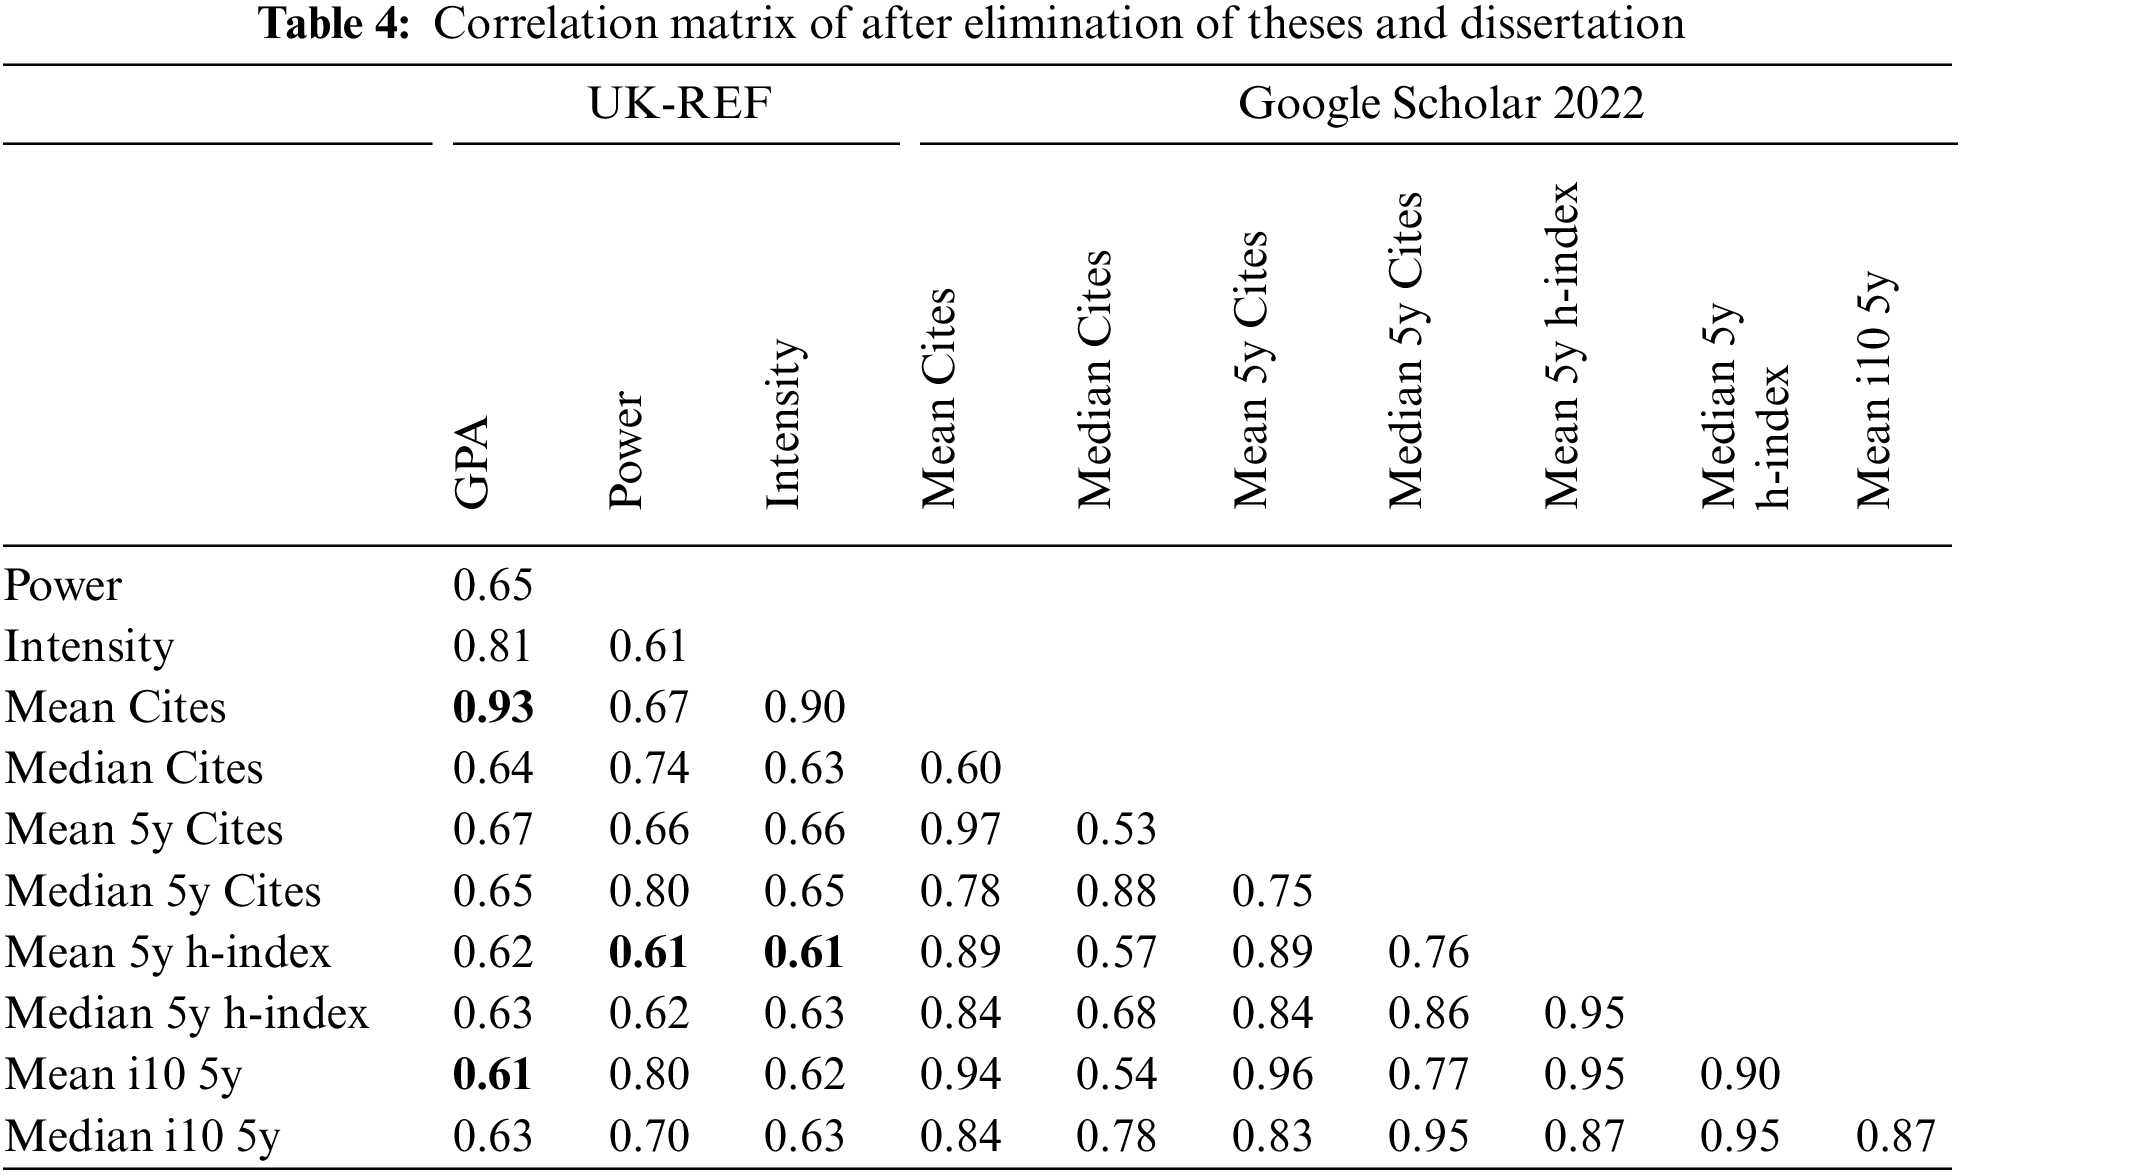
1. The first part, indicates the REF metrics values of the existing system showing how coherent they are (0.61–0.81).
2. The second part, where REF and GS are correlated with (lowest = 0.61 and highest 0.93), shows a moderate correlation among them.
3. In the third part, it is clear that GS metrics are highly skewed with their variables and show a high correlation. (Lowest = 0.53 and highest 0.97).
4.1.3 Exclusion of False Ownership Citations through GSURA
In each institutional profile related to the email address, the list of articles and the index of references show a list of all the published articles in collaboration with the previous and current institutes. In the Institutional Rankings, both profiles were counted for citation. Author profile based on all cited articles. According to the evaluation criteria, 50% of the total for all the papers associated with an author, for instance, the author having the same email and affiliation in both profiles but different citations in number. So, it can add to the profile falsely to increase its citation overall. However, it is excluded from the selection phase and chosen with a higher citation profile.
The consequent division from the REF and GS metrics are in Table 5:
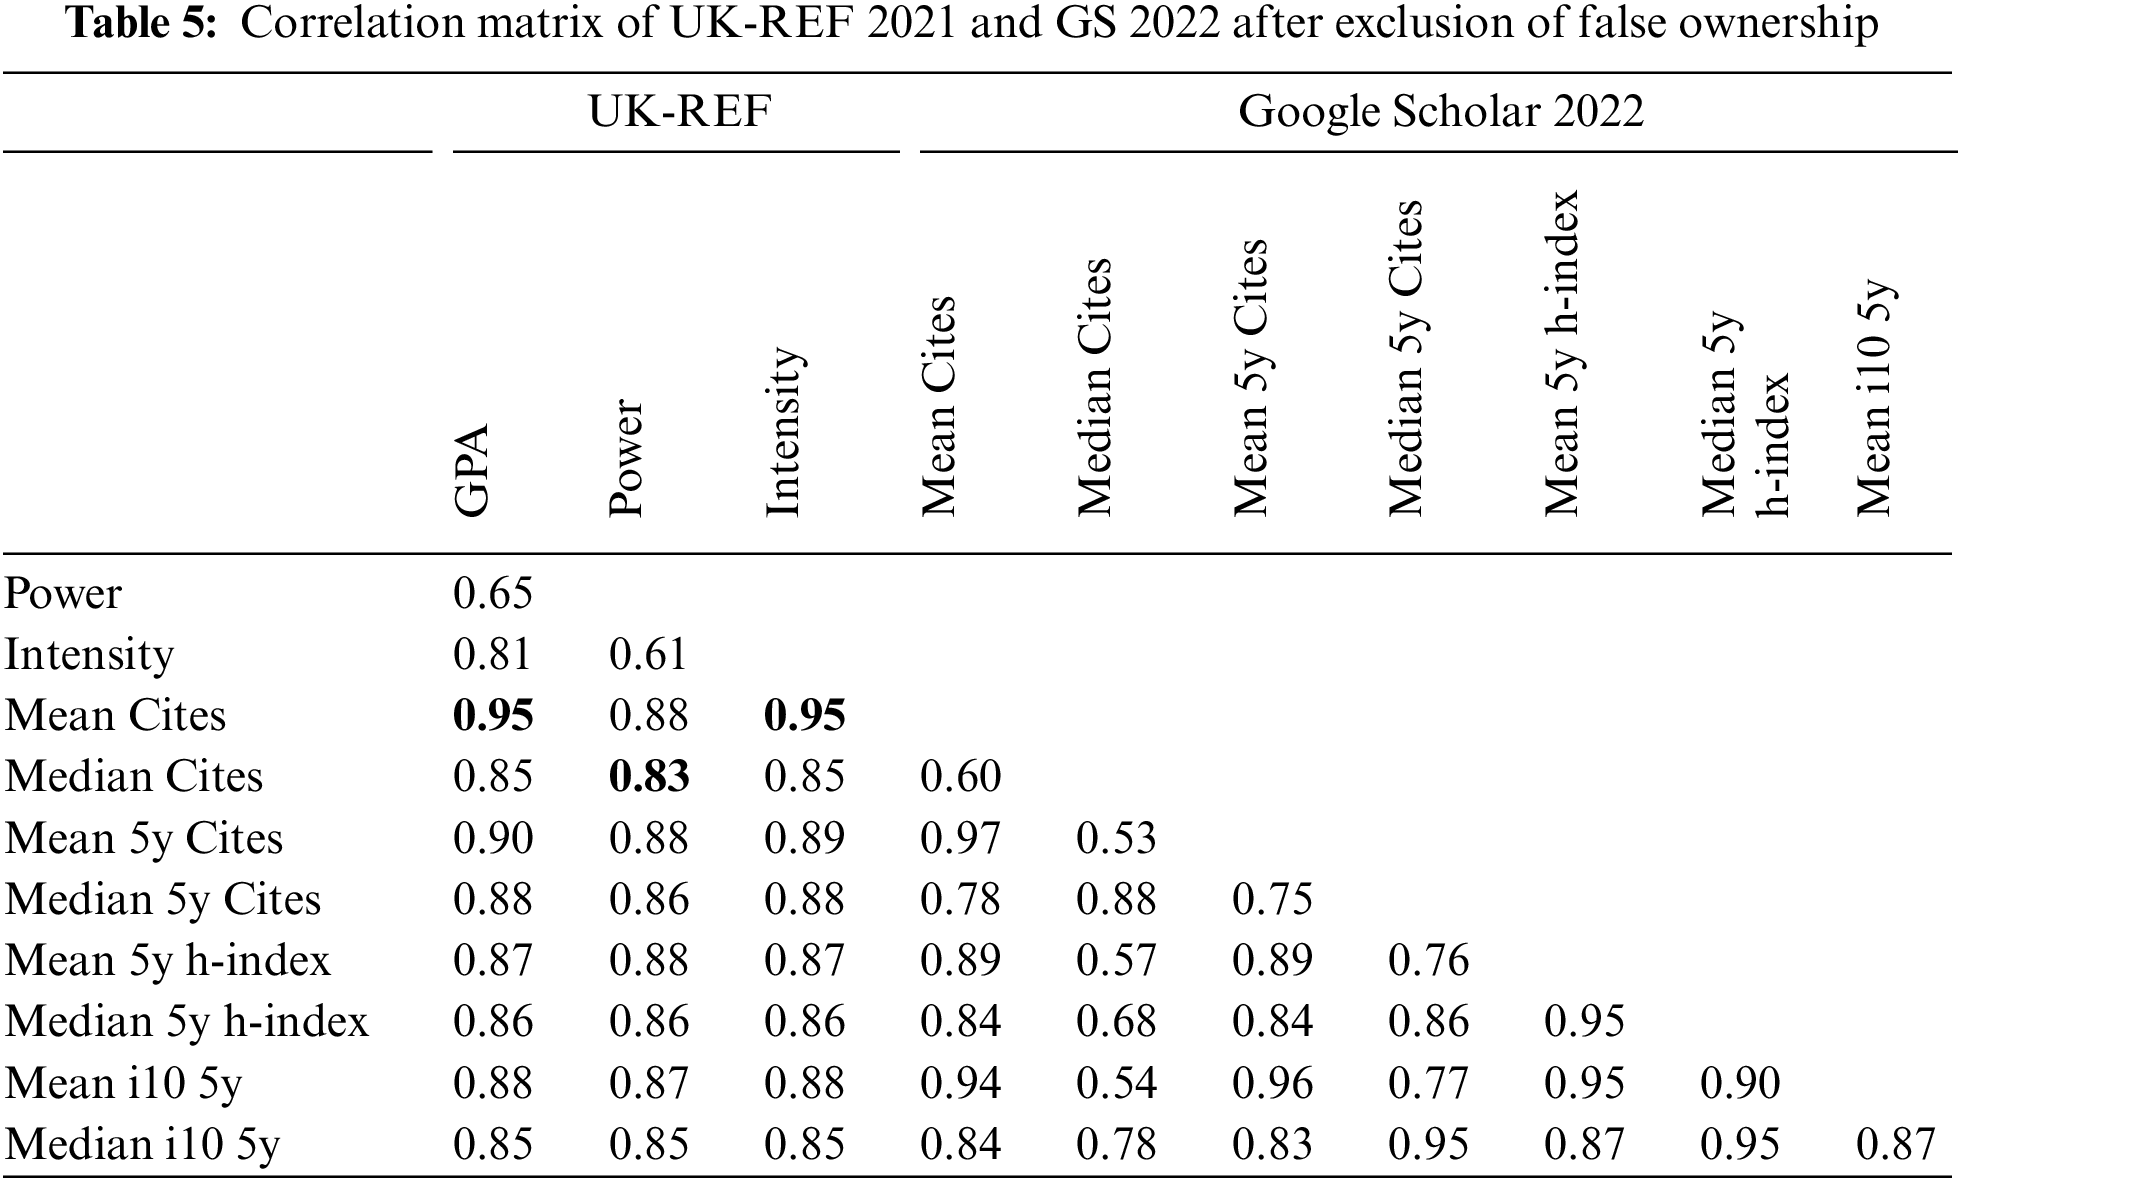
1. The first division indicates the REF metrics values for the existing system of REF 2021. As REF has three variables, it generates their correlation, showing how coherent they are (0.61–0.81).
2. The second division, where REF and GS are correlated with (lowest = 0.83 and highest 0.95), shows a strong correlation among them.
3. In the third division, it is evident that GS metrics are highly skewed with their variables and show a high correlation. (Lowest = 0.53 and highest 0.97).
4.2 Comprehensiveness Analysis
This section shows results summarizing UK-REF-2021 with GS-2022 using the custom code. Table 6 illustrates the performance evaluation of the sources used for data extraction to rank the institutes in symmetry.
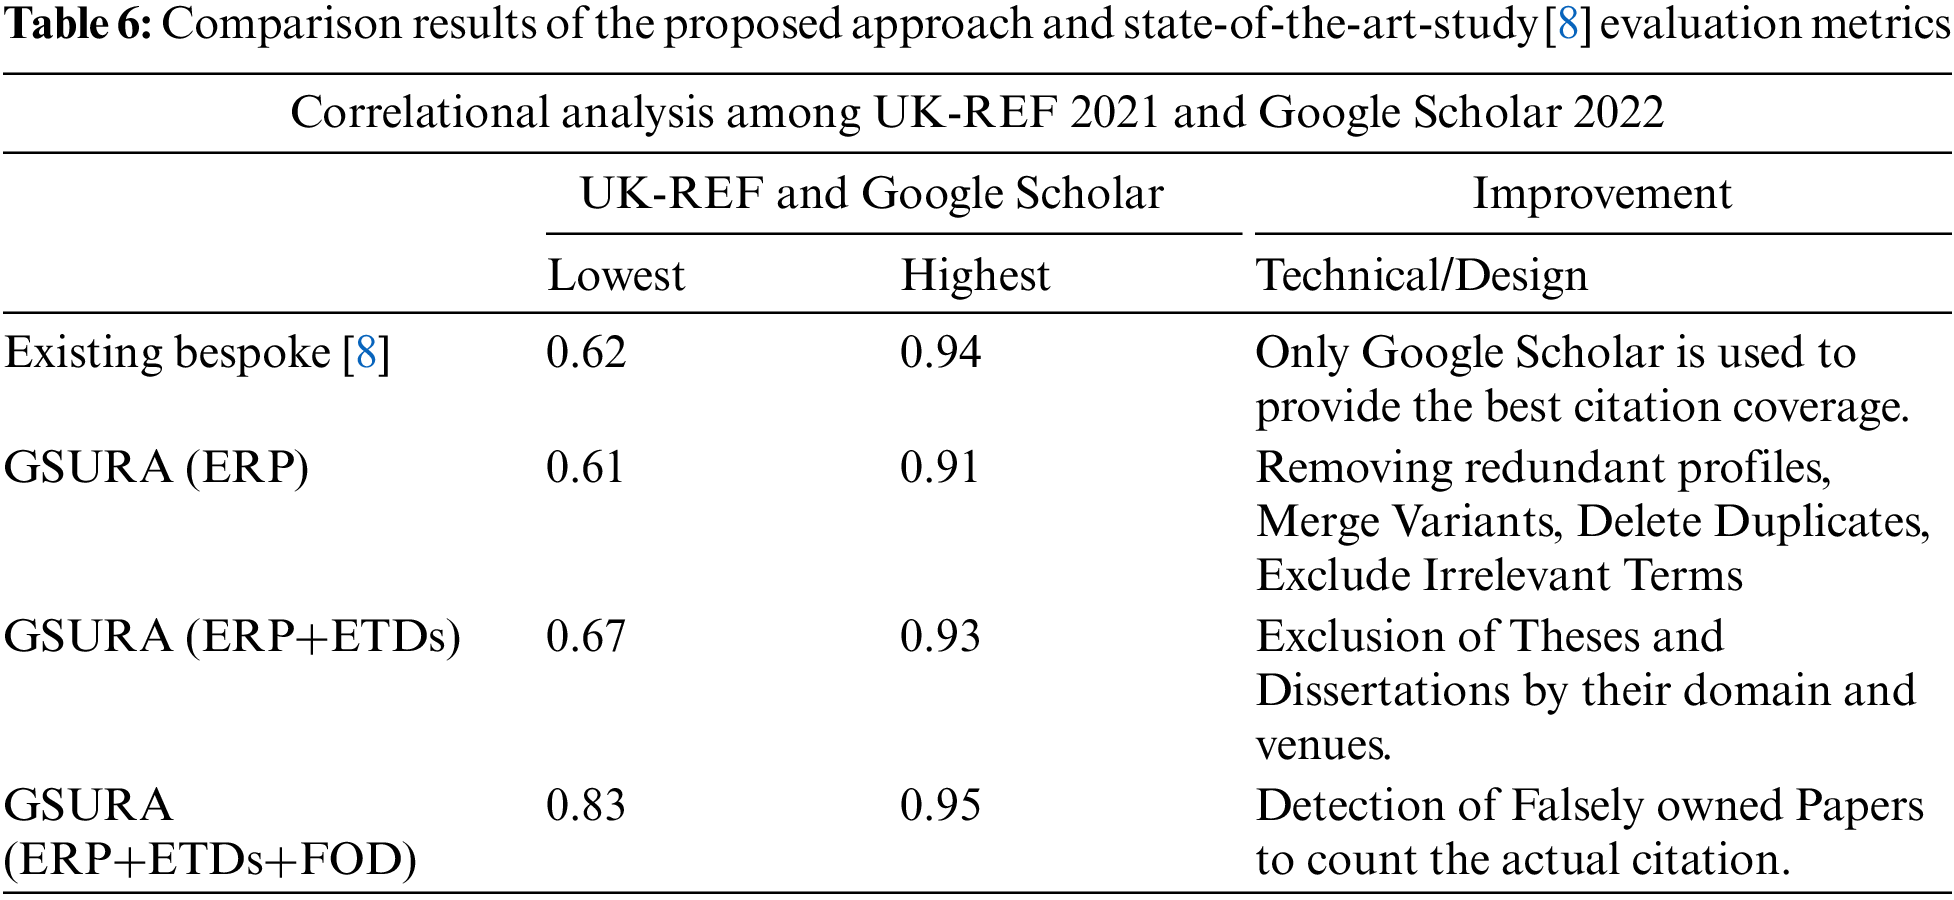
First, it provides a comparison between strategies to increase the ranking of institutions, their input, the domain name of the institute, the profile of scholars, and the number of papers and citations within the data set performed in the current year. The highlighted performance indicates the years of GS extracted data to be measured against UK-REF. The data was extracted from GS in terms of the number of published articles that increased the citations in a scholar profile because there is a decline in the scholar’s profile, the number of papers, and citations. Then there must be some incline at some end. The updated model is based on an academic search GS, covering the discrepancies. The comparison observed a ranging correlation from each procedure outlined in Table 6. Correlation measures were used to measure GS and REF metrics, showing a considerable difference between the amendments made. It is clear from Table 6 that UK-REF 2021 and GS2022 have shown consistent growth and varied results every time after the data extracted from GS.
This article explores the United Kingdom’s Research Excellence Framework (UK-REF) 2021 tool for ranking institutes using cited data from Google Scholar (GS). Other data sources, Microsoft Academic, Scopus, Web of Science (WOS), and Research Gate, to choose the most acceptable source for data extraction. After exploring, GS is proven to be excellent among all in terms of consistency, validity, and certainty because it provides the most cited documents and maximum output generation. After removing discrepancies, the bespoke program is modified to work well with it. The data extracted from GS for 2022 to enhance its results more significantly after excluding redundant profiles, theses and dissertations mechanism to correctly determine whether the documents digitized have been converted from a dissertation and falsely owned papers by the academician, which is not an actual citation of the organization. The findings indicate that we have attained encouraging progress. Then compare the findings with those from UK-REF 2021 to assess if there have been any changes over the years. Some institutes sustained their positions by delivering high-quality research contributions from their institute’s scholars, boosting their citations. However, some institutions experienced changes in their rankings due to factors such as research quality, impact and environment. The current algorithm, as demonstrated by the correlational analysis results, has limitations that can be addressed to improve its efficiency. For example, the current algorithm only relies on GS data for generating outputs, whereas alternative sources such as Microsoft Academic could also be utilized for this purpose [40]. Firstly, it does not omit publications published under other organizations such as the previous university of the scholar. Secondly, the existing algorithm does not perform group citations based on university categories like Technology University, Science University, social sciences, etc. Additionally, there are not just comparisons between REF and the African ranking organizations but other countries also have ranking organizations that differ from their respective ministries. Furthermore, it is important to note that any change made to the process could potentially affect the aggregated results and alter the institute rankings, leading to different correlation outcomes. Therefore, it is crucial to optimize the algorithm to ensure accurate results [41].
Acknowledgement: The authors shall thank Government College University for providing resources for this research.
Funding Statement: The authors received no specific funding for this study.
Availability of Data and Materials: The authors confirm that the data supporting the findings of this study are available as part of the article with its supplementary materials. Moreover, additional data sources are mentioned in the article wherever required. Source code and all supplementary materials available from: https://github.com/MuhammadMuradKhan/GSURA
Conflicts of Interest: The authors declare that they have no conflicts of interest to report regarding the present study.
References
1. M. G. A. Ali, “A general perspective about institutional rankings, ranking framework, benefits of rankings and ranking methodological flaws and best approach for being a world class institution,” International Journal of Educational Research Review, vol. 7, no. 3, pp. 157–164, 2022. [Google Scholar]
2. M. Stack, “Visualizing excellence: The times higher education ranking,” in Global University Rankings and the Mediatization of Higher Education. Canada: University of British Columbia, pp. 51–69, 2016 https://doi.org/10.1057/9781137475954_5 [Google Scholar] [CrossRef]
3. B. Sowter, “The times higher education supplement and quacquarelli Symonds (THES-QS) World university rankings: New developments in ranking methodology,” Higher Education in Europe, vol. 33, no. 2–3, pp. 345– 347, 2008. [Google Scholar]
4. P. Baepler and J. C. Murdoch, “Academic analytics and data mining in higher education,” International Journal for the Scholarship of Teaching and Learning, vol. 4, no. 2, pp. 1–9, 2010. [Google Scholar]
5. M. Bilal, G. Ali, M. W. Iqbal, M. Anwar, M. S. A. Malik et al., “Auto-Prep: Efficient and robust automated data preprocessing pipeline,” IEEE Access, vol. 10, pp. 107764–107784, 2022. [Google Scholar]
6. C. Daraio, A. Bonaccorsi and L. Simar, “Rankings and university performance: A conditional multidimensional approach,” European Journal of Operational Research, vol. 244, no. 3, pp. 918–930, 2015. [Google Scholar]
7. M. N. M. Wroblewska, “Impact evaluation in Norway and the UK: A comparative study, based on REF 2014 and Humeval 2015–2017,” ENRESSH Working Paper, vol. 2019, no. 1, pp. 67, 2019. [Google Scholar]
8. J. Mingers, J. R. O’Hanley and M. Okunola, “Using Google Scholar institutional level data to evaluate the quality of university research,” Scientometrics, vol. 113, no. 3, pp. 1627–1643, 2017. [Google Scholar] [PubMed]
9. S. Naseem, A. Alhudhaif, M. Anwar, K. N. Qureshi and G. Jeon, “Artificial general intelligence based rational behavior detection using cognitive correlates for tracking online harms,” Personal and Ubiquitous Computing, vol. 2022, pp. 1–19, 2022. [Google Scholar]
10. J. Broadbent, “The UK research assessment exercise: Performance measurement and resource allocation,” Australian Accounting Review, vol. 20, no. 1, pp. 14–23, 2010. [Google Scholar]
11. C. Manville, M. M. Jones, M. Frearson, S. Castle-Clarke, M. -L. Henham et al., “Preparing impact submissions for REF 2014: An evaluation. Findings and observations,” RAND Europe, vol. 1, pp. 1–9, 2015. [Google Scholar]
12. H. F. Moed, “UK research assessment exercises: Informed judgments on research quality or quantity,” Scientometrics, vol. 74, no. 1, pp. 153–161, 2008. [Google Scholar]
13. R. Marcella, H. Lockerbie and L. Bloice, “Beyond REF 2014: The impact of impact assessment on the future of information research,” Journal of Information Science, vol. 42, no. 3, pp. 369–385, 2016. [Google Scholar]
14. C. Manville, M. M. Jones, M. Frearson, S. Castle-Clarke, M. -L. Henham et al., “Preparing impact submissions for REF 2014: An evaluation,” RAND Corporation, vol. 1, pp. 11–19, 2015. [Google Scholar]
15. A. W. Harzing and S. Alakangas, “Microsoft Academic: Is the phoenix getting wings,” Scientometrics, vol. 110, no. 1, pp. 371–383, 2017. [Google Scholar]
16. S. Mikki, “Google Scholar compared to Web of Science. A literature review,” Nordic Journal of Information Literacy in Higher Education, vol. 1, no. 1, pp. 41–51, 2009. [Google Scholar]
17. J. Mingers and E. Lipitakis, “Counting the citations: A comparison of web of science and Google Scholar in the field of business and management,” Scientometrics, vol. 85, no. 2, pp. 613–625, 2010. [Google Scholar]
18. V. A. Saurkar, G. K. Pathare and A. S. Gode, “An overview on web scraping techniques and tools,” International Journal on Future Revolution in Computer Science & Communication Engineering, vol. 4,no. 4, pp. 363–367, 2018. [Google Scholar]
19. M. Anwar, A. H. Abdullah, A. Altameem, K. N. Qureshi, F. Masud et al., “Green communication for wireless body area networks: Energy aware link efficient routing approach,” Sensors, vol. 18, no. 10, pp. 3237, 2018. [Google Scholar] [PubMed]
20. S. Amjad, M. Younas, M. Anwar, Q. Shaheen, M. Shiraz et al., “Data mining techniques to analyze the impact of social media on the academic performance of high school students,” Wireless Communications and Mobile Computing, vol. 2022, no. 2, pp. 1–11, 2022. [Google Scholar]
21. M. Franceschet, “A comparison of bibliometric indicators for computer science scholars and journals on Web of Science and Google Scholar,” Scientometrics, vol. 83, no. 1, pp. 243–258, 2010. [Google Scholar]
22. A. W. Harzing and S. Alakangas, “Microsoft Academic is one year old: The Phoenix is ready to leave the nest,” Scientometrics, vol. 112, no. 3, pp. 1887–1894, 2017. [Google Scholar]
23. A. Martín-Martín, M. Thelwall, E. Orduna-Malea and E. D. López-Cózar, “Google Scholar, Microsoft Academic, Scopus, Dimensions, Web of Science, and OpenCitations’ COCI: A multidisciplinary comparison of coverage via citations,” Scientometrics, vol. 126, no. 1, pp. 871–906, 2021. [Google Scholar]
24. S. Bangani, “The impact of electronic theses and dissertations: A study of the institutional repository of a university in South Africa,” Scientometrics, vol. 115, no. 1, pp. 131–151, 2018. [Google Scholar]
25. G. Etxebarria and M. Gomez-Uranga, “Use of Scopus and Google Scholar to measure social sciences production in four major Spanish universities,” Scientometrics, vol. 82, no. 2, pp. 333–349, 2010. [Google Scholar]
26. A. W. Harzing and S. Alakangas, “Google Scholar, Scopus and the Web of Science: A longitudinal and cross-disciplinary comparison,” Scientometrics, vol. 106, no. 2, pp. 787–804, 2016. [Google Scholar]
27. N. Rana, M. S. A. Latiff, S. I. M. Abdulhamid and H. Chiroma, “Whale optimization algorithm: A systematic review of contemporary applications, modifications and developments,” Neural Computing and Applications, vol. 32, no. 20, pp. 16245–16277, 2020. [Google Scholar]
28. A. W. Harzing, S. Alakangas and D. Adams, “hIa: An individual annual h-index to accommodate disciplinary and career length differences,” Scientometrics, vol. 99, no. 3, pp. 811–821, 2014. [Google Scholar]
29. J. Mingers and L. Leydesdorff, “A review of theory and practice in scientometrics,” European Journal of Operational Research, vol. 246, no. 1, pp. 1–19, 2015. [Google Scholar]
30. A. W. Harzing, “Running the REF on a rainy Sunday afternoon: Can we exchange peer review for metrics,” in STI Conf. Proc., Centre for Science and Technology Studies (CWTS), Netherlands, Leiden University, pp. 339–345, 2018. [Google Scholar]
31. A. W. Harzing, “Two new kids on the block: How do crossref and dimensions compare with Google Scholar, Microsoft Academic, Scopus and the Web of Science,” Scientometrics, vol. 120, no. 1, pp. 341–349, 2019. [Google Scholar]
32. E. Orduna-Malea, S. Aytac and C. Y. Tran, “Universities through the eyes of bibliographic databases: A retroactive growth comparison of Google Scholar, Scopus and Web of Science,” Scientometrics, vol. 121, no. 1, pp. 433–450, 2019. [Google Scholar]
33. P. K. Gupta and A. Garg, “National institutional ranking framework (NIRFAnalyzing performance of top 50 management schools,” in Academy of Management Proc., Briarcliff Manor, New York, USA, pp. 16066, 2022. [Google Scholar]
34. J. Taylor, “The assessment of research quality in UK universities: Peer review or metrics,” British Journal of Management, vol. 22, no. 2, pp. 202–217, 2011. [Google Scholar]
35. M. Anwar, F. Masud, R. A. Butt, S. M. Idrus, M. N. Ahmad et al., “Traffic priority-aware medical data dissemination scheme for IoT based WBASN healthcare applications,” Computers, Materials & Continua, vol. 71, no. 3, pp. 4443–4456, 2022. [Google Scholar]
36. A. Martín-Martín, E. Orduna-Malea and E. D. López-Cózar, “A novel method for depicting academic disciplines through Google Scholar citations: The case of bibliometrics,” Scientometrics, vol. 114, no. 3, pp. 1251–1273, 2018. [Google Scholar]
37. O. Mryglod, R. Kenna, Y. Holovatch and B. Berche, “Comparison of a citation-based indicator and peer review for absolute and specific measures of research-group excellence,” Scientometrics, vol. 97, no. 3, pp. 767–777, 2013. [Google Scholar]
38. E. Orduña-Malea and E. D. López-Cózar, “Google Scholar metrics evolution: An analysis according to languages,” Scientometrics, vol. 98, no. 3, pp. 2353–2367, 2014. [Google Scholar]
39. M. Y. Tsay, Y. -W. Tseng and T. -I. Wu, “Comprehensiveness and uniqueness of commercial databases and open access systems,” Scientometrics, vol. 121, no. 3, pp. 1323–1338, 2019. [Google Scholar]
40. F. E. Sandnes, “A simple back-of-the-envelope test for self-citations using Google Scholar author profiles,” Scientometrics, vol. 124, no. 2, pp. 1685–1689, 2020. [Google Scholar]
41. A. Furnham, “What I have learned from my Google Scholar and H index,” Scientometrics, vol. 122, no. 2, pp. 1249–1254, 2020. [Google Scholar]
Cite This Article
 Copyright © 2023 The Author(s). Published by Tech Science Press.
This work is licensed under a Creative Commons Attribution 4.0 International License , which permits unrestricted use, distribution, and reproduction in any medium, provided the original work is properly cited.
 Downloads
 Citation Tools