
 Submit a Paper
 Propose a Special lssue
 Open Access
ARTICLE

Visualization for Explanation of Deep Learning-Based Defect Detection Model Using Class Activation Map
1 Center for AI Technology in Construction, Hanyang University ERICA, Ansan, 15588, Korea
2 School of Architecture and Architectural Engineering, Hanyang University ERICA, Ansan, 15588, Korea
3 ICT Convergence Research Division, Korea Expressway Corporation Research Institute, Hwaseong, 18489, Korea
4 Department of Architecture, College of Engineering, Kangwon National University, Samcheok, 25913, Korea
5 Division of Smart Convergence Engineering, Hanyang University ERICA, Ansan, 15588, Korea
* Corresponding Authors: Jungsik Choi. Email: ; Sanghyo Lee. Email:
Computers, Materials & Continua 2023, 75(3), 4753-4766. https://doi.org/10.32604/cmc.2023.038362
Received 09 December 2022; Accepted 13 February 2023; Issue published 29 April 2023
 View Full Text
 Download PDF
Abstract
Recently, convolutional neural network (CNN)-based visual inspection has been developed to detect defects on building surfaces automatically. The CNN model demonstrates remarkable accuracy in image data analysis; however, the predicted results have uncertainty in providing accurate information to users because of the “black box” problem in the deep learning model. Therefore, this study proposes a visual explanation method to overcome the uncertainty limitation of CNN-based defect identification. The visual representative gradient-weights class activation mapping (Grad-CAM) method is adopted to provide visually explainable information. A visualizing evaluation index is proposed to quantitatively analyze visual representations; this index reflects a rough estimate of the concordance rate between the visualized heat map and intended defects. In addition, an ablation study, adopting three-branch combinations with the VGG16, is implemented to identify performance variations by visualizing predicted results. Experiments reveal that the proposed model, combined with hybrid pooling, batch normalization, and multi-attention modules, achieves the best performance with an accuracy of 97.77%, corresponding to an improvement of 2.49% compared with the baseline model. Consequently, this study demonstrates that reliable results from an automatic defect classification model can be provided to an inspector through the visual representation of the predicted results using CNN models.Keywords
Buildings typically deteriorate as they age owing to external environmental factors and inadequate maintenance. Thus, periodic building condition assessment is crucial for preventing deterioration and preserving the health of building structures. Through periodic inspection, maintenance work can be planned based on the current state of building conditions to decelerate building degradation [1,2]. Visual inspection, vital for assessing building conditions, aims to check the exterior conditions of building structures to ensure sustainable maintenance [3,4]. Hence, the types of defects that affecting building conditions must be accurately identified with adequate explanations. However, traditional methods, which are human-oriented periodic visual inspections, require considerable human resources and time. Thus, thoroughly investigating the exterior defects of structures in large buildings and inaccessible environments is challenging using the traditional approach [5].
The convolutional neural network (CNN)-based visual inspection method is widely used to investigate surface defects in concrete structures. Recently, several studies have been conducted to develop alternative methods that can automatically recognize damaged information in images using artificial intelligence techniques. Recent studies using deep learning-based image analysis have demonstrated that the CNN model performs remarkably [6–8]. Multiple studies have reported that the CNN model is a suitable methodology for extracting the various characteristics of structural surfaces from image data. However, the deep learning-based classification model has limitations in providing convincing results when dealing with images, such as compounded defects. The deep learning model only presents predicted results based on probabilistic inference with unknown classification grounds; thus, identifying whether the damage classification result is accurate without the grounds of the output result is challenging. Improper feature extraction during the inference process leads to unintended defect prediction and incorrect building conditions assessment. Consequently, trusting the model’s output results is challenging. Furthermore, the results derived from the CNN-based defect detection models cannot be validated when the ground truth of the model is not provided. Thus, its application for evaluating the condition of building structures presents limitations. To apply the artificial intelligence technology to the automatic diagnosis of building conditions and ensure the credibility of the output information, the results of the CNN-based model must be interpreted accurately.
One way to interpret the prediction results of the CNN model is to visualize activated feature maps. In recent years, gradient-weights class activation mapping (Grad-CAM) [9] has been used extensively as a visualization method to ensure the reliability of predicted results. For instance, Kim et al. [10] used Grad-CAM to understand a steel frame damage detection model intuitively. Liu et al. [11] and Wang et al. [12] used it to highlight cracks and damaged ceilings, respectively. Guo et al. [13] used it to visualize multi-defect classification results, including cracks, blistering, biological growth, spalling, delamination, and peeling. The Grad-CAM visualization approach enables end users to understand the prediction results of the CNN models. Thus, Grad-CAM was used in this study as the visual explanation method to address the limitation of uncertainty in the results of CNN-based defect identification; it presents the activated regions relevant to the predicted results using the gradient information. In addition, herein, an evaluation method for the coincidence between ground truth annotated defects and the results generated by visualization approaches was proposed. The proposed approach can verify deep-learning results by providing visual information to the CNN-based concrete damage classification prediction results. Moreover, it can provide reliable information to inspectors for assessing the appearance of concrete structures. This study contributes to visualizing multi-defects identification using the Grad-CAM approach. Subsequently, an ablation study adopting three-branch combinations to the CNN model with visualizing results and performance variation was performed. Finally, a visualization evaluation index was proposed for the quantitative assessment of defect areas based on the visualized feature maps of the CNN model.
To maintain structural safety and health, the identification and detection of defects on the surface of a structure play a crucial role in regular building inspections. Therefore, defects must be accurately detected and reliable information must be collected to assess building conditions. Computer vision-based inspection approaches using deep learning methods have improved the efficiency and quality of visual inspection. Hence, numerous studies have focused on the automatic detection of defects on concrete surfaces, such as crack detection [14–19] and multi-damage detection [20–22]. For instance, Lei et al. [14] and Yu et al. [15] developed a vision-based concrete crack-detection model, and Zang et al. [16] improved the accuracy of the crack-detection model by applying a progressive loss function in the training phase. Yu et al. [17] proposed an optimized CNN model to improve the accuracy of crack detection in concrete structures. Ali et al. [18] evaluated the performance of several convolutional neural networks and proposed a customized CNN with the best performance for crack detection. Moreover, Kim et al. [19] proposed a CNN-based crack detection model that reduced the computational cost and efficiently trained a deep learning model to detect crack damage. In terms of multi-damage classification and detection, Shin et al. [20] proposed an automatic damage recognition model for multi-damage classification, and Jiang et al. [21] conducted experiments using a deep-learning approach to classify various defects, including cracks, spots, rebar exposure, and spalling damage. Dong et al. [22] proposed multiple defect detection methods for diagnosing tunnel lining damage, such as cracks, spalling, and damage containing both cracks and spalling. Recent research demonstrated that deep learning models can automatically classify and detect several types of damage with satisfactory performance [19–22]. However, most studies focused on proving that the deep learning model accurately recognizes damage. These studies had shortcomings in explaining the results of the prediction; essentially, when the model presents an unexpected output, they offered no explanation for the unexpected outcomes. Additionally, they did not clarify how the model predicts the outcome accurately. Consequently, even if a high-accuracy model is presented to the user, the user’s complete trust in the deep learning model is limited.
To overcome these limitations, visualization techniques, which can identify the reliability of CNN-based model results using gradient feature vectors, have been developed to intuitively understand the localization of intended defects. For instance, Simonyan et al. [23] computed the partial location of an object using weakly supervised class saliency maps to visualize a large-scale visual recognition dataset classification. Babiker et al. [24] visualized the VGG16 network predictions and compared them with those of other interpretation approaches. Selvaraju et al. [9] proposed the Grad-CAM visualization method using gradient weight, emphasizing the location of the expected portions of the target image with heatmaps. Grad-CAM has the benefit that it does not need to reform the integrating layers with visual feature mapping. Therefore, in this study, Grad-CAM was adopted to visualize defect identification.
Liu et al. [11] proposed a UNet-based visual explanation model to interpret the crack detection model using Grad-CAM. They demonstrated a transparent UNet-based model combining several encoder networks, such as VGG, ResNet, DenseNet, EfficientNet, InceptionNet, and MobileNet, for crack detection. The results revealed that the model combined with the VGG model performs the best in terms of prediction and explanation. However, only crack detection was implemented, and other defects were not considered. Guo et al. [13] adopted Grad-CAM to visualize the learned features of the proposed model with various defects, such as peeling, cracks, and delamination. The visual expression highlights the target object in the images with the classification of defect types. Although these approaches demonstrate that the visualization method can explain convolution-based networks, they do not have a quantitative evaluation of visualizing the output of the approach. In addition, comparing the variation between customized CNN models that are refined using various branches, such as attention networks, has limits. Thus, to achieve both visualizing predicted defects according to several refined models and quantitative evaluation of the results, a weakly visualizing evaluation index (VEI) and several refined VGG16 models that explain the regions of defect features using Grad-CAM are proposed.
This study explored several classification models based on the concrete multi-damage recognition model proposed in a previous study [20] and applied a visualization method to identify representative features in concrete damage images. To explain the results of the trained model, the Grad-CAM visualization technique [9] was applied to the extracted feature maps of each model. In addition, the effect of additional layers on performance was examined by investigating the behavior of the feature maps based on the modules attached to the CNN model through visualization. An ablation study was conducted using various alternative models to verify the performance of the trained model. Additionally, the changes in performance and feature maps were examined by visualizing the results of each experiment.
3.1 Visualization of Damage Recognition
The feature map visualization technique Grad-CAM [9] was used to visualize the damage recognition results from the CNN-based prediction models and confirm the reliability of the results. Because convolutional features in the CNN model contain spatial information, the regions of interest for features can be determined by visualizing the gradient information. Grad-CAM visualization explains feature extraction by establishing appropriate prediction interpretability from a neural network.
Fig. 1 shows examples of how gradient information determines the damage class. The representative neurons or features are the most influential in decision-making when recognizing input image data. Grad-CAM can supplement the explanatory interpretation of automated decisions.
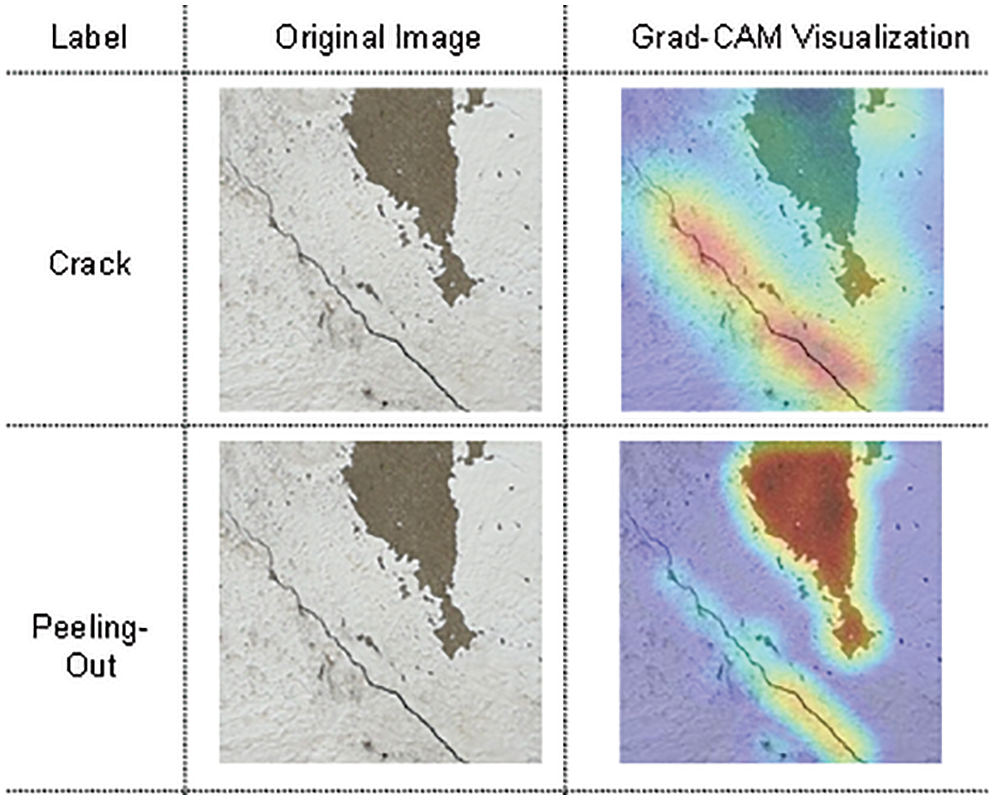
Figure 1: Example of Grad-CAM output based on prediction results
To obtain a class discriminative localization map, representative feature maps were extracted from the pre-trained weights for the target damage class. Subsequently these feature maps were spatially pooled using gradient information to obtain the weight (
After the calculated
Fig. 2 shows the visualization process of the extracted feature maps using gradients and the heatmap method. Fig. 3 shows the feature extraction and visualization of the operation process from the concrete damage recognition model. The first step is to generate an input dataset for training the CNN model. Subsequently, several models combined with auxiliary layers, such as batch normalization (BN), hybrid pooling (HP) layers, and attention modules, are explored. Next, the trained model predicts concrete multi-defects and transfers them to the Grad-CAM visualization engine. In Grad-CAM implementation, activated feature maps are extracted from the optimized CNN model. Subsequently, a heatmap is used to visualize the focused regions of defects on the feature map. The results show a rough visualization of the heatmap of the convolutional feature map. Finally, the visualized map is evaluated using the VEI calculator.
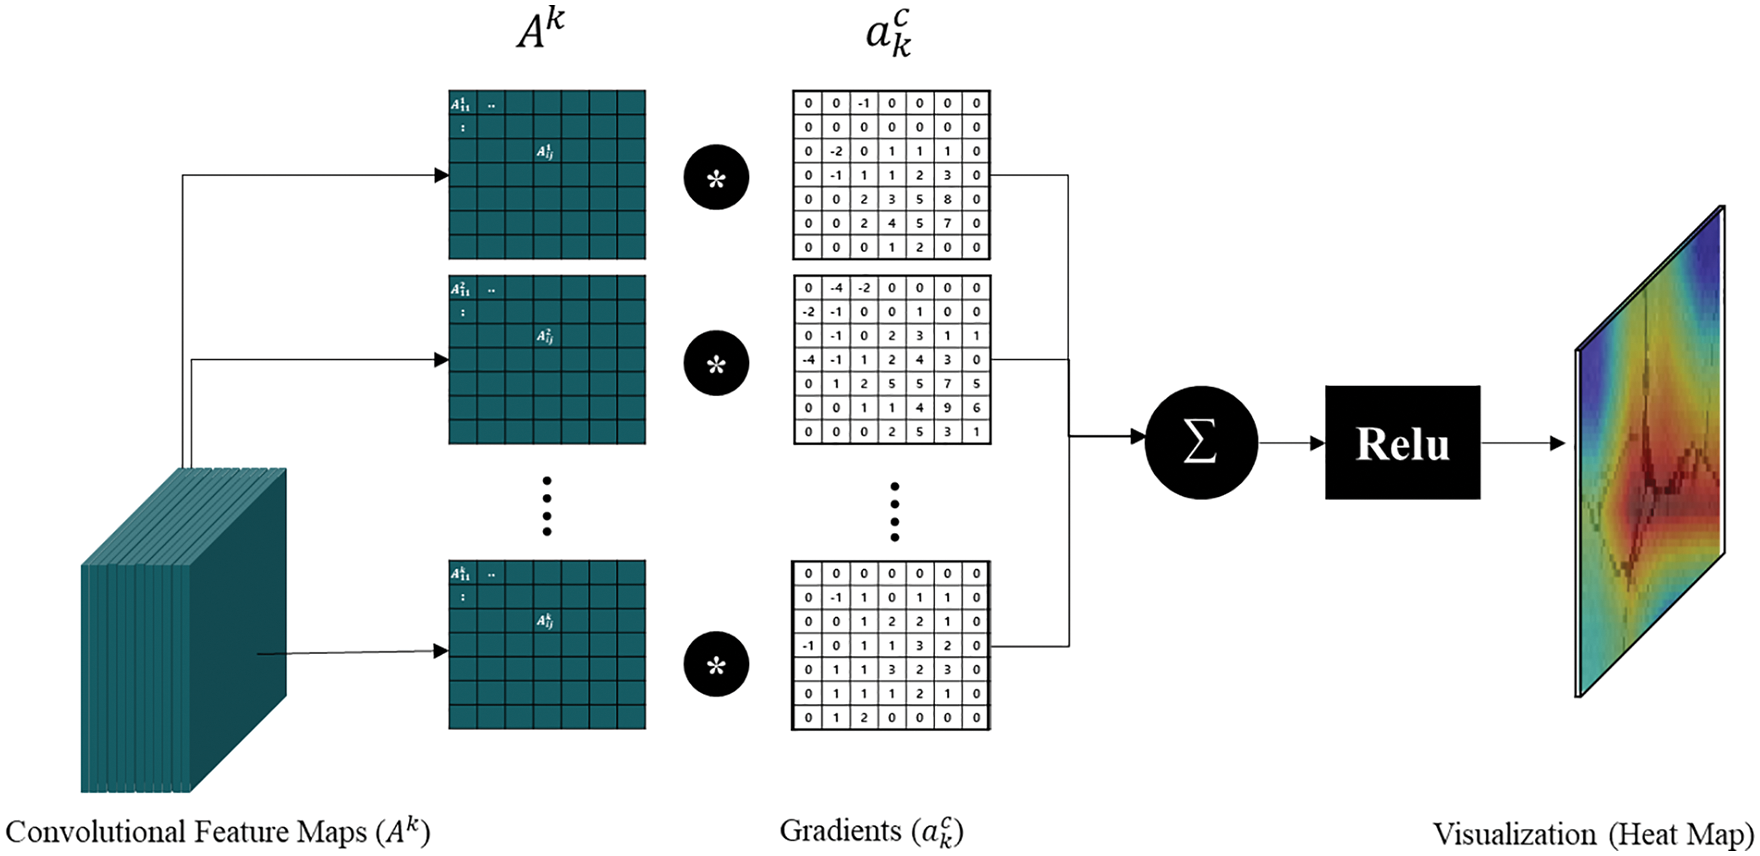
Figure 2: Schematic of visualization method
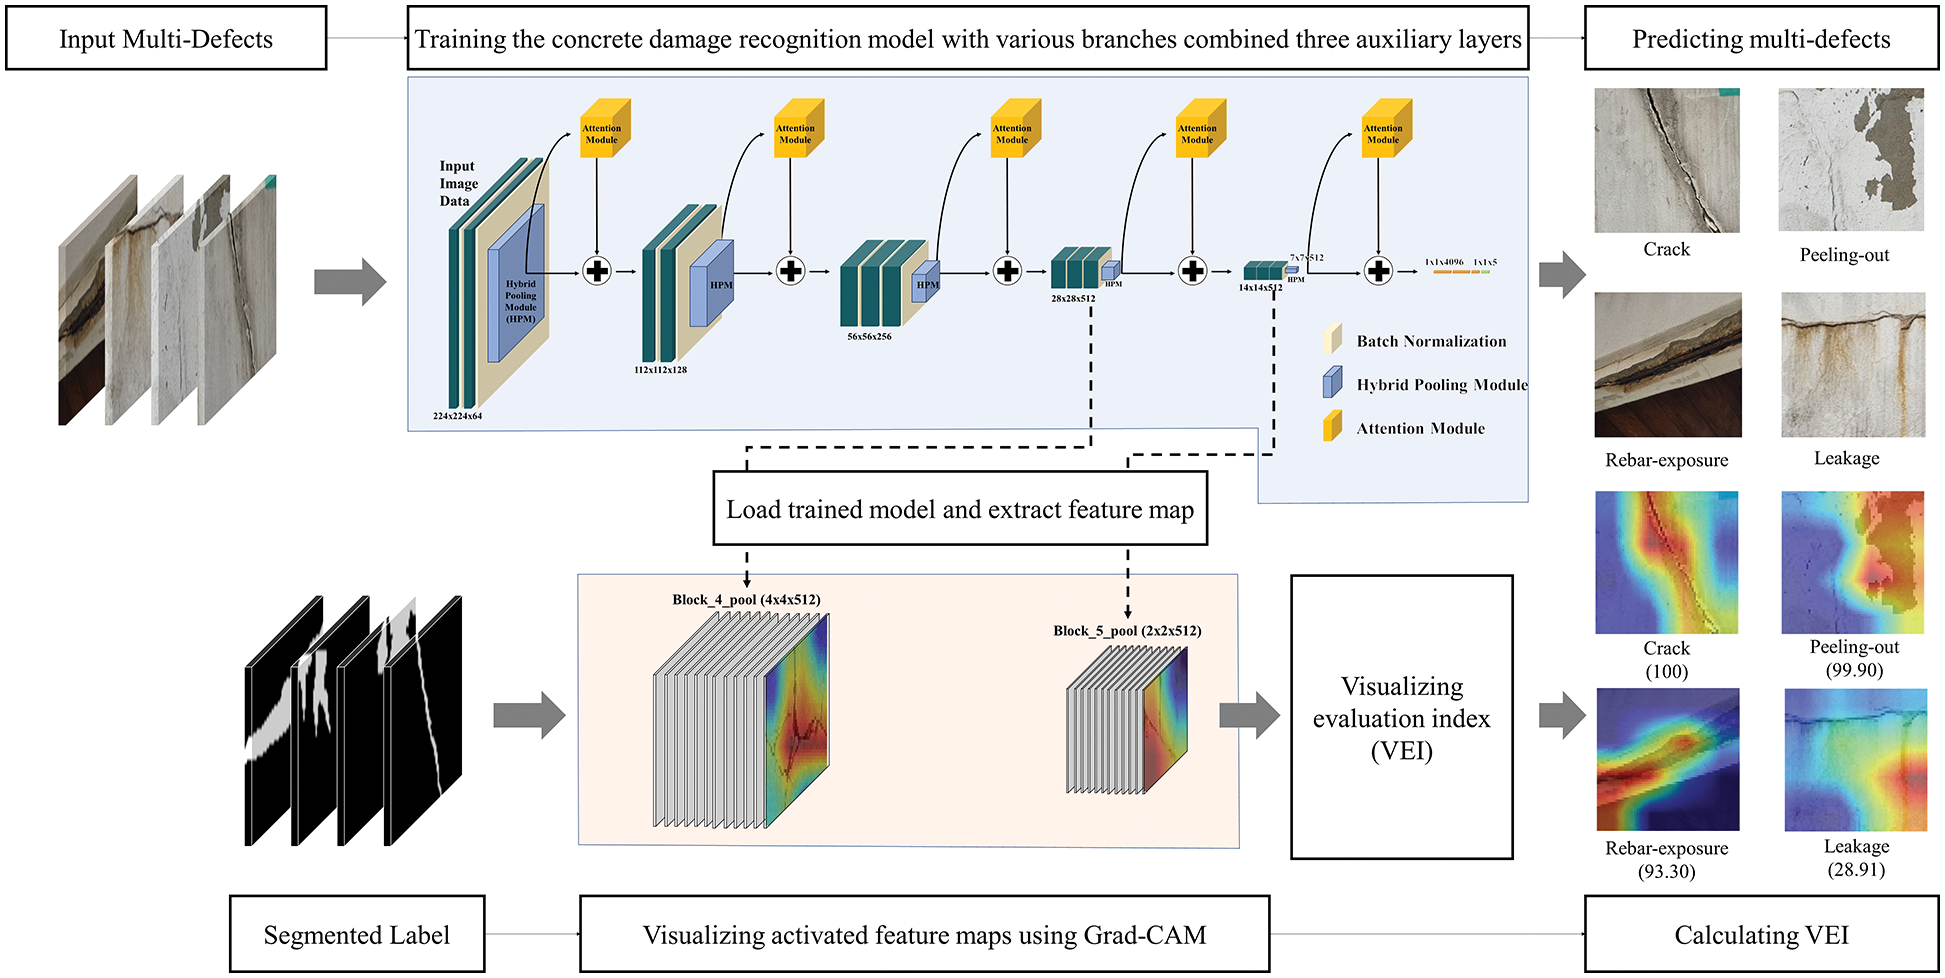
Figure 3: Feature extraction and visualizing operation process from concrete damage-recognition model
An ablation study identifies the contributions of various strategies that affect model performance by removing the layers or modules used in the proposed method. The convolution-based concrete multi-damage recognition neural network [20] used in this study contains various auxiliary layers and modules, such as the BN layer, HP layer, and attention network modules. Whether all three strategies directly improve the deep convolutional neural network or whether the proposed model correctly detects concrete damage from the images is currently unknown. To demonstrate the effectiveness of the various strategies, several experiments were conducted herein using a concrete damage-recognition model. The following section describes the experimental setup and presents the test results.
This section describes the data acquisition procedure used to establish the dataset of concrete damage images. First, the target classes were defined based on the type of damage on the surface of deteriorated concrete structures. Data categories must be established to develop an automatic concrete damage classification and recognition model. Next, a concrete damage database was generated using images of various types of damage obtained using an unmanned aerial vehicle (resolution, 5472 × 3648) and digital cameras (resolution, 4032 × 3024). Subsequently, the amount of image data was increased using a data-augmentation technique to prevent overfitting during training and improve the performance and accuracy of the model. Finally, the dataset was segmented into training and validation data to train the model, and test data were used to verify the performance of the optimized model.
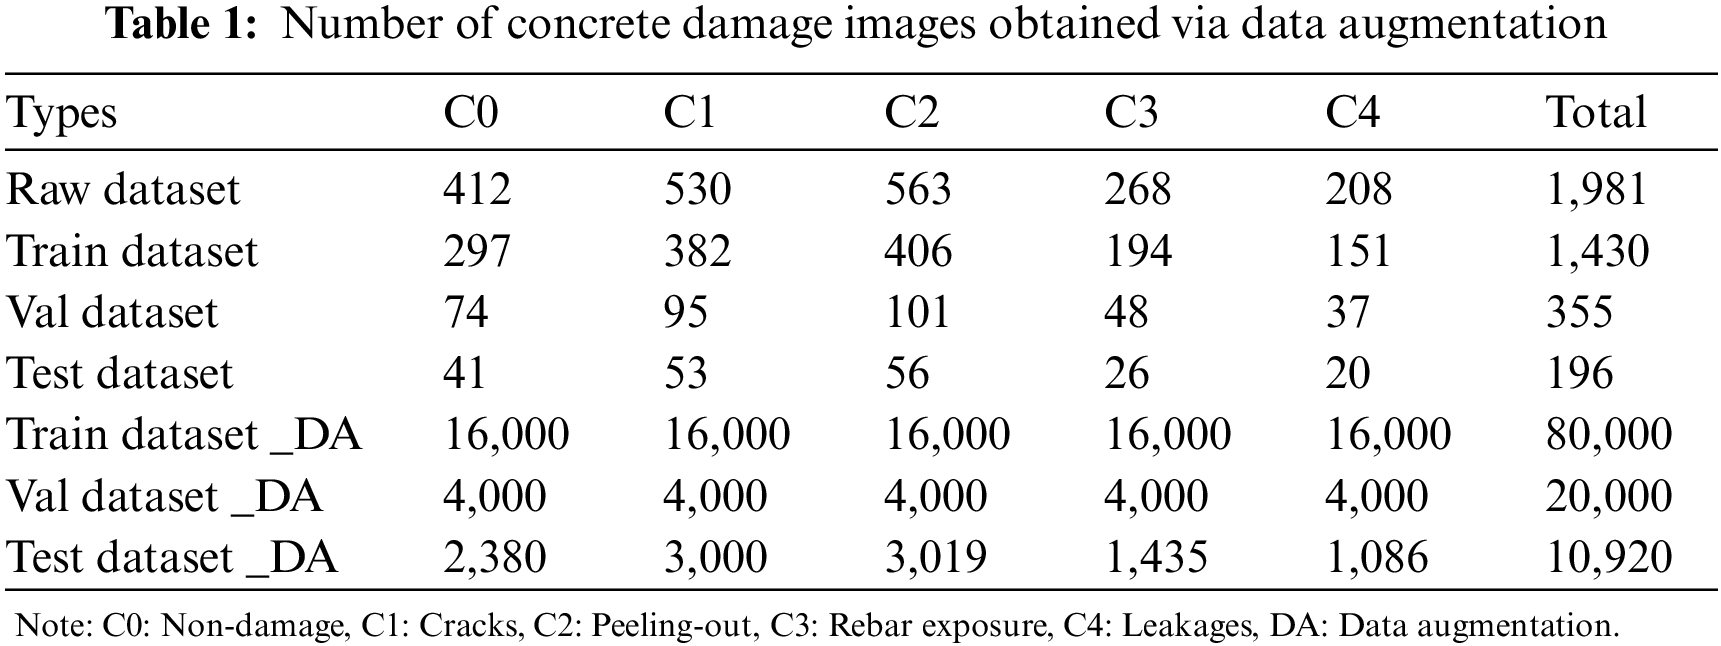
In this study, the types of defects on the concrete surface (i.e., cracks, leakages, peeling-out, and rebar exposure), including the nondamaged type, were defined. A total of 1981 high-resolution images were collected using an unmanned aerial vehicle and digital camera. The datasets were set to a ratio of 1430 to 355 (the training and validation data together constituted approximately 90% of the total dataset), whereas the remaining 196 images (10%) were used as a test dataset. The high-resolution image was resized to a minimum-resolution image (64 × 64), which was adopted by the VGG16 model to reduce the computational cost. For better training and performance of the CNN, a data augmentation strategy, such as horizontal and vertical flipping, rotation invariance, random brightness, and image cropping, was applied [27]. However, for the test dataset, only horizontal flipping with random cropping was applied because the test dataset must be set in an equivalent form to the actual environment. The augmented training, validation, and test datasets for the concrete defects are presented in Table 1.
This section describes the experimental settings for investigating the results of several models connected to the branches using various strategies. For this portion of the study, a CNN model based on the VGG16 [28] was used as the baseline model. First, simple auxiliary layer-combined models [20] including BN, HP, single attention (AT_S), and multi-attention modules (AT_M) were examined using a 64 × 64 image dataset. All the training stages adopted the same data augmentation strategies. The optimizer used in the training process was an adaptive moment estimation with a learning rate of 10−4 [29]. Network training was implemented for 440 K iterations with 10 K epochs, and the trained weights were recorded at 0.5, 1, 2, and 10 K epochs. The best performance weights were obtained by monitoring the lowest validation loss.
The following four metrics were used to assess the model performance.
where “true positive” implies that the actual and predicted positive values match, and “true negative” implies that the actual and predicted negative values match; essentially, they indicate the number of correctly predicted classes that constitute the entire class. For the assessment of the visual result map, a weak VEI was proposed, as shown in Eq. (7).
This formula calculates the index by comparing the segmented labeled ground truth (
where
5.1 Results of Ablation Experiments
Table 2 summarizes the test accuracies based on the best performance weights. Compared with the baseline VGG16 model, the proposed models demonstrated improvements, except for some networks. The VGG16_HP model, which alternated from the max-pooling layer to the HP layer, exhibited performance improvement. The average pooling layer was speculated to prevent feature elimination via max-pooling operations. Conversely, the BN-applied models improved the accuracy and afforded faster convergence to optimization compared with the other models. As indicated in the table, the BN + HP model performed better than the baseline VGG16 model. By contrast, the combination of the HP and attention network block performed worse than the baseline model. The performance was speculated to decrease because the average pooling applied to the HP conflicted with the attention network based on the representative features. Hence, a BN layer was added to the concrete damage recognition model to reduce the weight variance during the training process, from which the best performance was achieved. Based on the above results, a method to increase the accuracy of the concrete recognition model using CNN architecture by applying various auxiliary methods was investigated. An attention mechanism was applied to learn the features extracted from an image intensively. The proposed model was excellent for identifying the representative features of damaged images. Fig. 4 presents the confusion matrix for the best-performing model.
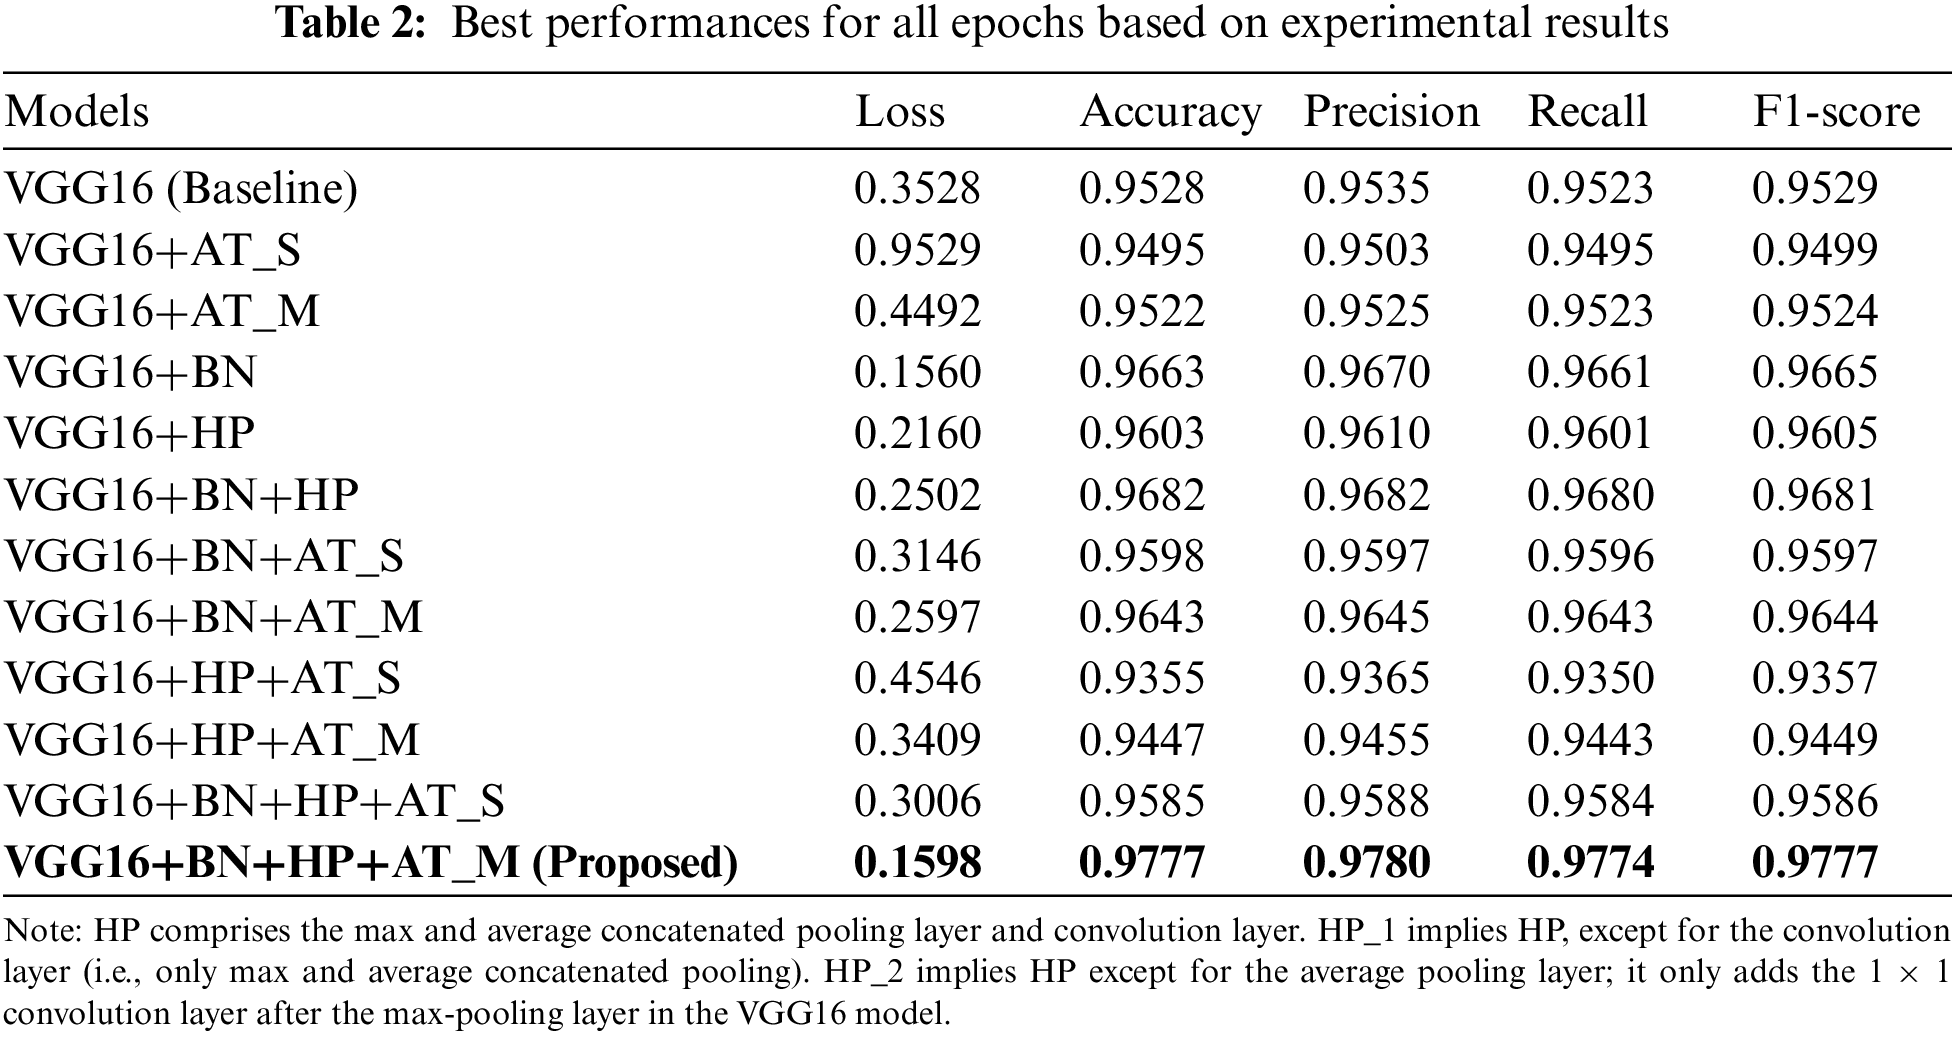
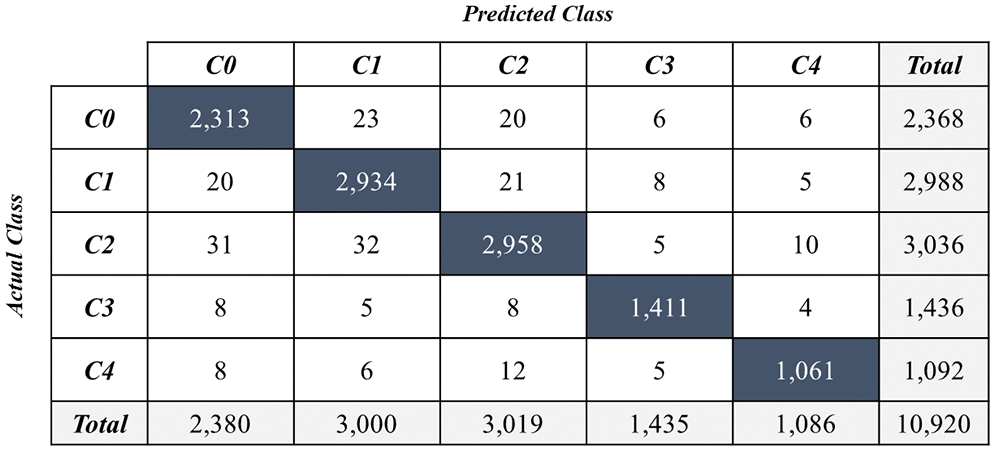
Figure 4: Confusion matrix of the experimental results from the best performance model
5.2 Visualization for Explaining Defect Detection
To demonstrate whether the extracted feature maps can help in distinguishing between damage classes, Grad-CAM visualization was performed using pre-trained weight variables. Fig. 5 shows the visualization results and VEI of the features extracted from the concrete damage recognition model. The heat map expressed based on Grad-CAM provided the basis for the prediction results. Evidently, for the models with an accuracy exceeding 0.96, feature maps were generated at the damage location shown in the image, thus indicating accurate prediction results. The VEI could assess the coincidence of the defect area between the ground truth, which is the expected result, and the visual representative map.
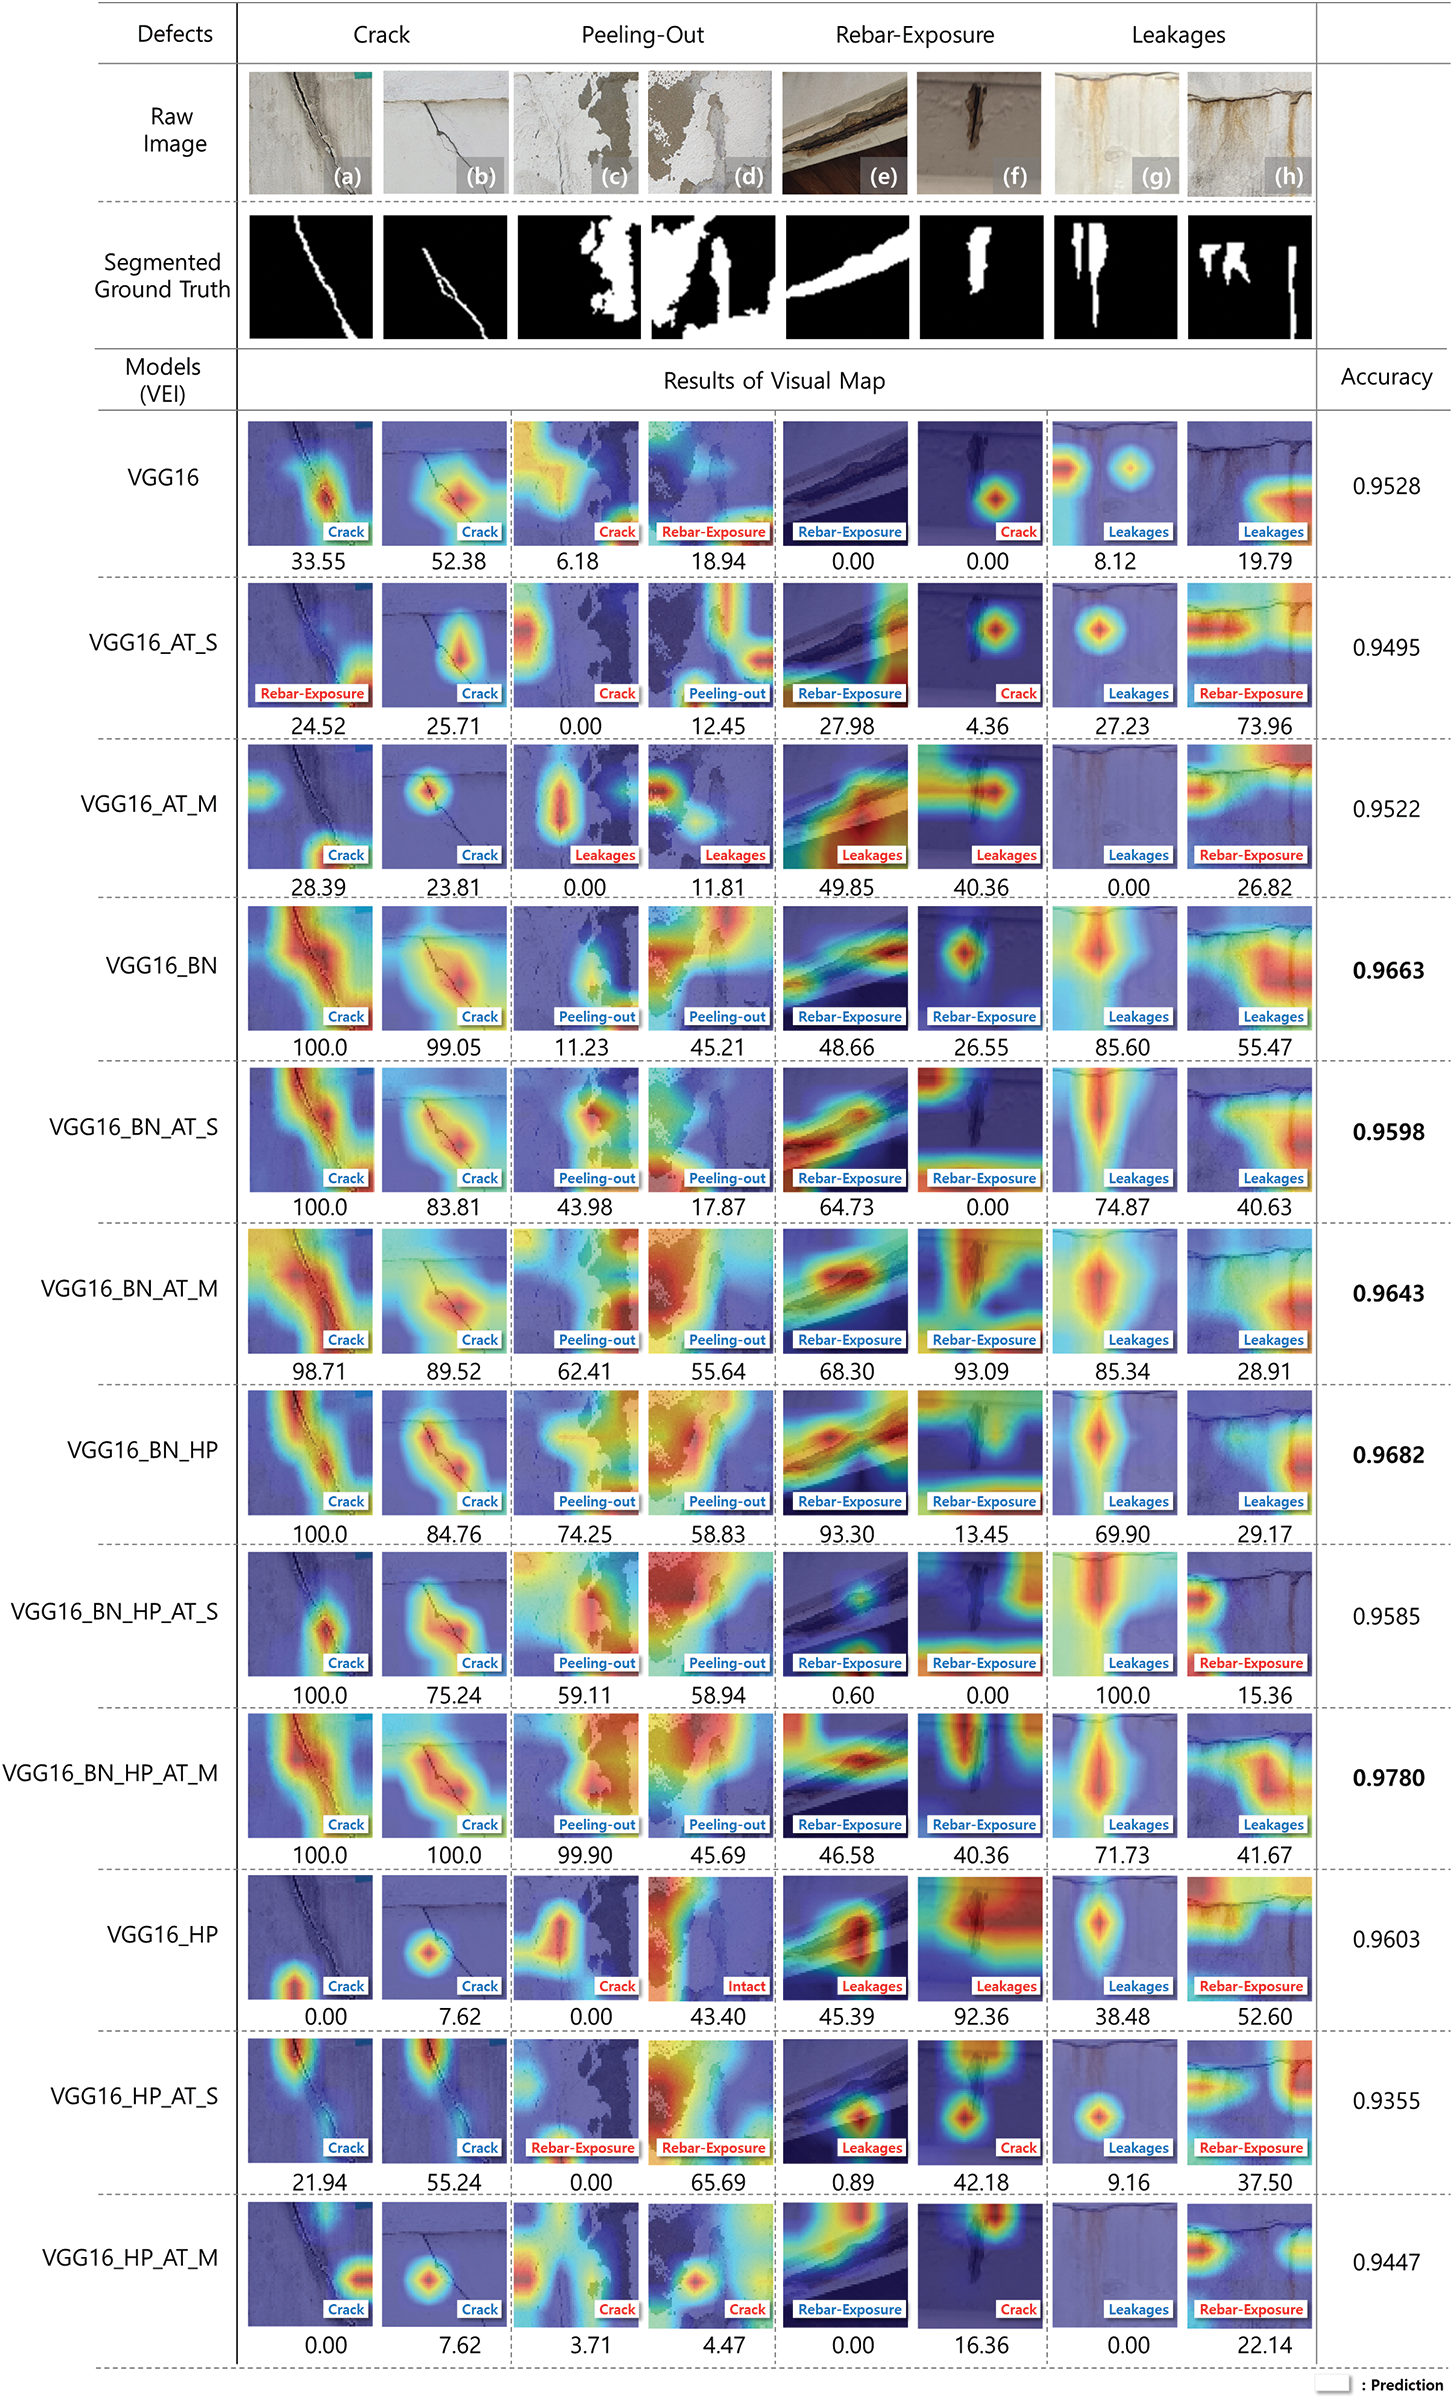
Figure 5: Extracted representative features in concrete damage images obtained using the Grad-CAM visualization method. Blue label indicates a match between true and predicted damage types, whereas red label indicates that the predicted results differ from the true damage type. VEI is the visual evaluation index
However, when the heat maps of the models (VGG16, VGG+AT_S, and VGG16+HP) exhibited misclassification in the peeling-out image, that is, Fig. 5c, a fine line was focused instead of peeling out to predict the cracks. Model VGG16+AT_M was misjudged as leakage owing to the vertical feature map of the image. By visualizing the experimental results of the model by combining various modules, the model in which BN was applied was confirmed to activate the damaged area more significantly. Moreover, compared with the single-attention module, when multi-attention was applied, the features were more evenly distributed and analyzed for multiple damage types.
The visualization results can be divided into four types: good prediction and good visual representation (Type A), good prediction but bad visual representation (Type B), wrong prediction and bad visual representation (Type C), and wrong prediction but good visual representation (Type D).
In the case of Type A, the heap map shape was formed in the part where the damage appeared, and an accurate prediction result was displayed. In the case of cracks and leakages, evidently, the heat map was formed according to the location and shape of cracks and leakages. Peeling and rebar exposure were emphasized throughout the damaged area.
By contrast, for Type B, although the model predicted the correct result, the location of the heat map was concentrated in the background rather than in the location of the damage. This could be interpreted as a case in which the model cannot extract meaningful features from the image because of insufficient learning but randomly outputs the correct answer. Thus, the results from Type B were described as a “random answer”. This “random answer” state renders difficulty in achieving repeatability in the model output when analyzing images similar to the corresponding type; therefore, sufficient model training is required.
Type C exhibited incorrect predictions and poor visual representation. Evidently from Fig. 6h, the heat map was extracted vertically along the line, which can be considered a case of misunderstanding leakage.

Figure 6: Four types of visualization results
By contrast, as in Type D, the intended correct answer was peeling-out; however, it was a case where the model found microcracks in the image, extracted features accurately, and predicted cracks. Moreover, even if the correct answer is different from the model developer’s intended answer, that is, even if an incorrect answer was extracted, if the other types displayed on the image are accurately predicted, this can provide helpful information to the user. Consequently, using the visual technique, the manners in which the model analyzes and predicts the results, and explores the intended target in the image according to the performance change were confirmed.
In recent decades, numerous efforts have been made for the efficient visual inspection of old buildings. Several methods have been proposed for inspecting the exterior of buildings using image information. In particular, deep learning-based damage analysis, which specializes in image analysis, has laid the foundation for automatically performing existing human-based tasks. However, deep learning-based image analysis has limitations in obtaining complete trust from users because the model does not provide a basis for the predicted results. This implies that the analysis process of the deep-learning model is limited in providing explanations to users because it consists of the “black box.” Therefore, to solve this problem, this study explored a way to provide explanatory properties to deep learning models using visualization techniques and presented the basis of model prediction results to users.
In this study, various CNN models that can automatically classify concrete damage types were investigated. Four types of damage (cracks, peeling-out, rebar exposure, and leakages) were established and the VGG16 was set as the baseline model. Subsequently, an ablation study was conducted to examine the performance change of the refined models based on the connection of various additional modules. Three different modules (BN, HP, and attention) were used in the experiments. Various modules were applied to the baseline model, and the corresponding changes in performance were analyzed. Evidently, the model combined with the HP, BN, and multi-attention modules achieved the best performance, with an accuracy of 97.77%, corresponding to an improvement of 2.49% compared with the baseline model.
The Grad-CAM visualization technique was applied to visually confirm the performance change of the model through the ablation study. The expression of the feature map using visual techniques was presented as a heat map to visualize the pattern of the type of intended defect. In addition, the VEI was proposed to assess the visual map coincidence with the defect area. This index can estimate the approximate visual map precision for the target objects in the visualization model. Evidently, the better the model performance, the more the number of heat maps generated in the damaged area; whereas the lower the model performance, the more the number of misclassifications and feature map patterns or locations expressed in a form different from the intended damage. Notably, heat maps were not generated in several cases despite accurate classification results. Although this did not affect the model performance, these cases signify the need for a visually representative map for the reliability of the deep learning-based models.
This study has some limitations that should be addressed in future work. First, to interpret the deep-learning results using visualization techniques, the image size used in this study was 64 × 64 pixels. However, as the model deepens, the size of the feature map becomes smaller; therefore, visualization and interpretation limits existed. Second, the variety of image resolutions was less; thus, more experiments using several image sizes must be conducted in future work. In addition, because the type of deep learning model used was based on VGG, comparison with other models was challenging. In future research, visualization techniques must be applied to more diverse models, such as ResNet, Inception, EfficientNet, and GAN-based deep learning models. Additionally, a method must be explored to analyze the feature map in more detail using a method to analyze a larger image. An alternative method is to increase the size of the analyzed image by using the upsampling technique applied to the segmentation model and conducting a study to express the feature map visually.
Acknowledgement: The authors would like to thank the Ministry of Land, Infrastructure and Transport of the Korean government for funding this research project.
Funding Statement: This work was supported by a Korea Agency for Infrastructure Technology Advancement (KAIA) grant funded by the Ministry of Land, Infrastructure, and Transport (Grant 22CTAP-C163951-02).
Conflicts of Interest: The authors declare that they have no conflicts of interest to report regarding the present study.
References
1. A. Silva and J. de Brito, “Do we need a buildings’ inspection, diagnosis and service life prediction software?,” Journal of Building Engineering, vol. 22, no. 4, pp. 335–348, 2019. [Google Scholar]
2. F. Faqih and T. Zayed, “Defect-based building condition assessment,” Building and Environment, vol. 191, no. 107575, pp. 1–16, 2021. [Google Scholar]
3. N. Wang, Q. Zhao, S. Li, X. Zhao and P. Zhao, “Damage classification for masonry historic structures using convolutional neural networks based on still images,” Computer-Aided Civil and Infrastructure Engineering, vol. 33, no. 12, pp. 1073–1089, 2018. [Google Scholar]
4. S. Li, X. Zhao and G. Zhou, “Automatic pixel-level multiple damage detection of concrete structure using fully convolutional network,” Computer-Aided Civil and Infrastructure Engineering, vol. 34, no. 7, pp. 616–634, 2019. [Google Scholar]
5. P. V. Paulo, F. Branco and J. de Brito, “BuildingsLife: A building management system,” Structure and Infrastructure Engineering, vol. 10, no. 3, pp. 388–397, 2014. [Google Scholar]
6. Y. Lin, Z. Nie and H. Ma, “Structural damage detection with automatic feature-extraction through deep learning,” Computer-Aided Civil and Infrastructure Engineering, vol. 32, no. 12, pp. 1025–1046, 2017. [Google Scholar]
7. X. Yang, H. Li, Y. Yu, X. Luo, T. Huang et al., “Automatic pixel-level crack detection and measurement using fully convolutional network,” Computer-Aided Civil and Infrastructure Engineering, vol. 33, no. 12, pp. 1090–1109, 2018. [Google Scholar]
8. R. S. Rajadurai and S. T. Kang, “Automated vision-based crack detection on concrete surfaces using deep learning,” Applied Sciences (Switzerland), vol. 11, no. 11, pp. 1–13, 2021. [Google Scholar]
9. R. R. Selvaraju, M. Cogswell, A. Das, R. Vedantam, D. Parikh et al., “Grad-CAM: Visual explanations from deep networks via gradient-based localization,” International Journal of Computer Vision, vol. 128, no. 2, pp. 336–359, 2020. [Google Scholar]
10. B. Kim, N. Yuvaraj, H. W. Park, K. R. S. Preethaa, R. A. Pandian et al., “Investigation of steel frame damage based on computer vision and deep learning,” Automation in Construction, vol. 132, no. 103941, pp. 1–14, 2021. [Google Scholar]
11. F. Liu and L. Wang, “UNet-based model for crack detection integrating visual explanations,” Construction and Building Materials, vol. 322, no. 126265, pp. 1–13, 2022. [Google Scholar]
12. L. Wang, K. I. Kawaguchi and P. Wang, “Damaged ceiling detection and localization in large-span structures using convolutional neural networks,” Automation in Construction, vol. 116, no. 103230, pp. 1–11, 2020. [Google Scholar]
13. J. Guo, Q. Wang and Y. Li, “Semi-supervised learning based on convolutional neural network and uncertainty filter for façade defects classification,” Computer-Aided Civil and Infrastructure Engineering, vol. 36, no. 3, pp. 302–317, 2021. [Google Scholar]
14. B. Lei, Y. Ren, N. Wang, L. Huo and G. Song, “Design of a new low-cost unmanned aerial vehicle and vision-based concrete crack inspection method,” Structural Health Monitoring, vol. 19, no. 6, pp. 1871–1883, 2020. [Google Scholar]
15. Y. Yu, B. Samali, M. Rashidi, M. Mohammadi, T. N. Nguyen et al., “Vision-based concrete crack detection using a hybrid framework considering noise effect,” Journal of Building Engineering, vol. 61, no. 105246, pp. 1–37, 2022. [Google Scholar]
16. Y. Zhang and K. V. Yuen, “Crack detection using fusion features-based broad learning system and image processing,” Computer-Aided Civil and Infrastructure Engineering, vol. 36, no. 12, pp. 1568–1584, 2021. [Google Scholar]
17. Y. Yu, M. Rashidi, B. Samali, M. Mohammadi, T. N. Nguyen et al., “Crack detection of concrete structures using deep convolutional neural networks optimized by enhanced chicken swarm algorithm,” Structural Health Monitoring, vol. 21, no. 5, pp. 2244–2263, 2022. [Google Scholar]
18. L. Ali, F. Alnajjar, H. A. Jassmi, M. Gochoo, W. Khan et al., “Performance evaluation of deep CNN-based crack detection and localization techniques for concrete structures,” Sensors, vol. 21, no. 5, pp. 1–22, 2021. [Google Scholar]
19. B. Kim, N. Yuvaraj, K. R. S. Preethaa and R. A. Pandian, “Surface crack detection using deep learning with shallow CNN architecture for enhanced computation,” Neural Computing and Applications, vol. 33, no. 15, pp. 9289–9305, 2021. [Google Scholar]
20. H. K. Shin, Y. H. Ahn, S. H. Lee and H. Y. Kim, “Automatic concrete damage recognition using multi-level attention convolutional neural network,” Materials, vol. 13, no. 23, pp. 1–13, 2020. [Google Scholar]
21. Y. Jiang, D. Pang and C. Li, “A deep learning approach for fast detection and classification of concrete damage,” Automation in Construction, vol. 128, no. 103785, pp. 1–12, 2021. [Google Scholar]
22. Y. Dong, J. Wang, Z. Wang, X. Zhang, Y. Gao et al., “A deep-learning-based multiple defect detection method for tunnel lining damages,” IEEE Access, vol. 7, pp. 182643–182657, 2019. [Google Scholar]
23. K. Simonyan, A. Vedaldi and A. Zisserman, “Deep inside convolutional networks: Visualising image classification models and saliency maps,” arXiv preprint arXiv:1312.6034, 2014. [Google Scholar]
24. H. K. B. Babiker and R. Goebel, “An introduction to deep visual explanation,” arXiv preprint arXiv:1711.09482, 2017. [Google Scholar]
25. A. F. Agarap, “Deep learning using Rectified Linear Units (ReLU),” arXiv preprint arXiv:1803.08375, 2018. [Google Scholar]
26. B. Zhou, A. Khosla, A. Lapedriza, A. Oliva and A. Torralba, “Learning deep features for discriminative localization,” in Proc. of the IEEE Computer Society Conf. on Computer Vision and Pattern Recognition, Las Vegas, NV, USA, pp. 2921–2929, 2016. [Google Scholar]
27. A. Krizhevsky, I. Sutskever and G. E. Hinton, “ImageNet classification with deep convolutional neural networks,” Communications of the ACM, vol. 60, no. 6, pp. 84–90, 2017. [Google Scholar]
28. K. Simonyan and A. Zisserman, “Very deep convolutional networks for large-scale image recognition,” arXiv preprint arXiv:1409.1556, 2015. [Google Scholar]
29. D. P. Kingma and J. L. Ba, “Adam: A method for stochastic optimization,” arXiv preprint arXiv:1412.6980, 2015. [Google Scholar]
Cite This Article
 Copyright © 2023 The Author(s). Published by Tech Science Press.
This work is licensed under a Creative Commons Attribution 4.0 International License , which permits unrestricted use, distribution, and reproduction in any medium, provided the original work is properly cited.
 Downloads
 Citation Tools