
 Submit a Paper
 Propose a Special lssue
 Open Access
ARTICLE

A Novel Multi-Stage Bispectral Deep Learning Method for Protein Family Classification
Biomedical Systems and Informatics Engineering Department, Hijjawi Faculty for Engineering Technology, Yarmouk University, Irbid, 21163, Jordan
* Corresponding Author: Amjed Al Fahoum. Email:
(This article belongs to the Special Issue: Intelligent Computational Models based on Machine Learning and Deep Learning for Diagnosis System)
Computers, Materials & Continua 2023, 76(1), 1173-1193. https://doi.org/10.32604/cmc.2023.038304
Received 07 December 2022; Accepted 17 April 2023; Issue published 08 June 2023
 View Full Text
 Download PDF
Abstract
Complex proteins are needed for many biological activities. Folding amino acid chains reveals their properties and functions. They support healthy tissue structure, physiology, and homeostasis. Precision medicine and treatments require quantitative protein identification and function. Despite technical advances and protein sequence data exploration, bioinformatics’ “basic structure” problem—the automatic deduction of a protein’s properties from its amino acid sequence—remains unsolved. Protein function inference from amino acid sequences is the main biological data challenge. This study analyzes whether raw sequencing can characterize biological facts. A massive corpus of protein sequences and the Globin-like superfamily’s related protein families generate a solid vector representation. A coding technique for each sequence in each family was devised using two representations to identify each amino acid precisely. A bispectral analysis converts encoded protein numerical sequences into images for better protein sequence and family discrimination. Training and validation employed 70% of the dataset, while 30% was used for testing. This paper examined the performance of multistage deep learning models for differentiating between sixteen protein families after encoding and representing each encoded sequence by a higher spectral representation image (Bispectrum). Cascading minimized false positive and negative cases in all phases. The initial stage focused on two classes (six groups and ten groups). The subsequent stages focused on the few classes almost accurately separated in the first stage and decreased the overlapping cases between families that appeared in single-stage deep learning classification. The single-stage technique had 64.2% +/− 22.8% accuracy, 63.3% +/− 17.1% precision, and a 63.2% +/19.4% F1-score. The two-stage technique yielded 92.2% +/− 4.9% accuracy, 92.7% +/− 7.0% precision, and a 92.3% +/− 5.0% F1-score. This work provides balanced, reliable, and precise forecasts for all families in all measures. It ensured that the new model was resilient to family variances and provided high-scoring results.Keywords
An amino acid is analogous to a word, while a protein sequence is analogous to a book and a motif to a sentence. The link between the sequences would give higher-level knowledge about the physical structure’s functional characteristics if it were scooped. In biomolecular research, scientists attempt to identify the amino acid residues that give each protein family its distinct characteristics. In this method, scientists classify groups of proteins with similar functions as “protein families.”
In contrast to recognized proteins, however, uncharacterized proteins must be identified and classified in various bioinformatics domains. In this method, scientists represent protein families as activity-related clusters. In different fields of bioinformatics study, however, uncharacterized proteins still need to be fully discovered or accurately classified. Consequently, determining ways to arrange proteins and utilize their functions to exhibit their understanding of physicochemical processes is a significant issue in applied research [1–4]. Classifying protein sequences requires manually extracting discrete or continuous properties using engineering-related approaches. Then, standard machine learning (ML) approaches are used to identify how the features of the retrieved hidden patterns will behave. Unsupervised learning is a traditional ML method for constructing clusters and assigning labels to each cluster. Another popular strategy for identifying common patterns in protein sequences is matching genetic traits to protein sequence s. However, this widespread motif comparison method relies on biological professionals and domain specialists for functional motif identification [5,6]. Modifying the protein’s cell sequence requires research into the protein’s primary function. The technique then calculates the total number of variables [7] by generating a generalized series of Gaussian process regression. By training the sequencing data of numerous proteins, it is possible to improve the accuracy and outcomes of functional analysis [8].
In [9], the authors applied the Resonant Recognition Model (RRM) to the hormone Prolactin (PRL) to identify resonant frequencies, predict functionally relevant amino acids or “hot spots” in the protein sequence, and compare them to the amino acids suggested by the majority of researchers based on their research. Certain light frequencies can initiate or influence biological processes. Among the frequency-specific effects of light on protein activation [10] is electromagnetic irradiation. Protein interactions are based on electromagnetic energy transmission in the infrared and visible light ranges, according to the RRM. All proteins consist of linear sequences of constituent elements (amino acids). The RRM model uses spectral and space-frequency analysis to analyze linear data. The range of free electron energies interacting with proteins governs protein activity (interaction). Charges traveling through the protein backbone and traversing the various energy levels created by amino acid side groups may create favorable conditions for the emission or absorption of specific electromagnetic radiation. These findings demonstrate that protein interactions depend on the transfer of electromagnetic energy between interacting molecules at a specific frequency for each function/interaction [10]. The sequence metric problem is addressed in [11] through multivariate statistical analyses of several amino acid characteristics. Several numeric values are generated by factor analysis to account for substantial and interpretable amino acid variation. This strategy simplifies the analysis of sequence data. This method generates scores that can be used in numerous studies [12]. It aimed to reveal the latent structure of multidimensional amino acid attribute data, describe the primary patterns of interpretable covariation among these attributes, and investigate the distinct causal components of multivariate attribute variation. They described the RRM and Informational Spectrum Method (ISM) in [13]. One of more than 600 amino acid characteristics and two plasmodial peptides (P18 and P32) exemplify these processes [14]. The two plasmodial peptides (P18 and P32) were given numerically so that their roles could be examined [12]. Currently, protein function and structure are predicted in bioinformatics using ML [13]. Support vector machines, decision trees, and other machine learning algorithms accept vectors of integers as inputs. Encoding converts protein sequences into vectors of numbers. The “Protein Encoding” Matlab package was developed to encode protein sequences into numerical vectors for bioinformatics; the “Protein Encoding” Matlab package was developed [13]. The toolkit is user-friendly and comes with Matlab application programming interfaces (APIs), allowing researchers to take advantage of it [5]. Normalized Moreau-Broto, Moran, and Geary [14] are three typical autocorrelation descriptors that can be used in addition to the fundamentals of [4,5]. Along the amino acid sequence, they are defined by the position-specific score matrix of evolutionary data. In [14], a complete model integrating a position-specific scoring matrix (PSSM), three autocorrelation descriptors, and evolutionary and sequence-order information results in a 560-dimensional feature vector. Selecting features using principal component analysis (PCA) reduces noise. The most information is included in the 175 dominant features with the largest variance and smallest reconstruction error for the support vector machine (SVM) classifier. A Jackknife cross-validation test on three benchmark datasets suggests that the model outperforms earlier evolutionary information-based techniques, particularly for amino acid sequences with low similarity [14]. In [15], it was postulated that the codons of amino acids drive the complex prime number representation (CPNR) for amino acids CPNR. The number of codons for amino acids equals the number of prime integers. This discovery is the impetus behind the new representation of prime numbers. The biological importance of prime numbers is strengthened by complicated domain mapping. In contrast to earlier work, CPNR does not have an issue with degeneracy, and its numbers are usually independent, which means they cannot be produced by adding, multiplying, or exponentiating a real number [15]. Their collection comprised 520 protein sequences from seven functional areas that have been carefully investigated [15]. Quantitative structure-activity relationships (QSARs) require developing in silico models that establish a mathematical link between molecular structures and the properties under investigation [16]. As the formal numerical description of a molecule’s structure, molecular descriptors play a significant role in QSAR and other in silico models. Multiple criteria can be used to classify molecular descriptors. There are two basic categories of descriptors: experimental and theoretical. Authors of [16] outline the foundation for comprehending and performing molecular descriptor computing and the several theoretical descriptor types and their respective perspectives. Each amino acid index [17] was selected and modeled using hydrophobicity, alpha, and other parameters. Each index uniquely identifies the protein. They hypothesized that some descriptors would give protein modeling with more information. Later, in [18], they investigated if other physicochemical descriptors, the fast Fourier transform (FFT), and protein feature categorization could enhance prediction findings.
The descriptors for modeling have been restricted. The top dataset descriptors were identified using two methods. Four publicly accessible datasets serve as the basis for comparison. Sets of data were selected for two reasons: (i) to demonstrate that the combination of descriptors and/or FFT implementation depended on the protein and fitness they were attempting to predict, and (ii) to demonstrate that the technique could be effective even when insufficient training data was available. They demonstrated that the method might increase model quality and accuracy of fitness prediction; the most accurate predictive models used FFT with aminoamide residue interactions [18]. In [19], a complete overview of encoding methods is offered. They classified amino acid encoding methods into five groups based on the type of information used to create the code: binary, physicochemical attributes, evolution-based, structure-based, and machine learning.
Initially, the five amino acid encoding classes were presented. Once procedures were determined, they were hypothesized. Finally, they analyzed the sixteen distinct methods of encoding amino acids to determine a protein’s shape and its secondary structure [19]. In [20], it is argued that amino acid sequences can be converted into numbers and that only the primary sequences can be utilized to identify protein families. The mapping method utilized Fibonacci numbers and a hashing table (FIBHASH). A Fibonacci number was allocated to each amino acid coding based on its integer representation. Then these amino acid codes were then placed in a 20-byte hash table so that recurrent neural networks could classify them into groups [21]. The categorization of proteins is a crucial aspect of diagnostic and therapeutic procedures. Traditional methods of classification could not have produced more effective classification results.
Methods of machine learning and deep learning produced superior results. All ML methods must convert protein sequences to numbers; if the protein sequences are converted flawlessly, the performance may increase [21,22]. Protein sequences can be represented on multiple levels, such as the physiochemical properties of amino acids and their three-dimensional structure. This approach makes it difficult to determine the optimal numerical representation for protein sequences. Two encoding strategies for mapping protein sequence-function connections have been examined throughout the past decade. A traditional encoding approach (or “one-hot encoding”) directly provides an amino acid sequence in binary notation.
In contrast, a “learned encoding” scheme includes training an unsupervised ML method on millions of unlabeled protein sequences [22,23]. After training, the learned encoding technique can transform protein sequences into numerical vector representations [24]. The learned encoding scheme postulates that all protein sequences comply with evolutionary laws or biophysical features that govern the interactions between proteins that allow them to carry out a biological function [25]. The vector representations of the taught encoding method reveal how proteins link in the learned sequence space. Due to this, identical sequences will have similar vector representations, and by utilizing downstream-supervised ML models, such as a Gaussian process, similar biological functions can be presumed [26].
Recently, neural network (NN)-based computer models have excelled at simulating extremely complex problems. Numerous biological areas can adopt NN-based designs for their benefits [27,28]. Natural language processing (NLP) applications, such as word2vec [29] and others based on deep neural networks and model architectures [30], are among these. A recurrent neural network (RNN) is one of these neural network-based architectures that can be utilized for sequence learning. Concerns include handwriting recognition, speech recognition, and machine translation while preserving the long-term interdependence of hidden states [4]. Convolutional neural network (CNN) has been the method of choice for addressing many issues associated with the seamless automatic exploitation of features and performance adjustment, streamlining conventional image analysis pipelines. CNNs have recently been employed to predict the secondary structure of proteins [31,32]. In [31], the prediction was based on the position-specific score matrix profile (produced by PSI-BLAST), whereas in [32], amino acid sequence-related properties were subjected to convolution with one-directional kernel motions (1D).
Furthermore, [33] proposed a deep CNN architecture for predicting protein characteristics. This design generated dense per-position protein sequence predictions using a shift-and-stitch algorithm with numerous layers. In contrast, [34] generates models that predict enzymatic function based on a structure using deep learning techniques and empirically acquired structural knowledge of enzymes. In the article [35], the authors devised a protein mapping technique for encoding amino acid sequences to numeric representations, which they applied primarily for protein family prediction.
The bispectral analysis is an advanced method to process signals that looks at the phase coupling (quadratic nonlinearities) between signal parts that do not behave in a straight line. Numerous biological signals, including the electrocardiogram (ECG) and electroencephalogram (EEG), are unambiguous as a result of their interdependencies [36–42]. The features gained from these approaches may improve how well the deep learning algorithm works. Ten families within the Globin-like superfamily were recently classified using a hybrid bispectral deep neural network [43]. Compared to prior approaches, this one produced substantial advancement in the classification challenge. Despite these findings, the 16 families still needed to be addressed [43].
This paper provides a novel method for identifying the sixteen protein families within the Globin-like superfamily by feeding numerically encoded bispectrum pictures of protein sequences to a well-designed two-stage CNN model classifier. The document’s structure is as follows: the methodology of this paper is elaborated in Section 2, which includes: the coding, bispectrum, and properties of the deep learning architecture of convolutional neural networks. The third section contains the data utilized in this inquiry and exhibits the outcomes of the proposed single-stage and two-stage applications. Section 4 discusses the suggested method’s achieved results and prospective application areas. The conclusion of the study provides insight into future attempts to enhance predictions.
The proposed system is based on the steps for classifying protein sequence families shown in Fig. 1.
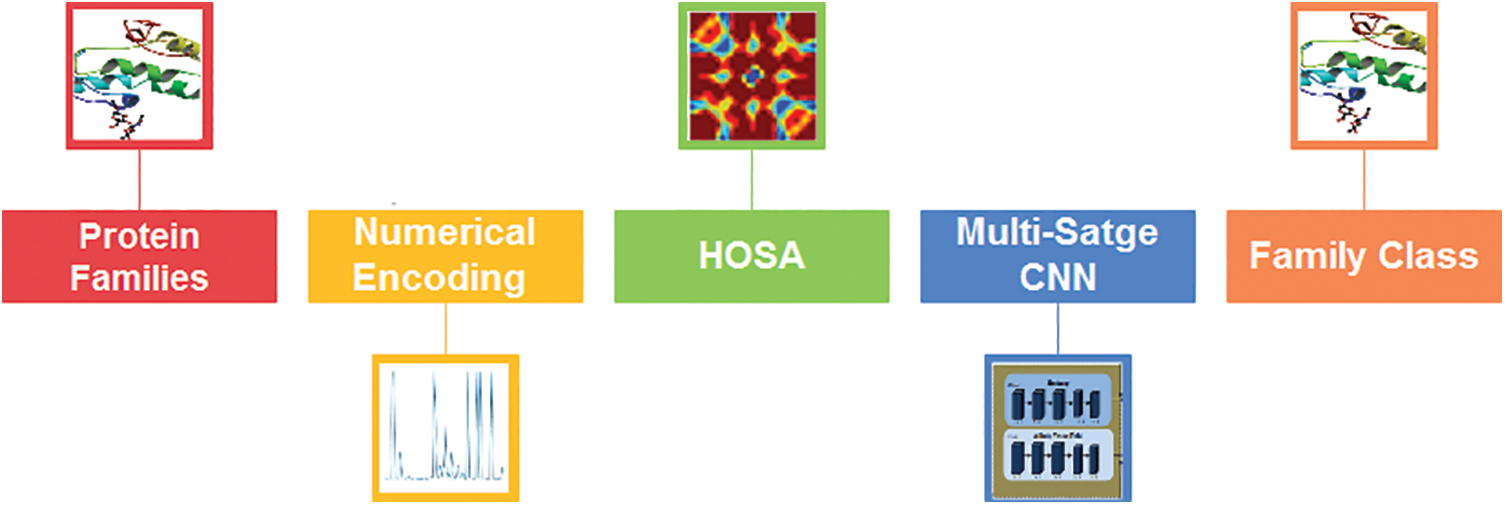
Figure 1: The architectural design of the proposed two-stage classification method
2.1 The Selected Protein Sequence Superfamily
This paper exploits the superfamily information on the InterPro site where Pfam now lives. InterPro is a database of protein families, protein domains, and functional sites used to analyze protein sequences based on their signatures, which come from prediction models like hidden Markov models. One of the essential items about InterPro is that it can combine the protein signatures of its member databases into a single, searchable resource. Also, it could use the unique features of each database to make a single, robust database and diagnostic tool [44]. In this work, the Globin-like superfamily with the InterPro accession number IPR009050 was used to validate the classification approach. This superfamily consists of globin-like proteins with six helices arrayed in a partially open, folded leaf form and truncated globins without the initial helix. This is true for both globins and phycobilisome proteins that resemble phycocyanin. Phycobilisome proteins are oligomers of two distinct globin-like subunits that bind a bilin chromophore and possess two additional helices at the N terminus. They are light-collecting cyanobacteria and red algae [44,45]. Globins are heme-containing globular proteins that bind and/or transport oxygen. They belong to a broad family that has been thoroughly investigated and is found in several organisms [46]. The following families were chosen from this superfamily to test our classification system: The family of the protein and its accession number are shown in Table 1. The number of sequences selected for representing each family was equal to the number of sequences in the lowest-sequence number family after performing multiple shuffles (386 protein sequences from each family).

The amino acid encoding is crucial to the ultimate success of categorization approaches. In contrast to protein sequence encoding, amino acid encoding combines different methods to predict the properties of a protein at both the residue and sequence levels. Encoding methods are typically divided into five categories based on the source of information and how it is extracted: binary encoding, physicochemical characteristics encoding, evolution-based encoding, structure-based encoding, and machine-learning encoding. This article depicts amino acids in protein sequences as multidimensional binary numbers (0 and 1). This process is known as a binary encoding method [19].
The digital representation of amino acids is usually called feature extraction, amino acid encoding scheme, or residue encoding scheme [19]. One-hot encoding, often known as orthogonal encoding, is the most commonly used binary encoding [47]. A twenty-dimensional binary vector in the one-hot encoding method represents each of the twenty standard amino acids. The order of the twenty standard amino acids is specified explicitly. The ith amino acid type is then represented by twenty binary bits, with the ith bit set to “1” and the remaining bits set to “0.” Each vector has a single bit, represented by “1”. Therefore, it is known as “one-hot.” For instance, the twenty standard amino acids are arranged as [A, C, D, E, F, G, H, I, K, L, M, N, P, Q, R, S, T, V, W, Y]; the one-hot code for A is 1000000000000000, the one-hot code for C is 0100000000000000, and so on. Since some amino acids in protein sequences are unknown, it is crucial to realize that in some instances, one extra bit is required to represent the unknown amino acid type, and the length of the binary vector will be twenty-one [19]. The classification accuracy of the adopted encoding method may be enhanced if its outputs are normalized using the mean value and the standard deviation of the encoded amino acid distribution in each family as in Eq. (1):
Bispectrum is one of the most well-known higher-order spectral analyses of the signals. Therefore, it is employed to analyze bio signals; Electromyogram (EMG), Electroencephalogram (EEG), Electrocardiogram (ECG), and heart sounds [48–53].
For instance, power spectrum analysis measures the distribution of power as a function of frequency, omitting phase information. It also assumes that the signal is generated by a linear mechanism, disregarding the possibility of signal interaction depicted as “phase coupling,” a common occurrence in signals derived from nonlinear sources such as protein numerical representations. The bispectral analysis is a signal processing method that examines the phase coupling between signal components, such as the values contained in proteins. After briefly explaining the theory behind the bispectral analysis, CNN uses the information from the bispectral analysis to place proteins into their correct families [53].
Nonlinearities in the protein-encoding process depart from linearity in its form, and non-stationarity in its representation modifies the inter-frequency connections within these families. The bispectral analysis is a complicated signal processing method that quantifies quadratic nonlinearities and linearity deviations. It measures the relationship between signal components, such as the protein-encoding representation. Changes in the representation that result in varying quadratic nonlinearities will result in quantifiable modifications to the bispectrum. The encoded protein is represented by a sequence x(k), divided into epochs with zero mean values to remove any offset from analysis and a unity variance to have a unified benchmark for the sequence. Each epoch’s Fourier transform is computed, and the bispectrum B(fl, f2) is calculated as follows:
The conjugate of Xi (fl + f2) is Xi * (fl + f2). The subscript (i) refers to the number of epochs; in this case, N epochs are added together, and Xi(f) is the Fourier transform of the ith epoch. Notably, whereas the power spectrum depends on a single frequency variable (f), the bispectrum depends on two frequency variables, f1, and f2. It is hard to determine whether a signal is phase-coupled from a single epoch because phase coupling might occur in ways other than the intermodulation products in Eq. (3). Determining whether the phase relationship between each pair of frequencies is random or connected necessitates the examination of numerous epochs. This is achieved by computing the triple product (X(f1 ).X(f2 ).X * (f1 + f2)) for each epoch in a series and averaging the triple products of each epoch [36].
The bispectrum is the amplitude of the average triple product. In case a signal consists of only deterministic frequencies with random phases. In this situation, averaging triple products from different times will result in components with the same frequency, but distinct phase angles canceling out and adding up to zero. Due to the nonrandom phase components of protein family-like representations, their sum will be greater than zero. This is easily demonstrated by assigning a vector to each component of the Fourier series of the protein-encoded sequence. The triple products are averaged by averaging the vectors corresponding to the identical frequency components from each epoch. The vectors are added by adding each vector’s real and imaginary axis projections. Therefore, if a large number of vectors with random phase angles are averaged, the length of the resulting vector (indicating the magnitude of the added components) will go toward zero. On both axes, there will be an equal number of optimistic and pessimistic projections, and the net projection on each axis will gravitate toward zero [53].
However, when taking the average of vectors (components) with identical phase angles, a vector with a length greater than zero is obtained. In the absence of phase coupling, the bispectrum will thus tend toward zero [37] because the sum of Eq. (2) will tend toward zero. In the absence of phase coupling, the bispectrum tends towards zero [53], as does the total of Eq. (2). Due to phase coupling between components at frequencies fl, f2, and fl + f2, B(fl, f2) will not be zero. Therefore, the bispectrum can be used to identify any frequency. The sequence may include both IMPs resulting from phase coupling and fundamentals with the same frequency but different phases than the IMPs (if the phase of the fundamentals is the same as that of the IMPs, there is no way to tell them apart; they are, for all intents and purposes, the same signal) [37,38]. To evaluate this type of data, having the ability to recognize and quantify phase coupling between signal components would be paramount. Furthermore, the bispectrum discloses the non-stationaries in the sequences. It realizes the non-gaussian constituents in the sequences enhancing their classifications and predictabilities. Moreover, it quantifies quadratic phase coupling (QPC) levels and nonlinearity interactions in non-stationary sequences. It strengthens the QPC due to its ability to destroy all common phase coupling relations [37].
Possible frequency pair combinations (f1, f2) and the frequency at their sum (fl + f2) are determined by computing the fraction of each component that results from sequence as opposed to fundamentals. Because the amplitude of the bispectrum is affected by the amplitude of the signal and the degree of phase coupling, it is not a pure measurement of the degree of phase coupling. Instead, the bicoherence metric may be utilized for this purpose [38]. The bispectrum for each class in the normalized encoding system is depicted in Fig. 2. As seen in Fig. 2; each family possesses a prominent pattern that may result in acceptable intolerance when combined with the deep learning model.
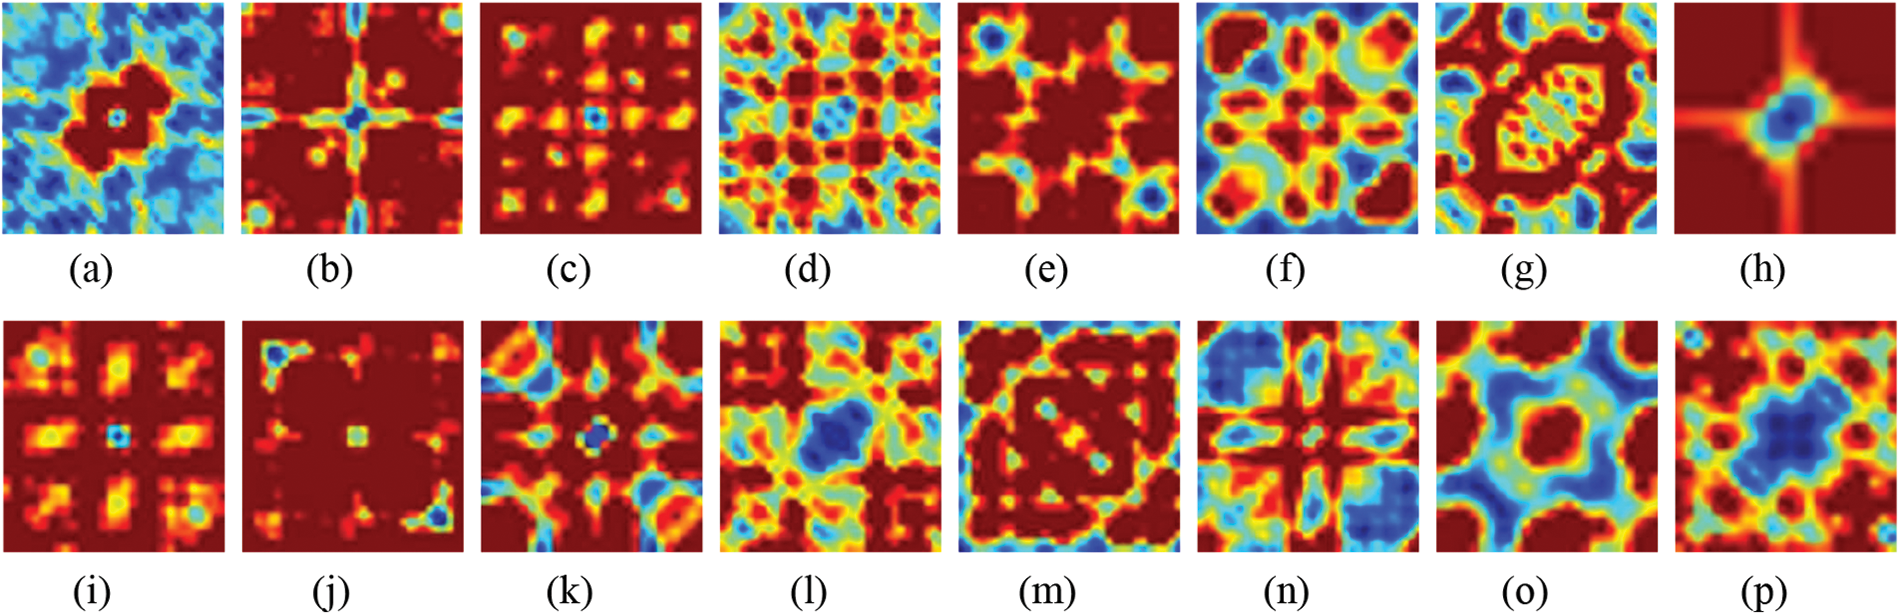
Figure 2: Bispectrum for some protein sequences in each class for normalized encoding approach (a) 1, (b) 2, (c) 3, (d) 4, (e) 5, (f) 6, (g) 7, (h) 8, (i) 9, (j) 10, (k) 11, (l) 12, (m) 13, (n) 14, (o) 15, and (p) 16
Artificial neural networks were utilized in the late nineties to classify biomedical signals [54]. Deep learning is a subfield of artificial intelligence (AI). It is a state-of-the-art technology that learns from the available data without requiring explicit extraction features or pre-processing stages. The main challenge of deep learning is the availability of large datasets to learn from. Therefore, there is a need to increase the availability of data in medical fields. To overcome this barrier, the main point is to use pre-trained networks on large datasets such as ImageNet and to take advantage of the benefits of transfer learning to be compatible with the presented task of classifying the available dataset [54]. CNN is one of the best-known deep-learning models for image classification patterns. It is based on extracting features from low to high levels automatically and adaptively. It consists of different layers, such as convolutional, pooling, and fully connected layers. The first two layers extract the descriptors, while the last layer maps the features to their appropriate output classes [55,56].
Residual networks are types of CNNs’ deep learning structures. It was presented in 2015 by Kaiming He. It differs from existing CNNs by its residual blocks that focus on skipping some layers and solving the vanishing gradient issues of the existing CNNs due to the high number of deep layers. Depending on the number of layers used to build residual neural network (ResNet) models, multiple versions of ResNet depend on the number of layers in deep learning, coded as ResNet-Number of layers: ResNet-18, ResNet-50, ResNet-101, and ResNet-152. In this paper, ResNet-101 is utilized with transfer learning techniques for the last fully connected layer to be compatible with classes 2, 10, and 6 [56,57]. The size of the input images is 224 × 224 × 3. Training and validation employed 70% of the dataset, while 30% was used for testing. Adaptive moment estimation (Adam) optimizer, mini patch size of 64, maximum epochs of 20, and an initial learning rate of 0.001 are used to build the deep-learning model.
The generated images for all protein sequence families are passed to the pre-trained deep learning structure ResNet-101. Transfer learning is employed in the structure to obtain the same class number in the last fully connected layer. Sixteen families are recognized using the proposed deep learning model approach. The evaluation matrices that have been used in this paper are shown in Eqs. (3)–(6):
where true positive (TP) is a test result that correctly indicates the presence of a condition or characteristic; true negative (TN) is a test result that correctly indicates the absence of a condition or characteristic; and false positive (FP) is a test result that wrongly indicates that a particular condition or attribute is present. A false negative (FN) is a test result that wrongly indicates that a particular condition or attribute is absent. The separation between different families is performed using ResNet101 and higher-order spectral analysis by dividing the data into 70% for training and validation and 30% for testing [58]. The procedure is started by passing all sixteens families into the pre-trained CNN. The output is illustrated by the following confusion matrix, as shown in Fig. 3.
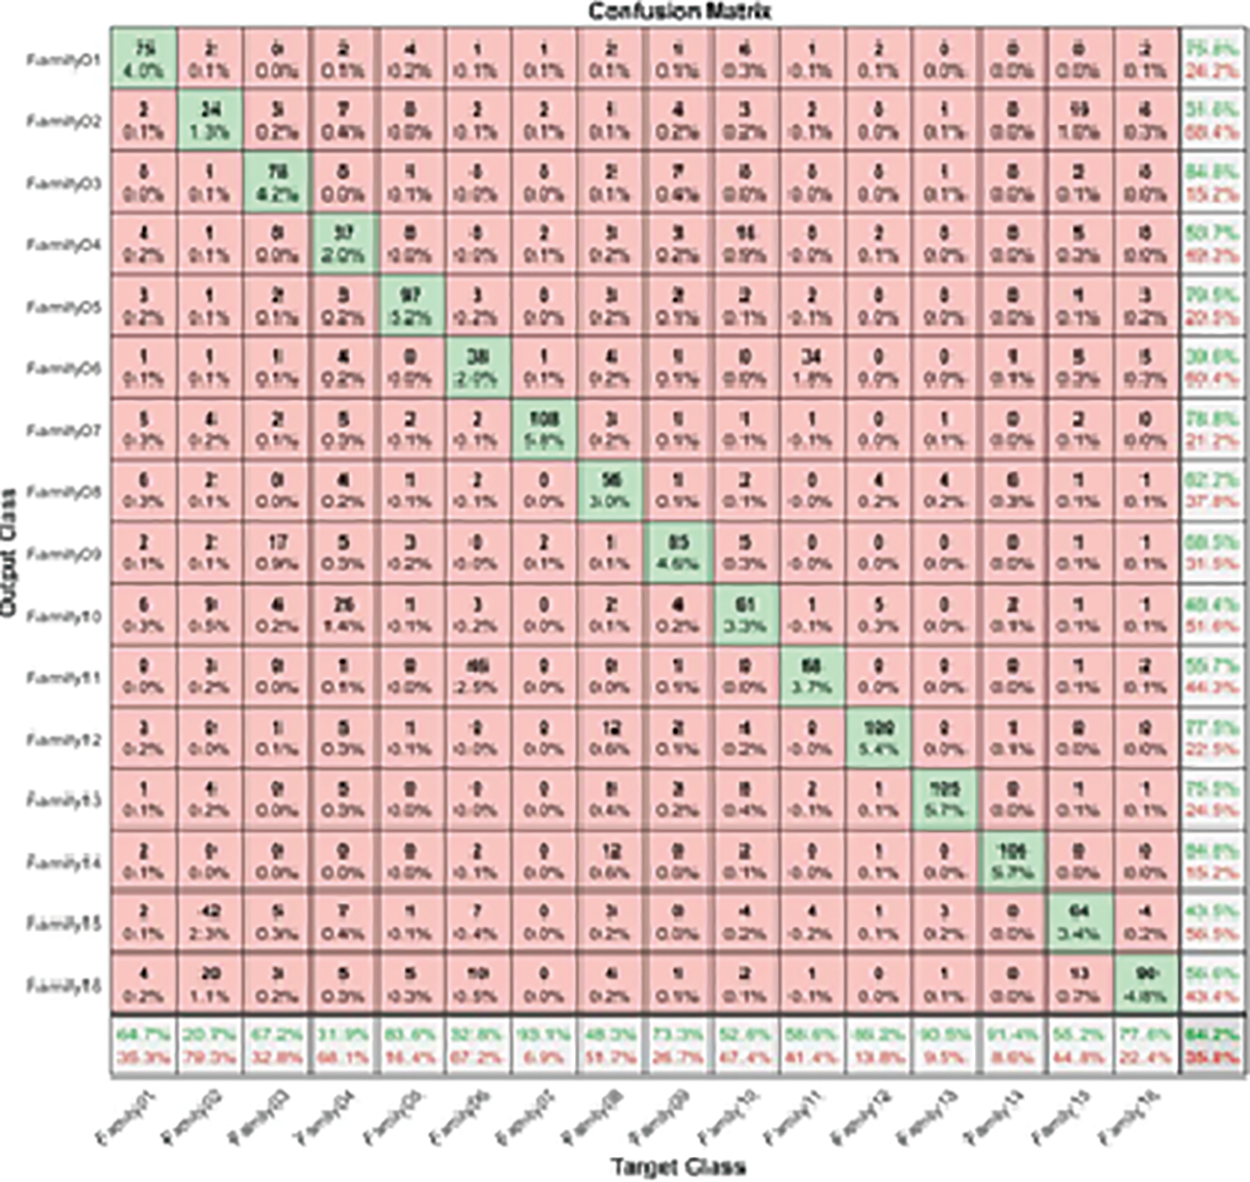
Figure 3: The confusion matrix of a single-stage protein sequence classification
Table 2 figures out the evaluation matrices in the resultant confusion matrix for a single-stage.

The highest recall is obtained in Family 7, with a positive rate of 93.1%. On the other hand, family 2 with recall had the lowest sensitivity, which was not above 20.7%. All families have low precision; their positive predictive values do not exceed 84.8%, which is the difference between the two classes, Family 3 and Family 14. On top of that, Family 2 has the lowest precision as well. The combination of precision and sensitivity is called the F1-score, as shown in Eqs. (3)–(6). Therefore, the best F1 score is in family 14, and the lowest is in family 2. The accuracy for discriminating among sixteen classes is low, and its accuracy is at most 64.2%. Therefore, looking for a new approach is necessary to obtain the best results. The proposed method uses the cascading system by breaking the process of classifying into two steps. The first stage is responsible for discriminating between two groups: six family groups or ten family groups. Following the classification of ten classes on their own and the remaining six on their own, the corresponding confusion matrices clarify the obtained results. Fig. 4 represents the two-stage cascade model. The first Res-Net 101 is fed by sixteen protein families in this model. The first ten families are considered one class, and the next six are considered the second. The method can provide the difference between these two classes based on the network outcome. Fig. 5 describes the obtained results for the first stage of the cascade deep learning system.
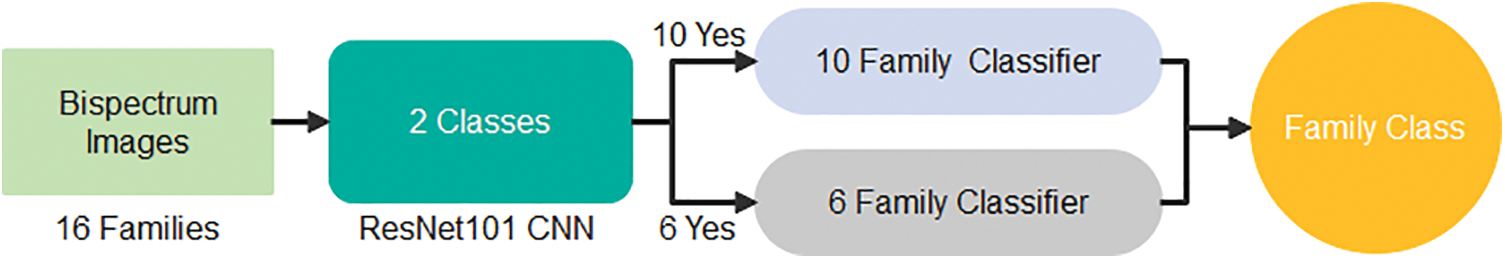
Figure 4: Two–stage deep learning model
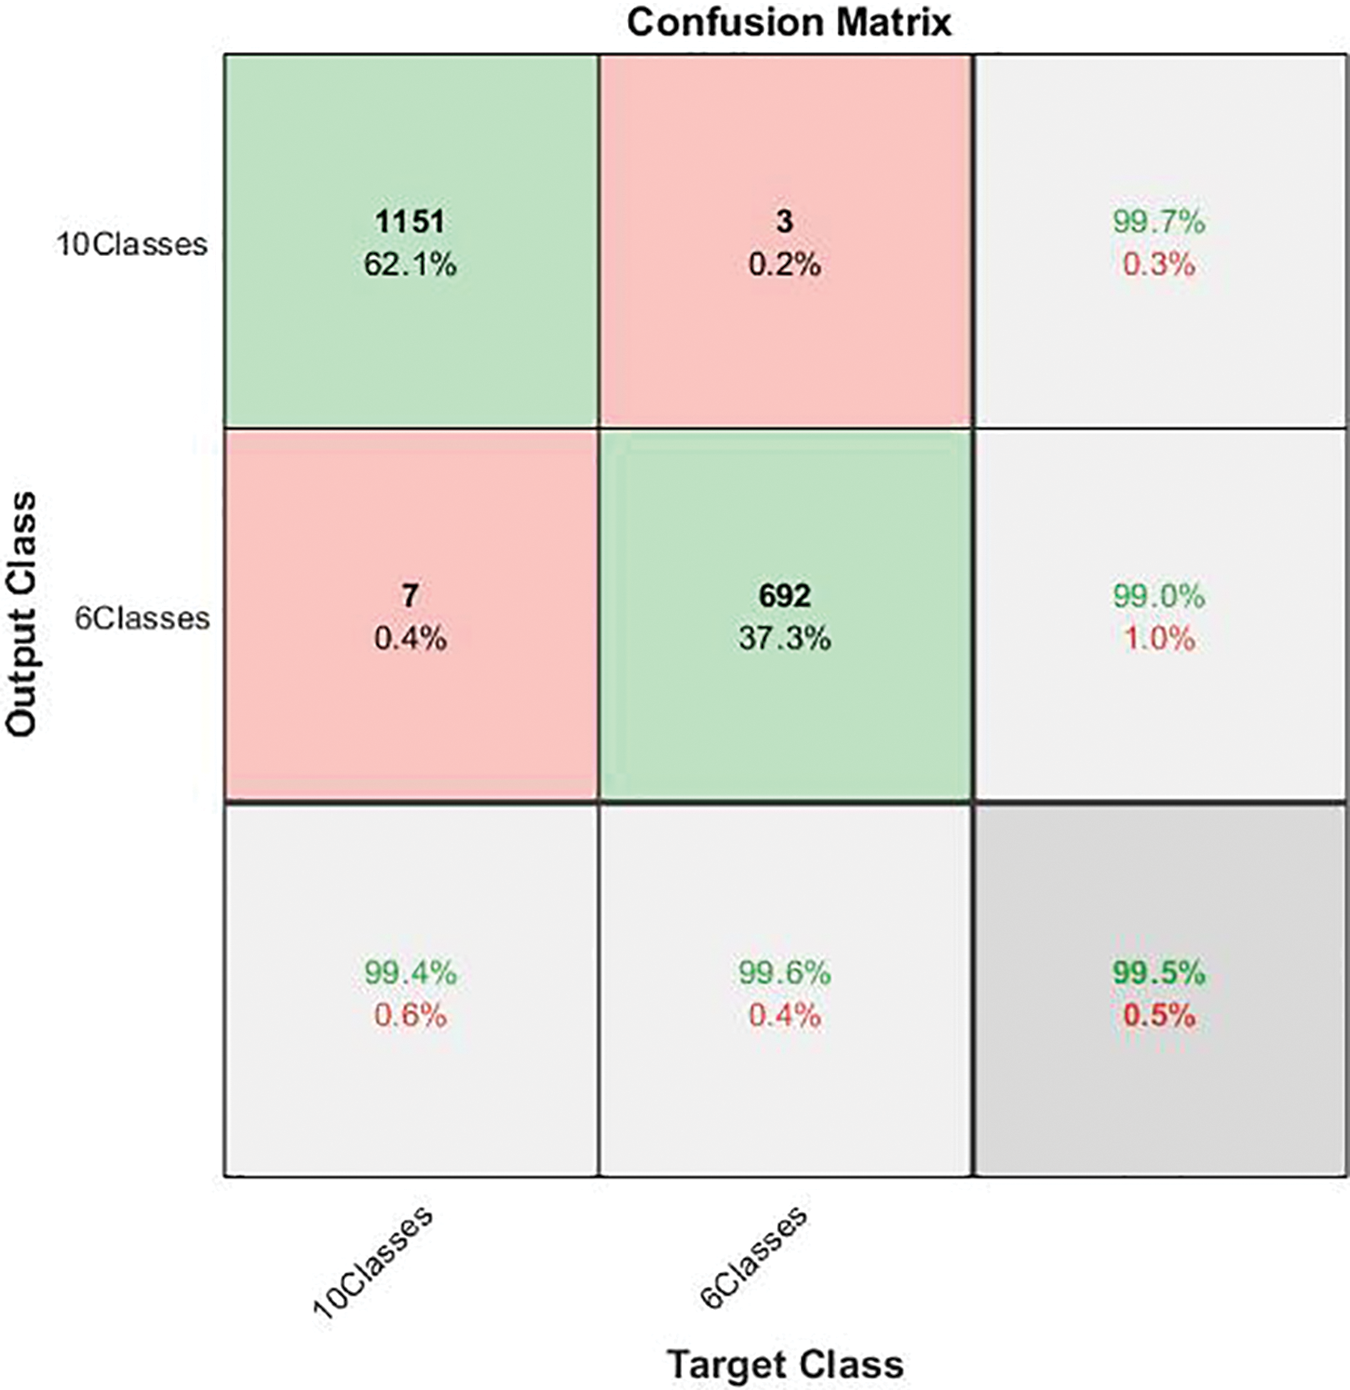
Figure 5: Confusion matrix of the first stage in cascading deep learning approach
As the confusion matrix in Fig. 5 shows, the true positive rate for the ten-class group is 99.4%, and its corresponding precision is 99.7%. On the other hand, the recall for the six-class group is 99.6%, its corresponding positive predictive value is 99.0%, and the miss-classification rate does not exceed 1%. The overall performance of the first stage is promising, with an accuracy of almost 100%. This outcome may ensure that the outperforming classification advances to the next stage. Table 3 depicts the performance of the first-classification stage.

Two parallel Res-Net101 networks were trained and tested in the next stage. The first is trained using 70% for training and validation for the ten-class group as input and 30% for testing. The other parallel network employs the six-class group as inputs, 70% of which is used for training and validation and 30% as a testing set. Table 4 describes the results in more detail. The confusion matrix in Fig. 6 explains the results obtained for the first ten families in the cascade deep learning model. Utilizing the new cascade classifier increases the benefits of the deep cascade learning technique. This parallel structure significantly improves the high performance of classifying each family among the ten families.
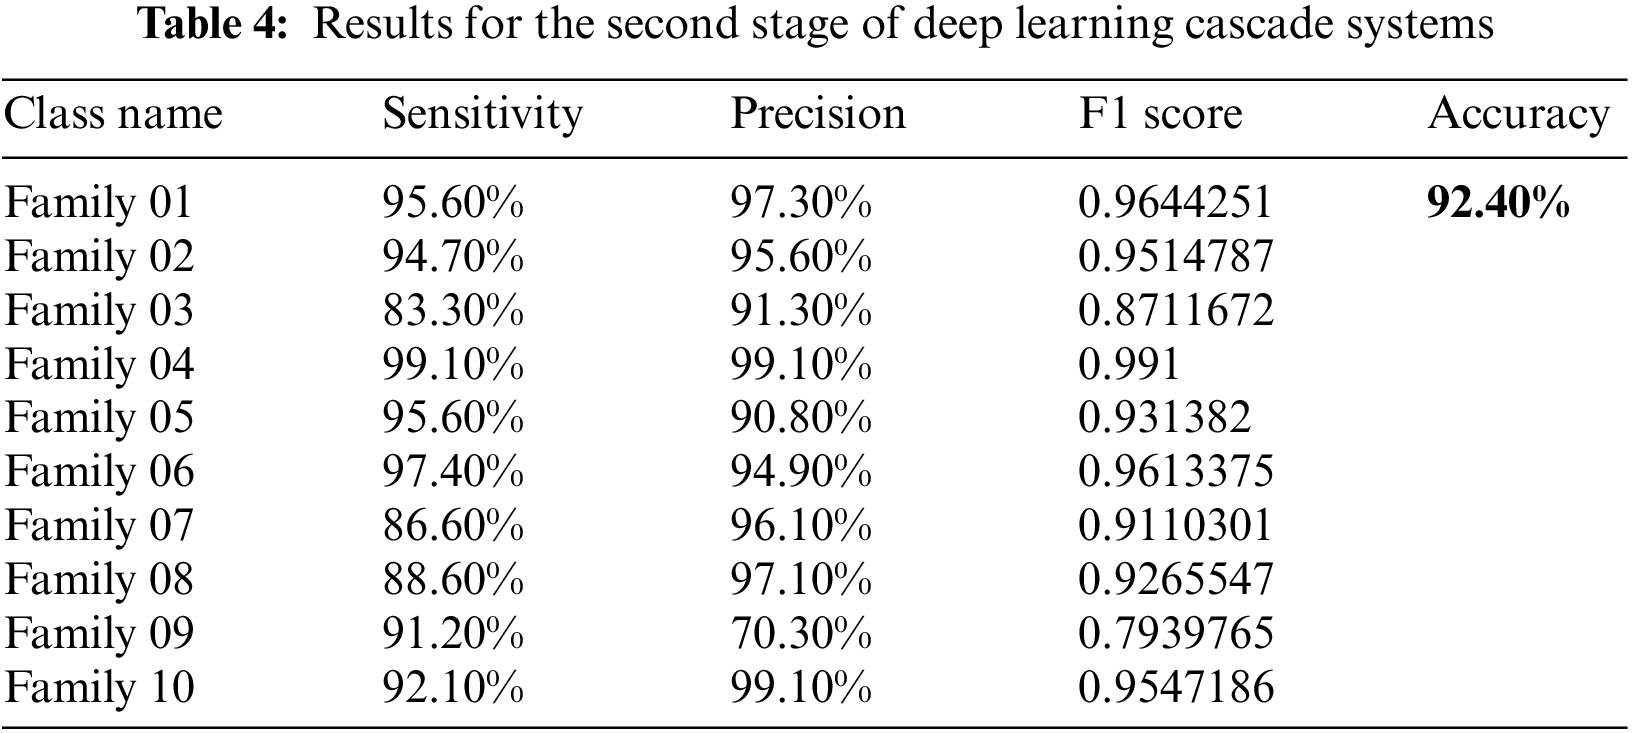

Figure 6: The confusion matrix of the second stage of the cascading deep learning approach for ten classes
The achieved performance is detailed in Table 4. As shown in Table 4 shown below, the sensitivity and precision for all classes have improved significantly. The highest sensitivity approach appears in class 4 with a recall value of 99.1%, which is much improved when we compare it with a single deep learning stage—almost 32%. The same enhancement is in all other classes. The precision is the highest in Family 4 as well. The lowest sensitivity is represented by family 3, and the lowest precision appears in family 9. The accuracy for the first ten classes improved to 92.4%.
The other six protein families are sent to a second deep-learning model, and Fig. 7 shows the resultant confusion matrix for these families. The result significantly assures that the proposed structure is highly effective in classifying these classes providing a high classification rate. Fig. 7 shows the confusion matrix of the six-group classification. The six families in the six-group class were put into groups using a deep cascade learning method. Fig. 7 shows a confusion matrix. The results are shown in the table that goes with it, Table 5.
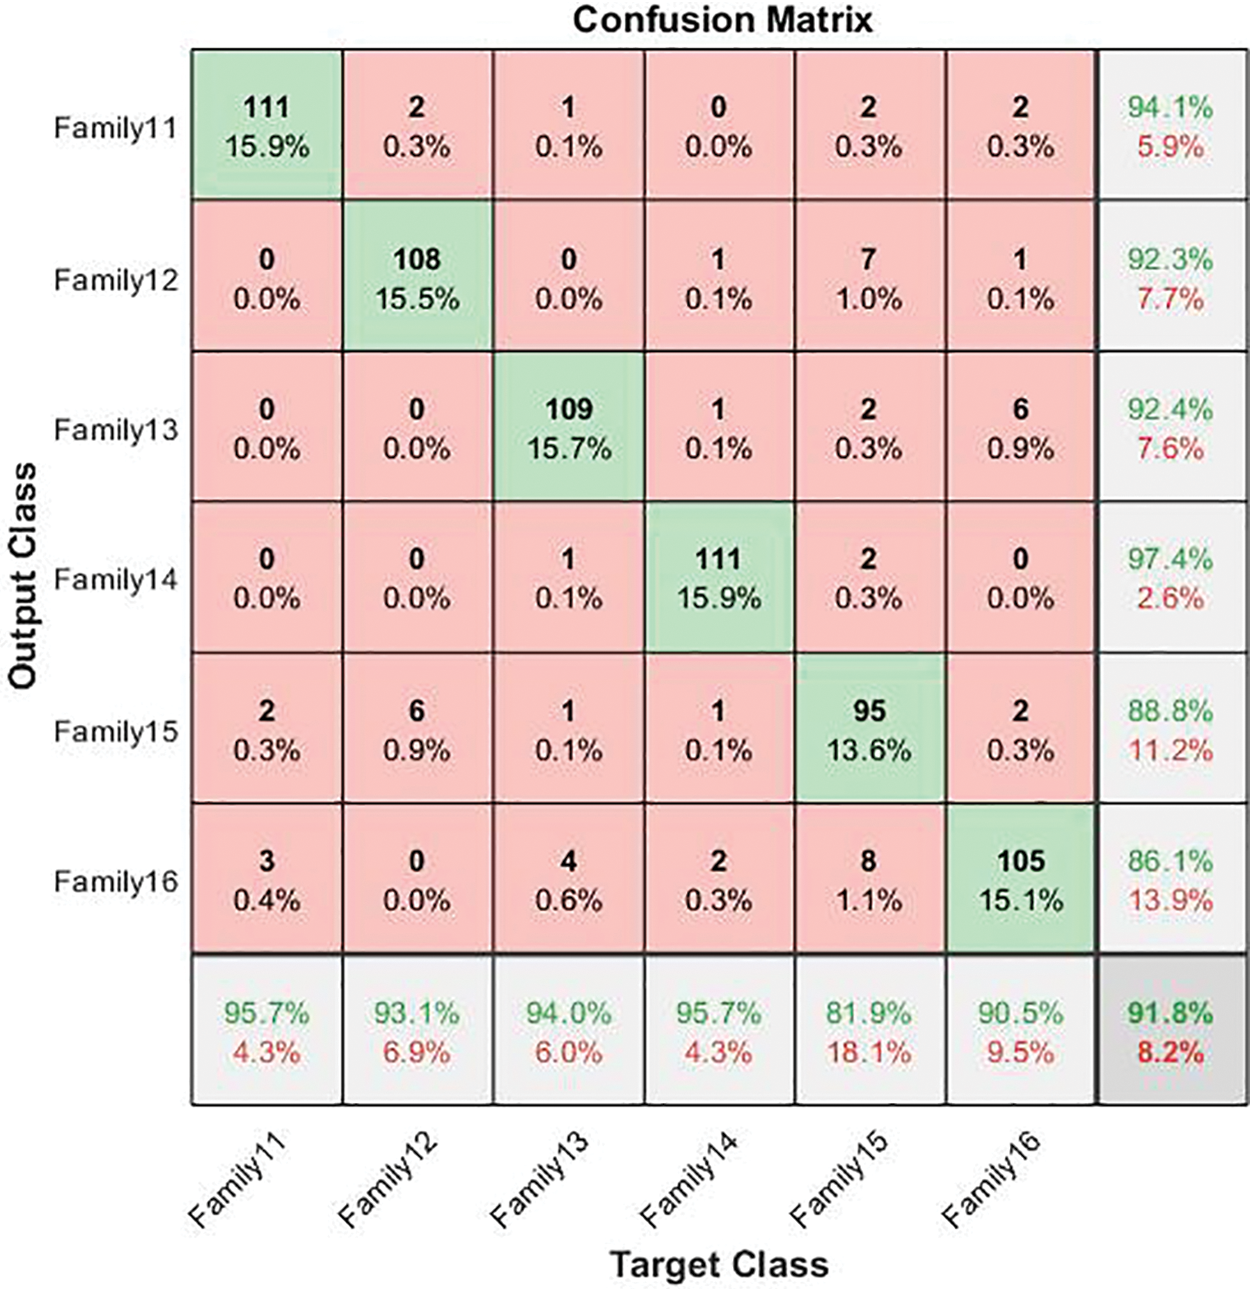
Figure 7: The confusion matrix of the six-group classification cascade deep learning model
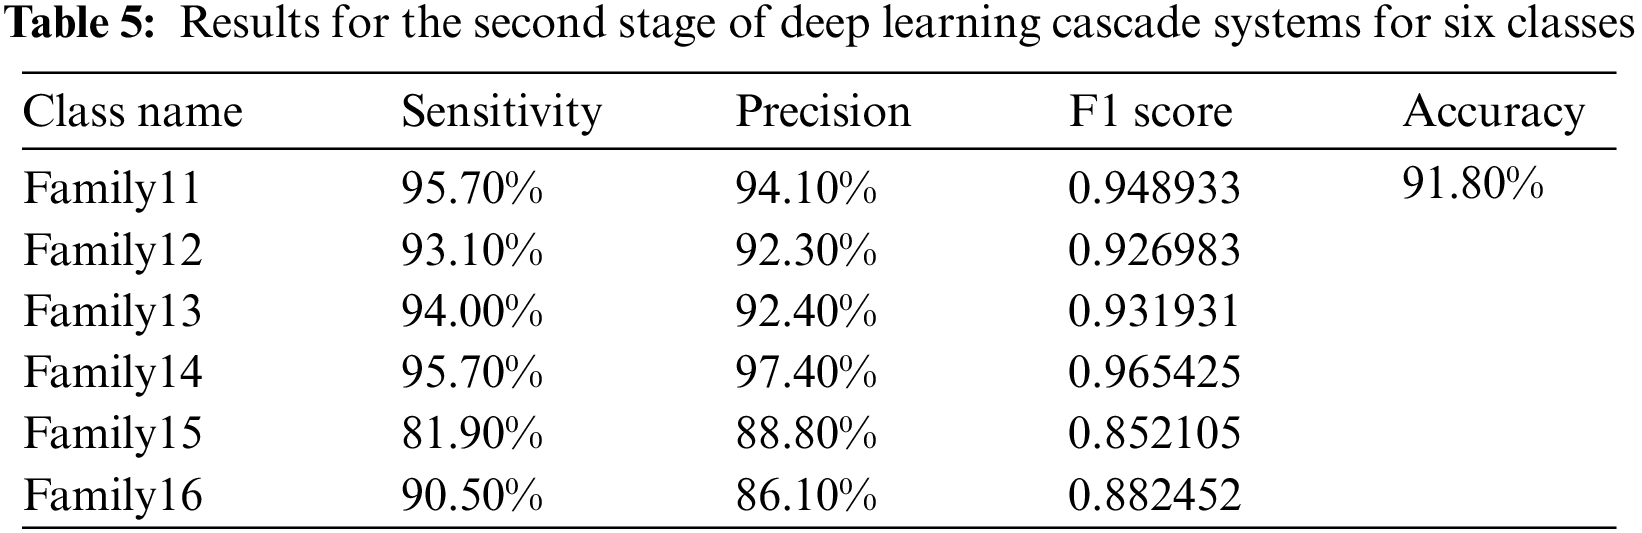
In the cascading system, the highest sensitivity level is reached in Families 11 and 14. Their best value is 95.7%. The same is true for Family 14, which has the highest precision value at 97.4%. The overall accuracy for the second stage is 91.8%. The corresponding comparison between the single-stage and two-stage approaches is clarified in Fig. 8, which explains the impact of the cascading approach on distinguishing between various protein sequences.

Figure 8: The comparison between single stage deep learning system and cascade deep learning system for 16 protein families
Fig. 9 summarize the results of classifications for several algorithms. Comparing the findings of the provided algorithms to those in [59–61] and their references demonstrates their significance and reliability. Overall, the proposed strategy for classifying protein sequence families is effective. It is implemented by translating the protein sequence into high-contrast colored pictures and using a pre-training deep-learning algorithm to provide a more robust classification model. It is important to note that alterations can be further utilized if the feature extraction procedure is further investigated as described in [62–65] or by employing additional deep learning strategies that can be attained by modifying the methods described in [66–71].
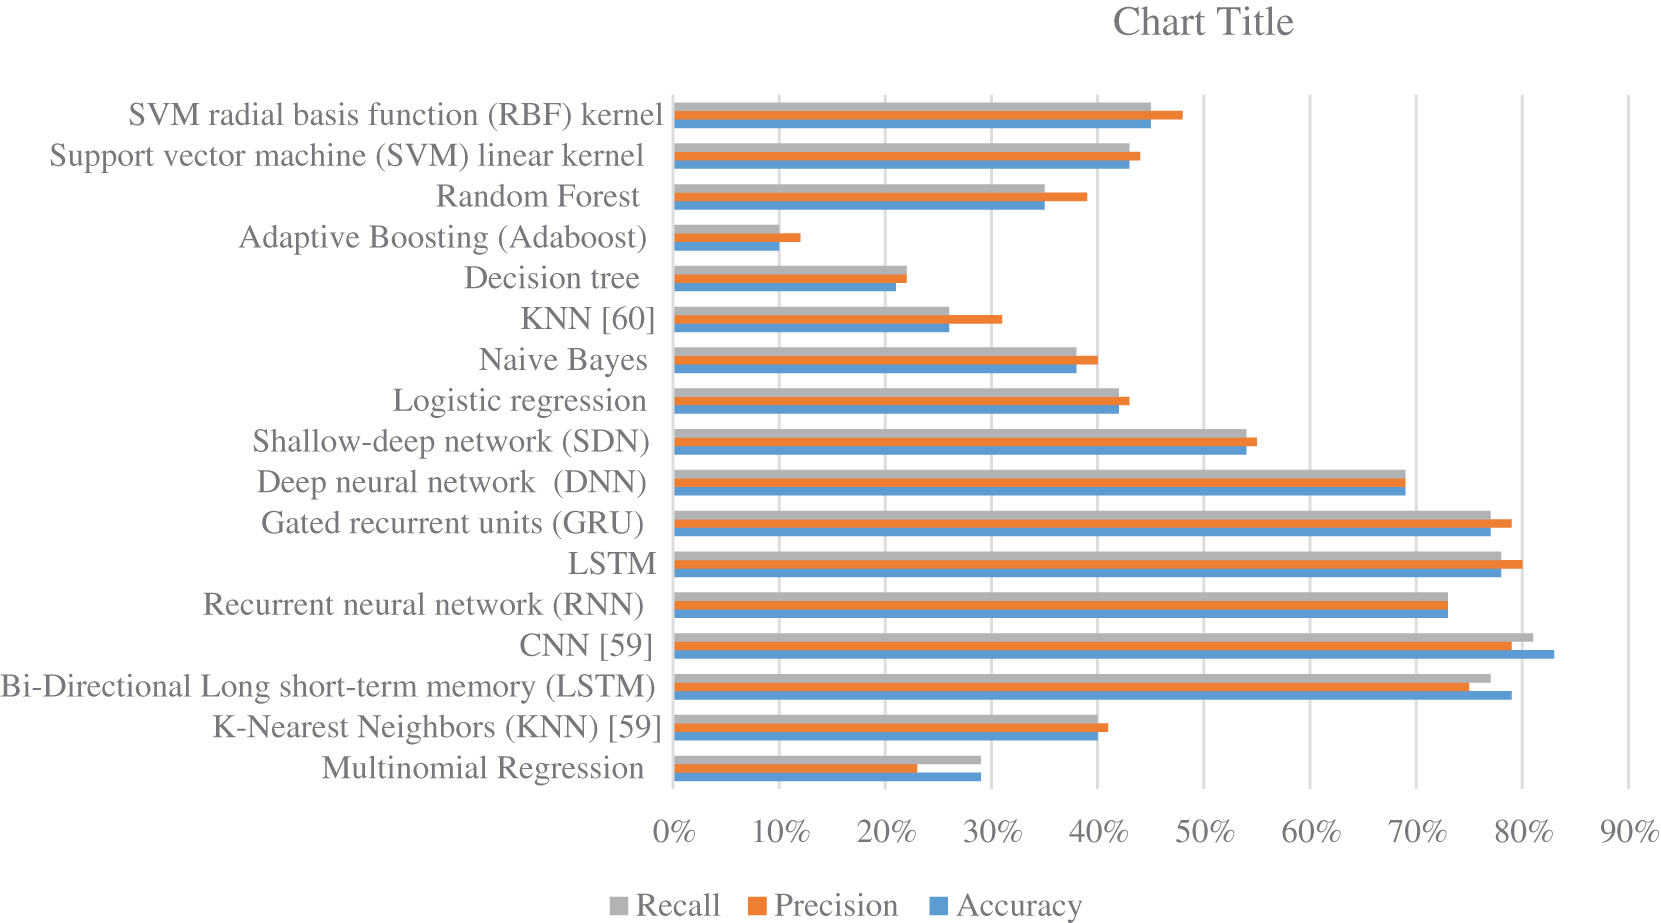
Figure 9: The accuracy, precision, and recall for various machine learning and deep learning algorithms
In [68], a relatively straightforwardly structured CNN outperformed the other four sophisticated models in predicting phosphate-deficient leaves (96% accuracy). At the same time, they showed that Visual Geometry Group 16 layers (VGG16) performed better in detecting leaf blasts and an N deficit. Similarly, ResNet50 might be selected as one of the five models for identifying potassium-deficient leaves. Simultaneously, for the Hispa pest, VGG19 outperformed the InceptionV3 (is a convolutional neural network architecture from the Inception family), ResNet50, and VGG16 models and the simple CNN [68]. Because it deals with the complicated combination of pests, disease, and nutrient deprivation, the study’s implications are very helpful to be considered in future analysis and classification. In [69], they considered the classification challenge by designing practical calculating techniques and developing well-performing tools to ease its complexity. The phage uniR-LGBM was proposed in their study to classify phage virion proteins [69]. Their model utilizes the unified representation (UniRep) as a feature and the LightGBM which is a gradient-boosting framework that uses tree-based learning algorithms as the classification model. Further, they trained the model on the training dataset and used the testing data to test the model with cross-validation. The Phage_UniR_LGBM was compared with several state-of-the-art features and classification algorithms. The performances of the Phage_UniR_LGBM are 88.51% in Sp, 89.89% in Sn, 89.18% in Acc, 0.7873 in MCC, and 0.8925 in the F1 score [69]. These results are below the achieved results in the proposed work. In [70], they investigated the performances of seven classifiers, including support vector machine (SVM), random forest (RF), Naive Bayesian (NB), gradient boosting decision tree (GBDT), logical regression (LR), decision tree (DT), and K-Nearest Neighbor (KNN), for solving the binary classification problems of gene regulatory network (GRN) inference with single-cell Ribonucleic acid-sequencing (RNA-seq) data (Single_cell_GRN). In SVM, three kernel functions (linear, polynomial, and radial basis functions) are utilized. Three real single-cell RNA-seq datasets from mice and humans are utilized. In most cases, the experiment results show that supervised learning methods (SVM, RF, NB, GBDT, LR, DT, and KNN) outperform unsupervised learning methods such as inference of gene regulatory networks (GENIE3) in terms of area under the curve (AUC). SVM, RF, and KNN perform better than the other four classifiers. In SVM, linear and polynomial kernels were better suited to model single-cell RNA-seq data [70]. Such an approach may be considered in our future work to check for the best possible model that can suit the classification accuracy of the tackled problem [71].
This study came up with a new way to classify proteins that uses bispectral images and convolutional neural networks to predict protein families. It has been shown that normalized encoding numbers are distinctive representations of protein families. The subsequent steps of the proposed classification model were based on the unique form in which the numbers for amino acids were shown. The amino acid dataset was split into a trained dataset, a validation dataset, and a test dataset. The bispectrum images of the 16 families are then fed into the two-stage, cascading ResNet-101 CNN networks to find the matching family. Because there is no need for pre-processing, the bispectral technique can even be used when there is data unpredictability and speckle variance. Similarly, bispectral analysis can discriminate between these various structures by computing robust features for texture classification because the formation of unique protein structures in clinical illnesses may be represented as a nonlinear process. The performance of the proposed algorithm is measured using standard metrics like precision, F1-score, and accuracy. The effectiveness of using multistage deep learning models for discriminating between sixteen protein families after encoding them and then representing each encoded sequence by a higher spectral representation (Bispectrum) was the focus of this paper. The cascading approach reduced the number of false positive and false negative cases in all stages. That comes from the fact that the first stage focused only on two classes (six and ten groups). The subsequent stages concentrated on the small number of classes almost correctly distinguished in the first stage and reduced overlapping cases between families, as in single-stage deep learning classification. The single-stage approach achieved 64.2% +/− 22.8% accuracy, 63.3% +/− 17.1% precision, and 63.2% +/− 19.4% F1-score. After applying the two-stage approach, it obtained 92.2% +/− 4.9% accuracy, 92.7% +/− 7.0% precision, and a 92.3% +/− 5.0% F1-score. As a result of this work, a balanced, stable, and accurate prediction can be made for all families in all metrics. It did not just give high-scoring values but also ensured that the new model could handle the differences between the families. The paper shows that when a bispectrum-based nonlinear analysis is used with deep learning models, the resulting feature sets perform better than traditional machine learning methods and other deep learning methods based on convolutional architecture. This means that the inference performance is better. Utilizing the proposed method allows for improved classification and more accurate predictions. The findings show that bispectrum calculations successfully classify textures using the deep learning method.
In the future, bispectrum and bicoherence texture classification could be used to improve how well things are grouped. Also, the suggested method can be used with different data sequences, and the normalization can be made better by increasing the size of the samples. Likewise, the proposed vector’s bispectrum images demonstrate that its distribution has broad tails, indicating a potential for improving the evaluation of different encodings. By making bicoherence changes to the proposed vectors, the final vectors’ distribution may be more like the normal distribution. By looking at how the pattern of prime numbers is similar to the number of codons in amino acids, researchers may come up with a new way to show numbers for amino acids in the future. Also, it could include a framework for combining multiple coding schemes to improve spectral variation, which can be done with higher-order spectral analysis methods. If more representations are evaluated in the weighted scenario, like ensemble learning, it might do even better in other protein functional groups.
Acknowledgement: The authors would thank the authors of the dataset for making it available online. Also, they would like to thank the anonymous reviewers for contributing to enhancing this paper.
Funding Statement: The authors received no specific funding for this study.
Conflicts of Interest: The authors declare they have no conflicts of interest to report regarding the present study.
References
1. N. P. Nguyen, M. Nute, S. Mirarab and T. Warnow, “HIPPI: Highly accurate protein family classification with ensembles of HMMs,” BMC Genomics, vol. 17, no. 10, pp. 89–100, 2016. [Google Scholar]
2. Y. H. Qu, H. Yu, X. J. Gong, J. H. Xu and H. S. Lee, “On the prediction of DNA-binding proteins only from primary sequences: A deep learning approach,” PloS One, vol. 12, no. 12, pp. e0188129, 2017. [Google Scholar]
3. N. Dawson, I. Sillitoe, R. L. Marsden and C. A. Orengo, “The classification of protein domains,” Bioinformatics, Part of the Methods in Molecular Biology Book Series (MIMB), vol. 1525, pp. 137–164, 2017. [Google Scholar]
4. D. Zhang and M. R. Kabuka, “Protein family classification from scratch: A CNN based deep learning approach,” IEEE/ACM Transactions on Computational Biology and Bioinformatics, vol. 18, no. 5, pp. 1996–2007, 2020. [Google Scholar]
5. D. Kimothi, A. Soni, P. Biyani and J. M. Hogan, “Distributed representations for biological sequence analysis,” arXiv preprint arXiv:1608.05949. 2016. [Google Scholar]
6. T. K. Lee and T. Nguyen, “Protein family classification with neural networks,” 2016. Available: https://cs224d.stanford.edu/reports/LeeNguyen.pdf (accessed on 10 October 2022). [Google Scholar]
7. I. Krasteva, N. F. Inglis, F. Sacchini, R. Nicholas, R. Ayling et al., “Proteomic characterization of two strains of Mycoplasma mycoides subsp. mycoides of differing pathogenicity,” J Proteomics Bioinform S, vol. 13, no. 2, pp. 1–12, 2014. [Google Scholar]
8. E. Asgari and M. R. Mofrad, “Continuous distributed representation of biological sequences for deep proteomics and genomics,” PloS One, vol. 10, no. 11, e0141287, pp. 1–15, 2015. [Google Scholar]
9. C. Hejase de Trad, Q. Fang and I. Cosic, “The resonant recognition model (RRM) predicts amino acid residues in highly conserved regions of the hormone prolactin (PRL),” Biophysical Chemistry, vol. 84, no. 2, pp. 149–157, 2000. [Google Scholar] [PubMed]
10. I. Cosic, “The resonant recognition model of Bio-molecular interactions: Possibility of electromagnetic resonance,” Polish Journal of Medical Physics and Engineering, vol. 7, pp. 73–87, 2001. [Google Scholar]
11. W. R. Atchley, J. Zhao, A. D. Fernandes and T. Drüke, “Solving the protein sequence metric problem,” Proceedings of the National Academy of Sciences, vol. 102, no. 18, pp. 6395–6400, 2005. [Google Scholar]
12. N. Nwankwo, “Digital signal processing techniques: Calculating biological functionalities,” Journal of Proteomics & Bioinformatics, vol. 4, no. 12, pp. 260–268, 2012. [Google Scholar]
13. W. Zhang and M. Ke, “Protein encoding: A matlab toolbox of representing or encoding protein sequences as numerical vectors for bioinformatics,” Journal of Chemical and Pharmaceutical Research, vol. 6, no. 7, pp. 2000–2007, 2014. [Google Scholar]
14. Y. Liang, S. Liu and S. Zhang, “Prediction of protein structural class based on different autocorrelation descriptors of position-specific scoring matrix.” MATCH: Communications in Mathematical and in Computer Chemistry, vol. 73, no. 3, pp. 765–784, 2015. [Google Scholar]
15. D. Chen, W. Jiasong, Y. Ming and F. Bao, “A complex prime numerical representation of amino acids for protein function comparison.” Journal of Computational Biology, vol. 23, no. 8, pp. 669–677, 2016. [Google Scholar] [PubMed]
16. A. Mauri, V. Andrea and R. Todeschini, “Molecular descriptors.” in Handbook of Computational Chemistry, Cham: Springer, pp. 2065–2093, 2017. [Google Scholar]
17. R. Ostafe, N. Fontaine, D. Frank, M. Ng Fuk Chong, R. Prodanovic et al., “One-shot optimization of multiple enzyme parameters: Tailoring glucose oxidase for pH and electron mediators.” Biotechnology and Bioengineering, vol. 117, no. 1, pp. 17–29, 2020. [Google Scholar] [PubMed]
18. N. T. Fontaine, X. F. Cadet and I. Vetrivel, “Novel descriptors and digital signal processing-based method for protein sequence activity relationship study,” International Journal of Molecular Sciences, vol. 20, no. 22, no. 22, 5640, pp. 1–26, 2019. [Google Scholar]
19. X. Jing, Q. Dong, D. Hong and R. Lu, “Amino acid encoding methods for protein sequences: A comprehensive review and assessment,” IEEE/ACM Transactions on Computational Biology and Bioinformatics, vol. 17, no. 6, pp. 1918–1931, 2020. [Google Scholar] [PubMed]
20. T. Alakuş and İ Türkoğlu, “A novel fibonacci hash method for protein family identification by using recurrent neural networks,” Turkish Journal of Electrical Engineering and Computer Sciences, vol. 29, no. 1, pp. 370–386, 2021. [Google Scholar]
21. W. A. Iqbal, A. Lisitsa and M. V. Kapralov, “Predicting plant Rubisco kinetics from RbcL sequence data using machine learning,” Journal of Experimental Botany, vol. 74, no. 2, pp. 638–650, 2023. [Google Scholar] [PubMed]
22. M. AlQuraishi, “Machine learning in protein structure prediction,” Current Opinion in Chemical Biology, vol. 65, pp. 1–8, 2021. [Google Scholar] [PubMed]
23. A. Rives, J. Meier, T. Sercu, S. Goyal, Z. Lin et al., “Biological structure and function emerge from scaling unsupervised learning to 250 million protein sequences,” Proceedings of the National Academy of Sciences, vol. 118, no. 15, pp. e2016239118, 2021. [Google Scholar]
24. B. J. Wittmann, K. E. Johnston, Z. Wu and F. H. Arnold, “Advances in machine learning for directed evolution,” Current Opinion in Structural Biology, vol. 69, pp. 11–18, 2021. [Google Scholar] [PubMed]
25. H. ElAbd, Y. Bromberg, A. Hoarfrost, T. Lenz, A. Franke et al., “Amino acid encoding for deep learning applications,” BMC Bioinformatics, vol. 21, no. 1, pp. 235, 2020. [Google Scholar] [PubMed]
26. J. -L. Faulon and L. Faure, “In silico, in vitro, and in vivo machine learning in synthetic biology and metabolic engineering,” Current Opinion in Chemical Biology, vol. 65, pp. 85–92, 2021. [Google Scholar] [PubMed]
27. B. Szalkai and V. Grolmusz, “Near perfect protein multi-label classification with deep neural networks,” Methods, vol. 132, pp. 50–56, 2018. [Google Scholar] [PubMed]
28. D. Quang and X. Xie, “DanQ: A hybrid convolutional and recurrent deep neural network for quantifying the function of DNA sequences,” Nucleic Acids Research, vol. 44, no. 11, e107, pp. 1–6, 2016. [Google Scholar]
29. T. Mikolov, I. Sutskever, K. Chen, G. S. Corrado and J. Dean, “Distributed representations of words and phrases and their compositionality,” Advances in Neural Information Processing Systems, vol. 26, pp. 1–9, 2013. [Google Scholar]
30. B. Alipanahi, A. Delong, M. T. Weirauch and B. J. Frey, “Predicting the sequence specificities of DNA-and RNA-binding proteins by deep learning,” Nature Biotechnology, vol. 33, no. 8, pp. 831–838, 2015. [Google Scholar] [PubMed]
31. M. Spencer, J. Eickholt and J. Cheng, “A deep learning network approach to ab initio protein secondary structure prediction,” IEEE/ACM Transactions on Computational Biology and Bioinformatics, vol. 12, no. 1, pp. 103–112, 2014. [Google Scholar] [PubMed]
32. Y. Li and T. Shibuya, “Malphite: A convolutional neural network and ensemble learning based protein secondary structure predictor,” in 2015 IEEE Int. Conf. on Bioinformatics and Biomedicine (BIBM), Washington, DC, USA, pp. 1260–1266, 2015. [Google Scholar]
33. Z. Lin, J. Lanchantin and Y. Qi, “MUST-CNN: A multilayer shift-and-stitch deep convolutional architecture for sequence-based protein structure prediction,” in Proc. of the AAAI Conf. on Artificial Intelligence, Phoenix, Arizona, USA, vol. 30, no. 1, pp. 27–34, 2016. [Google Scholar]
34. E. I. Zacharaki, “Prediction of protein function using a deep convolutional neural network ensemble,” PeerJ Computer Science, vol. 3, no. e124, pp. 1–11, 2017. [Google Scholar]
35. T. B. Alakuş and İ Türkoğlu, “A novel Fibonacci hash method for protein family identification by using recurrent neural networks,” Turkish Journal of Electrical Engineering and Computer Sciences, vol. 29, no. 1, pp. 370–386, 2021. [Google Scholar]
36. L. Khadra, A. Al-Fahoum and S. Binajjaj, “A new quantitative analysis technique for cardiac arrhythmia using bispectrum and bicoherency,” in (IEMBS) 26th Annual Int. Conf. of the IEEE Engineering in Medicine and Biology Society (IEMBS), San Francisco, CA, USA, vol. 1, pp. 13–16, 2004. [Google Scholar]
37. A. Al-Fahoum and L. Khadra, “Combined bispectral and bicoherency approach for catastrophic arrhythmia classification,” in 2005 IEEE Engineering in Medicine and Biology 27th Annual Conf. (IEMBS), Shanghai, China, pp. 332–336, 2006. [Google Scholar]
38. A. Al-Fahoum, A. Al-Fraihat and A. Al-Araida, “Detection of cardiac ischemia using bispectral analysis approach,” Journal of Medical Engineering & Technology, vol. 38, no. 6, pp. 311–316, 2014. [Google Scholar]
39. A. M. Alqudah, H. Alquran and I. A. Qasmieh, “Classification of heart sound short records using bispectrum analysis approach images and deep learning,” Network Modeling Analysis in Health Informatics and Bioinformatics, vol. 9, no. 1, pp. 1–16, 2020. [Google Scholar]
40. T. Yamanashi, K. J. Crutchley, N. E. Wahba, E. J. Sullivan, M. Kajitani et al., “Evaluation of point-of-care thumb-size bispectral electroencephalography device to quantify delirium severity and predict mortality,” The British Journal of Psychiatry, vol. 220, no. 6, pp. 322–329, 2022. [Google Scholar]
41. R. Wakabayashi, “A call for real-time bispectral index and electroencephalogram monitoring in a patient undergoing aortic surgery,” Journal of Cardiothoracic and Vascular Anesthesia, vol. 36, no. 8, pp. 2558–2562, 2022. [Google Scholar] [PubMed]
42. J. A. Stewart, M. O. Särkelä, J. Wennervirta and A. P., Vakkuri, “Novel insights on association and reactivity of Bispectral index, frontal electromyogram, and autonomic responses in nociception-sedation monitoring of critical care patients,” BMC Anesthesiology, vol. 22, no. 353, pp. 1–13, 2022. [Google Scholar]
43. I. Abu-Qasmieh, A. Al Fahoum, H. Alquran and A. Zyout, “An innovative bispectral deep learning method for protein family classification,” Computers, Materials & Continua, vol. 75, no. 2, pp. 3971–3991, 2023. [Google Scholar]
44. T. Paysan-Lafosse, M. Blum, S. Chuguransky, T. Grego, B. L. Pinto et al., “InterPro in 2022,” Nucleic Acids Research, Nov 2022. https://10.1093/nar/gkac993 [Google Scholar]
45. J. Y. Liu, T. Jiang, J. P. Zhang and D. C. Liang, “Crystal structure of allophycocyanin from red AlgaePorphyra yezoensis at 2.2-Å resolution,” Journal of Biological Chemistry, vol. 274, no. 24, pp. 16945–16952, 1999. [Google Scholar] [PubMed]
46. S. N. Vinogradov, D. Hoogewijs, X. Bailly, K. Mizuguchi, S. Dewilde et al., “A model of globin evolution,” Gene, vol. 398, no. 1–2, pp. 132–142, 2007. [Google Scholar] [PubMed]
47. P. D. Yoo, B. B. Zhou and A. Y. Zomaya, “Machine learning techniques for protein secondary structure prediction: An overview and evaluation,” Current Bioinformatics, vol. 3, no. 2, pp. 74–86, 2008. [Google Scholar]
48. P. A. Kaplanis, C. S. Pattichis, L. J. Hadjileontiadis and S. M. Panas, “Bispectral analysis of surface EMG,” in 2000 10th Mediterranean Electrotechnical Conf. Information Technology and Electrotechnology for the Mediterranean Countries. Proc. MeleCon 2000 (Cat. No. 00CH37099), Lemesos, Cyprus, vol. 2, pp. 770–773, 2000. [Google Scholar]
49. J. W. Johansen, P. S. Sebel and D. M. Fisher, “Development and clinical application of electroencephalographic bispectrum monitoring,” The Journal of the American Society of Anesthesiologists, vol. 93, no. 5, pp. 1336–1344, 2000. [Google Scholar]
50. A. M. Alqudah, S. Qazan, L. Al-Ebbini, H. Alquran and I. A. Qasmieh, “ECG heartbeat arrhythmias classification: A comparison study between different types of spectrum representation and convolutional neural networks architectures,” Journal of Ambient Intelligence and Humanized Computing, vol. 13, no. 10, pp. 4877–4907, 2022. [Google Scholar]
51. H. Alquran, A. M. Alqudah, I. Abu-Qasmieh, A. Al-Badarneh and S. Almashaqbeh, “ECG classification using higher order spectral estimation and deep learning techniques,” Neural Network World, vol. 29, no. 4, pp. 207–219, 2019. [Google Scholar]
52. A. M. Alqudah, H. Alquran and I. A. Qasmieh, “Classification of heart sound short records using bispectrum analysis approach images and deep learning,” Network Modeling Analysis in Health Informatics and Bioinformatics, vol. 9, no. 1, pp. 1–16, 2020. [Google Scholar]
53. L. Khadra, A. S. Al-Fahoum and S. Binajjaj, “A quantitative analysis approach for cardiac arrhythmia classification using higher order spectral techniques,” IEEE Transactions on Biomedical Engineering, vol. 52, no. 11, pp. 1840–1845, 2005. [Google Scholar] [PubMed]
54. A. S. Al-Fahoum and I. Howitt, “Combined wavelet transformation and radial basis neural networks for classifying life-threatening cardiac arrhythmias,” Medical & Biological Engineering & Computing, vol. 37, no. 5, pp. 566–573, 1999. [Google Scholar]
55. H. Alquran, W. A. Mustafa, I. A. Qasmieh, Y. M. Yacob, M. Alsalatie et al., “Cervical cancer classification using combined machine learning and deep learning approach,” Computers, Materials & Continua, vol. 72, no. 3, pp. 5117–5134, 2022. [Google Scholar]
56. R. Yamashita, M. Nishio, R. K. G. Do and K. Togashi, “Convolutional neural networks: An overview and application in radiology,” Insights into Imaging, vol. 9, no. 4, pp. 611–629, 2018. [Google Scholar] [PubMed]
57. K. He, X. Zhang, S. Ren and J. Sun, “Deep residual learning for image recognition,” in Proc. of the IEEE Conf. on Computer Vision and Pattern Recognition (ICCVPR), Las Vegas, NV, USA, pp. 770–778, 2016. [Google Scholar]
58. A. S. Al Fahoum, A. O. Abu Al-Haija and H. A. Alshraideh, “Identification of coronary artery diseases using photoplethysmography signals and practical feature selection process,” Bioengineering, vol. 10, no. 2, pp. 249, 2023. [Google Scholar] [PubMed]
59. A. Wang, “Deep learning methods for protein family classification on PDB sequencing data,” arXiv preprint arXiv:2207.06678, 2022. [Google Scholar]
60. D. Zhang and M. Kabuka, “Protein family classification with multi-layer graph convolutional networks,” in 2018 IEEE Int. Conf. on Bioinformatics and Biomedicine (BIBM), Madrid, Spain, pp. 2390–2393, 2018. [Google Scholar]
61. A. Vazhayil, R. Vinayakumar and K. P. Soman, “Deep proteomics: Protein family classification using shallow and deep networks,” arXiv:1809.04461, Sep. 11, pp. 1–17, 2018. [Google Scholar]
62. N. Le, “Potential of deep representative learning features to interpret the sequence information in proteomics,” Proteomics, vol. 22, no. e2100232, pp. 1–2, 2022. [Google Scholar]
63. X. Yu, A. Aouari, R. Mansour and S. Su, “A hybrid algorithm based on pso and ga for feature selection,” Journal of Cybersecurity JCS, vol. 3, no. 2, pp. 117–124, 2021. [Google Scholar]
64. F. Abukhodair, W. Alsaggaf, A. Jamal, S. Abdel-Khalek and R. Mansour, “An intelligent Metaheuristic binary pigeon optimization-based feature selection and big data classification in a MapReduce environment,” Mathematics, vol. 9, no. 20, 2627, pp. 1–14, 2021. [Google Scholar]
65. P. Nagaraj, P. Deepalakshmi, R. F. Mansour and A. Almazroa, “Artificial flora algorithm-based feature selection with gradient boosted tree model for diabetes classification. Diabetes, metabolic syndrome and obesity,” Targets and Therapy, vol. 14, pp. 2789–2806, 2021. [Google Scholar]
66. J. Sua, S. Lim, M. Yulius, X. Su, E. Yapp et al., “Incorporating convolutional neural networks and sequence graph transform for identifying multilabel protein lysine PTM sites,” Chemometrics and Intelligent Laboratory Systems, vol. 206, pp. 104171, 2020. [Google Scholar]
67. N. Le, Q. Ho, E. Yapp, Y. Ou and H. Yeh, “Deep ETC: A deep convolutional neural network architecture for investigating and classifying electron transport chain’s complexes,” NeuroComputing, vol. 375, pp. 71–79, 2020. [Google Scholar]
68. B. Dey, M. Masum Ul Haque, R. Khatun and R. Ahmed, “Comparative performance of four CNN-based deep learning variants in detecting Hispa pest, two fungal diseases, and NPK deficiency symptoms of rice (Oryza sativa),” Computers and Electronics in Agriculture, vol. 202, pp. 107340, 2022. [Google Scholar]
69. W. Bao, Q. Cui, B. Chen and B. Yang, “Phage_UniR_LGBM: Phage virion proteins classification with UniRep features and LightGBM model,” Computational and Mathematical Methods in Medicine, vol. 2022, pp. e9470683, 2022. [Google Scholar]
70. B. Yang, W. Bao, B. Chen and D. Song, “Single_cell_GRN: Gene regulatory network identification based on supervised learning method and single-cell RNA-seq data,” BioData Mining, vol. 15, no. 1, pp. 13, 2022. [Google Scholar] [PubMed]
71. Q. Huang, H. Ding and N. Razmjooy, “Optimal deep learning neural network using ISSA for diagnosing the oral cancer,” Biomedical Signal Processing and Control, vol. 84, pp. 104749, 2023. [Google Scholar]
Cite This Article
 Copyright © 2023 The Author(s). Published by Tech Science Press.
This work is licensed under a Creative Commons Attribution 4.0 International License , which permits unrestricted use, distribution, and reproduction in any medium, provided the original work is properly cited.
 Downloads
 Citation Tools