
 Submit a Paper
 Propose a Special lssue
 Open Access
ARTICLE

Anomalous Situations Recognition in Surveillance Images Using Deep Learning
1 Department of Computer Science, COMSATS University Islamabad, Wah Campus, 47040, Pakistan
2 Deptartment of Computer Science, University of Wah, Wah Cantt, 47040, Pakistan
3 Deptartment of Computer Science, HITEC University, Taxila, 47080, Pakistan
4 Management Information System Department, College of Business Administration, Prince Sattam Bin Abdulaziz University, Al-Kharj 16278, Saudi Arabia
5 Department of Computer Science, Hanyang University, Seoul, 04763, Korea
* Corresponding Authors: Muhammad Attique Khan. Email: ; Jae-Hyuk Cha. Email:
(This article belongs to the Special Issue: Multimedia Encryption and Information Security)
Computers, Materials & Continua 2023, 76(1), 1103-1125. https://doi.org/10.32604/cmc.2023.039752
Received 14 February 2023; Accepted 20 April 2023; Issue published 08 June 2023
 View Full Text
 Download PDF
Abstract
Anomalous situations in surveillance videos or images that may result in security issues, such as disasters, accidents, crime, violence, or terrorism, can be identified through video anomaly detection. However, differentiating anomalous situations from normal can be challenging due to variations in human activity in complex environments such as train stations, busy sporting fields, airports, shopping areas, military bases, care centers, etc. Deep learning models’ learning capability is leveraged to identify abnormal situations with improved accuracy. This work proposes a deep learning architecture called Anomalous Situation Recognition Network (ASRNet) for deep feature extraction to improve the detection accuracy of various anomalous image situations. The proposed framework has five steps. In the first step, pretraining of the proposed architecture is performed on the CIFAR-100 dataset. In the second step, the proposed pre-trained model and Inception V3 architecture are used for feature extraction by utilizing the suspicious activity recognition dataset. In the third step, serial feature fusion is performed, and then the Dragonfly algorithm is utilized for feature optimization in the fourth step. Finally, using optimized features, various Support Vector Machine (SVM) and K-Nearest Neighbor (KNN) based classification models are utilized to detect anomalous situations. The proposed framework is validated on the suspicious activity dataset by varying the number of optimized features from 100 to 1000. The results show that the proposed method is effective in detecting anomalous situations and achieves the highest accuracy of 99.24% using cubic SVM.Keywords
Anomaly or outlier detection is identifying nonconforming patterns and outlier data instances that do not fit the overall data distribution, such as variations in the underlying phenomenon, noise in the data collection process, or previously unobserved scenarios in the captured environment [1]. Detecting and locating anomalies or unusual events in surveillance videos is a task that can be done manually, semi-automatically, or fully automatically. Traditional surveillance systems are manual and are fully dependent upon humans, requiring the workforce and their constant observation and attention to analyze behaviors or events to judge if the captured activities are anomalous or suspicious. The human operators have to observe many simultaneous video streams, which is labor-intensive and significantly degrades the operator’s attention, leading to inefficient performance [2]. Usually, the security personnel monitors anomalous events (traffic accidents, fire, explosions, robberies, stampedes, etc.) through a display screen connected to a video camera. However, human evaluation of surveillance videos is not ideal because one must be attentive for longer periods. Hence, a system is required to detect and recognize abnormal human activities in an automated fashion.
Furthermore, it is essential to notify the concerned parties by responding immediately. Identifying suspicious or abnormal activity by automatically monitoring Closed-Circuit Television (CCTV) cameras and in-time generated response can greatly aid in preventing accidents or damage control afterward. To mitigate the wastage of time and labor and free operators from exhausting and tedious tasks, automatic systems provide a promising solution for video anomaly detection. Thus, many researchers have diverted their attention toward semi-automatic surveillance systems, which require less human intervention. Such surveillance systems do not require human intervention for decision-making. In automatic surveillance, after recognizing that the video stream contains an abnormal event, the major complex task is to detect and localize such events or human actions. The extraction of robust and discriminative features addresses this challenging task. However, the process of detecting such unusual and abnormal events has some notable challenges, which arise mainly because different scenes have variations in patterns. Moreover, as the type of scenarios and applications change, the unusual events and anomalies also differ.
Video anomaly detection systems are widely used in many applications such as traffic analysis, law enforcement, nursing care institutions, building security, and effective monitoring of public places, including railway stations, airports, shopping malls, military installations, and crowded sports arenas. Anomaly detection has promising applications in various domains with the continually growing data, which is expanding, including complex types such as text, video, images, audio, multivariate time series, graphs, and biological sequences. When anomalies are detected on time, they can avoid machinery downtime, improve machine performance, reduce a disease outbreak, or even save human lives. Detecting anomalies is crucial since anomalous observations correlate with types of faults or problems such as systems malware intrusions, structural defects, production errors, etc., [3]. For example, detecting unauthorized interference in network traffic is anomaly detection in the networking domain [4–7]. In computer systems and the cyber security field, malware is an anomaly, and detecting malware software is the main focus in malware detection and intrusion detection [8].
Similarly, in the medical domain, an anomaly is related to disease outbreak detection and prediction and diagnosis tasks. It involves the detection of abnormal patient conditions or instrumentation errors. In the industrial domain, an industrial malfunctioned or damaged component, such as power plants, wind turbines, and storage devices, is an anomaly called fault detection. In application areas related to e-commerce, like telecom, insurance, banking, etc., anomaly detection refers to detecting fraudulent activities [9–11]. Finally, in the ambient assisted living domain, anomaly detection involves the abnormality detection in daily life routine activities or the detection of significant human aberrations from their usual routines like frequently interrupted sleep, forgetfulness, complications, and inferences in doing daily work of routine, less activity during the day, high activity level at night time, etc., [12–16].
Two methods for detecting anomalous events in surveillance videos are deep learning-based methods and handcrafted-based methods. In hand-crafted-based methods, trajectory, vision, and flow modeling are leveraged in which features based on texture, optical flow, color, and a bag of words are considered one key factor and obtained from spatiotemporal information of scenes. However, the detection of anomalous events becomes challenging due to some reasons. Anomalous and unusual event detection becomes complicated because finding a discriminative, informative, and independent set of features in surveillance videos is a complex task. Hence, handcrafted or low-level features-based techniques suffer from low accuracy rates because capturing patterns in the videos or images becomes challenging as deciding which kind of feature is suitable for a specific situation. For example, appearance features can be described in video sequences by leveraging color and texture features, but representations based on motion features are ignored. Dynamic information of videos can be described by modeling based on optical flow, but these models cannot handle illumination. The models based on the bag-of-words approach can only capture low-level descriptors that are globally distributed, and an unordered histogram of visual word occurrences computes these features. Still, the problem is that the local structural organization of salient points is ignored. The models based on capturing trajectory modeling are capable of capturing and representing motion features of foreground objects. Still, in the case of complex scenes of videos, it is not robust. These models have low reliability in the case of complex and crowded scenes due to the Sensitivity of trajectory features to noise interference which may discontinue the target trajectory. As a result, anomaly detection techniques that are based on handcrafted features rely on some prior knowledge, and for complex video surveillance scenes, they cannot be generalized well [8].
Traditional handcrafted methods, with manually engineered low-level features, have achieved promising results that are acceptable only for some scenarios but unsuitable for tackling complex anomalous situations. In order to handle the problems of handcrafted-based feature methods for detecting anomalies in surveillance videos and images, researchers have adopted machine learning and deep learning algorithms. Deep learning algorithms such as Convolutional Neural Networks (CNN) can extract obscure, complicated features due to the sophisticated structure of the provided data, which is also highly dimensional. In anomaly detection in surveillance videos/images, CNN can automatically extract features of the video/image data using their powerful representation learning ability and perform anomalous behavior discriminations. However, detecting anomalies in surveillance videos using deep-learning methods is challenging for many reasons. First, the anomalies unboundedly have abstract and imprecise definitions that can have some degree of ambiguity because anomalies are context-specific or subjective in many scenarios. For example, riding a bike is usually normal human behavior; however, it may be considered an anomaly when it occurs in a restricted place. Second, abnormal activities are infrequent and irregular and, thus, rarely happen in real-life situations. So, the anomalous samples are scarce, and the amount of normal and anomalous data is hugely imbalanced. Third, detecting anomalies is affected by variations in environmental conditions, such as the working status of capturing cameras and illumination conditions.
Moreover, in surveillance videos of crowded scenes, object segmentation and tracking becomes extremely difficult because of the unwanted effects induced due to the high density of people, severe external occlusion by mobile objects, internal occlusions by background objects, highly unpredictable motions performed by various objects, changes in viewpoint and camera motion. Fourth, due to the integrated spatial and temporal dimensional structure with variations that are not local across video frames, the cost and computational complexity involved in processing the video data are high [17]. Fifth, anomaly detection becomes difficult and challenging when the adversaries start maliciously adapting behaviors in case, they become aware of surveillance systems [18]. Considering the demonstrated issues and the motivation outlined above, this research aims to provide a novel architecture based on CNN so that various anomalous situations and abnormal human behaviors in surveillance images can be detected by extracting deep features, focusing on the customized dataset containing various anomalous situations. The contributions of the proposed work are as follows:
• A 63-layered deep learning architecture called ASRNet is proposed for deep feature extraction to improve the detection and classification accuracy of anomalous situations
• Training of the proposed ASRNet architecture is conducted using CIFAR-100 dataset, and then transfer learning is used on customized suspicious activity dataset
• Feature fusion is performed serially on the features obtained from proposed ASRNet and Inception V3 architectures using suspicious activity dataset, and then feature selection is carried out using an optimization algorithm called Dragonfly Algorithm (DA)
• The performance of the proposed model is evaluated on a different number of selected features ranging from 100 to 1000
The rest of the article is organized as follows: Section 2 discusses related work, and the proposed methodology is presented in Section 3. Then, the results are analyzed in Section 4. Finally, conclusions are drawn in Section 5.
Installing anomaly detection in surveillance videos was based on applying traditional hand-engineered feature extraction and model learning. Over time, anomaly detection accuracy has been improved by employing deep end-to-end architectures. Thus, feature extraction can be done in the literature using three types of methods: handcrafted features-based, deep learning-based, and hybrid methods.
2.1 Handcrafted Features-Based Methods (Shallow Learning)
Handcrafted feature-based methods/models/techniques used to accurately extract spatial and temporal features dynamics from raw image/video data. In these models, extraction was performed by using motion or appearance or both, and it depends upon the meaning and definition of anomaly, low-level features such as texture, color, and its variants (Mixture of Dynamic Texture (MDT), Scale-Invariant Feature Transform (SIFT), Speed-Up Robust Features (SURF)), trajectories, and optical flow. In the second phase of learning, Support Vector Machine (SVM) and Decision Tree (DT) have been employed as binary classifiers for supervised learning of scenarios. Some of the handcrafted based techniques for video anomaly.
2.2 Deep Learning Features-Based Methods (Deep Learning)
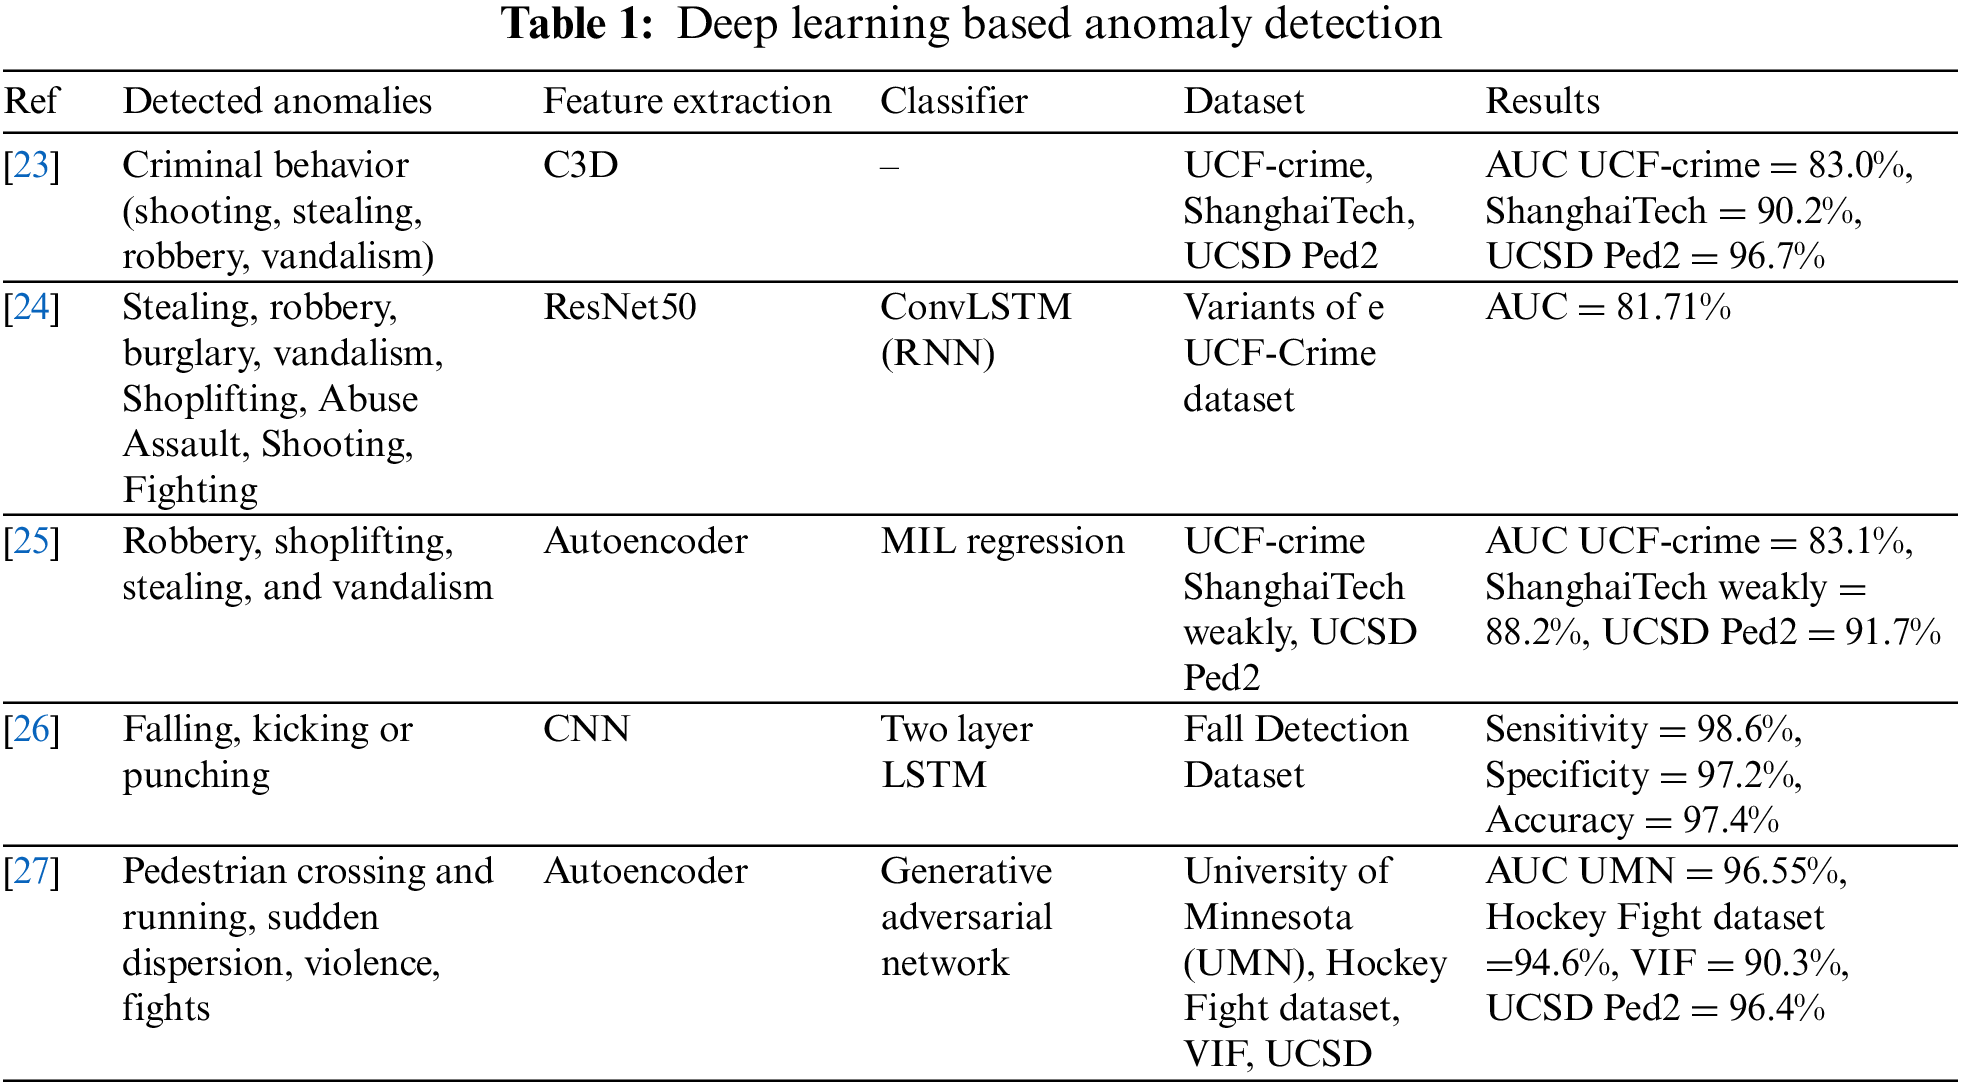
Deep feature learning-based methods/models are used to extract deep features. For example, CNNs can automatically and powerfully learn and extract the features from data, and the identification and detection accuracies are higher. In 2014, Simonyan and Zisserman proposed using two CNNs for action recognition system using videos to capture spatial and temporal information [19] separately. Sabokrou et al. [20] were the first to apply deep learning for video anomaly detection in crowded scenes in 2016 by forming autoencoders cascade, meaning they employed simple auto-encoders using their reconstruction error and sparse auto-encoders using their sparseness measurement. Since then, many research papers have been published in which authors have utilized algorithms for anomalous event detection based on deep learning. For instance, in [21], visual features are extracted using a CNN and bi-directional Long Short-Term Memory Networks (LSTM) to capture the spatial and temporal information from the videos to classify human actions. Similarly, Ul Amin et al. [22] proposed a deep learning model that utilizes CNN to extract spatiotemporal information from segmented shots of input videos. LSTM is used for learning abnormal event that helps the model identify the normal events from abnormal events. Table 1 summarizes a few recent works based on deep learning features [23–27].
2.3 Hybrid Methods (Combination of Handcrafted and Deep Features)
More recently, researchers have diverted their attention to combining handcrafted and deep feature learning-based techniques for video anomaly detection, resulting in much better performances. Some of the most recent hybrid techniques in the literature for the detection of video anomalies are summarized as follows:
The authors have proposed a method for the detection of abnormalities in consecutive video frames [28]. In this method, the spatial-temporal CNN is merged with manually created feature sets like Histogram of Optical Flow (HOF) and Histogram of Oriented Gradients (HOG). Each feature dictionary set is made with handcrafted features. These dictionary sets are learned using the Nonnegative Matrix Factorization (NMF) approach of sparse dictionary coding. Iterative Weighted Nonnegative Matrix Factorization (IW-NMF), a method based on NMF that can sparse both the basis and encoding vectors, has been proposed by the authors. Following the extraction and sparing of the features, clustering techniques are employed to identify the normal or aberrant volume. The authors suggest two novel strategies in [29] and are based on the multi-view representation learning framework. The first approach combines handmade and deep features in a hybrid multi-view representation learning strategy. Robust handmade features are retrieved using Spatio-Temporal Auto-Correlation of Gradients (STACOG), and they are integrated with raw video segments using a 3D Spatio-Temporal Auto-Encoder (3D-STAE). The second approach proposes a deep multi-view representations technique, where motion maps and only deep features from two-stream autoencoders are coupled with raw video segments. One-class SVM is then employed to identify the anomalous activity. All three datasets were handled in an unsupervised fashion once experiments were run.
In [30], the authors have proposed a new hybrid method for detecting anomalies in surveillance videos by combining deep features and a topic model. First, a pre-trained deep model is used to compute features hierarchically at the frame level. And then, in parallel topic modeling, the multilayer nonnegative matrix factorization is used to learn topic distributions, thus entangling information from extracted deep features. Normal samples are used for training purposes. Finally, K-means clustering is used to find out the typically normal cluster. A statistical metric named Earth Mover Distance (EMD) is utilized to measure the difference between the normal cluster centroids and the distributions of test topics during the testing phase. An anomaly is detected when a high difference is compared to a threshold. In [31], the authors have proposed an approach employing both deep and handcrafted features. Spatial and temporal deep features are extracted from video frames using two Resnet101 models. Deep feature enhancement is performed by smoothing their Euclidean distance values for consecutive frames. Handcrafted features consisting of high-level motion frames are extracted by computing the gradient sum of the frame difference of consecutive video frames. Three one-class SVMs are trained using training frames, and then they are utilized to classify normal and abnormal frames. A frame is classified as an anomalous performing decision using three one-class SVMs. Experiments are performed to evaluate the proposed approach by employing the UMN crowd anomaly dataset and PETS2009 dataset, and the proposed approach is compared with the existing techniques.
In [32], the authors have proposed an anomaly detection technique for assisting in Unmanned Aerial Vehicle (UAV) based surveillance missions in which a mobile camera is leveraged for acquiring videos. In this proposed method, pre-trained CNN and two handcrafted methods, i.e., HOG and HOG3D, are leveraged for feature extraction of spatiotemporal features. For unsupervised classification, one class of SVM is applied. To evaluate the performance of the proposed technique, extensive experiments are performed on UAV based dataset, which contains videos taken by monitoring car parking through UAV technology. In [33], the authors have proposed a technique for detecting video anomalies in crowds. Seven crowd anomalies are detected by the proposed method. The proposed method is a combination of deep architecture and handcrafted feature descriptors. Three deep architectures are used: Convolution, LSTM, and Auto-Encoder (AE). On the other hand, handcrafted descriptors include optical flow computation, and motion-based handcrafted features are extracted and given as input for CONV-LSTM-AE. The Farneback optical flow method is utilized to estimate motion between neighbor frames and is more robust to noise. Two types of features of images are calculated, including the magnitude of Optical Flow (OF) and motion for each image pixel. The architecture is divided into two branches: an AE decoder and a classifier. An AE is leveraged for obtaining the sequences of optical flow images in the suppressed form. Time will be saved for feature extraction and classification using this proposed architecture with a single input and multiple outputs.
This paper proposes a novel deep learning architecture based on CNN called ASRNet for detecting and classifying various anomalous situations. This section discusses the proposed technique in detail and describes all the steps followed by the proposed framework. ASRNet is a model based on CNN architecture with a total of 63 layers. Fig. 1 demonstrates each layer arrangement in the proposed ASRNET architecture.

Figure 1: Structure of the proposed ASRNet architecture
3.1 Structure of Inception V3 Architecture
The inception model is first proposed by Szegedy et al. It won the first prize in the ImageNet classification challenge in 2014. The inception module processes the input in parallel instead of stacking convolutional layers on top of each other. It passes the input through different convolutional layers with different numbers of filters and dimensions at the same level. It then concatenates the outputs from convolutional and pooling layers. To reduce output dimensionality, layers of (1 × 1) convolutions are added before other convolution layers with filter sizes more than (3 × 3) and after the pooling layer in the inception module. Inception V3 was introduced in 2016 with improvements such as factorization of (7 × 7) convolutions, batch normalization, and root mean square propagation (RMSProp).
3.2 Structure of Proposed ASRNET Architecture
The deep CNN architecture, AlexNet, was utilized as the backbone of the proposed ASRNET architecture pipeline. ASRNet is a novel CNN-based architecture that is proposed for anomaly detection and classification. The proposed ASRNet deep model architecture is shown in Fig. 1, and the ASRNet model graph with complete steps is shown in Fig. 2. The proposed ASRNet deep model is developed and constructed after analyzing and studying the well-known deep models known as Alexnet. This proposed model contains 69 layers which comprise 17 layers convolutional, seven layers of Rectified Linear Unit (ReLU), 14 layers of batch normalization, two layers of cross-channel normalization, nine layers of leaky ReLU, and three fully connected and global average pooling layers. The input size of the proposed ASRNet is 227 × 227 × 3, and it consists of 69 connections.

Figure 2: Proposed CNN-based technique for the anomalous detecting situations
The proposed ASRNet has some ASR branches it which are repeating. The repeating blocks are of four kinds ASRNET Block, T1 block, T2 block, and T3 block. The very first layer is the data input layer, after which there is a single T1 type block that contains Convolution (C) or Grouped Convolution (GC), ReLU (R), Cross Channel Normalization (CCN), and Maximum Pooling (MP). Between the T1 block, there are two ASR branches after R1, and the fusion of these branches is performed using the additional layer (ADD1). The fusion of the second ASR branch with subnetwork one is performed using the addition layer (ADD2) with subnetwork 1. Subnetwork 1 contains layers of Cross Channel Normalization (CCN) and Maximum Pooling (MP1), Batch Normalization (BN), Grouped Convolution (GC8), and ReLU (R2). After that, subnetwork 2 starts with the first layer of ReLU (R3).
The ASRNet branch has three sub-branches. The first sub-branch has a Convolution (C) layer, Batch normalization (BN) layer, convolutional (C) layer, and last Leaky-ReLU (LR) layer. The second sub-branch has three layers containing the Convolution (C) layer, Batch Normalization (BN), and Leaky-ReLU (LR) layer. The third sub-branch has only the Convolution (C) layer. After the batch normalization (BN) layer of the T1 block, there is a T2 type block containing Grouped Convolution (GC8) and ReLU (R2) layer. After the ReLU (R3) layer, two branches of ASRNet are inserted and the fusion of these two branches is performed using the additional layer (ADD3). Then there are two blocks of type T2. i.e., GC8, R4, GC8, R5. Afterward, the Maximum Pooling layer (MP5) and batch normalization layers (BN14) are inserted. These layers are proceeded by two blocks of type T3 containing Fully Connected layers (FC), ReLU (R), and Dropout layers (D). At the last (FC20) layer, Softmax Classifier (SM) and classification or Output layer are inserted.
3.3 Steps of the Proposed Technique
The proposed technique comprises five major steps: (1) pre-training of the proposed ASRNet CNN-based architecture using the dataset CIFAR-100. (2) deep feature extraction using the proposed ASRNet and Inception V3 architectures from the customized suspicious activity dataset, (3) serial feature fusion of extracted deep features, (4) feature selection using an optimization algorithm called DA (5) classification using two popular classifiers including SVM and K-Nearest Neighbor (KNN). These steps are depicted in Fig. 2.
The second step of our proposed algorithm is feature extraction, which is essential for building a model. Several features, such as shape, color, geometry, etc., can be used to develop a system. In our proposed methodology, Deep features are extracted from Inception V2 and our proposed deep ASRNET because they have the most details, such as color, texture, and edges. This detail is significant in detecting various anomalous situations.
The third step of our proposed algorithm is Feature fusion. The fusion with other features plays a very important role in improving classification accuracies because it has great potential for better performance for classifying anomalous situations. The fused features contain richer and more discriminant information about an image; thus, the scenes in the images can be described well. Fusion of feature information like spatial and temporal features or multi-level features is advantageous in improving the performance of target detection and recognition. In our proposed methodology, the features extracted from the ASRNet and Inception V3 are fused serially. In Serial feature fusion (also called concatenation operation), different features that are usually rotation, scale, and translation invariant to are combined serially to generate a comprehensive feature descriptor. In serial feature level fusion, the features are fused by concatenation operation, and the features’ dimensionalities can be arbitrary.
The fourth step of our proposed algorithm is feature selection. In general, datasets contain extreme information and unnecessary and irrelevant data, so the performance of the deep learning model can be degraded [34]. Also, the computational costs can be increased. To tackle this difficulty, researchers have adopted different methods for selecting the most suitable subset of features required for a given problem. Most of the recent feature selection methods include optimization algorithms for choosing an optimal subset of attributes from the chosen dataset.
We use the DA for feature selection. By S. Mirjalili, DA was created [35]. A swarm intelligence meta-heuristic algorithm draws inspiration from dragonflies’ natural dynamic and static swarming behaviors. Dragonflies are the primary agents in this algorithm which hunt almost all other insects because they are predators. There are two main swarming patterns that dragonflies display; Hunting and Migration. Hunting (also called static or feeding swarming) refers to the exploitation phase of a meta-heuristic algorithm, and in this, the minimum possible number of dragonflies forms a small group and flies in all directions. In Migration (also called dynamic swarming), many dragonflies are required to confirm a big set; afterward, they only fly in the same direction. Dragonflies form smaller swarms and fly over various regions, similar to how search space is explored. Reynolds [36] has defined three basic principles of the behavior of swarms. The first principle is called Separation (Si), which aids in preventing collisions between individuals.
Mathematically it can be represented in Eq. (1) as follows:
The second principle is Alignment (Ai), which ensures that the velocity matches other neighborhood agents. Mathematically it can be represented by Eq. (2) as follows:
The third principle is Cohesion (Ci), which refers to an individual’s tendency toward the neighborhood’s center of mass. Mathematically it can be represented by Eq. (3) as follows:
where X is the current position of the individual, Xj denotes the position of the jth neighbor, Vj represents the velocity of the jth neighboring individual, and N is the size of the neighborhood or neighborhood count.
The last fifth step of our proposed algorithm is classification. At this stage, various anomalous situations are detected and classified. Finally, at this stage, the chosen or selected features from the DA are passed to the predictor/classifier for classification. In our proposed algorithm, we use SVM and KNN as a classifier. Various SVM and KNN versions are exploited to observe the performance of our proposed architecture which include cubic SVM (CSVM), Linear SVM (LSVM), Quadratic SVM (QSVM), Coarse Gaussian SVM (CGSVM), Medium Gaussian SVM (MGSVM), Fine Gaussian SVM (FGSVM), Fine KNN (FKNN), Cosine KNN (CKNN), and Coarse KNN (CrKNN).
The major objective of this research work is to develop a CNN-based architecture to handle the proprietary dataset containing images of various anomalous situations. Our proposed ASRNet CNN-based architecture is created after extensive experimentation and finalized after the layers are removed or added. Also, fine-tuning is performed to get the final architecture. Finally, the architecture ASRNet has 69 layers, outperforming in detecting various anomalous events, human behaviors, and situations. This research study is solely utilized for feature extraction, and then feature selection is performed.
The dataset CIFAR-100 is utilized for pretraining, a database of images with the number of classes 100. For every class, 100 images are used for validation or testing, and 500 images are used for training or learning. Thus, for pretraining, there is a total of 600 images for each class by mixing all the images used for validation and learning. The proposed CNN-based model called ASRNet is then trained on this mixed dataset. Features are then extracted by using the ASRNet and Inception v3 architectures. From the FC19 layer, 4096 features are attained per image. Therefore, there is a total of 13250 images in the customized dataset. Thus, the dimension of the feature set becomes 13250 × 4096. In the subsequent subsections, a detailed discussion of the results produced by the proposed technique is presented.
This paper exploits a system with 8 GB memory named Pentium core i-5 for conducting all the experiments. Moreover, NVIDIAGTX 1070 GPU with 8 GB RAM is used for training MATLAB2020a is used for coding purposes.
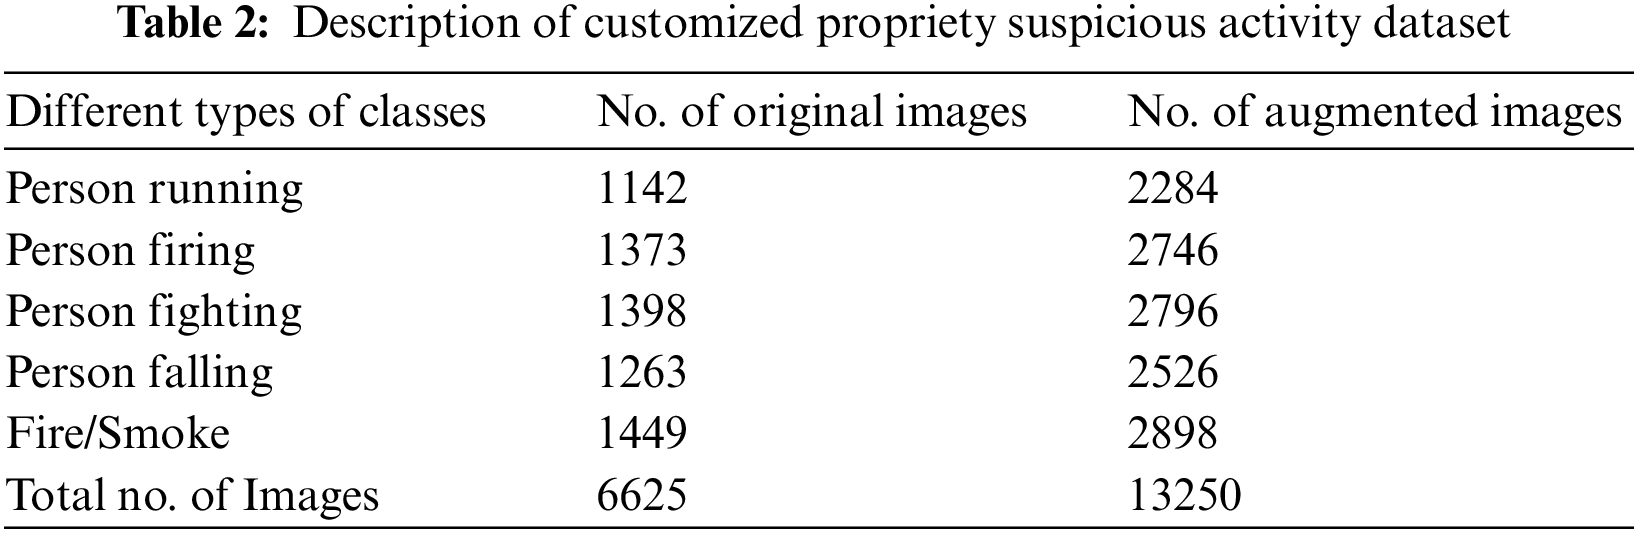
This paper performs the training and testing on a customized dataset containing images of various anomalous situations. This dataset is named the “suspicious activity dataset,” which is prepared and focused on abnormal human behaviors or suspicious activities and anomalous events or situations. The suspicious activity dataset (sample images can be seen in Fig. 3 is created by utilizing two datasets, including HMDB51 [37] and AIDER [38]. HMDB51 contains 51 kinds of human actions and 7000 videos taken from movie shows and YouTube. Leveraging the dataset called HMDB51, four types of human behaviors are chosen: a person running, a person fighting, a person firing, and a person falling. Images of these four behaviors are collected, extracted, and then annotated to make four human behavior/action classes for the customized suspicious activity dataset. The fifth class of our customized dataset is obtained by leveraging the dataset called AIDER from which a class with the images of fire or smoke is extracted for our customized dataset. Mirroring is applied to the images collected for customized datasets, and augmentation is performed. A detailed description of the number of original and augmented images in the dataset is shown in Table 2.

Figure 3: Images from suspicious activity dataset including five types of classes
The 5-fold cross-validation is used for both the training and testing phases. For the assessment of the proposed method, various evaluation assessment procedures were used in this research work. For the experiments performed in this paper, a mechanism of 5-fold cross-validation is used. Furthermore, for each fold, 80% of the data from the dataset is randomly selected for training purposes, whereas 20% of the randomly selected data is selected for testing.
The performance of anomaly detection and classification techniques or algorithms is usually assessed by leveraging different performance metrics. There are some commonly used performance metrics which are used in this research study for the evaluation of the proposed deep learning-based technique for the detection of anomalous situations so that the results of the classification can be analyzed. These include accuracy, precision, specificity, Sensitivity, F1 score, and Gaussian mean. The formulas and description of these performance metrics are given below in Table 3. In the field of anomaly detection, positive symbolizes the presence of events with anomaly, whereas negative symbolizes the absence of anomaly or the presence of normal events.
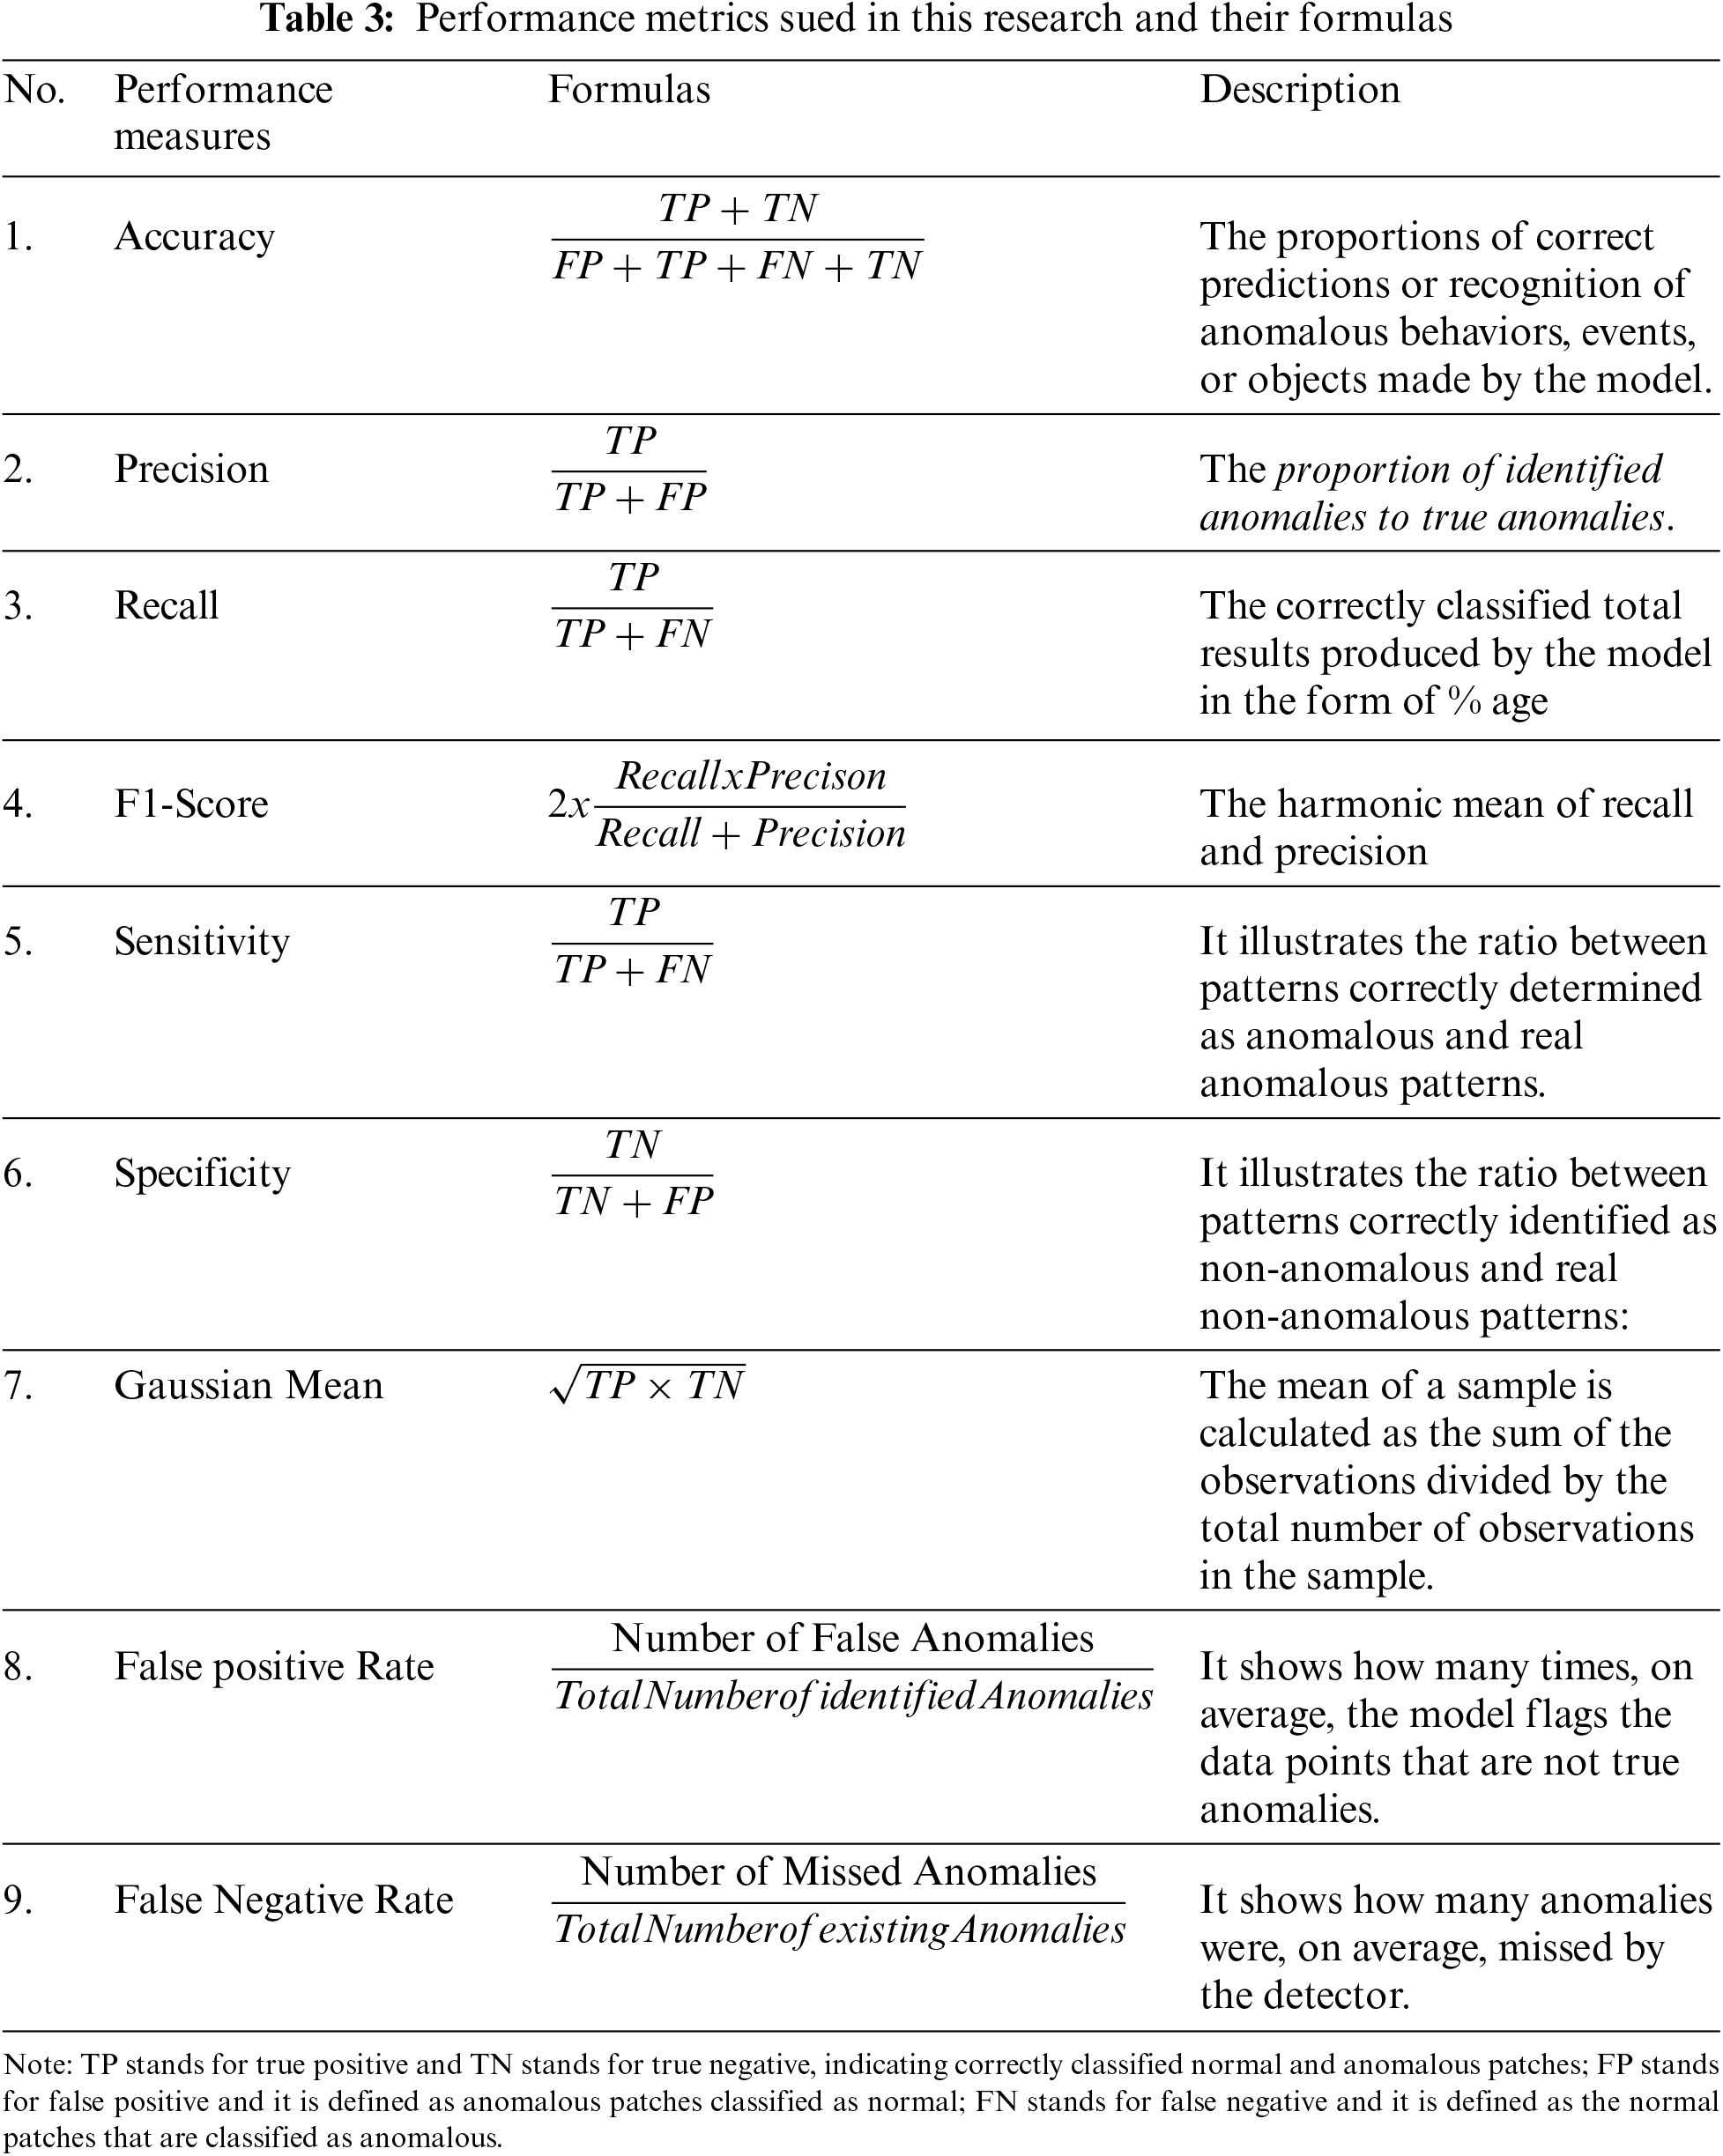
Accuracy measures the proportions of correct predictions or recognition of anomalous behaviors/events/objects made by the model. It is the ratio of correctly classified behavior/events recognition samples to all predicted behavior/events samples. The recall is defined to be the percentage of correctly classified total results obtained by the model. Observing and analyzing recall and accuracy metrics is essential for the performance evaluation and assessment of the models. The harmonic mean of precision and recall refers to F1-Score. The model is considered best when its score is higher. Specificity refers to the proportion of genuinely negative samples among the test’s negative results. Sensitivity refers to the proportion of genuinely positive samples among the positive results of the test.
In this research study, testing is performed by doing extensive experimentation with various iterations of selected features to get good, acceptable results. Tables 3 to 7 for each selected feature (100, 250, 500, 750, 1000) are provided, which show the values for depicting Accuracy (Ac), Specificity (Sp), Sensitivity (Si), Precision (Pr), F1 measure (FM) and Gaussian Mean (GM). It is also noticed from the experiments that as we increase the number of features, the classifiers start taking much training time. Moreover, it is concluded that using the proposed ASRNet, comparing SVM classifiers and KNN classifiers takes more training time. Six experiments are performed, and they are described below in detail.
4.4.1 Experiment with 100 Features
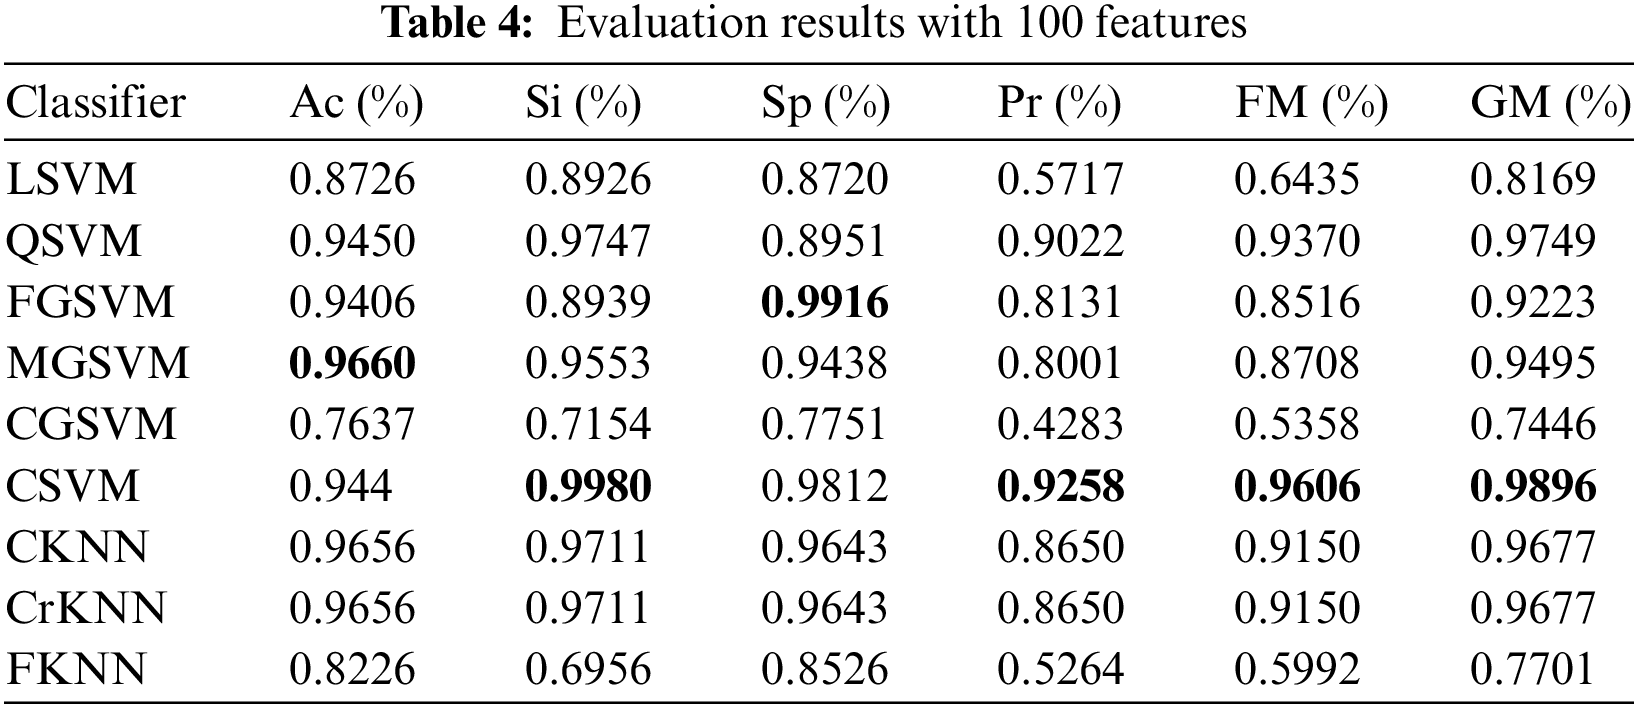
In the first experiment, we chose 100 features using the DA function. All the dataset image features are included in the combined feature vectors; thus, the feature vector’s size becomes 13250 × 100. Based on chosen classifiers, automated marking of prediction models is performed using this feature matrix. Table 4 shows the Ac, Si, Sp, Pr, FM, and GM of the chosen classifiers for 100 features. Median Gaussian achieves the highest accuracy, which is 96.60%. In this test, CSVM achieves the highest scores in Si, Pr, FM, and GM, i.e., 99.80%, 92.58%, 96.06%, and 98.96%, respectively. FGSVM achieves the highest specificity.
Fig. 4 shows the training times of all classifiers to learn from the dataset with 100 features. It is noticed that FGSVM has taken the maximum training time to learn with 100 features which is 123.46 s. On the other hand, CSVM has taken a minimum training time of 37.57 s to learn from the dataset compared to all other classifiers with 100 selected features.

Figure 4: Training time (s) of different classifiers with 100 selected features
Fig. 5 demonstrates the prediction speeds of all classifiers. It is observed that LSVM has the highest prediction speed as compared to all other classifiers, which are 38000 obs/s. On the other hand, CSVM has achieved the second-highest prediction at 7400 obs/s, which is better when compared with other classifiers’ prediction speeds.

Figure 5: Prediction speeds (s) of different classifiers with 100 selected features
4.4.2 Experiment with 250 Features
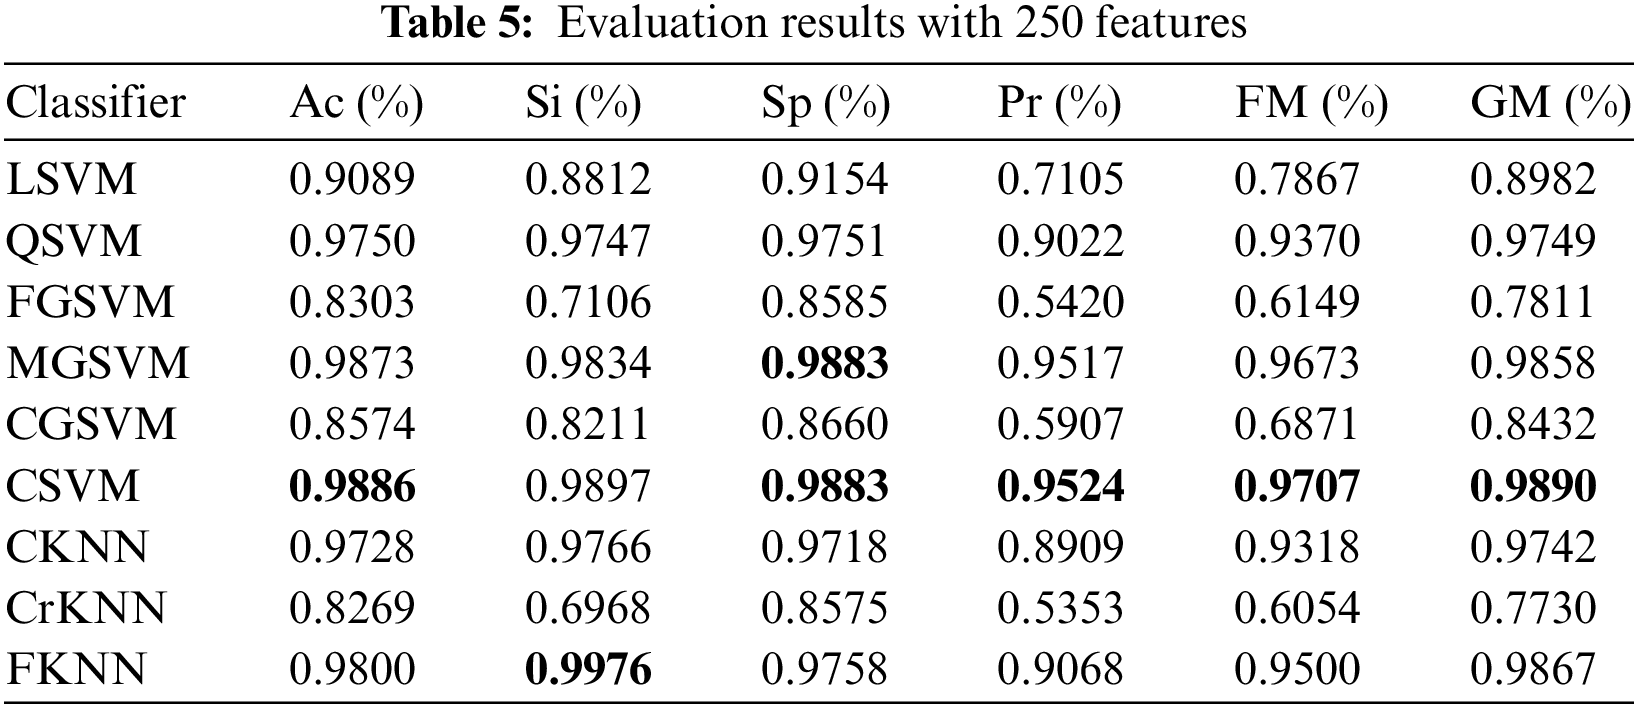
In the second experiment, we chose 250 features using the DA function. All the dataset image features are included in the combined feature vectors; thus, the feature vector’s size becomes 13250 × 250. Based on chosen classifiers, automated marking of prediction models is performed using this feature matrix.
Table 5 shows the Ac, Si, Sp, Pr, FM, and GM of the chosen classifiers for 250 features. CSVM achieves the highest accuracy, which is 98.86%. In this experiment, CSVM achieves the highest scores in Ac, Sp, Pr, FM, and GM, i.e., 98.86%, 98.83%, 95.24%, 97.07%, and 98.90%, respectively. FKNN achieves the highest Sensitivity.
Fig. 6 shows the training times of all classifiers with 250 features. It is noticed that CKNN has taken the maximum training time with 250 features of 440.61 s. FGSVM and CrKNN have also taken the second maximum training time, 424.45 and 411.81 s, respectively, to learn from the dataset with 250 features. On the other hand, CSVM has taken a minimum training time of 82.63 s for training compared to all other classifiers with 250 selected features.

Figure 6: Training time (s) of different classifiers with 250 selected features
Fig. 7 demonstrates the prediction speeds of all classifiers. It is observed that LSVM has achieved the highest prediction speed as found to be 15000 obs/s. On the other hand, the prediction of CSVM and QSVM is found to be 3300 and 3200 obs/s, respectively, with 250 selected features which are better than the prediction speeds of CKNN, CrKNN, FKNN, and MGSVM.

Figure 7: Prediction speeds (s) of different classifiers with 250 selected features
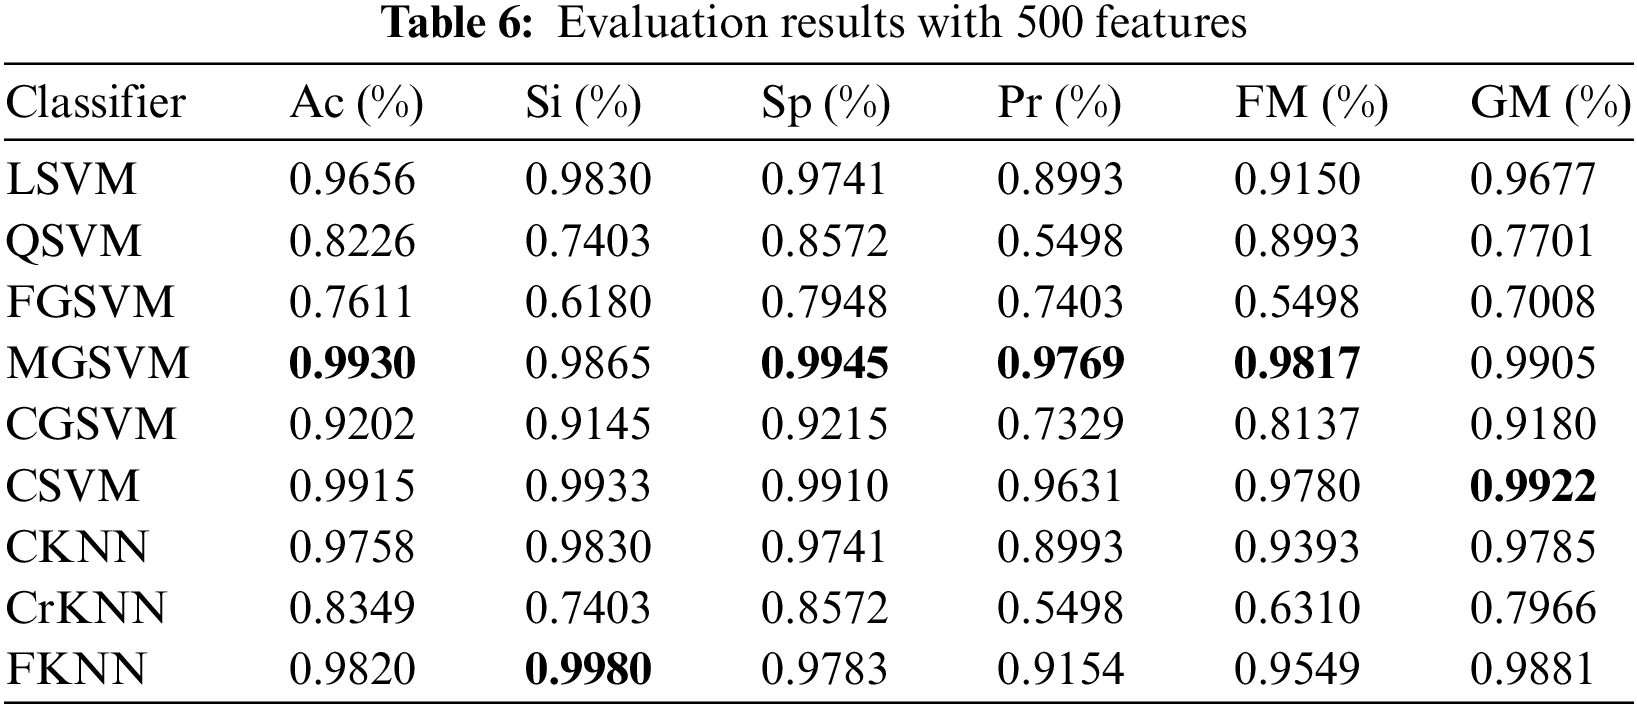
4.4.3 Experiment with 500 Features
In the third experiment, we chose 500 features using the DA function. All the dataset image features are included in the combined feature vectors; thus, the feature vector’s size becomes 13250 × 500. Based on chosen classifiers, automated marking of prediction models is performed using this feature matrix. Table 6 shows the Ac, Si, Sp, Pr, FM, and GM of the chosen classifiers for 500 features. Median Gaussian SVM (MGSVM) achieves the highest scores in Ac, Sp, Pr, and FM, i.e., 99.30%, 99.45%, 97.69%, and 98.17%, respectively. FKNN achieves the highest Sensitivity, which is 99.80%. CSVM achieves the highest GM of 99.22% in this experiment.
Fig. 8 shows the training times of all classifiers with 500 features. It is noticed that FGSVM has taken the maximum training time to learn from the dataset with 500 features which is 793.1 s. On the other hand, CGSVM has taken a second maximum training time of 527.47 s to learn from the dataset. On the other hand, LSVM has taken a minimum training time to learn from the dataset, which is 170.63 s, compared to all other classifiers with 500 selected features.

Figure 8: Training time (s) of different classifiers with 500 selected features
Fig. 9 demonstrates the prediction speeds of all classifiers. It is observed that LSVM has achieved the highest prediction speed at 7400 obs/s which is better than all the other classifiers. CSVM and QSVM both have the same prediction speeds that is 1300 obs/s which is much better than the prediction speeds of CKNN, CrKNN, FKNN, FGSVM, CGSVM, and MGSVM.

Figure 9: Prediction speeds (s) of different classifiers with 500 selected features
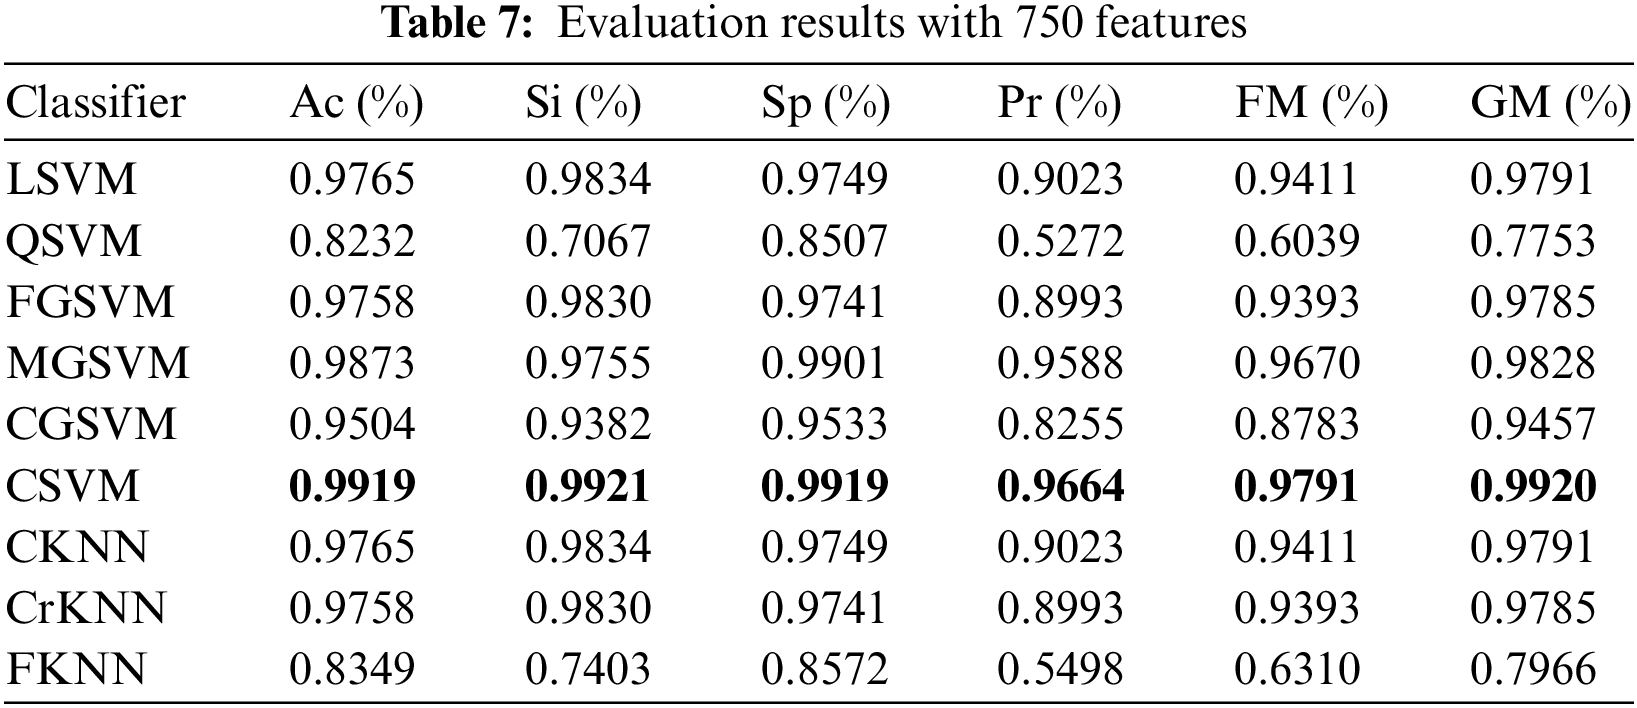
4.4.4 Experiment with 750 Features
In the fourth experiment, we chose 750 features by using the DA function. All the dataset image features are included in the combined feature vectors and thus, the size of the feature vector becomes 13250 × 750. Based on chosen classifiers, automated marking of prediction models is performed using this feature matrix. Table 7 shows the Ac, Si, Sp, Pr, FM, and GM of the chosen classifiers with 750 features. CSVM shows its overall dominance in all performance measures with Ac, Si, Sp, Pr, FM, and GM as 99.19%, 99.21%, 99.19%, 96.64%, 97.91%, and 99.20% respectively. MGSVM achieves the second highest Ac, Sp, Pr, FM, and GM, i.e., 98.73%, 99.01%, 95.88%, 96.70%, and 98.28%, respectively. LSVM and CKNN both have achieved the second-best sensitivity score of 98.34%.
Fig. 10 shows the training times of all classifiers with 750 features. It is noticed that FGSVM takes maximum training time with 750 features which are 1502.5 s. CKNN, CrKNN, and FKNN have also taken much training time to learn from the dataset as 1420.5, 1445.1, and 1237.2 s respectively compared to other classifiers. On the other hand, LSVM has taken minimum training to learn from the dataset which is 235.9 s as compared to all other classifiers with 750 selected features.

Figure 10: Training time (s) of different classifiers with 750 selected features
Fig. 11 demonstrates the prediction speeds of all classifiers. It is observed that LSVM has achieved the highest prediction speed which is found to be 4500 obs/s which is better than all the other classifiers. The predictions speeds of QSVM and CSVM are 740 and 630 obs/s respectively which is much better than the prediction speeds of CKNN, CrKNN, FKNN, FGSVM, CGSVM, and MGSVM.

Figure 11: Prediction speeds (s) of different classifiers with 750 selected features
4.4.5 Experiment with 1000 Features
In the fifth experiment, we chose 1000 features by using the DA function. All the dataset image features are included in the combined feature vectors and thus, the size of the feature vector becomes 13250 × 1000. Based on chosen classifiers, automated marking of prediction models is performed using this feature matrix. Table 8 shows the Ac, Si, Sp, Pr, FM, and GM of the chosen classifiers for 1000 features. CSVM shows its overall dominance in all performance measures with Ac, Si, Sp, Pr, FM, and GM as 99.24%, 99.25%, 99.24%, 96.83%, 98.03%, and 99.24% respectively. MGSVM achieves the second-best score Sp, Pr, as 98.09 % and 0.92.11% respectively. CKNN achieves the second-best score for Ac, Si, FM, and GM, i.e., 97.80%, 98.69%, 94.49%, and 98.14%, respectively.
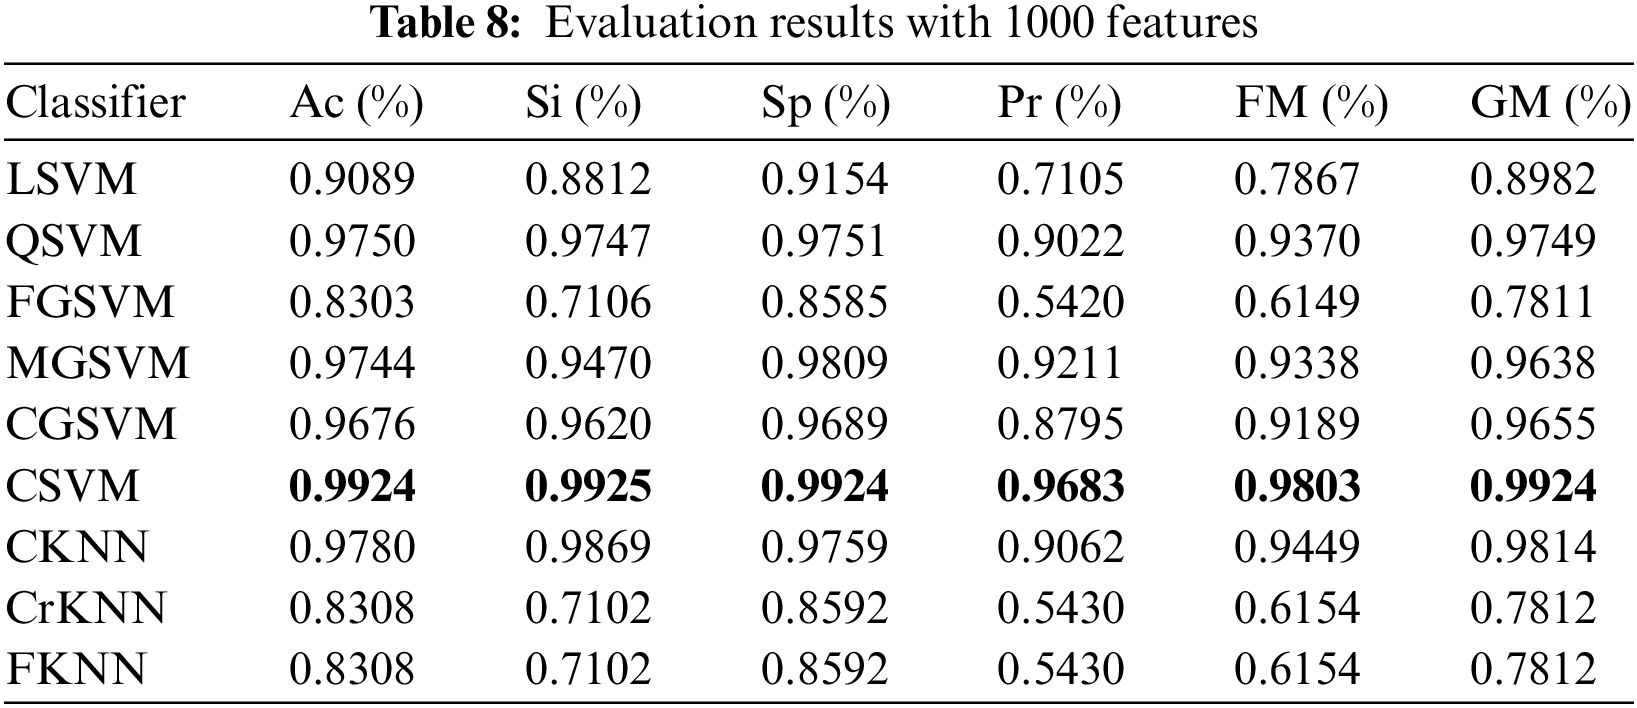
Fig. 12 shows the training times of all classifiers with 1000 features. It is noticed that CKNN is a slow learner; thus, it has taken maximum training time to learn, which is 2459.5 s for 1000 features compared to all other classifiers. Furthermore, FGSVM and CrKNN have also taken much training time to learn for 1000 features as 2285.7 and 2260.9 s respectively compared to other classifiers. On the other hand, LSVM has taken minimum training to learn as compared to all other classifiers with 1000 selected features. Fig. 13 demonstrates the prediction speeds of all classifiers. It is observed that LSVM has achieved the highest prediction speed, which is found to be 3600 obs/s, which is better than all the other classifiers. The prediction speeds of CSVM and QSVM are 230 and 300 s, respectively. The prediction speeds of FGSVM, MGSVM, CGSVM, CKNN, CrKNN, and FKNN are 46, 140, 84, 67, 51, and 42 obs/s, respectively which are very low.

Figure 12: Training time (s) of different classifiers with 1000 selected features

Figure 13: Prediction speeds (s) of different classifiers with 1000 selected features
In summary, the highest obtained accuracy is plotted against the number of selected features in Fig. 14.

Figure 14: Accuracy vs. the number of selected features
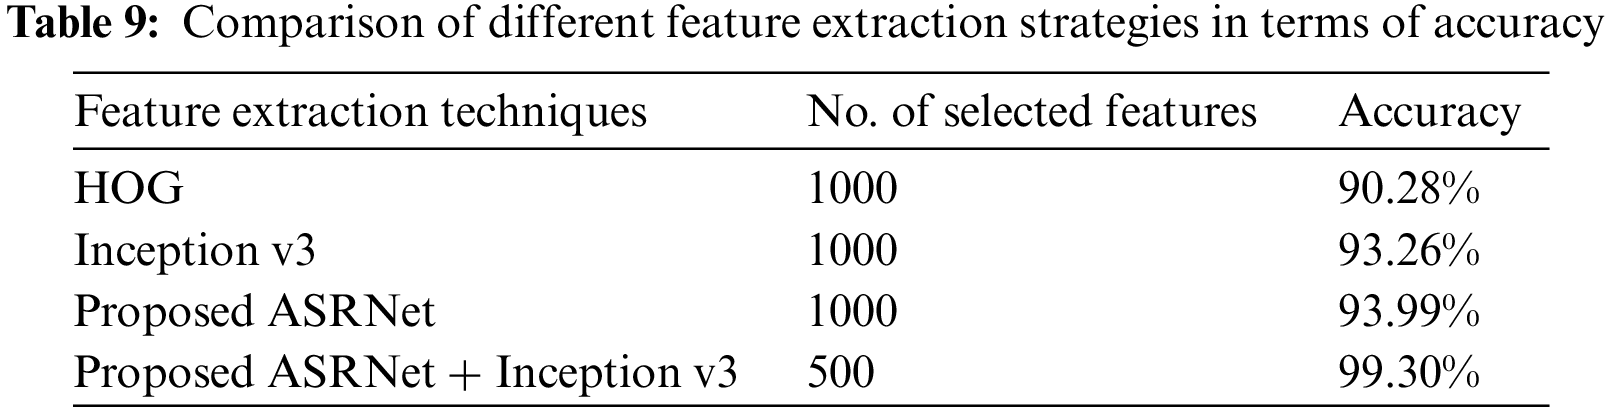
4.4.6 Comparison of Different Feature Extraction Techniques
Many experiments are performed using different deep-learning models. However, only a few of them are discussed in this section. A comparison of different feature extraction techniques with the proposed method is carried out to show the proposed framework’s effectiveness in feature extraction. The proposed framework achieves the highest accuracy. The comparison of different feature extraction techniques is shown in Table 9. Inception v3 attained an accuracy of 93% on 1000 selected features. Similarly, the proposed ARSNet architecture obtained comparable accuracy to Inception v3 on 1000 features. It can be observed from the tabular comparison that the proposed framework performs better compared to Inception v3 and the proposed ASRNet due to the fusion of ARSNet and Inception v3 features serially. It achieves an accuracy of 99% on 500 selected features.
In this research work, a deep learning framework based on serial feature fusion is proposed for the detection of anomalous situations. ASRNet architecture is proposed and pre-trained on the CIFAR-100 dataset. The deep features are extracted using the proposed ASRNet and Inception V3 architectures from the suspicious activity dataset. The extracted features are fused by leveraging the serial feature fusion method. After feature fusion, the DA is exploited for feature selection. It is evident from the results that the proposed technique tackles the problem of detecting different anomalous situations effectively. Five different experiments were executed by selecting 100, 250, 500, 750, and 1000 features to judge the authenticity of the proposed technique. It was observed from the results that LSVM is the classifier that has taken minimum training time to learn from the dataset and construct hyperplanes/decision boundaries. LSVM also achieved higher prediction speeds with all selected features than other classifiers. Regarding detecting anomalous situations, CSVM achieved the highest accuracies of 99.19% and 99.24% with 750 and 1000 selected features. It shows that with the increased number of selected features, CSVM achieves the highest accuracy in detecting anomalous situations. This demonstrates that CSVM can identify the boundary between the five classes of the prepared dataset more distinctively and has the lowest false alarm rate compared to other classifiers. It further shows that the CSVM more accurately selects and rejects the instances as per the actual class compared to other classifiers. In the future, the proposed framework can be enhanced to train and test all the classes in the suspicious activity dataset. Furthermore, this idea can be extended in other application areas such as predicting insurance fraud detection and detecting fake using deep learning approaches, etc.
Funding Statement: This work was supported by the “Human Resources Program in Energy Technology” of the Korea Institute of Energy Technology Evaluation and Planning (KETEP), granted financial resources from the Ministry of Trade, Industry Energy, Republic of Korea. (No. 20204010600090).
Conflicts of Interest: The authors declare that they have no conflicts of interest to report regarding the present study.
References
1. G. Pang, C. Shen, L. Cao and A. V. D. Hengel, “Deep learning for anomaly detection: A review,” ACM Computing Surveys, vol. 54, no. 2, pp. 1–38, 2021. [Google Scholar]
2. F. Turchini, L. Seidenari, T. Uricchio and A. Del Bimbo, “Deep learning based surveillance system for open critical areas,” Inventions, vol. 3, no. 4, pp. 69, 2018. [Google Scholar]
3. T. Fernando, H. Gammulle, S. Denman, S. Sridharan and C. Fookes, “Deep learning for medical anomaly detection—A survey,” ArXiv Preprint, vol. 1, no. 2, pp. 1–11, 2020. [Google Scholar]
4. Z. Wang, “Deep learning-based intrusion detection with adversaries,” IEEE Access, vol. 6, no. 2, pp. 38367–38384, 2018. [Google Scholar]
5. Y. Yu, J. Long and Z. Cai, “Network intrusion detection through stacking dilated convolutional autoencoders,” Security and Communication Networks, vol. 2017, no. 8, pp. 1–14, 2017. [Google Scholar]
6. D. Kwon, H. Kim, J. Kim and K. J. Kim, “A survey of deep learning-based network anomaly detection,” Cluster Computing, vol. 22, no. 1, pp. 949–961, 2019. [Google Scholar]
7. M. Ahmed, A. N. Mahmood and J. Hu, “A survey of network anomaly detection techniques,” Journal of Network and Computer Applications, vol. 60, no. 5, pp. 19–31, 2016. [Google Scholar]
8. J. Y. Kim, S. J. Bu and S. B. Cho, “Zero-day malware detection using transferred generative adversarial networks based on deep autoencoders,” Information Sciences, vol. 460, no. 6, pp. 83–102, 2018. [Google Scholar]
9. Y. J. Zheng, X. H. Zhou, W. G. Sheng and S. Y. Chen, “Generative adversarial network based telecom fraud detection at the receiving bank,” Neural Networks, vol. 102, no. 5, pp. 78–86, 2018. [Google Scholar] [PubMed]
10. Z. Zhang, X. Zhou, X. Zhang and P. Wang, “A model based on convolutional neural network for online transaction fraud detection,” Security and Communication Networks, vol. 2018, no. 8, pp. 1–21, 2018. [Google Scholar]
11. Q. Guo, Z. Li, B. An, P. Hui and M. Zhao, “Securing the deep fraud detector in large-scale e-commerce platform via adversarial machine learning approach,” The World Wide Web Conference, vol. 2, no. 5, pp. 616–626, 2019. [Google Scholar]
12. A. Howedi, A. Lotfi and A. Pourabdollah, “An entropy-based approach for anomaly detection in activities of daily living in the presence of a visitor,” Entropy, vol. 22, no. 8, pp. 845, 2020. [Google Scholar] [PubMed]
13. M. M. Rahaman, C. Li, Y. Yao, F. Kulwa and M. A. Rahman, “Identification of covid-19 samples from chest x-ray images using deep learning: A comparison of transfer learning approaches,” Journal of X-ray Science and Technology, vol. 11, no. 2, pp. 1–19, 2020. [Google Scholar]
14. S. W. Yahaya, A. Lotfi and M. Mahmud, “A consensus novelty detection ensemble approach for anomaly detection in activities of daily living,” Applied Soft Computing, vol. 83, no. 5, pp. 105613, 2019. [Google Scholar]
15. M. Zerkouk and B. Chikhaoui, “Spatio-temporal abnormal behavior prediction in elderly persons using deep learning models,” Sensors, vol. 20, no. 8, pp. 2359, 2020. [Google Scholar] [PubMed]
16. S. W. Yahaya, A. Lotfi and M. Mahmud, “Detecting anomaly and its sources in activities of daily living,” SN Computer Science, vol. 2, no. 1, pp. 1–18, 2021. [Google Scholar]
17. B. R. Kiran, D. M. Thomas and R. Parakkal, “An overview of deep learning based methods for unsupervised and semi-supervised anomaly detection in videos,” Journal of Imaging, vol. 4, no. 2, pp. 36, 2018. [Google Scholar]
18. R. Nawaratne, D. Alahakoon, D. De Silva and X. Yu, “Spatiotemporal anomaly detection using deep learning for real-time video surveillance,” IEEE Transactions on Industrial Informatics, vol. 16, no. 1, pp. 393–402, 2019. [Google Scholar]
19. K. Simonyan and A. Zisserman, “Two-stream convolutional networks for action recognition in videos,” Advances in Neural Information Processing Systems, vol. 6, no. 2, pp. 568–576, 2014. [Google Scholar]
20. M. Sabokrou, M. Fayyaz, M. Fathy and R. Klette, “Deep-cascade: Cascading 3D deep neural networks for fast anomaly detection and localization in crowded scenes,” IEEE Transactions on Image Processing, vol. 26, no. 4, pp. 1992–2004, 2017. [Google Scholar] [PubMed]
21. M. Ullah, M. M. Yamin, A. Mohammed, S. D. Khan, H. Ullah et al., “Attention-based LSTM network for action recognition in sports,” Electronic Imaging, vol. 2021, no. 6, pp. 302-1–302-5, 2021. [Google Scholar]
22. S. Ul Amin, M. Ullah, M. Sajjad, F. A. Cheikh, M. Hijji et al., “EADN: An efficient deep learning model for anomaly detection in videos,” Mathematics, vol. 10, no. 9, pp. 1555, 2022. https://doi.org/10.3390/math10091555 [Google Scholar] [CrossRef]
23. Y. Liu, J. Liu, X. Zhu, D. Wei, X. Huang et al., “Learning task-specific representation for video anomaly detection with spatial-temporal attention,” in IEEE Int. Conf. on Acoustics Speech and Signal Processing (ICASSP), NY, USA, pp. 2190–2194, 2022. [Google Scholar]
24. S. Vosta and K. C. Yow, “A cnn-rnn combined structure for real-world violence detection in surveillance cameras,” Applied Sciences, vol. 12, no. 3, pp. 1021, 2022. [Google Scholar]
25. Y. Liu, J. Liu, M. Zhao, S. Li and L. Song, “Collaborative normality learning framework for weakly supervised video anomaly detection,” IEEE Transactions on Circuits and Systems II: Express Briefs, vol. 69, no. 5, pp. 2508–2512, 2022. [Google Scholar]
26. C. W. Chang, C. Y. Chang and Y. Y. Lin, “A hybrid CNN and LSTM-based deep learning model for abnormal behavior detection,” Multimedia Tools and Applications, vol. 81, no. 9, pp. 11825–11843, 2022. [Google Scholar]
27. J. Jiang, X. Y. Wang, M. Gao, J. Pan, C. Zhao et al., “Abnormal behavior detection using streak flow acceleration,” Applied Intelligence, vol. 52, no. 9, pp. 10632–10649, 2022. [Google Scholar]
28. B. Sabzalian, H. Marvi and A. Ahmadyfard, “Deep and sparse features for anomaly detection and localization in video,” in 2019 4th Int. Conf. on Pattern Recognition and Image Analysis (IPRIA), NY, USA, pp. 173–178, 2019. [Google Scholar]
29. K. Deepak, G. Srivathsan, S. Roshan and S. Chandrakala, “Deep multi-view representation learning for video anomaly detection using spatiotemporal autoencoders,” Circuits Systems, and Signal Processing, vol. 40, no. 3, pp. 1333–1349, 2021. [Google Scholar]
30. F. Rezaei and M. Yazdi, “A new semantic and statistical distance-based anomaly detection in crowd video surveillance,” Wireless Communications and Mobile Computing, vol. 2021, no. 6, pp. 1–21, 2021. [Google Scholar]
31. Z. Ilyas, Z. Aziz, T. Qasim, N. Bhatti and M. F. Hayat, “A hybrid deep network based approach for crowd anomaly detection,” Multimedia Tools and Applications, vol. 80, no. 16, pp. 24053–24067, 2021. [Google Scholar]
32. A. Chriki, H. Touati, H. Snoussi and F. Kamoun, “Deep learning and handcrafted features for one-class anomaly detection in UAV video,” Multimedia Tools and Applications, vol. 80, no. 2, pp. 2599–2620, 2021. [Google Scholar]
33. F. Rezaei and M. Yazdi, “Real-time crowd behavior recognition in surveillance videos based on deep learning methods,” Journal of Real-Time Image Processing, vol. 18, no. 5, pp. 1669–1679, 2021. [Google Scholar]
34. P. Agrawal, T. Ganesh, D. Oliva and A. W. Mohamed, “S-shaped and v-shaped gaining-sharing knowledge-based algorithm for feature selection,” Applied Intelligence, vol. 52, no. 1, pp. 81–112, 2022. [Google Scholar]
35. S. Mirjalili, “Dragonfly algorithm: A new meta-heuristic optimization technique for solving single objective, discrete, and multi-objective problems,” Neural Computing and Applications, vol. 27, no. 4, pp. 1053–1073, 2016. [Google Scholar]
36. C. W. Reynolds, “Flocks, herds and schools: A distributed behavioral model,” in Proc. of the 14th Annual Conf. on Computer Graphics and Interactive Techniques, Chennai, India, pp. 25–34, 1987. [Google Scholar]
37. H. Kuehne, H. Jhuang, E. Garrote and T. Serre, “HMDB: A large video database for human motion recognition,” in 2011 Int. Conf. on Computer Vision, Berlin, Spain, pp. 2556–2563, 2011. [Google Scholar]
38. C. Kyrkou and T. Theocharides, “Deep-learning-based aerial image classification for emergency response applications using unmanned aerial vehicles,” in Computer Vision and Pattern Recognition Workshops, NY, USA, pp. 517–525, 2019. [Google Scholar]
Cite This Article
 Copyright © 2023 The Author(s). Published by Tech Science Press.
This work is licensed under a Creative Commons Attribution 4.0 International License , which permits unrestricted use, distribution, and reproduction in any medium, provided the original work is properly cited.
 Downloads
 Citation Tools