
 Submit a Paper
 Propose a Special lssue
 Open Access
ARTICLE

Exploiting Data Science for Measuring the Performance of Technology Stocks
1 Department of Creative Technologies, Air University, Islamabad, 44230, Pakistan
2 School of Computer Science and Engineering, Kyungpook National University, Daegu, 41566, Korea
* Corresponding Author: Dongsun Kim. Email:
Computers, Materials & Continua 2023, 76(3), 2979-2995. https://doi.org/10.32604/cmc.2023.036553
Received 04 October 2022; Accepted 22 February 2023; Issue published 08 October 2023
 View Full Text
 Download PDF
Abstract
The rise or fall of the stock markets directly affects investors’ interest and loyalty. Therefore, it is necessary to measure the performance of stocks in the market in advance to prevent our assets from suffering significant losses. In our proposed study, six supervised machine learning (ML) strategies and deep learning (DL) models with long short-term memory (LSTM) of data science was deployed for thorough analysis and measurement of the performance of the technology stocks. Under discussion are Apple Inc. (AAPL), Microsoft Corporation (MSFT), Broadcom Inc., Taiwan Semiconductor Manufacturing Company Limited (TSM), NVIDIA Corporation (NVDA), and Avigilon Corporation (AVGO). The datasets were taken from the Yahoo Finance API from 06-05-2005 to 06-05-2022 (seventeen years) with 4280 samples. As already noted, multiple studies have been performed to resolve this problem using linear regression, support vector machines, deep long short-term memory (LSTM), and many other models. In this research, the Hidden Markov Model (HMM) outperformed other employed machine learning ensembles, tree-based models, the ARIMA (Auto Regressive Integrated Moving Average) model, and long short-term memory with a robust mean accuracy score of 99.98. Other statistical analyses and measurements for machine learning ensemble algorithms, the Long Short-Term Model, and ARIMA were also carried out for further investigation of the performance of advanced models for forecasting time series data. Thus, the proposed research found the best model to be HMM, and LSTM was the second-best model that performed well in all aspects. A developed model will be highly recommended and helpful for early measurement of technology stock performance for investment or withdrawal based on the future stock rise or fall for creating smart environments.Keywords
Forecasting future stock movement trends is essential for gaining the most profit. The political state of affairs within the region, economic factors, rumors, and capitalist sentiments with a high degree of noise are the causes of instability in the exchange [1]. For several years, analyzers believed that researchers could not predict the stock’s movement in the longer term. This belief came into existence from the stochastic process theory [2–4] and the efficient market hypothesis (EMH) [5,6]. In [7], the researcher declared that the forecasting accuracy of the future movement of stocks could be only 50%. Other researchers also concluded that the equity market is forecasted to some extent [8–12]. Investors will only beat the market if they correctly predict or measure performance in terms of the stock market’s rise or fall over time. As monetary markets are dynamic, noisy, non-parametric, and chaotic, there is an enormous risk for finance within the equity market. To curtail the chance of loss in the stock market, a capitalist has primary data and makes predictions relative to the future movement of stock prices.
Keep in mind firsthand information and forecasting of the rise or fall of stock value, which will assist investors in investing in the right place at the right time with the help of this study. The first and foremost challenge in forecasting is to calculate the accurate picture of the trend and direction of stock movement. Already, many researchers have been carried out to tackle this problem, like linear regression [13], support vector machine [14], deep long short-term memory neural network (LSTM) [15], etc. However, this research work utilized LSTM and machine learning ensembles (tree-based models) to forecast the behavior of the technology stocks, creating higher results than any other state-of-the-art models for stock prediction [16–18]. Graph neural networks are a sophisticated method utilized in financial time series forecasting, especially for heterogeneous datasets [19]. Additionally, advanced models like temporal and heterogeneous graph neural networks for financial time series prediction [20], knowledge graph-guided simultaneous forecasting, and network learning for multivariate financial time series [21] have also been employed for similar tasks. Despite these efforts, these advanced models have yet to surpass the results obtained from the proposed comparative models.
Thus, our objective is to develop comprehensive machine learning (ML) and deep learning (DL) models for forecasting the future direction of stock movements. The proposed model is strongly recommended for homogeneous datasets and may be affected by heterogeneous datasets. Furthermore, this research work employed six ML (ensemble tree-based) and DL-based LSTM models for forecasting the direction of stock price movement: (i) Random Forest Classifier (RF), (ii) XGBoost Classifier (XG), (iii) Bagging Classifier (BC), (iv) Ada Boost Classifier (Ada), (v) Extra Trees Classifier (ET), (vi) Voting Classifier (VC), and (vii) Long Short-Term Memory (LSTM), (viii) Auto-Regressive Integrated Moving Average (ARIMA) model (ix) Hidden Markov Model (HMM).
The structure of the rest of the paper is as follows: Following a brief introduction, Section 2 consists of a comprehensive literature review that is focused on ML and DL models for financial time series forecasting. In Section 3, the proposed methodology is thoroughly discussed, andSection 4 contains a discussion about results and analysis, as well as a concise conclusion in Section 5.
Statistical prognostication could be a high priority for financial analysts in each domain and industry. Scientists and research students in ML have developed various models that have already been published in this regard. Numerous studies have been conducted on deciliter models, such as convolutional neural networks (CNNs), deep belief networks (DBNs), and long short-term memory for targeted financial market forecasting. Several research opportunities exist for interested scholars within the stock exchange movement using DNN and LSTM models. Chong et al. [9] utilized DNN and KOSPI in The Korea Composite Stock Price Index, which is a lagged stock return used for predicting stock prices. DNN increased accuracy and provided supplementary information from the auto-regressive model’s residuals, but the auto-regressive model did not provide the desired results. In addition, the predictive network showed improved results in covariance-based market structure. Our research contribution in this field will provide practicability and pave the way to analyze and predict stock market movements successfully. Chen et al. [22] and Dezsi et al. [23] used raw pricing records through the use of the LSTM model. Chen et al. [22] provided a model to predict China’s stock returns. Historical data of the Chinese stock market was transformed into thirty days sequence with ten learning features and three-day earning rate labeling. The LSTM model was trained on 900000 sequential data inputs and was tested on the remaining 311361 sequential data inputs. The proposed LSTM model progressed the accuracy of stock returns from 14.3% to 27.2% compared to a random prediction model.
Moreover, it established the effectiveness of LSTM in the Chinese stock market. Dezsi et al. [23] predicted the future directions of the data from the Romanian financial markets with the help of the Recurrent Neural Network (RNN) model and LSTM model. They then attempted to compare the results using traditional statistical modeling tools. Moreover, LSTM should be a tool for balancing portfolios and lowering market risk. In their study, Samarawickrama et al. [24] investigated the use of Recurrent Neural Networks (RNN) for predicting the daily stock values of well-known companies listed on the Colombo Stock Exchange (CSE). To achieve this, they tested different RNN architectures, including Feed-forward, Simple RNN (SRNN), Gated Recurrent Unit (GRU), and Long Short-Term Memory (LSTM). Their input features consisted of each company’s closing, high, and low prices from previous trading days. By analyzing and comparing the performance of these models, the authors aimed to provide insights into the effectiveness of RNNs for predicting stock prices in the CSE. The use of feed-forward networks produced the highest and lowest forecasts. The feed-forward networks were carried out thoroughly and confirmed an accuracy of around 99%. Compared to feed-forward networks, SRNN and LSTM networks frequently produce minimal errors but rarely produce higher errors. GRU networks confirmed more significant forecasting mistakes compared to different feed-forward networks.
Hiransha et al. [25] used four deep learning techniques to predict an enterprise’s stock price primarily based on historical data: those models are Multilayer Perceptron (MLP), RNN, LSTM, and CNN. In [25], research work used day-by-day stock statistics of the New York Stock Exchange (NYSE) and the National Stock Exchange of India (NSE). The model has been developed for the stock prices of a single NSE inventory and anticipated on five one-of-a-kind NSE and NYSE businesses. CNN outperformed the other models. Despite being trained in NSE statistics, the network predicted the NYSE. It was obvious that the inner traits of each stock market were similar. These effects outperformed the ARIMA linear model while findings have been as in comparison to the ARIMA model. Lee et al. [26] configured a novel method for developing a data-driven portfolio with a marked risk-return ratio. They begin with a comparison of SRNNs, LSTMs, and GRUs. Deployed models were examined on ten equity samples from the S&P 500. Experiments proved that the LSTM-based predictive model gave better results than the others. Moreover, they developed a “threshold-based portfolio (TBP)” predictive model. TBPs are rebalanced monthly to ensure that their constituents are of equal weight. Moreover, they provide a multiperiod TBP management strategy and describe how TBP may reduce estimation risk in mean-variance portfolios. Li et al. [27] introduced a new technique based on deep belief networks (DBNs) with inherent flexibility for predicting stock closing prices. The performance of the stock in the S&P 500 is examined in the tests. The back-propagation technique is utilized for output training, enabling the adjustment of structural parameters with minimal modifications. The network’s intrinsic plasticity (IP) is also used to provide its adaptive capabilities. Learning IP for adaptive neural response to external stimuli is advantageous for optimizing input-output mutual information. Reference [27] findings suggested that using IP learning to improve prediction performance is adequate.
Chen et al. [28] declared that relevant required information might be extracted from datasets of financial stocks without acquiring prior knowledge. They recommended that a DL-based predictive model, an autoencoder, and a limited Boltzmann machine be used collectively to improve the results. The study findings indicated that the Deep Learning (DL) approach yielded superior directional prediction accuracy and fitting degree results compared to other neural networks such as back-propagation, the extreme learning machine, and the radial basis function neural network. Additionally, the model’s performance may be further enhanced by accumulating datasets. These results suggest that DL can effectively capture the non-linear aspects of transaction data, making it a valuable tool for financial market investors seeking to forecast stock index futures. Krauss et al. [29] used gradient-boosted trees (GBT), deep neural networks (DNN), and numerous ensemble models for S &P 500 stocks. After survivor bias is removed, each model is trained on the lagged returns of all stocks in the S&P 500. From 1992 to 2015, trading signals were generated daily based on a probability estimate of a stock outperforming the broader market. The most likely k probabilities transformed into long positions, while the least likely k probabilities transformed into short positions, thereby suppressing an uncertain ranking section. The results of this research are encouraging. Before transaction costs, DNN, GBT, and RF showed out-of-sample returns of more than 45 percent for k = 10 daily, which is an equal-weighted ensemble (ENS1) technique. Chandra et al. [30] explored disorderly time series problems. Chandra et al. [30] used two main models, RNNs and decomposition approaches of training feed-forward in the NASDAQ stock exchange. They discussed the major concerns of real-time execution and provided a mobile application for predicting financial time series in response.
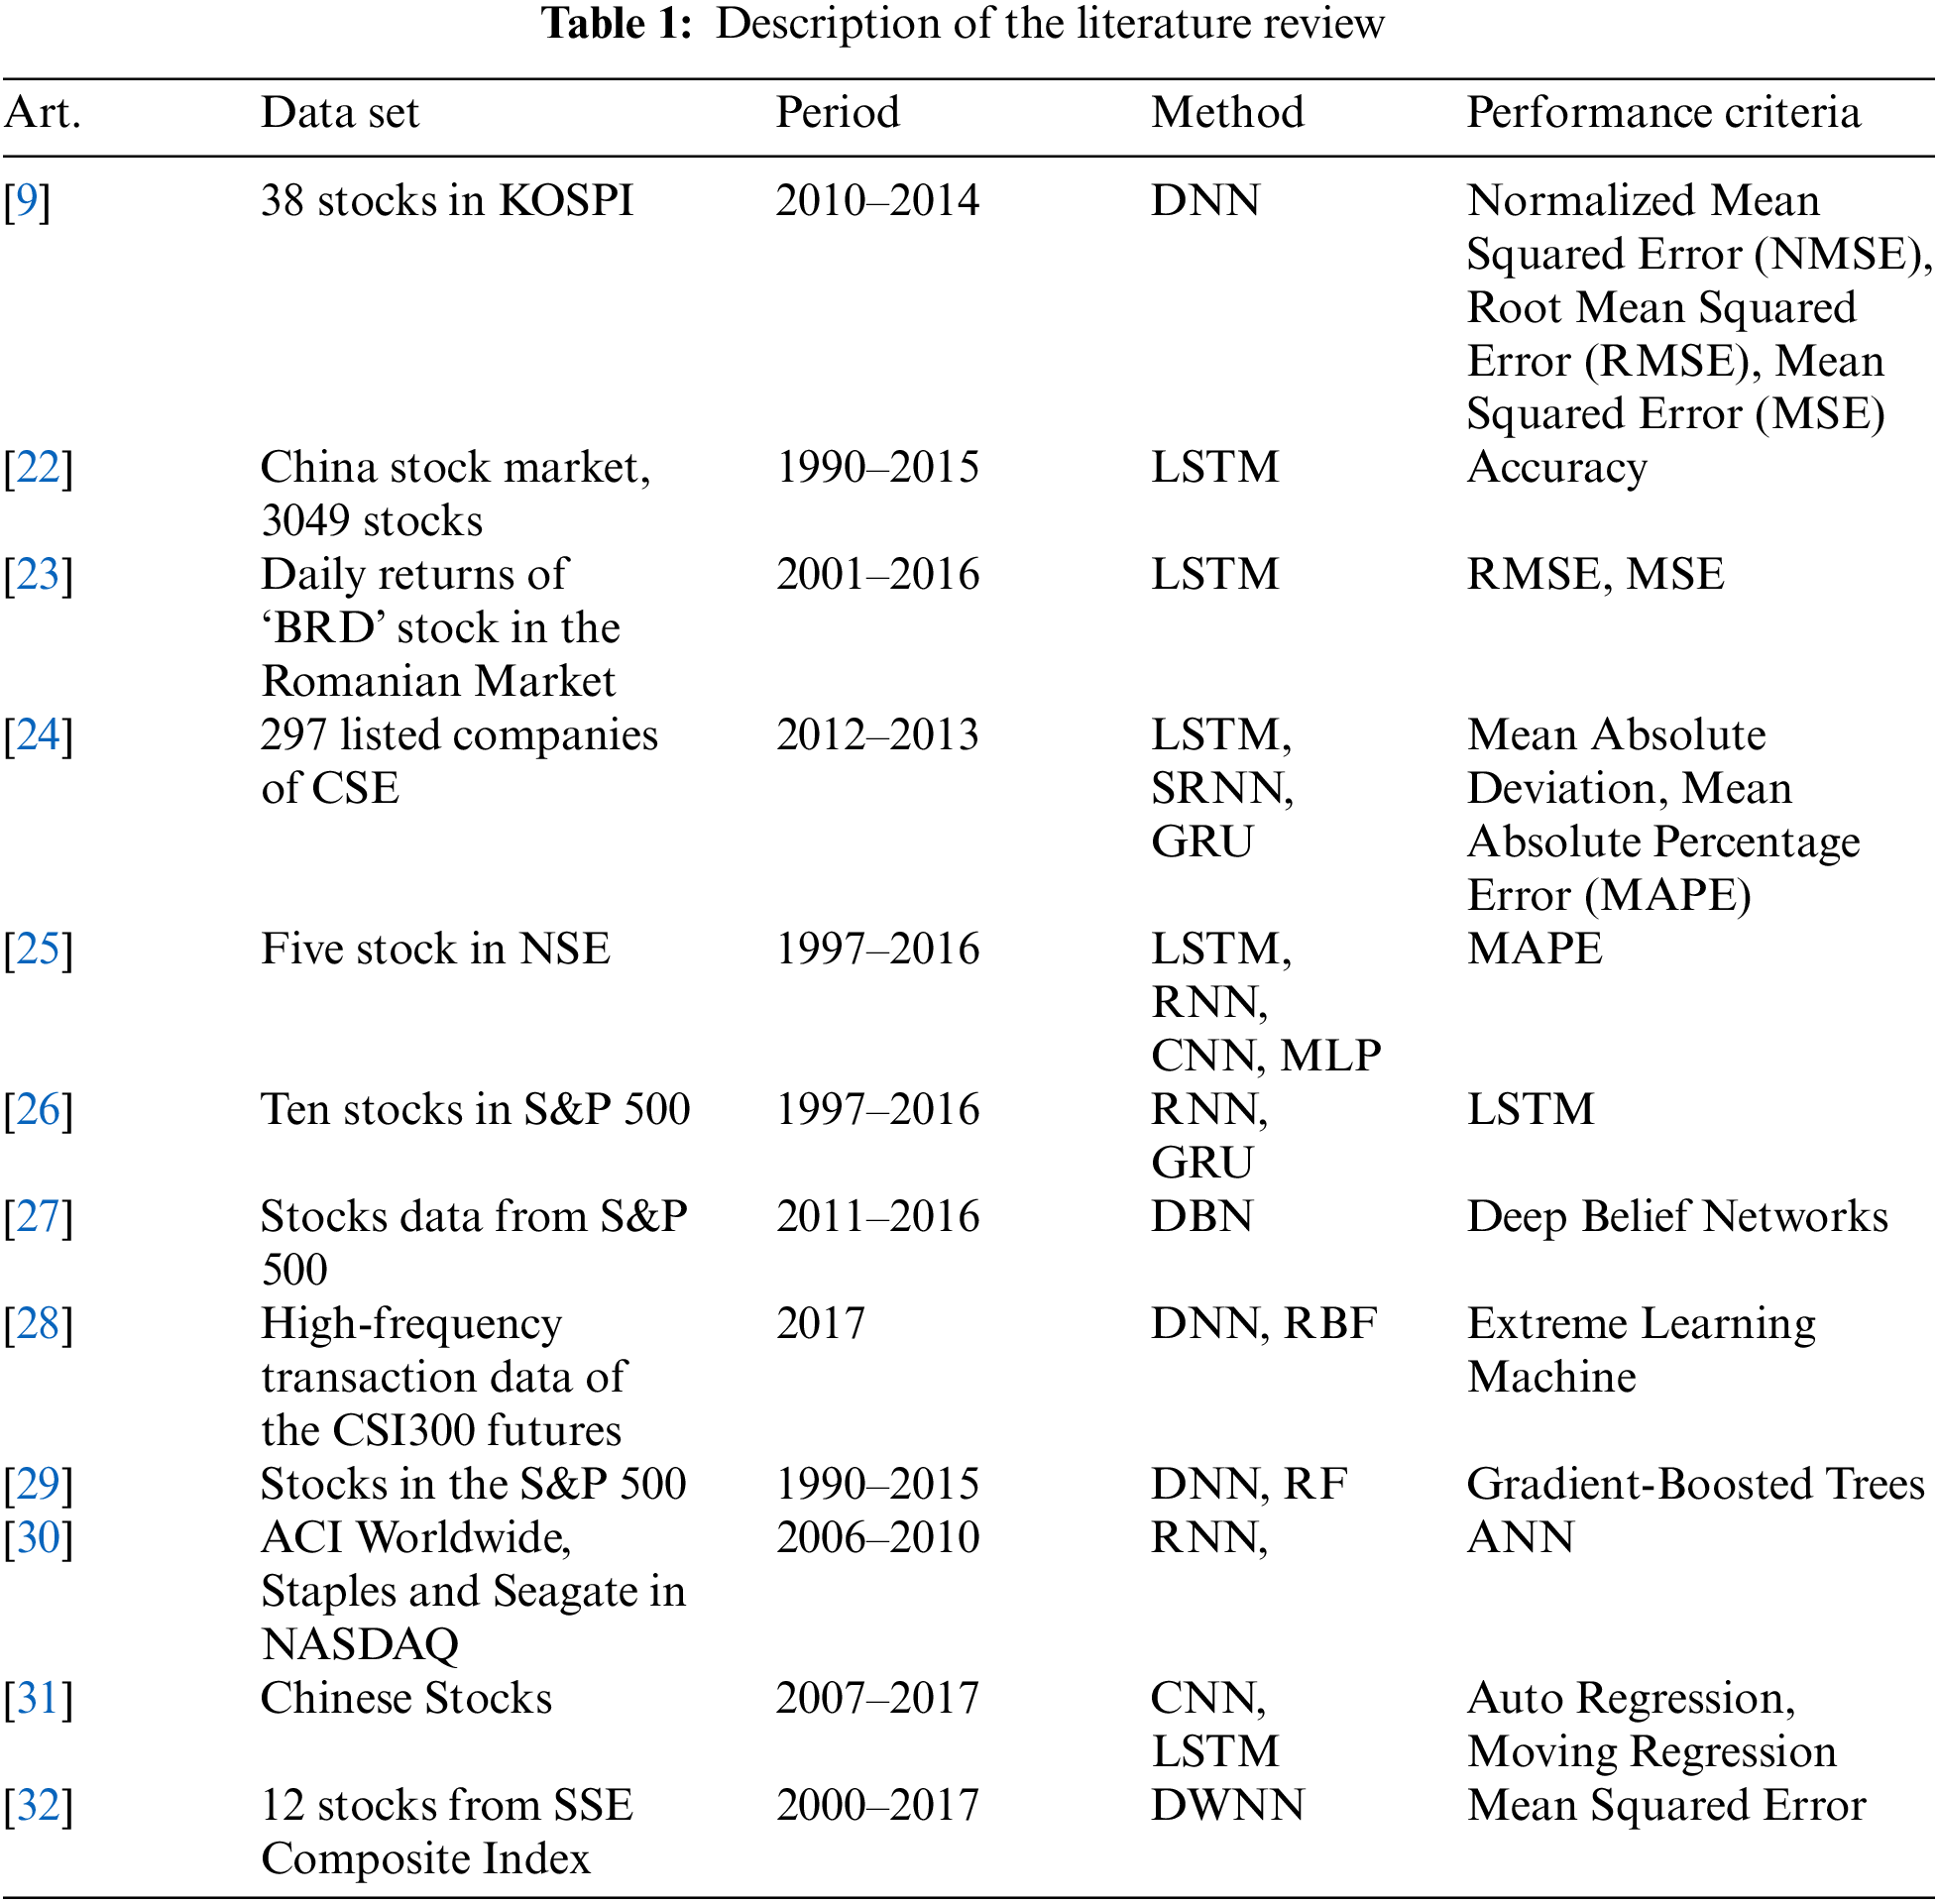
Moreover, this study suggested that RNNs may outperform feed-forward networks in real-world time series issues. Moreover, the researcher of [31] employed CNN+LSTM for the prediction of Chinese Stocks and reference [32] projected the novel idea of Deep and Wide Neural Network (DWNN) as it uses both RNN and CNN for forecasting 12 stocks from the SSE Composite Index. Table 1 describes this section in detail.
The application programming interface (API) of Yahoo Finance is used to obtain stock data for forecasting technology stocks. Furthermore, technical indicators are calculated to account for price changes over time. The data is subjected to three pre-processing steps: (i) data cleaning to deal with missing and incorrect data; (ii) data standardization, which is required for machine learning models to function correctly; and (iii) feature extraction from tree-based ensemble ML models trained on technology stocks. For the analysis of technology stocks, various evaluation metrics were used. Furthermore, Fig. 1 depicts the steps taken in this study.
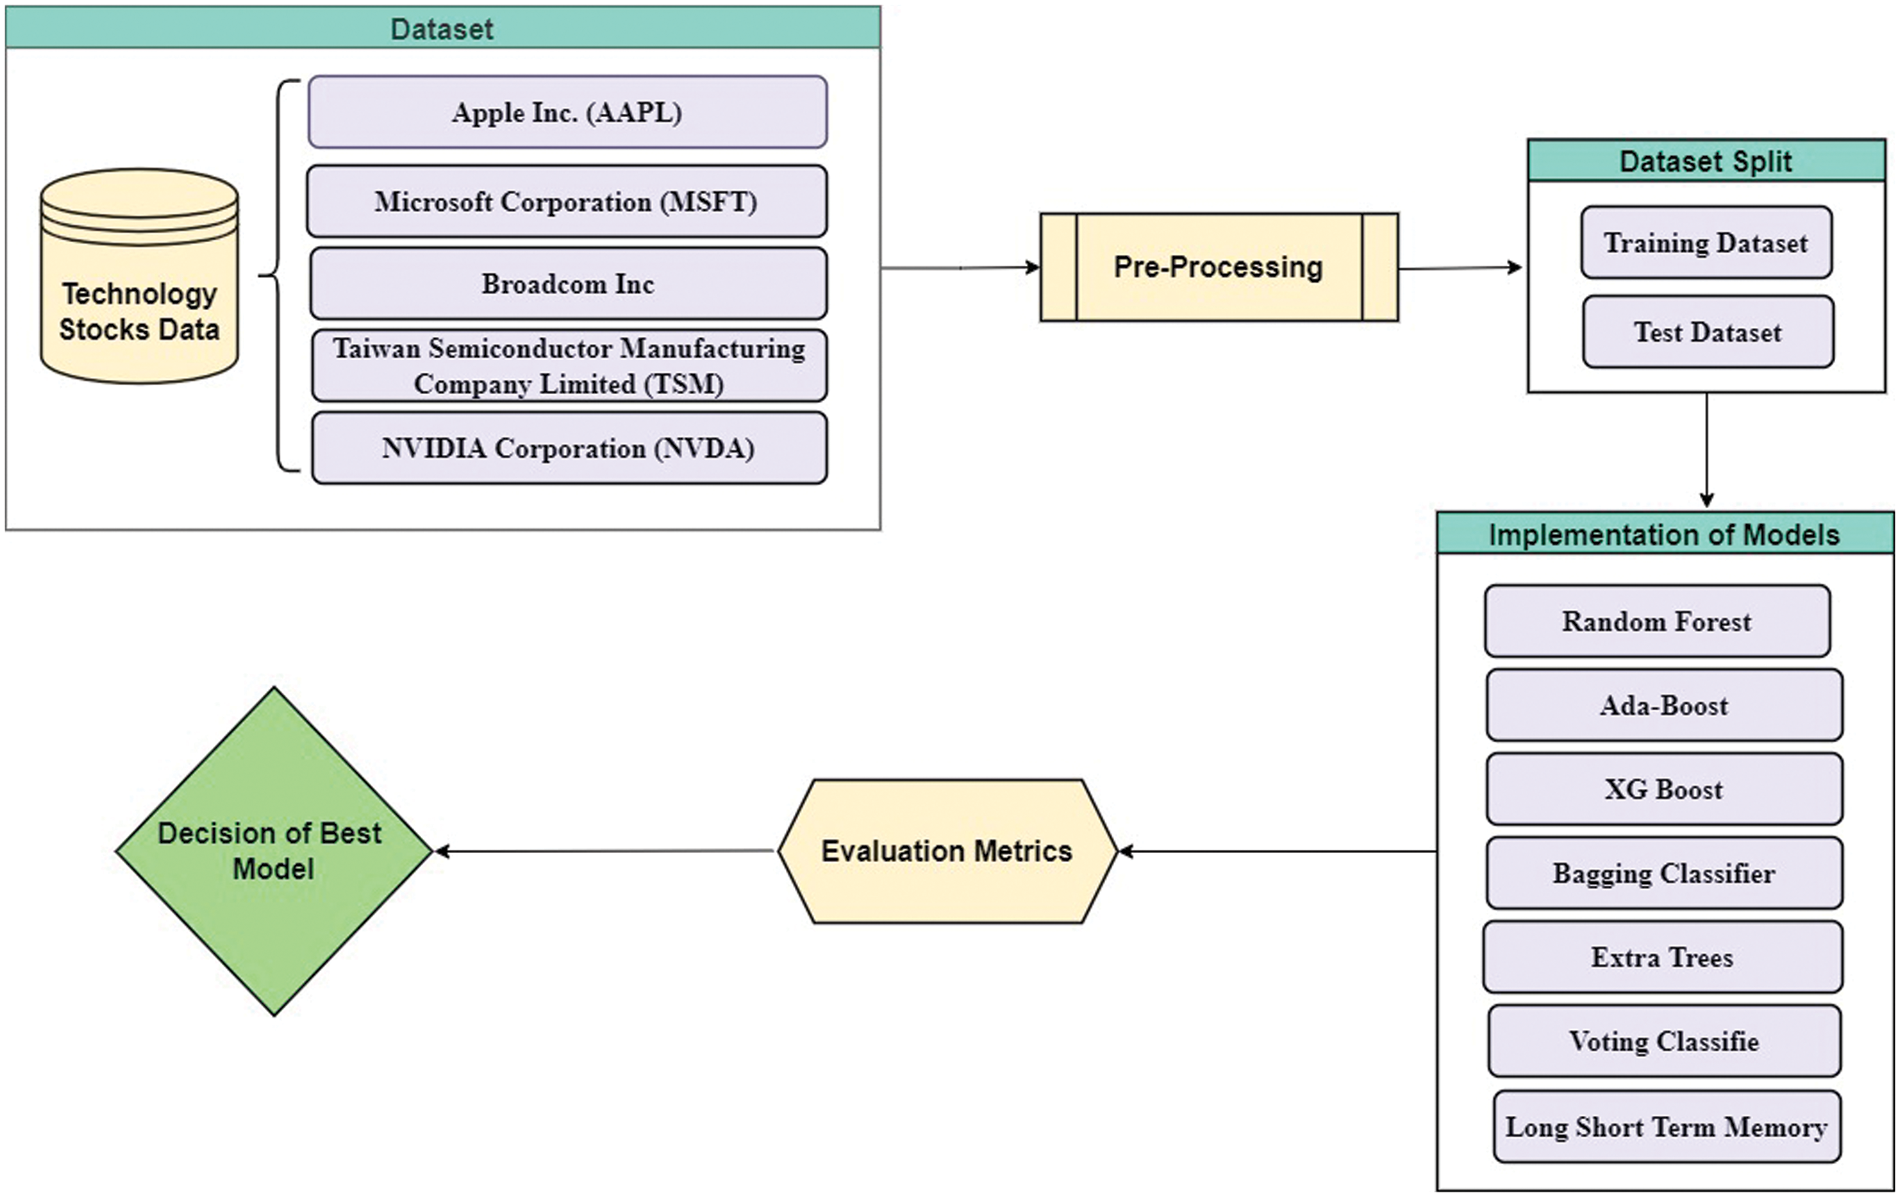
Figure 1: The workflow of proposed comparative models
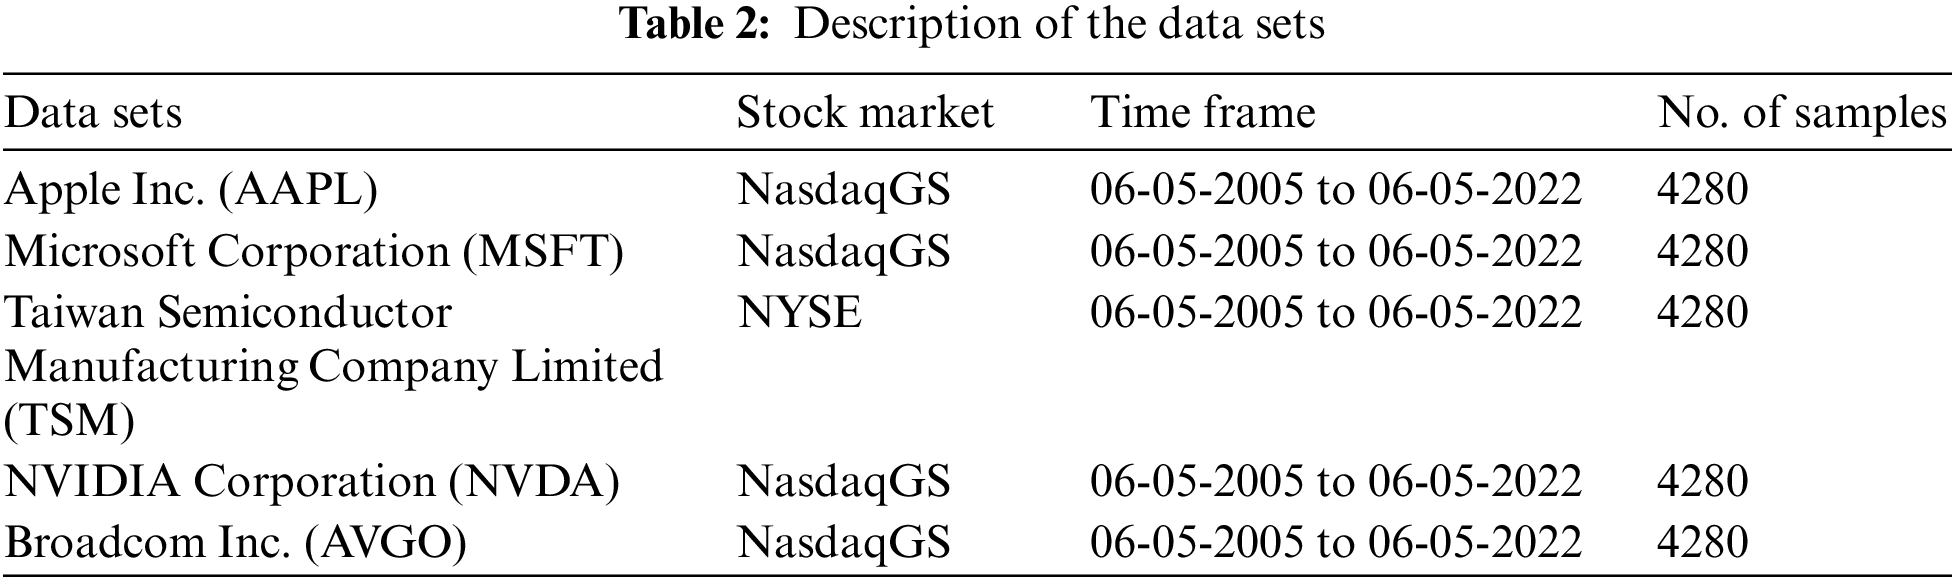
Two stock exchanges (the National Association of Securities Dealers Automated Quotations System Global Market Composite (NASDAQGS) and the New York Stock Exchange (NYSE)) were used for the collection of datasets on five technology stocks. Apple Inc. (AAPL), Microsoft Corporation (MSFT), NVIDIA Corporation (NVDA), Broadcom Inc. (AVGO), and Taiwan Semiconductor Manufacturing Company Limited (TSM) are among the technology stocks discussed below. Table 2 presents a breakdown of the datasets used in the study, consisting of seven features: data, open, high, low, close, and volume. Specifically, the study aimed to forecast technology stocks by utilizing the “close” feature as the target variable. Moreover, a brief description of technology stocks is given below.
Apple Inc. is a global organization that designs, manufactures, and sells tablets, smartphones, wearables, desktops, and accessories. In addition to the iPad, a line of multi-purpose tablets, the company offers the Mac, a type of personal computer; Air Pods Max, over-the-ear wireless headphones; the iPhone, a line of smartphones; and wearables and accessories, which include Air Pods, Beats products, Apple Watch, Apple TV, and Home Pods. Apple also has licensed its intellectual property and offers Apple TV+, which delivers unique original content, subscription news, and magazine services, a co-branded credit card, and a cashless payment service (Apple Pay). Cellular network providers and different app stores are used to distribute their products as third-party agents. It was founded in 1977 and is located in Cupertino, California1. This research used stock data from May 06, 2005, to May 06, 2022 (seventeen years) with 4280 samples2.
3.1.2 Microsoft Corporation (MSFT)
Microsoft Corporation is the world’s leading manufacturer of computer software systems and applications. Microsoft Corporation is more than just a software development company; it also provides e-mail services, manufactures hybrid tablet computers, computer peripherals, and electronic game systems, creates multimedia titles, and publishes books. It has franchises throughout the world. Its headquarters are in Redmond, Washington, USA, where it conducts research and development. Microsoft has research facilities in Montreal, Canada; New York; Cambridge, Massachusetts; Beijing, China; and Bengaluru, India. Microsoft created a new browser, Internet Explorer, to assist Internet service providers and computer manufacturers, and integrated it with the Windows operating system. Microsoft has also been involved in multimedia and gaming technology since 2001. It was the first to introduce the Xbox, Xbox Live, and the Xbox 360. These electronic game consoles quickly dominated the market. Microsoft purchased Skype and LinkedIn in 2011 and 2016, with the most significant acquisitions totaling $8.5 billion and $26.2 billion, respectively3. This study used 4280 samples and stock data from May 06, 2005, to May 06, 2022 (seventeen years)4.
3.1.3 Taiwan Semiconductor Manufacturing Company Limited (TSM)
TSMC is an abbreviation of Taiwan Semiconductor Manufacturing Company, Limited, also called Taiwan Semiconductor. TSMC is the largest company in Taiwan and the world. Hsinchu Science Park is headquartered in Hsinchu and was founded in 1987. Foreign investors run this company. Leading companies like ARM, Apple, AMD, Marvell, Broadcom, Nvidia, etc., are the customers of TSMC. A few companies like Intel, Texas Instruments, NXP, and ST Microelectronics, which have their fabrication facilities, outsource their production to TSMC. Through its design IP portfolio and ASIC planning services, LSI resells TSMC wafers. As of 2020, TSMC can produce around 13 million 300-mm-equivalent wafers annually. It was created at 5 and 7 nanometers (nm) and was used in the Apple A14 in 2020. Moreover, it is the largest exporter of EUV lithography technology. Compared to the previous technology, N7+ EUV lithography technology offers a 10% decrease in power consumption and a 15%–20% higher transistor density. The N5 iteration improves the capability by an additional 15% and doubles the transistor density. In 2019, TSMC released the N7, N7+, and N6 technologies, which are prominent edge technologies, and projected their vision for 2022, which included the inclusion of more than 3 nm semiconductor nodes in theirproduction5. The researchers used stock data from May 06, 2005, to May 06, 2022 (seventeen years) and 4280 samples6.
3.1.4 NVIDIA Corporation (NVDA)
CEO Jensen Huang, a Taiwanese-American, established NVIDIA in 1993. NVIDIA Corporation started its work with just $40,000, and initially, it was called NV but later declared its name “Invidia”. In 1993, the co-founders of NVIDIA announced that graphics-based computing could solve problems that simple computers face, such as the high volume of video game sales. Improvements in video game graphics were a flywheel for the company and gave it new heights in the marketplace7. This research used stock data from May 06, 2005, to May 06, 2022 (seventeen years) and 4280 samples8.
Broadcom Inc., an American company, is situated in San Jose, California. It produces semiconductors and structures the software. Broadcom is a manufacturer, designer, and developer that provides networking, data center, wireless, broadband, and storage systems for different companies. Broadcom’s standard products are smartphones, data center networking, broadband access, telecommunications equipment, home connectivity, application software development, etc. Moreover, it is trading chips and storage media for the industry. In 2014, it was the ninth-largest semiconductor company. Broadcom Corp. strengthened Avago in the Internet of Things, data center, and mobile sectors. In 2017, Broadcom shifted itself from Singapore to Delaware and redesigned its name from Broadcom Ltd. to Broadcom Inc. In 2019, Broadcom acquired the business, as well as the Symantec name and brand, for $10.7 billion in cash9. This research used stock data from May 06, 2005, to May 06, 2022 (seventeen years) with 4280 samples10.
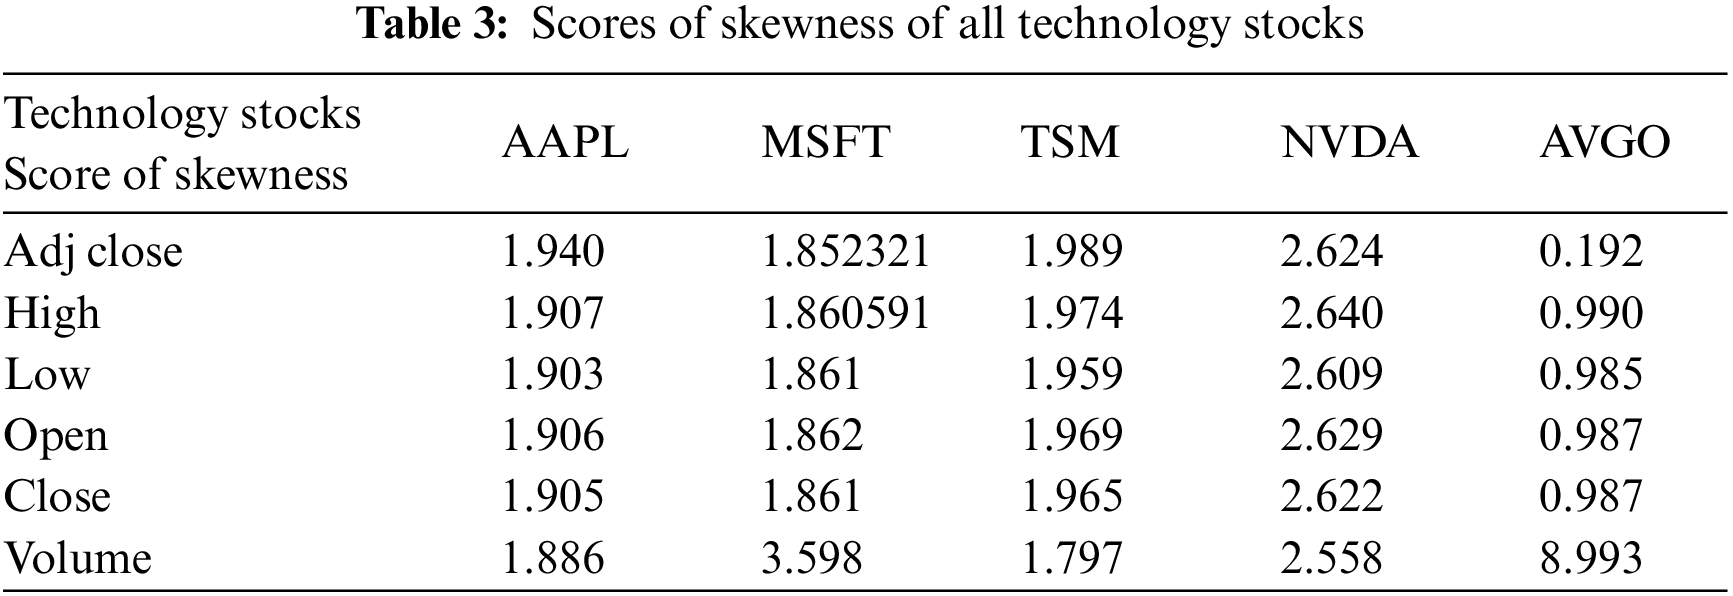
Most of the time, datasets are skewed as their features consist of diverse values and have unequal representation, like stocks with volume balance that have a high value but open and close with a lower value. In such cases, it indicates the sparsity of the data. Thus, it is evident that features with high values can dominate during prediction, leading to false results. Many researchers used linear discriminant analysis, generalized discriminant analysis techniques, and low-variance filters to deal with such problems. The skewness of each feature in our datasets is evident and shows positive skewness, as shown in Table 3. Therefore, for an equal representation of each feature in the dataset, a feature normalization process is carried out with the help of the Z-score (standardization scaling). This research used Standard Scaler from the Sklearn library during pre-processing in Python to normalize features. Standardization scaling transfigures the features as they have characteristics of a Gaussian distribution and are considered mean zero and a unit variance of each feature [33]. After data normalization, feature extraction was carried out to get the required results and statistical measurements of the learning algorithms, which could have performed better due to the high dimensionality of the data. Therefore, PCA, a dimensionality reduction process, is used by importing the Sklearn library with a 95% total number of components in this study, which will be helpful to get the original features with the most relevant and required information. PCA is employed to improve the performance and stability of models in technology stock prediction [34,35].
In the proposed study, a dataset of each stock is divided into two groups, i.e., training and testing. The study employed a training dataset comprising 70% of the available data, with the remaining 30% allocated for the testing phase. Additionally, a 10-fold cross-validation mechanism was utilized for validation purposes.
3.4 Applied Models for Performance Measurement of Technology Stocks Data
Machine learning (ML) algorithms, LSTM (deep learning model), ARIMA, and HMM (time series analysis models) of data science are used to infer the mechanics behind the data efficiently. Often, an observer interprets the exact information from the data, but machine learning algorithms can do it. Many mathematicians and programmers contributed in this regard with devotion to finding the solution to the under-discussion problem, which contains enormous data sets. This research work applied tree-based ensemble learning techniques like Random forest (RF) classifier, Ada Boost, Extra tree, Voting Classifier, XG Boost, Bagging Classifier ML algorithms, LSTM model, and ARIMA, as well as HMM, to forecast the technology stocks well in time [36].
Numerous studies have been conducted to evaluate or predict stock data sets’ performance using machine learning techniques such as linear regression, support vector machine, and deep, long-term memory neural networks (LSTM). However, our investigation has indicated that the Hidden Markov Model (HMM) produced the most satisfactory outcome with a testing accuracy of 99.98%. The second-best-performing model was the LSTM, with a testing accuracy of 97.93%. Additionally, HMM exhibited remarkable results on both training and validation data sets. On the training set, the average accuracy obtained with the best-fit model (HMM) is 99.99%, and on the validation set, it also has good results at around 99.98% on all datasets under consideration. Moreover, the statistical measurements (accuracy) of the ARIMA, HMM, LSTM, and tree-based ensemble ML models using ten-fold cross-validation are shown in Table 3 on the technology datasets. The accuracy of RF varies from 0.643 to 0.793. AdaBoost measurements (accuracy) vary from 0.633 to 0.813. XG Boost measurements vary from 0.629 to 0.803. Statistical measurements vary for BC from 0.579 to 0.769. The ET classifier has accuracy measurements varying from 0.629 to 0.811. Moreover, the accuracy of the LSTM and tree-based ensemble ML models using ten-fold cross-validation is shown in Table 4 for all under-discussion stock datasets. The measurement and accuracy for RF range from 0.643 to 0.793, while those for AdaBoost range from 0.633 to 0.813. XG Boost varies from 0.629 to 0.803. Statistical measurements (accuracy) vary concerning BC from 0.579 to 0.769. ET classifier accuracy ranges from 0.629 to 0.811. The VC measurements vary from 0.647 to 0.809. The statistical measurements of VC measurements range from 0.647 to 0.809; the LSTM is 97.095 to 98.448 for the second-best performing model, and the best-performing model’s accuracies are 97.095 to 98.448. HMM varies from 99.95 to 99.99, and ARIMA models’ accuracy varies from 95.02 to 99.03 on the AAPL, MSFT, TSM, NVDA, and AVGO datasets. This research work found that the mean accuracy of the HMM model outperformed the other discussed ensemble models, LSTM and ARIMA, and a comparison is shown in Fig. 2 and Table 4.
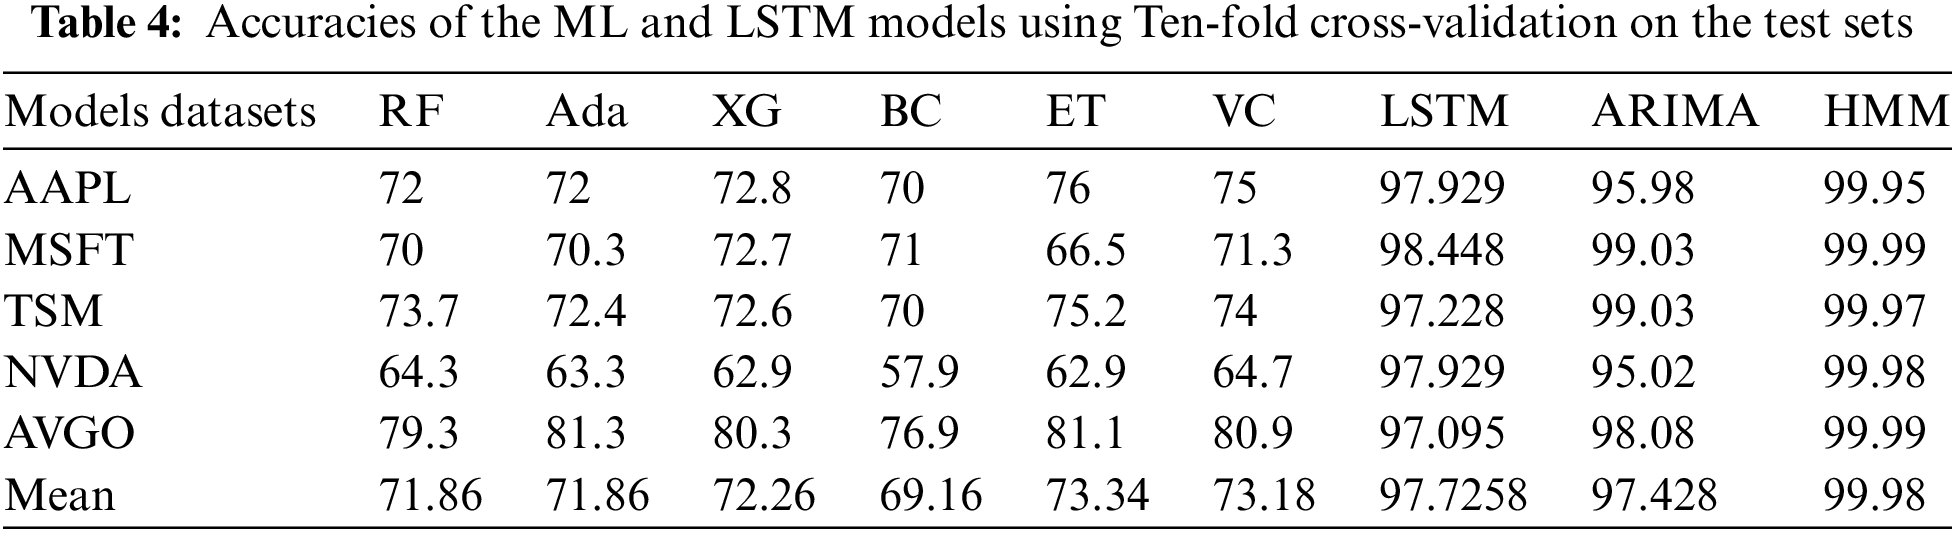
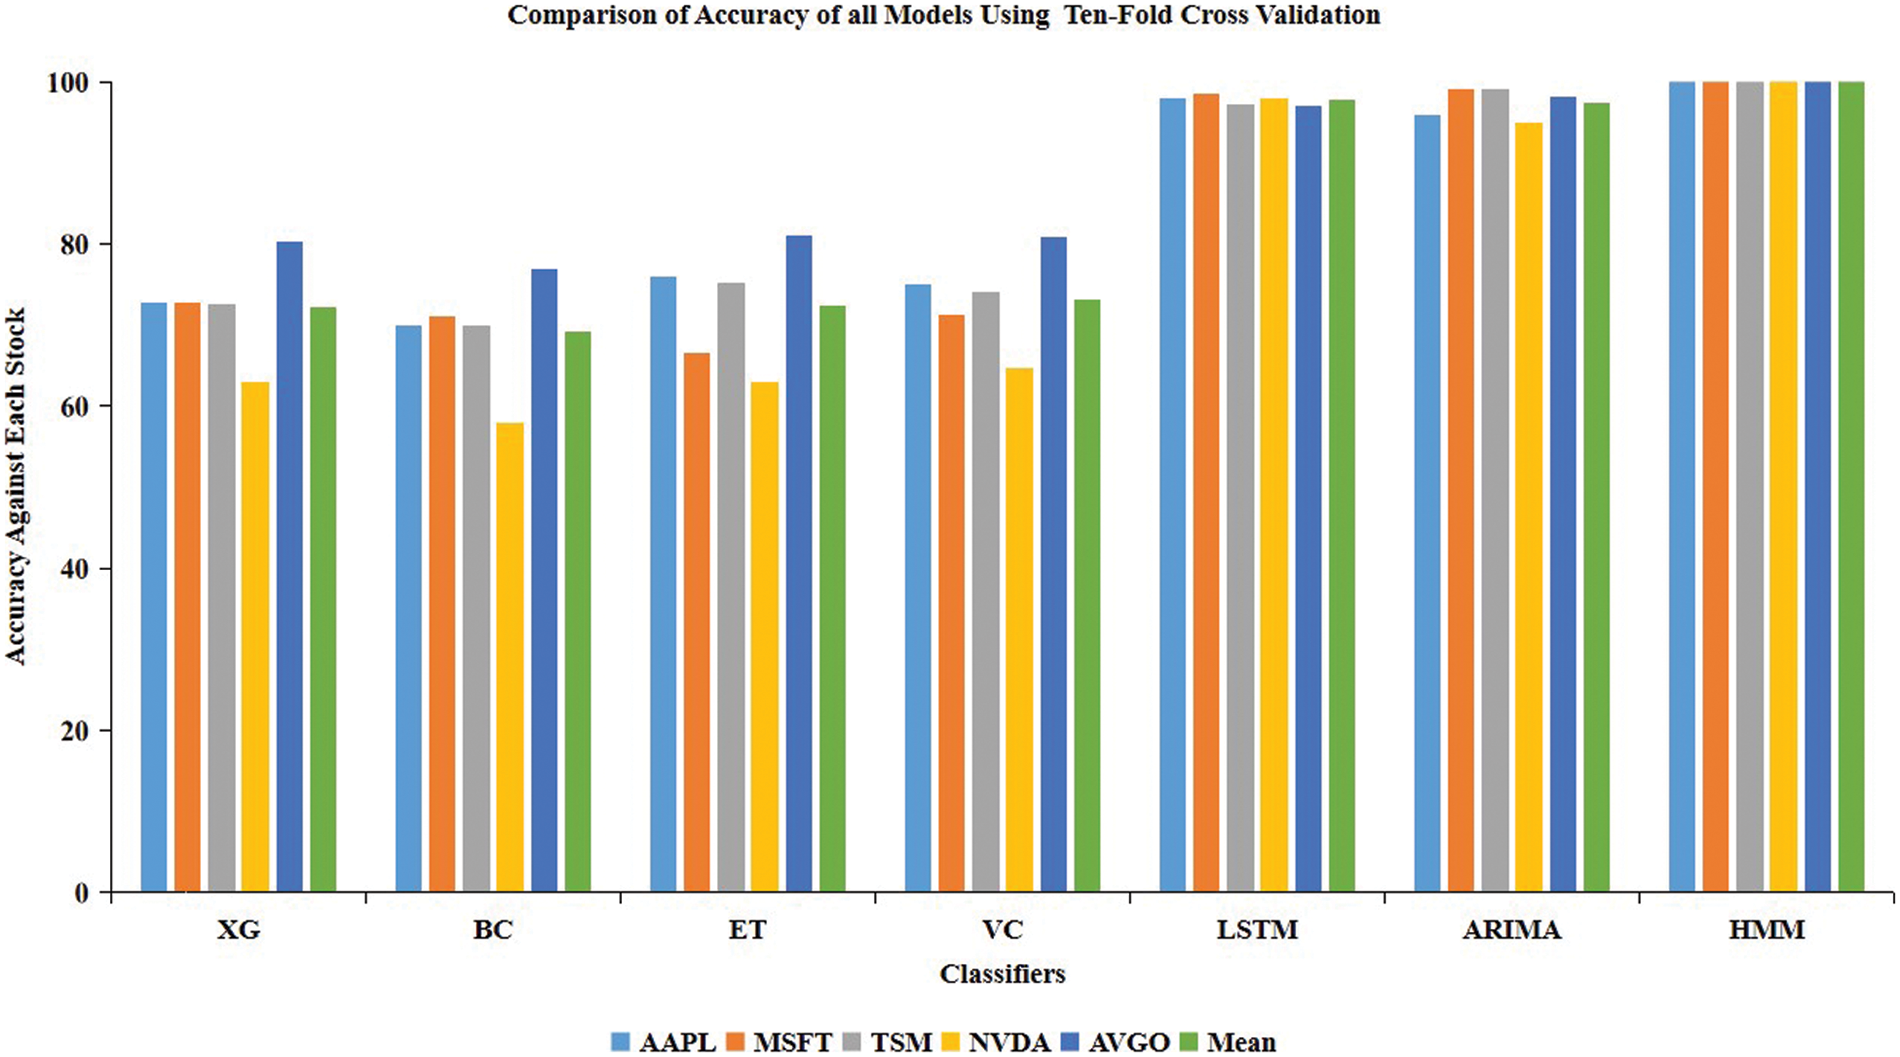
Figure 2: Comparison of accuracy score in percentage of all models using ten-fold cross validation
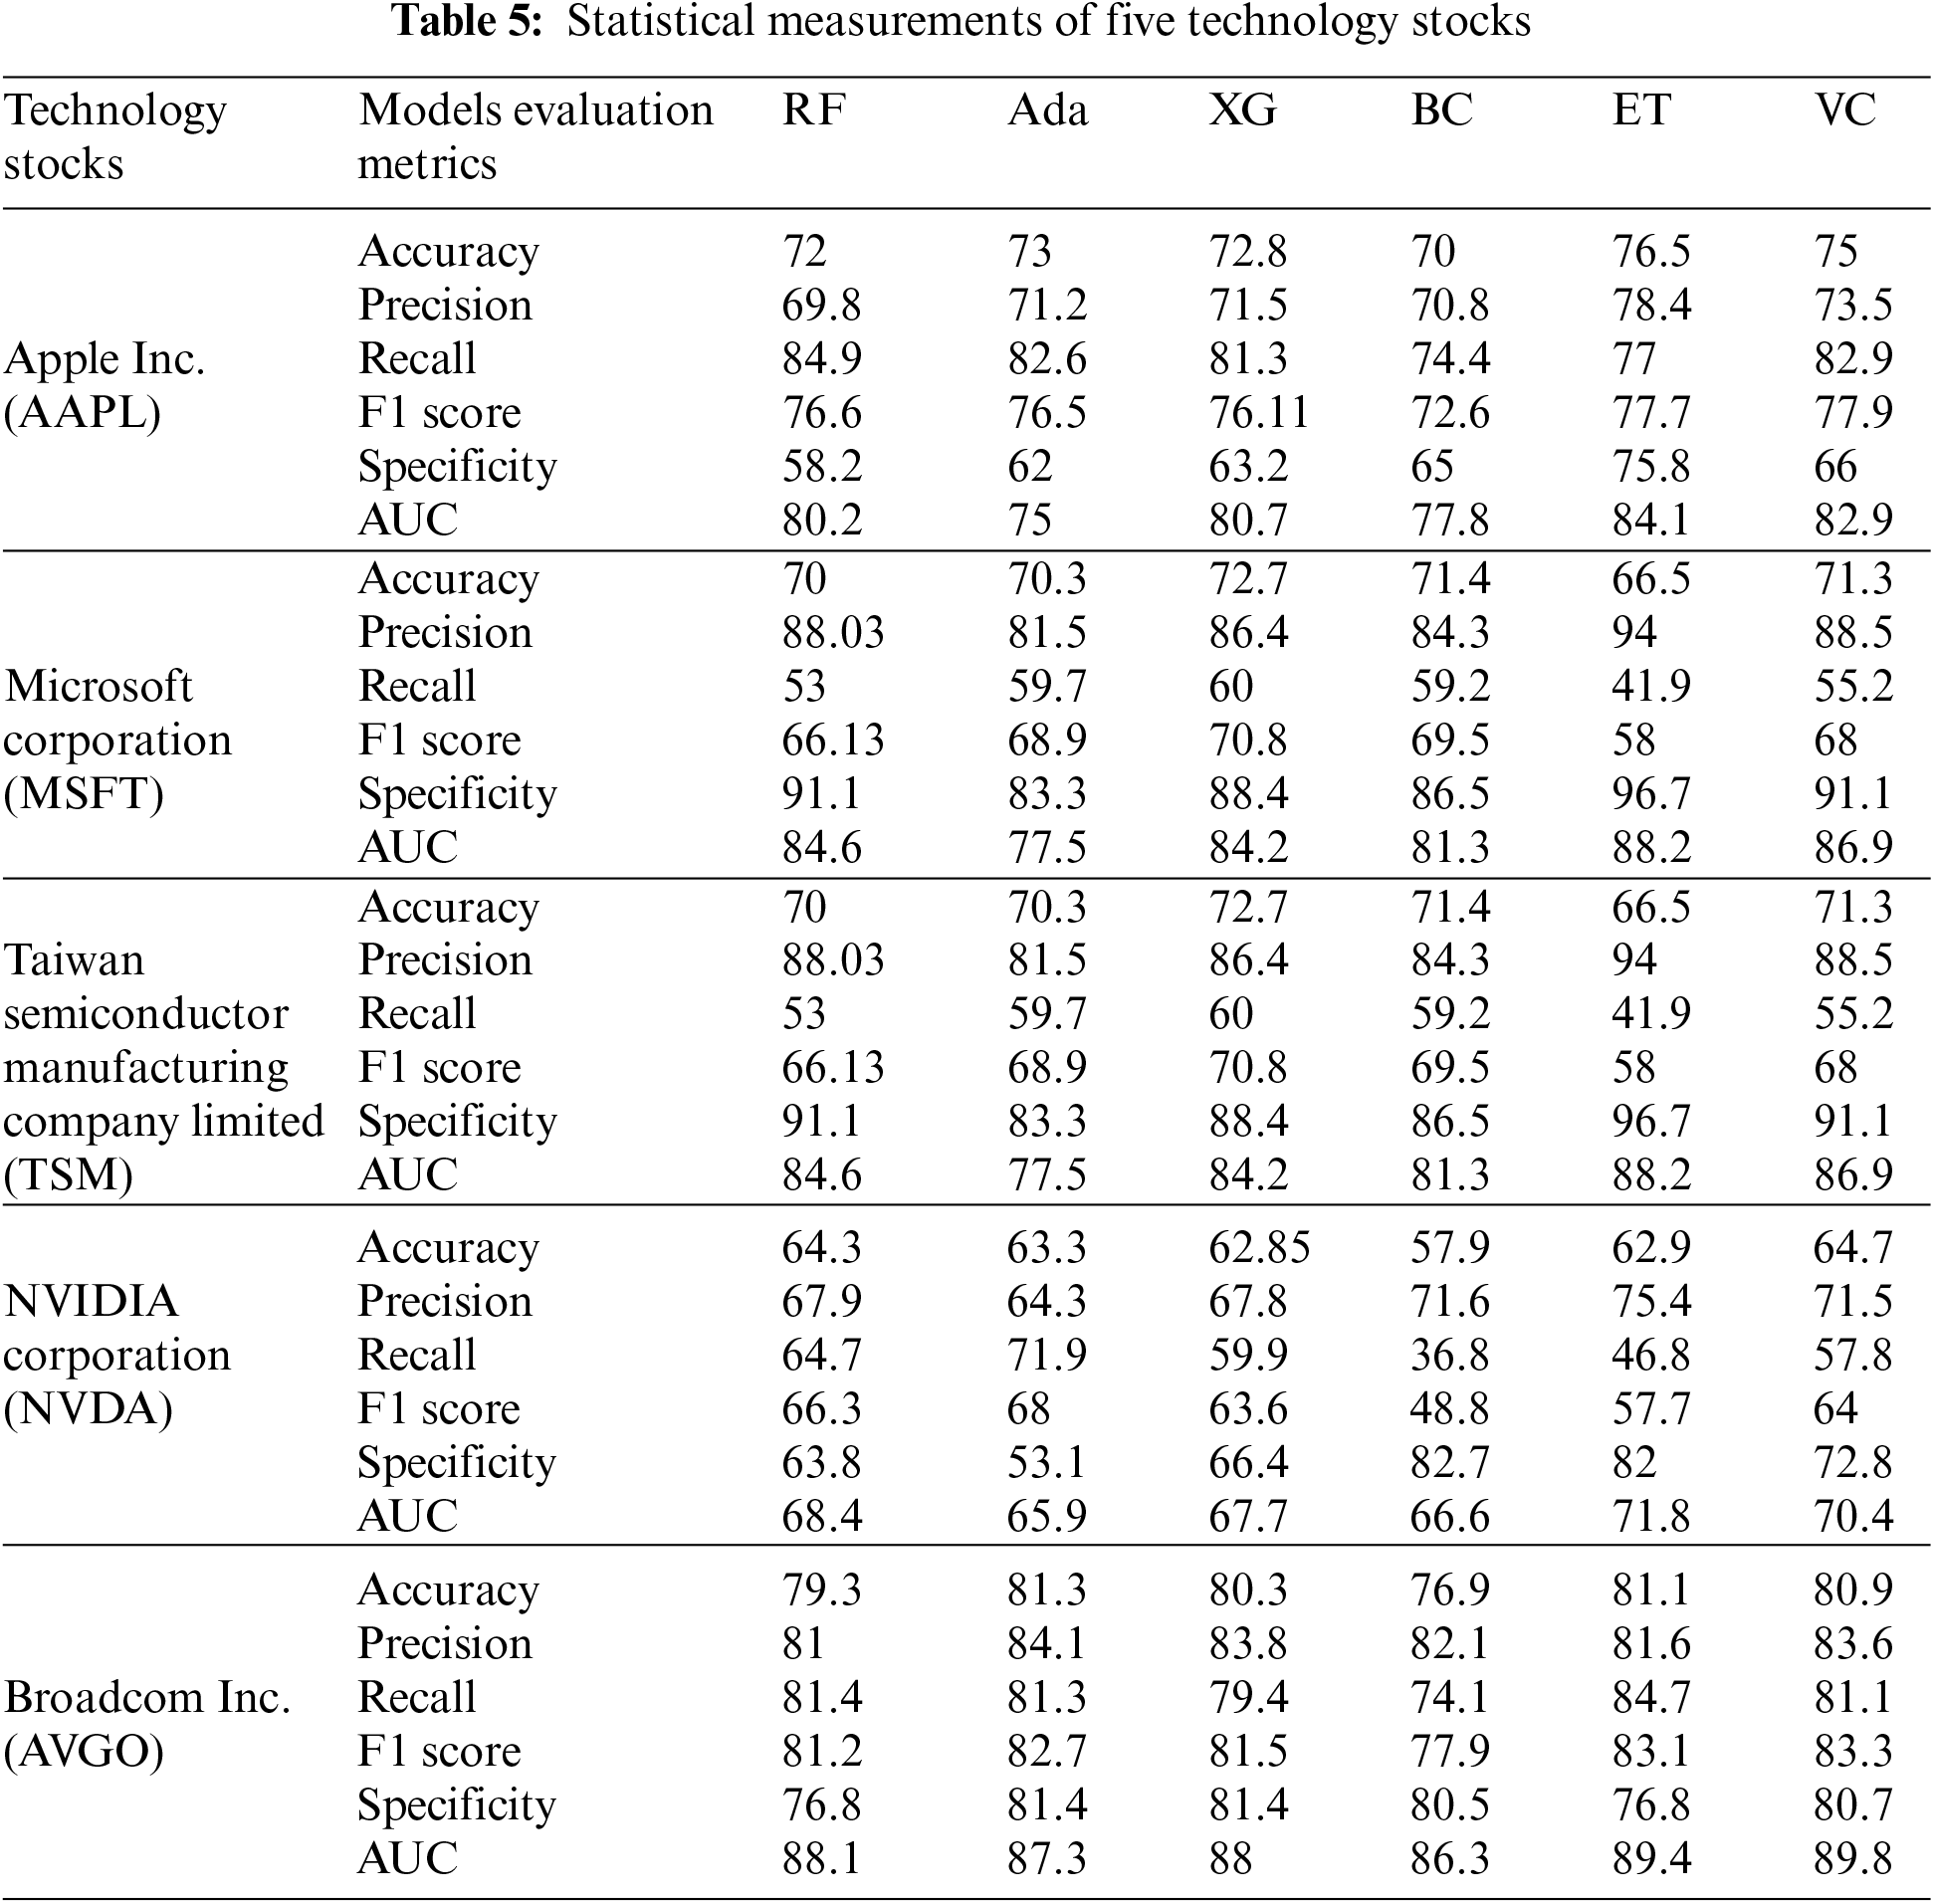
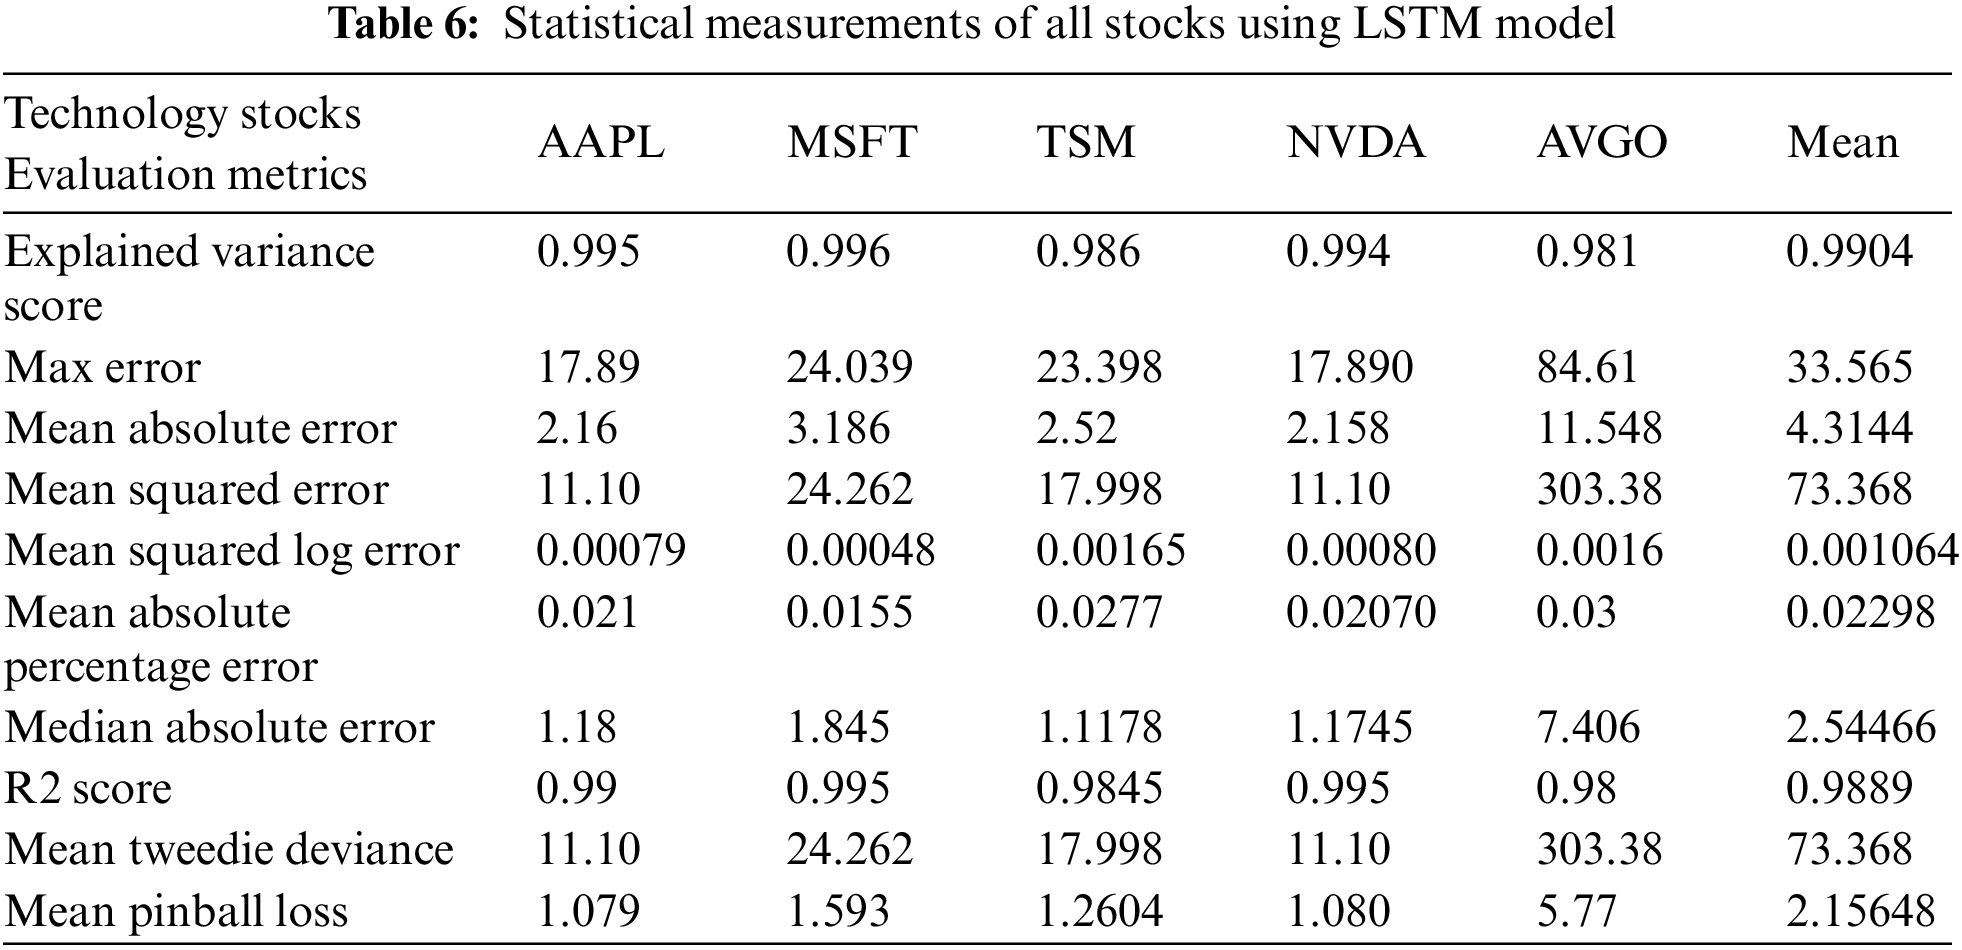
Statistical measurements such as accuracy, precision, recall, F1 score, specificity, and AUC of the AAPL, MSFT, TSM, NVDA, and AVGO technology stock datasets are compared in Table 5 using the RF, Ada, XG, BC, ET, and VC algorithms. In the same vein, deep learning models such as LSTM were applied to evaluate various statistical metrics, including Explained Variance Score, Max Error, Mean Absolute Error, Mean Squared Error, Mean Squared Log Error, Mean Absolute Percentage Error, Median Absolute Error, R2 Score, Mean Tweedie Deviance, and Mean Pinball Loss for technology stocks. The comparative analysis of these metrics is presented in Table 6. It should be noted that the researchers utilized different statistical measures for both machine learning and deep learning models. Moreover, statistical measurements like mean absolute error, mean absolute percentage error, autocorrelation function, correlation, and min-max values for ARIMA As each statistical measurement has its significance, like how “precision” is the measure of the correctly identified positive cases among all the predicted positive cases. Thus, it is useful when the costs of false positives are high. Similarly, accuracy is the measure of all the correctly identified cases. It is most often used when all the classes are equally important, etc. Moreover, it is evident from the datasets that AVGO performed very well against all statistical measures because external factors likeCOVID-19 less influenced it, but others were affected by external factors, even after pre-processing, which will show some significance. Thus, researchers used multiple evaluation metrics to observe stocks in every aspect, as every aspect is essential to calculate in actual letter and spirit. Therefore, researchers presented an interesting comparative analysis of all under-discussion stocks in all aspects in Tables 5 and 6.
Moreover, The AUC curves against AAPL, MSFT, TSM, NVDA, AVGO in Figs. 3a–3e stocks are shown.
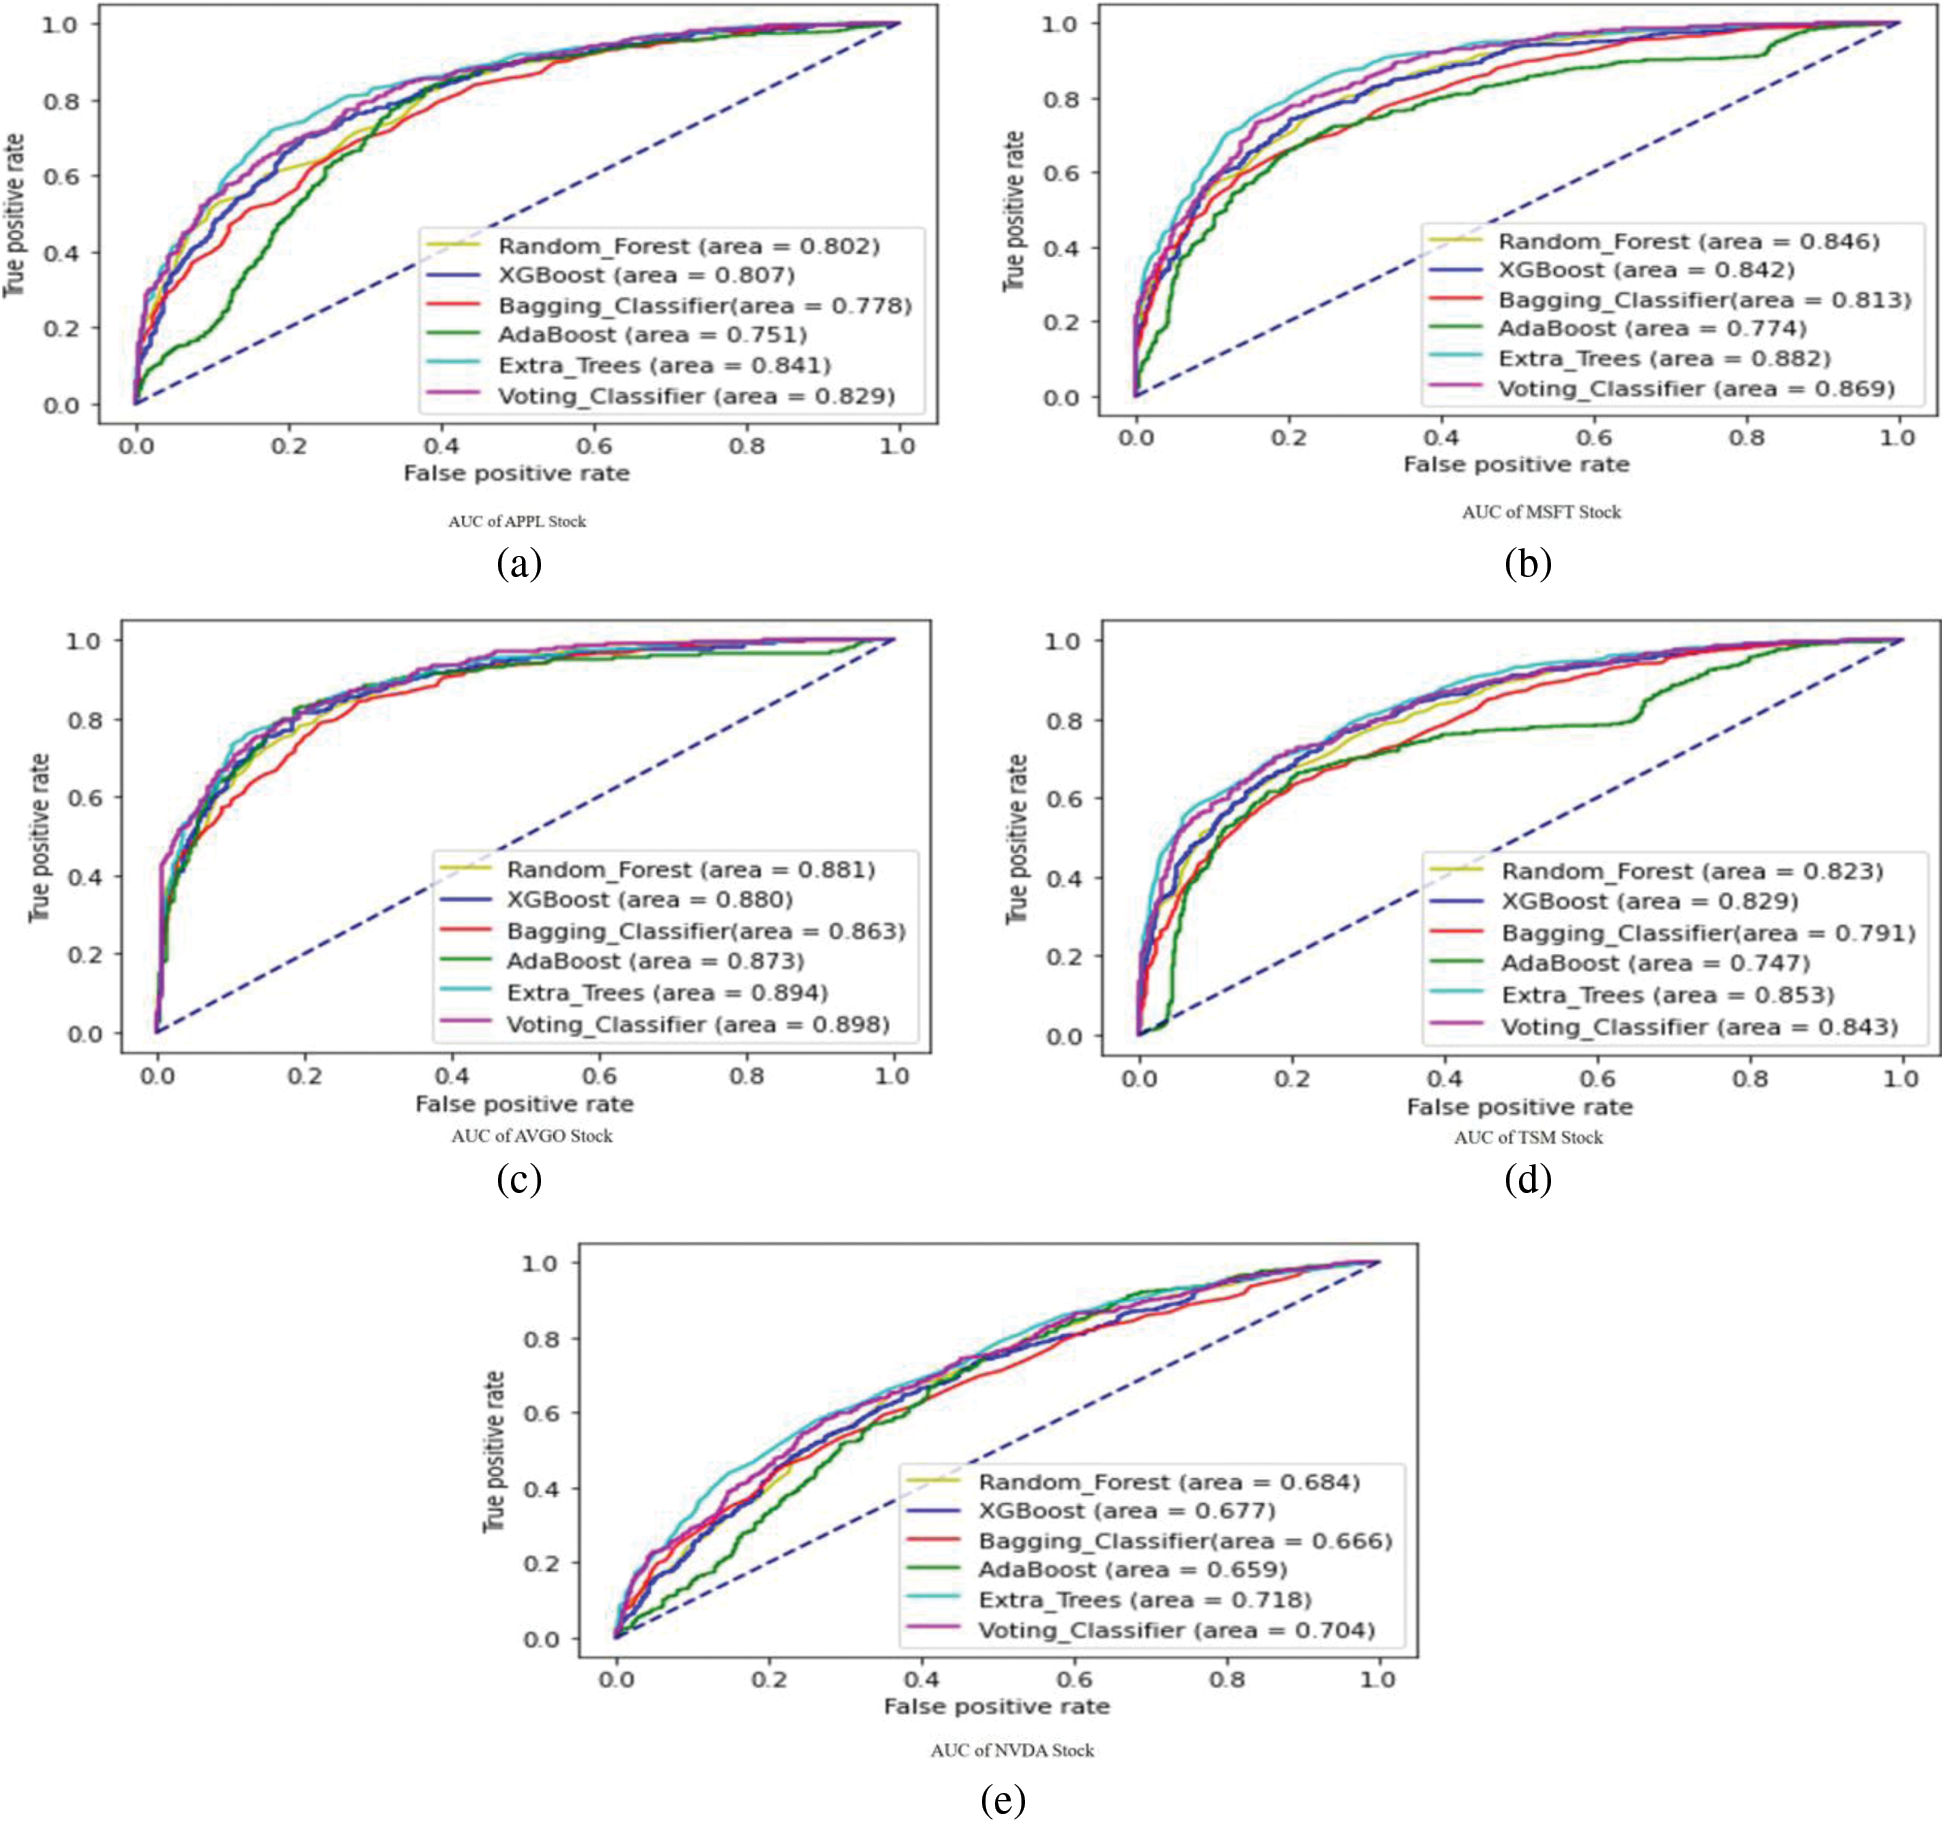
Figure 3: (a)–(e) AUC of all stocks using tree based ensemble models
Moreover, two-time series models, ARIMA and Hidden Markov Model (HMM) were implemented on all stocks by considering ARIMA (3, 1, 1) and HMM with three states (0, 1, 2), i.e., low, medium, and high. The following results were deduced by using ARIMA and are shown in Table 7, and a graphic representation of actual vs. predicted closing prices is shown for HMM in Figs. 4a–4e.
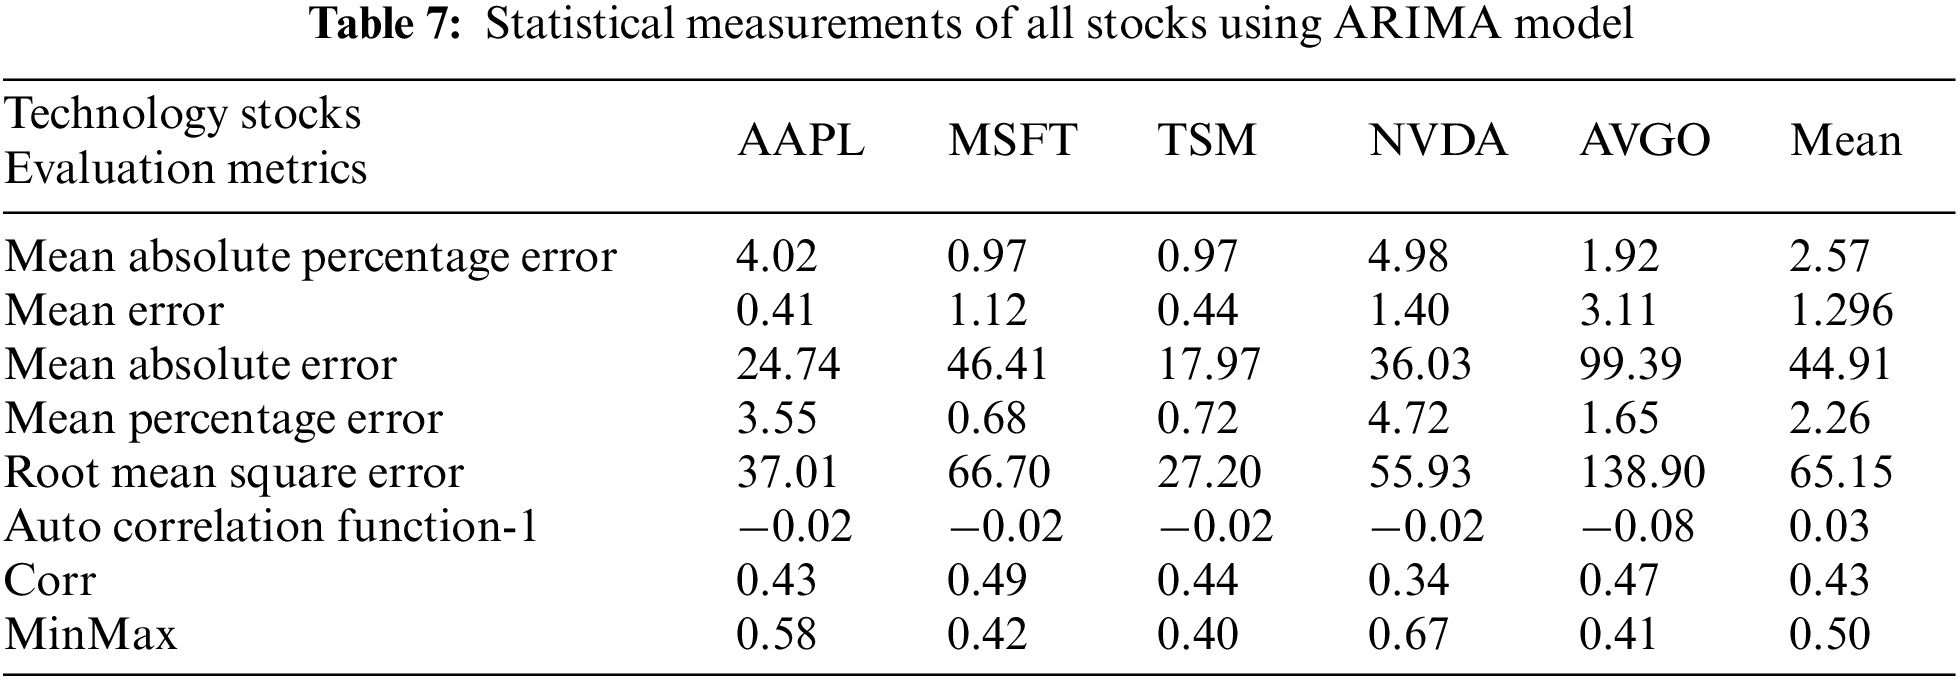
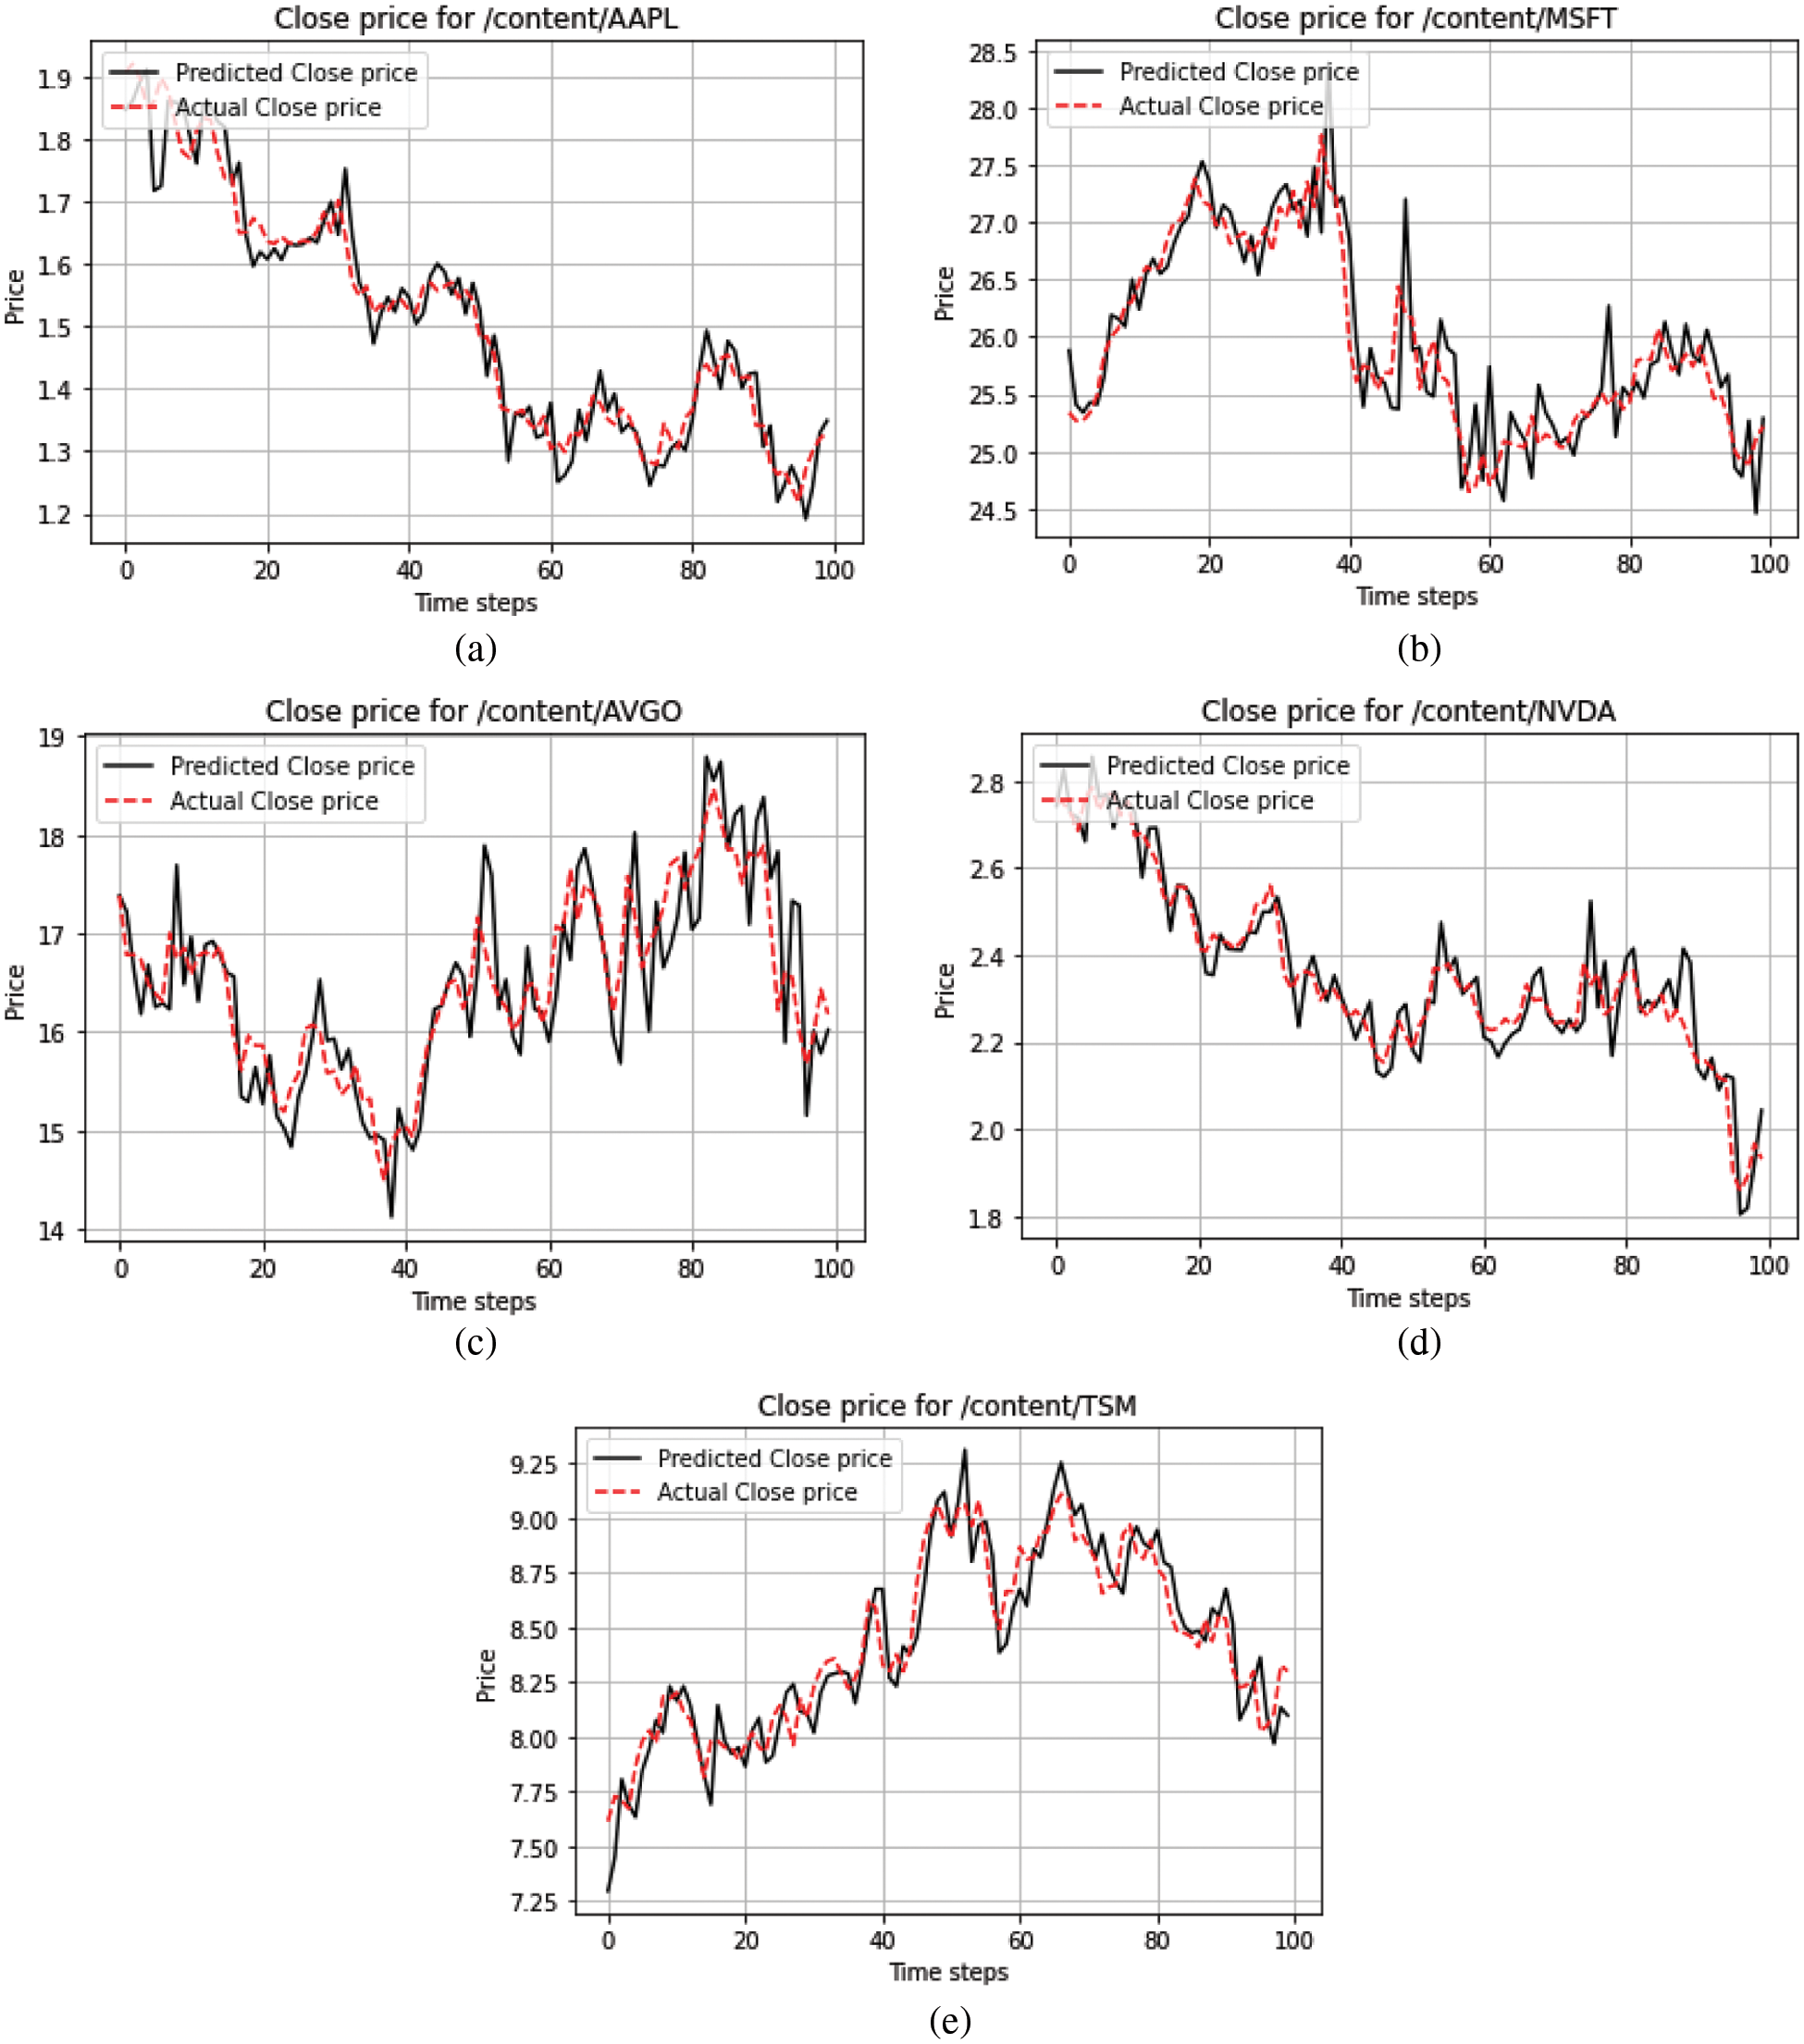
Figure 4: (a)–(e) Comparison of actual vs. predicted close of all stocks using hidden markov model
This research work configured HMM, ARIMA, LSTM, and six tree-based ensemble ML algorithms for the performance measurement of technology stocks. The data accessed from the Yahoo Finance API belongs to two stock exchanges. The data set is divided into three phases: the training, validation, and testing phases. The employed models are evaluated with ten-fold cross-validation for statistical measurements like accuracy, precision, recall, F1 score, specificity, and AUC metrics on all datasets. The results showed that the HMM model outperformed the other models in all statistical measurements. The models are ranked concerning precision, recall, specificity, F1 score, R2-score, and AUC metrics. The LSTM model showed better results for different datasets than the other applied ML models, including the deep learning models LSTM and ARIMA. In this research, recurrent neural network models like LSTM outperform ML models in forecasting stock movement. Therefore, HMM or LSTM-based software is deployed to measure the performance of stock prices well in time, but it also has limitations over the overall regional stability, which influences the stock price movements. Other factors influencing stock price movements, like political and regional stability, will also be encountered in future work.
In addition to this research, a Hybrid Deep Learning Model Integrating Attention Mechanism, Multi-Layer Perceptron, and Bidirectional Long-Short Term Memory Neural Network [37] and Deep Learning Based Forecasting in Stock Market with Big Data Analytics [38] is used for stock prices of different datasets which may be considered for future study.
Acknowledgement: The author, Mr. Tahir Sher would like to acknowledge the following individuals and organizations for their valuable contributions to this research work, Dr. Abdul Rehman for his undue support and guidance throughout the research, Dr. Imran Ihsan and Dongsun Kim for reviewing and Supervising the research, respectively. Furthermore, Mr. Tahir Sher acknowledges the support of Air University and Kyungpook National University for conducting this research and financial support. The author express sincere gratitude for their contributions.
Funding Statement: The research was supported by Kyungpook National University Research Fund, 2020.
Author Contributions: Tahir Sher carried out the experiments and manuscript. In multiple meetings, Dr. Abdul Rehman and Dr. Imran Ihsan reviewed and refined the manuscript. Concurrently, the research work was supervised by Dr. Dongsun Kim.
Availability of Data and Materials: The AAPL, MSFT, Broadcom Inc, TSM and NVIDIA & AVGO technology stocks data is available at Yahoo Finance API. Moreover, used data and algorithms may be found at https://github.com/TahirSher/Technology-Stocks-Prediction.
Conflicts of Interest: The authors declare that they have no conflicts of interest to report regarding the present study.
1https://finance.yahoo.com/quote/AAPL/profile?p=AAPL
2https://finance.yahoo.com/quote/AAPL?p=AAPL
3https://www.britannica.com/topic/Microsoft-Corporation
4https://finance.yahoo.com/quote/MSFT?p=MSFT&.tsrc=fin-srch
5https://www.tsmc.com/english/aboutTSMC/company_profile
6https://finance.yahoo.com/quote/TSM?p=TSM&.tsrc=fin-srch
7https://finance.yahoo.com/quote/TSM?p=TSM&.tsrc=fin-srch
8https://finance.yahoo.com/quote/TSM?p=TSM&.tsrc=fin-srch
9https://finance.yahoo.com/quote/TSM?p=TSM&.tsrc=fin-srch
10https://finance.yahoo.com/quote/TSM?p=TSM&.tsrc=fin-srch
References
1. T. Fischer and K. Christopher, “Deep learning with long short-term memory networks for financial market predictions,” European Journal of Operational Research, vol. 270, no. 2, pp. 654–669, 2018. [Google Scholar]
2. J. K. Cohen, The Random Character of Stock Market Prices, Cambridge, Massachusetts, USA: MIT Press, 1964. [Google Scholar]
3. E. F. Fama, F. Eugene, M. C. Jensen and R. Roll, “The adjustment of stock prices to new information,” International Economic Review, vol. 10, no. 1, pp. 1–21, 1969. [Google Scholar]
4. E. F. Fama and F. Eugene, “Efficient capital markets: A review of theory and empirical work,” The Journal of Finance, vol. 25, no. 2, pp. 383–417, 1970. [Google Scholar]
5. E. F. Fama and F. Eugene, “The behavior of stock-market prices,” The Journal of Business, vol. 38, no. 1, pp. 34–105, 1965. [Google Scholar]
6. M. C. Jensen, “Some anomalous evidence regarding market efficiency,” Journal of Financial Economics, vol. 6, no. 2–3, pp. 95–101, 1978. [Google Scholar]
7. J. Bollen, H. Mao and X. Zeng, “Twitter mood predicts the stock market,” Journal of Computational Science, vol. 2, no. 1, pp. 1–8, 2011. [Google Scholar]
8. M. Ballings, D. V. D. Poel, N. Hespeels and R. Gryp, “Evaluating multiple classifiers for stock price direction prediction,” Expert Systems with Applications, vol. 42, no. 20, pp. 7046–7056, 2015. [Google Scholar]
9. E. Chong, C. Han and F. C. Park, “Deep learning networks for stock market analysis and prediction: Methodology, data representations and case studies,” Expert Systems with Applications, vol. 83, no. 4, pp. 187–205, 2017. [Google Scholar]
10. J. R. Nofsinger, “Social mood and financial economics,” The Journal of Behavioral Finance, vol. 6, no. 3, pp. 144–160, 2005. [Google Scholar]
11. V. L. Smith, “Constructivist and ecological rationality in economics,” American Economic Review, vol. 93, no. 3, pp. 465–508, 2003. [Google Scholar]
12. C. N. Avery, J. A. Chevalier and R. J. Zeckhauser, “The “CAPS” prediction system and stock market returns,” Review of Finance, vol. 20, no. 4, pp. 1363–1381, 2016. [Google Scholar]
13. M. Umer, M. Awais and M. Muzammul, “Stock market prediction using machine learning (ML) algorithms,” Advances in Distributed Computing and Artificial Intelligence Journal, vol. 8, no. 4, pp. 97–116, 2019. [Google Scholar]
14. Z. Hu, J. Zhu and K. Tse, “Stocks market prediction using support vector machine,” in Proc. ICIII, Xi’an, China, pp. 115–118, 2013. [Google Scholar]
15. X. Pang, Y. Zhou, P. Wang, W. Lin and V. Chang, “An innovative neural network approach for stock market prediction,” The Journal of Supercomputing, vol. 76, no. 3, pp. 2098–2118, 2020. [Google Scholar]
16. M. Hsu, S. Lessman, M. Sung, T. Ma and J. E. V. Johnson, “Bridging the divide in financial market forecasting: Machine learners vs. financial economists,” Expert Systems with Applications, vol. 61, no. 20, pp. 215–234, 2016. [Google Scholar]
17. B. Weng, M. A. Ahmed and F. M. Megahed, “Stock market one-day ahead movement prediction using disparate data sources,” Expert Systems with Applications, vol. 79, no. 3, pp. 153–163, 2017. [Google Scholar]
18. Y. Zhang and L. Wu, “Stock market prediction of S&P 500 via combination of improved BCO approach and BP neural network,” Expert Systems with Applications, vol. 36, no. 5, pp. 8849–8854, 2009. [Google Scholar]
19. D. Cheng, F. Yang, S. Xiang and J. Liu, “Financial time series forecasting with multi-modality graph neural network,” Pattern Recognition, vol. 121, no. 4, pp. 108218, 2022. [Google Scholar]
20. S. Xiang, D. Cheng, C. Shang, Y. Zhang and Y. Liang, “Temporal and heterogeneous graph neural network for financial time series prediction,” in Proc. CIKM, Atlanta, GA, USA, pp. 3584–3593, 2022. [Google Scholar]
21. S. Ibrahim, W. Chen, Y. Zhu, P. Chen, Y. Zhang et al., “Knowledge graph guided simultaneous forecasting and network learning for multivariate financial time series,” in Proc. ICAIF, New York, USA, pp. 480–488, 2022. [Google Scholar]
22. K. Chen, Y. Zhou and F. Dai, “A lstm-based method for stock returns prediction: A case study of china stock market,” in Proc. Big Data, Santa Clara, CA, USA, pp. 2823–2824, 2015. [Google Scholar]
23. E. Dezsi and I. A. Nistor, “Can deep machine learning outsmart the market? A comparison bettheyen econometric modelling and long-short term memory,” Romanian Economic Business Review, vol. 11, no. 4.1, pp. 54–73, 2016. [Google Scholar]
24. A. J. P. Samarawickrama and T. G. I. Fernando, “A recurrent neural network approach in predicting daily stock prices an application to the srilankan stock market,” in Proc. ICIIS, Peradeniya, Sri Lanka, pp. 1–6, 2017. [Google Scholar]
25. M. Hiransha, E. A. Gopalakrishnan, V. K. Menon and K. P. Soman, “NSE stock market prediction using deep-learning models,” Procedia Computer Science, vol. 132, no. 6, pp. 1351–1362, 2018. [Google Scholar]
26. S. I. Lee and S. J. Yoo, “Threshold-based portfolio: The role of the threshold and its applications,” The Journal of Super Computing, vol. 76, no. 10, pp. 8040–8057, 2020. [Google Scholar]
27. X. Li, L. Yang, F. Xue and H. Zhou, “Time series prediction of stock price using deep belief networks with intrinsic plasticity,” in Proc. CCDC, Chongqing, China, pp. 1237–1242, 2017. [Google Scholar]
28. L. Chen, Z. Qiao, M. Wang, C. Wang, R. Du et al., “Which artificial intelligence algorithm better predicts the Chinese stock market?” IEEE Access, vol. 6, pp. 48625–48633, 2018. [Google Scholar]
29. C. Krauss, X. A. Do and N. Huck, “Deep neural networks, gradient-boosted trees, random forests: Statistical arbitrage on the S&P 500,” European Journal of Operational Research, vol. 259, no. 2, pp. 689–702, 2017. [Google Scholar]
30. R. Chandra and S. Chand, “Evaluation of co-evolutionary neural network architectures for time series prediction with mobile application in finance,” Applied Soft Computing, vol. 49, no. 3, pp. 462–473, 2016. [Google Scholar]
31. S. Liu, C. Zhang and J. Ma, “CNN-LSTM neural network model for quantitative strategy analysis in stock markets,” in Proc. ICONIP, Guangzhou, China, pp. 198–206, 2017. [Google Scholar]
32. Z. Yuan, R. Zhang and X. Shao, “Deep and wide neural networks on multiple sets of temporal data with correlation,” in Proc. ICCDE, Shanghai, China, pp. 39–43, 2018. [Google Scholar]
33. I. B. Mohamad and D. Usman, “Standardization and its effects on K-means clustering algorithm,” Research Journal of Applied Sciences, Engineering and Technology, vol. 6, no. 17, pp. 3299–3303, 2013. [Google Scholar]
34. X. Lin, Z. Yang and Y. Song, “Short-term stock price prediction based on echo state networks,” Expert Systems with Applications, vol. 36, no. 3, pp. 7313–7317, 2009. [Google Scholar]
35. C. Tsai and Y. Hsiao, “Combining multiple feature selection methods for stock prediction: Union, intersection and multi-intersection approaches,” Decision Support Systems, vol. 50, no. 1, pp. 258–269, 2010. [Google Scholar]
36. B. Mahesh, “Machine learning algorithms–A review,” International Journal of Science and Research, vol. 9, pp. 381–386, 2020. [Google Scholar]
37. Q. Chen, W. Zhang and Y. Lou, “Forecasting stock prices using a hybrid deep learning model integrating attention mechanism,” in Multi-Layer Perceptron and Bidirectional Long-Short Term Memory Neural Network, vol. 8. Piscataway, pp. 117365–117376, 2020. [Google Scholar]
38. G. Sismanoglu, M. A. Onde, F. Kocer and O. K. Sahingoz, “Deep learning based forecasting in stock market with big data analytics,” in 2019 Scientific Meeting on Electrical-Electronics & Biomedical Engineering and Computer Science (EBBT), Istanbul, Turkey, pp. 1–4, 2019. [Google Scholar]
Cite This Article
 Copyright © 2023 The Author(s). Published by Tech Science Press.
This work is licensed under a Creative Commons Attribution 4.0 International License , which permits unrestricted use, distribution, and reproduction in any medium, provided the original work is properly cited.
 Downloads
 Citation Tools