
 Submit a Paper
 Propose a Special lssue
 Open Access
ARTICLE

Multi-Objective Image Optimization of Product Appearance Based on Improved NSGA-Ⅱ
1 Key Laboratory of Advanced Manufacturing Technology of the Ministry of Education, Guizhou University, Guiyang, 550025, China
2 Potevio Logistics Technology Co., Ltd., Guiyang, 550025, China
* Corresponding Author: Jian Lv. Email:
(This article belongs to the Special Issue: Intelligent Computing Techniques and Their Real Life Applications)
Computers, Materials & Continua 2023, 76(3), 3049-3074. https://doi.org/10.32604/cmc.2023.040088
Received 04 March 2023; Accepted 09 June 2023; Issue published 08 October 2023
 View Full Text
 Download PDF
Abstract
A second-generation fast Non-dominated Sorting Genetic Algorithm product shape multi-objective imagery optimization model based on degradation (DNSGA-II) strategy is proposed to make the product appearance optimization scheme meet the complex emotional needs of users for the product. First, the semantic differential method and K-Means cluster analysis are applied to extract the multi-objective imagery of users; then, the product multidimensional scale analysis is applied to classify the research objects, and again the reference samples are screened by the semantic differential method, and the samples are parametrized in two dimensions by using elliptic Fourier analysis; finally, the fuzzy dynamic evaluation function is used as the objective function of the algorithm, and the coordinates of key points of product contours Finally, with the fuzzy dynamic evaluation function as the objective function of the algorithm and the coordinates of key points of the product profile as the decision variables, the optimal product profile solution set is solved by DNSGA-Ⅱ. The validity of the model is verified by taking the optimization of the shape scheme of the hospital connection site as an example. For comparison with DNSGA-II, other multi-objective optimization algorithms are also presented. To evaluate the performance of each algorithm, the performance evaluation index values of the five multi-objective optimization algorithms are calculated in this paper. The results show that DNSGA-II is superior in improving individual diversity and has better overall performance.Keywords
The consumption pattern in today’s product-consuming market has moved from a rational desire for product function to a psychological demand for emotional expression [1].
The emotional experience effect of a product becomes an essential factor in determining its popularity among consumers. Thus, the production of pleasant emotional experiences in consumers via perceptual image design has increasingly become the focal point of product form conceptualdesign [2].
Relevant Kansei Engineering [3] research has shown that user emotional demands are strongly tied to physical product qualities (appearance and function). To address the emotional demands of users, designers must comprehend the desired image of consumers and portray it through the design strategy of the product’s physical characteristics. Traditional imagery design relies heavily on the subjective feelings of the designer. Designers map design ideas into product solutions based on personal intuition and experience, which has factors such as vague expression, uncertainty, and subjective experience, making it difficult to form a set of effective perceptual design methods [4]. Thus, some researchers set out to investigate the relationship between perceptual image and product appearance characteristics using computer-aided design optimization technologies and to develop image-based product shape design innovations.
Ren et al. [5] used Kansei Engineering theory, Theory Type I, and multiple regression analysis to study the mapping relationship between automotive dashboard images and imagery vocabulary to improve the fit between automotive dashboard design and perceptual needs. Wang et al. [6] used the design of a portable tabletop air purifier as an example to study the association between design elements and imagery cognitive space using the semantic differential method, factor analysis, and partial correlation analysis, and provided research ideas and methods for air purifier shape design. The literature [7,8] utilized research methods related to perceptual engineering to obtain the perceptual imagery of product shapes. Then, each design element was utilized as input parameters to construct an imagery prediction model based on a reverse artificial neural network. This model was combined with genetic algorithm optimization techniques to search for the optimal product shape design solution, demonstrated through the design of sports shoes and electric shavers. Hsiao et al. [9] dissected the coffee machine’s characteristics and computed the contribution of each feature to the perceptual image. They developed the perceptual product image design auxiliary program in conjunction with the genetic algorithm.
In the literature mentioned above, the mapping connection between product appearance and perceptual image, as well as the prediction of the perceptual image of product appearance, are examined in depth, effectively guiding the expression of the product appearance’s perceptual image. However, the study mentioned above still has the following limitations: the expression of users’ perceptual images is diverse; for items of the same appearance, the expression of users’ image preferences is complex. Users will express their subjective sentiments from numerous dimensions [10]. For product form optimization, the majority of relevant literature study focuses on a single image or turns multiple images into a single image objective using a weighted method. For multiple perceptual imageries, it is difficult to output a suitable shape solution with a single imagery study method. From the perspective of multi-objective optimization, Wu [11] used the semantic difference method to analyze the user’s imagery preference, used Backpropagation Neural Network (BP-NN) to analyze the functional relationship between the product shape elements and the user’s imagery, and used it as an adaptation function to input into the Non-dominated Sorting Genetic Algorithm-II (NAGA-II) multi-objective evolutionary algorithm to obtain the Pareto optimal solution for the electric motorcycle shape scheme that conforms to multiple imageries. Existing research has focused on the optimization of multi-objective images, but in the quest for the Pareto optimum solution, the variety of product appearance is to some extent ignored, making it easy to lose high-quality individuals. Therefore, this paper obtains user imagery using perceptual engineering research methods, parametrizes the product appearance using Elliptic Fourier Analysis, and applies fuzzy evaluation to construct the objective function, a composite image optimization model based on DNSGA-Ⅱ was proposed to provide ideas for product shape optimization. The research framework of this paper is shown in Fig. 1.
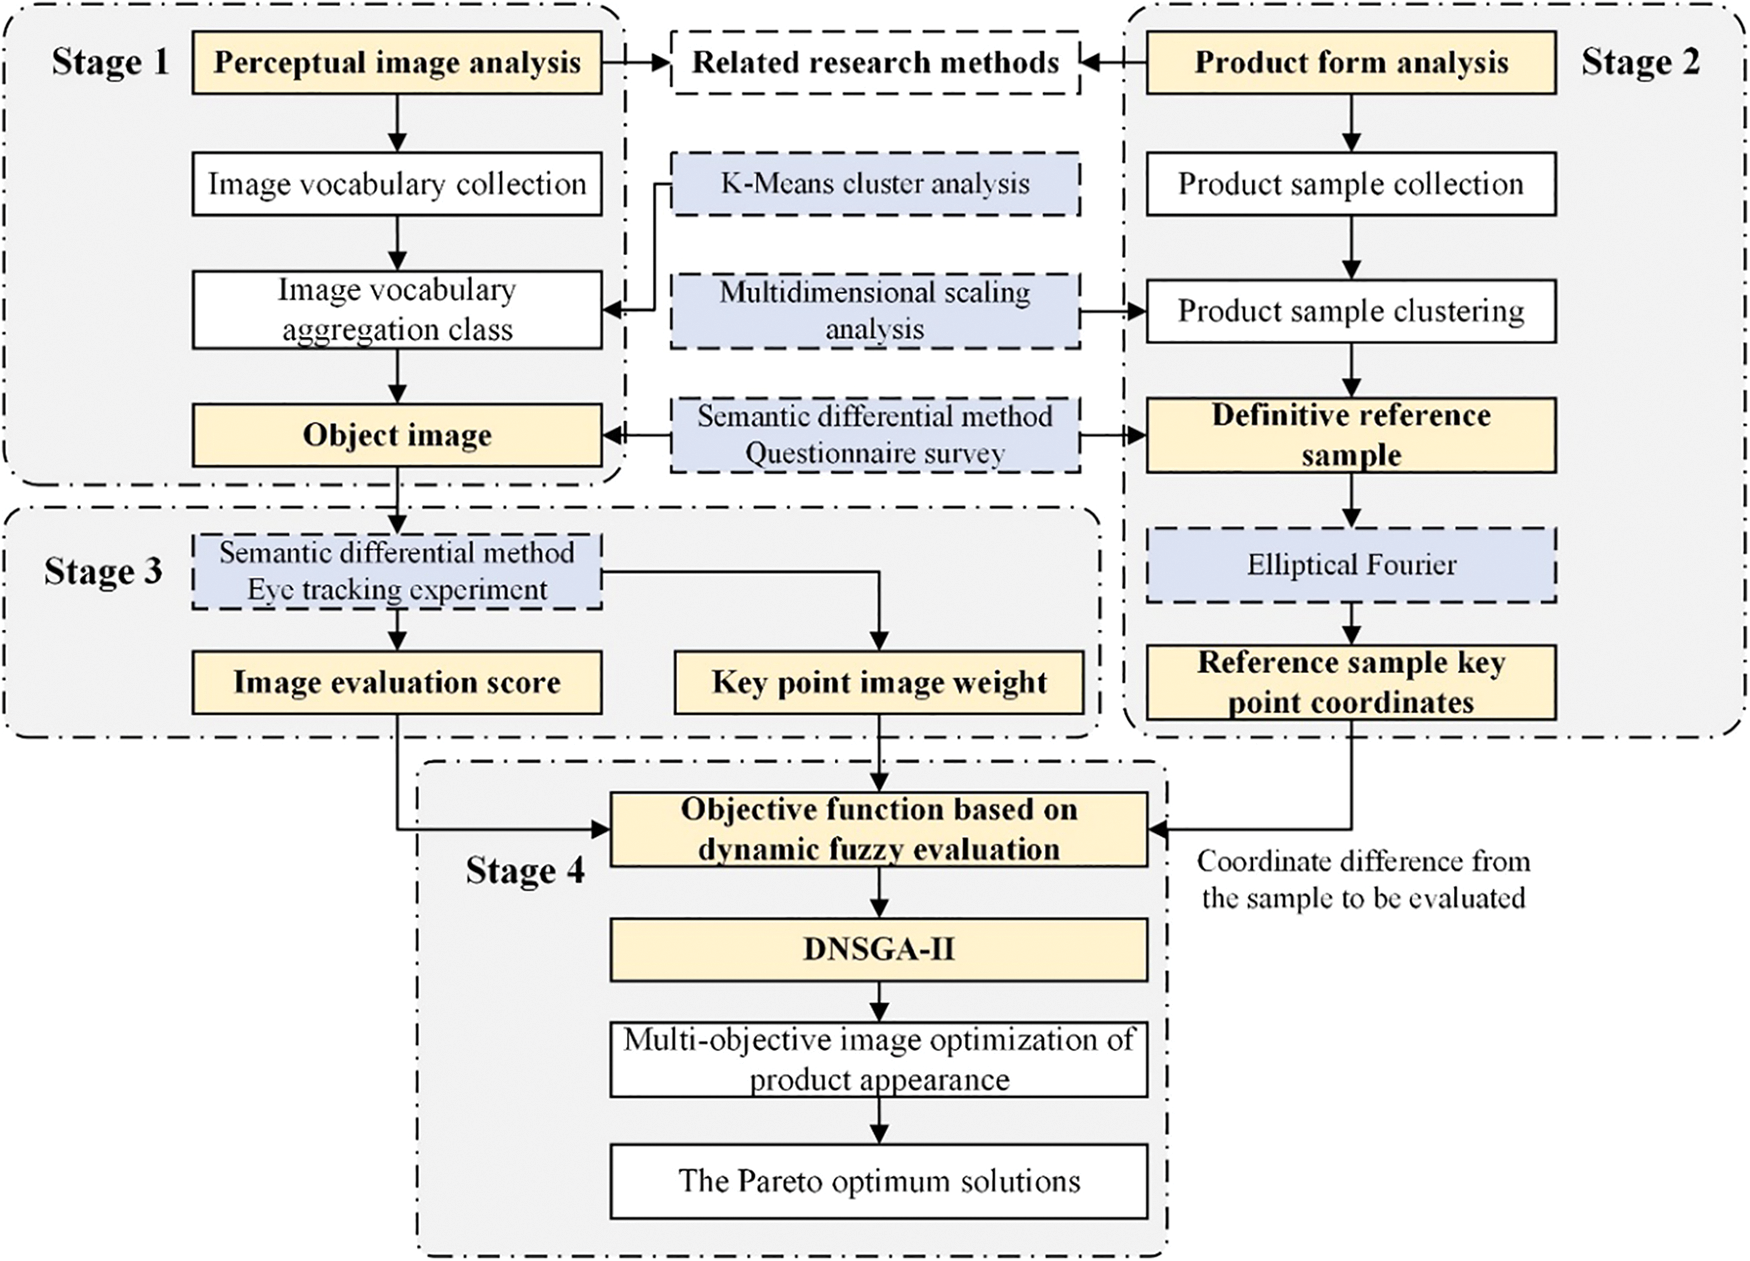
Figure 1: Research framework of the thesis
Kansei Engineering is a broad field that combines design, psychology, ergonomics, and other fields. Users’ perceptual needs for products are recessive, imprecise, and fuzzy; consequently, in product design based on perceptual image, accurately measuring, positioning, and capturing users’ perceptual cognition of product appearance is the primary problem to be solved and the focus of product perceptual design research [12]. Traditional Kansei Engineering research techniques can be roughly divided into qualitative inference and quantitative inference, and the overall research procedures of these two approaches tend to have similarities. Particularly, during the image extraction phase, Kansei Engineering obtains images primarily using comprehensive techniques such as questionnaire surveys, semantic differential methods, and image scale methods [13]. Conventional Kansei Engineering research techniques depend on a significant number of follow-up analyses. With the advancement of science and technology, researchers are using the Electroencephalogram (EEG) system [4], eye movement tracking system [14], electromyography, and other physiological measuring devices to investigate the underlying perceptual cognition of users.
2.2 Multi-Imagers Optimization Objective Function Construction Method
The objective function of perceptual imagery optimization is actually to establish a mapping relationship between product form elements and product imagery vocabulary. The manifestation of this mapping relationship can be divided into linear and nonlinear objective functions. Multiple regression analysis [15], Quantification Theory Type I [16], and other techniques are often used to build linear models. All these ways are used to extract the most important form elements by expressing the relationship between the product form elements and the perceptual imagery through the coefficients of the independent variables [17]. In many instances, the mapping relationship between product form elements and product imagery is complex and non-linear because product imagery is derived from human perception, which is abstract and nebulous. It is extremely difficult to establish an accurate mathematical model for product form and product imagery using concrete methods [18]. Therefore, several researchers have started to concentrate on the use of artificial neural networks [19] to represent the nonlinear link between product form and perceptual images. Neural networks, however, need a large number of samples and are susceptible to overfitting and local optima.
Fuzzy theory is based on the acceptance of the existence of objective phenomena that are vague. Its research goal is to deal with fuzzy uncertainties and quantify them into computer-identifiable data [20]. Zhu et al. [21] developed a fuzzy evaluation set using fuzzy mathematics and combined it with the functional analysis method to establish the evaluation fuzzy relationship matrix for product design from the scheme level to the objective level. They solved it to determine the evaluation order of multiple design solutions for multi-class screw pumps, which provided a solid basis for selecting the best product design solution. In order to analyze the confidence level of user satisfaction in the PCs goal value and low development cost, the traditional QFD theory and fuzzy set theory were combined to judge and quantify the language characteristics of users [22]. Kim et al. [23] proposed a fuzzy theory modeling method to describe the nonlinear mapping relationship between user requirements and product functional characteristics by establishing a fuzzy multi-objective mathematical model, and verifying the validity of the model by part design. Existing research indicates that it is possible to create a prediction model of perceptual images using fuzzy evaluation theories.
2.3 Multi-Objective Optimization Algorithm for Product Appearance
As discussed in Section 1, customers’ feelings regarding a product are often communicated via multimodal images, which is effectively a multi-objective optimization issue. Presently, generally utilized optimization techniques like genetic algorithms [24] and particle swarm optimization algorithms [25] can be applied to search for products with special imagery that satisfies users. Nevertheless, these algorithms need exact image criteria from the user and deliver just one solution each run. Therefore, for optimization problems with multi-objective imagery, a unique optimal solution rarely exists. These solutions are presented as a set of optimal solutions. The multi-objective evolutionary method may yield numerous optimum solutions in a single run, meeting the article’s study requirements. At present, multi-objective evolutionary algorithms have become a hot area of research in perceptual engineering, especially NSGA-II [26,27] is more widely studied in the field of product perceptual imagery optimization. Scholars have used various methods to improve the traditional NSGA-II algorithm to obtain better product optimization models. Scholars compare and evaluate the improved algorithms to verify the effectiveness and robustness of the algorithms in terms of 2 metrics for evaluating their performance: convergence and diversity.
3.1 Defining the Objective Imagery
This paper’s selection of multi-target perceptual imagery required experiments using the semantic differential twice. First, a preliminary set of imagery words was obtained by reviewing a large amount of relevant product information and collecting imagery words related to the research object; second, a first set of questionnaires was created to compare the similarity of the two sets of words in the range [0, 1] with a step size of 0.2. If the two words are identical, the similarity is 1; if they are very similar, the similarity is 0.8; if they are relatively similar, the similarity is 0.6; if they are different, the similarity is 0.4; and if they are not similar at all, the similarity is 0, and the semantic similarity matrix of the imagery words can be obtained. Then, the K-Means clustering method [28] was applied to cluster the word set N. Lastly, a second set of questionnaires was created and respondents were asked to select the imagery vocabulary with a higher degree of fit to the shape of the study sample; finally, one word with the highest degree of fit from each type of vocabulary set was selected as the objective imagery for product shape optimization. The K-Means clustering analysis consists of the following steps:
(1) Initial prime selection: k randomly picked imagery words from the collection N of terms.
(2) Calculating the distance from the remaining perceptual vocabulary to the original center of mass and arranging them into the closest distance group.
(3) Recalculation of the obtained centers of mass for each categorization.
(4) Repeat steps (2) and (3) until the output criteria are fulfilled.
The concept of K-Means clustering is to vectorize all imagery words, whose center of mass is the vector center of n imagery words, computed as follows:
where:
RSSk indicates the distance between each imagery word in class k and the center of mass:
RSS is used to express the total center-of-mass distances for all classes:
3.2 Identify Reference Samples
Product images are taken from a company’s current product instance collection, and the samples are first integrated using product morphology analysis, which groups samples with similar profiles into one category. Although the morphological differences between samples are large enough to enable the diversification of gene characteristics in the gene pool. However, it can lead to effects such as instability of genetic traits and uncontrolled offspring characteristics. Therefore, it is only necessary to select a certain class of example samples and then apply the multidimensional scale analysis to classify these samples in terms of shape similarity. Next, a 5-point Likert scale questionnaire was developed using the imagery vocabulary. Users were invited to rate these categorized samples. Based on the combined ranking of the sample imagery scores, the most representative sample was selected from each sample category. This approach efficiently categorized the samples while guaranteeing a more comprehensive genetic profile. The example sample maps were then pre-processed using image processing applications such as CorelDRAW and Adobe Illustrator to provide the groundwork for sample parameterization, the specific steps are shown in Fig. 2.
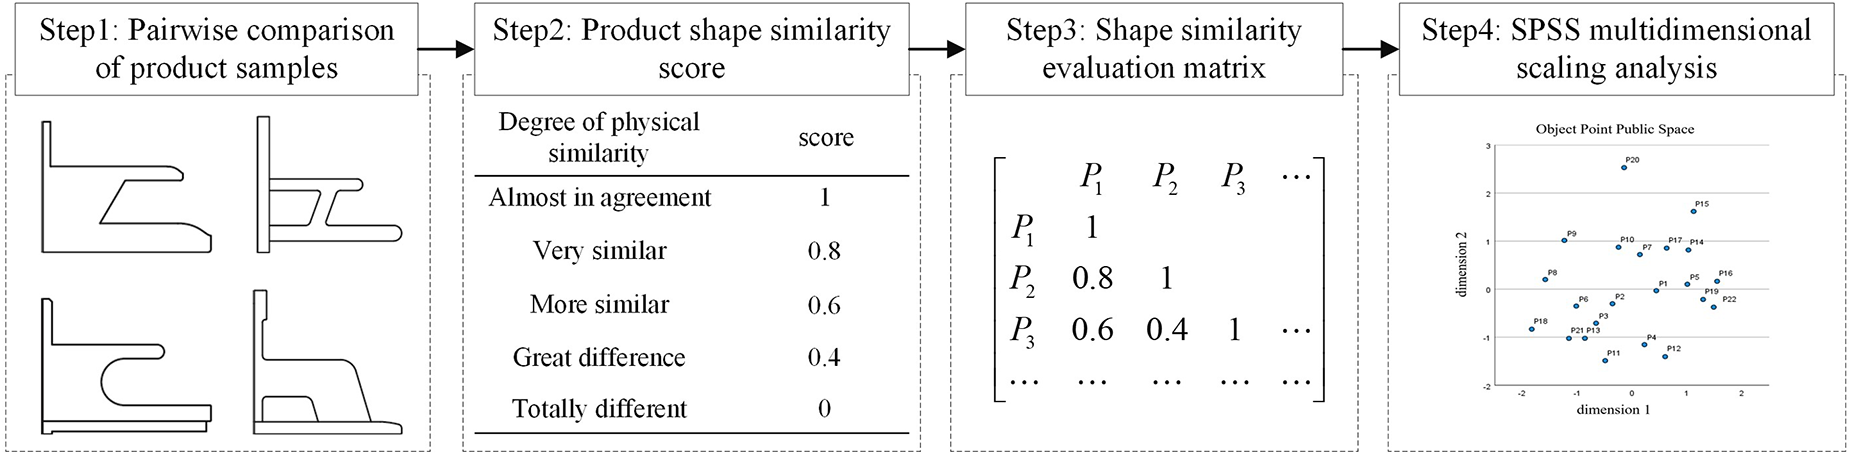
Figure 2: Sample multidimensional scale analysis steps
3.3 Instance Sample Parameterization
The process of digitally describing a product instance sample through the application of a suitable method that takes into account the characteristics of the product’s form is known as sample instance parameterization. Methods such as morphological analysis [29] and the curve control method [6] are often used to parameterize samples. In this paper, example samples are available with a more complete product side profile. Therefore, elliptical Fourier analysis [30] and principal component analysis [31] are used to extract the product side feature lines and key point 2D coordinate parameters to provide a quantitative analysis for shape optimization.
In the process of extracting product contours using MATLAB, sometimes some of the contours are missing. The key points of the missing part of the product contour can be extracted using elliptic Fourier analysis by inserting new points into the original contour coordinates. Then the two-dimensional coordinates of these points are calculated, and finally, the missing part of the key points are replaced by the average of the coordinates of these new points. The steps are as follows:
1. Image pre-processing: The initial product contour points are extracted using MATLAB 2022a to obtain a two-dimensional contour point consisting of the
2. Insert new coordinate points: assume that the number of points to be inserted is A, according to the formula for solving for the coordinates of any point between two points in the elliptic Fourier analysis:
3. Assuming that A of the requested
3.4 Perceptual Imagery Prediction Model Construction
3.4.1 Imagery Prediction Model Construction Based on Fuzzy Evaluation
The objective function of product modeling imagery optimization in the multi-objective optimization algorithm, the fitness function can be transformed into an objective function [32]. The optimization process of product shape is based on the fitness of each individual, and through repeated iterations, the individual with larger fitness is continuously sought, and finally, the approximate optimal solution of the optimization problem is obtained. This paper employs the semantic differential method and fuzzy evaluation to establish a mathematical model for fuzzy dynamic scoring of the imagery of key point coordinates in the initial sample. The scoring is then used to evaluate the degree of adaptation of product shape parameters. The procedure is as follows:
1. Compute the absolute value of the difference between the coordinates of the reference sample and the sample to be optimized.
where:
2. Fuzzy dynamic scores [33]
where:
3. According to Eq. (7), the larger the value indicates the larger the fitness of the sample. However, the multi-objective optimization algorithm generally minimizes the value of the function, therefore, this paper converts the fitness function into the objective function:
3.4.2 Determining the Coordinate Weights of Key Points
In Eq. (7),
1. In the eye-tracking experiment, t is the starting glance time; x is the sequence in which the participants stared at the key sites during the experiment; and u is the number of effective gaze points for each sample.
2. Defining to as the look-back time at a crucial point; α as the number of look-backs; and
The weights of the product profile’s main points may be calculated as follows based on the preceding definition:
where: W is the imagery weighting factor, with a range of [0, 1], i is the representative sample, h is the subject, T is the effective total gaze duration for a specific sample, and y is the total number of return gaze for a particular sample.
3.5 Product Profile Optimization Based on DNSGA-II
3.5.1 Definition of a Multi-Objective Optimization Problem
The mathematical formulation of the multi-objective optimization issue to be addressed in this study is as follows:
where:
As there are no globally optimum individuals in multi-objective optimization, the connection between optimal individuals may be represented mathematically as follows: if the solution vector
3.5.2 NSGA-II Basic Introduction
The NSGA-II method [35] primarily comprises rapid non-dominated sorting, tournament selection techniques, crossover, variation, and population updating. Fig. 3 depicts the primary processes.
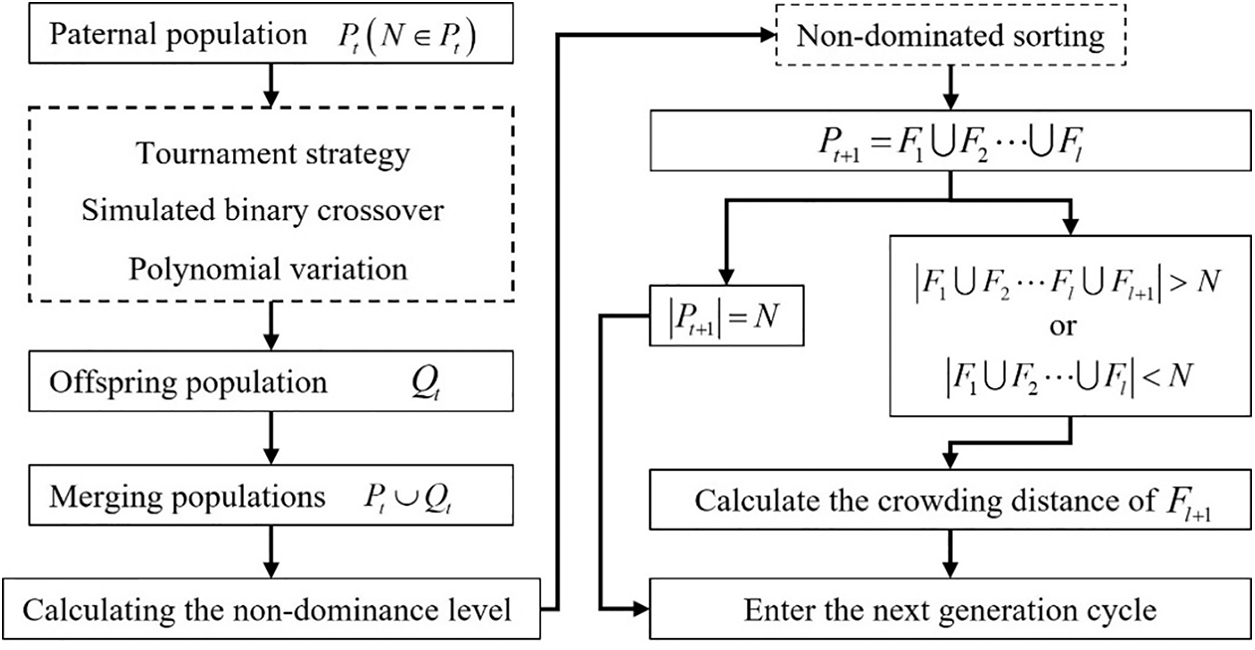
Figure 3: NSGA-II procedure
The various steps of the NSGA-II tournament approach are as follows:
1. Set the number of comparisons to 2 [35] and the size of the crossover pool to N.
2. The individual with the smaller non-dominance rank joins the crossover pool; if the two individuals have the same non-dominance rank, they are filtered according to their crowding distance, and the person with the greater crowding distance enters the crossover pool.
3. Continue the procedure until the crossover pool size is reached.
To maintain the genes of high-quality individuals, the tournament approach prioritizes those with a lower non-dominance rank and a greater crowding distance, as described above. However, this has a significant impact on the diversity of offspring during product shape optimization. Fig. 4 shows the results of a single run of NSGA-II with tournament strategy on Eq. (7). The number of individuals was 44. Other experimental parameters are described in detail in the example validation. As shown in Fig. 4, some individuals were repeatedly selected multiple times. Indicating that it is more common for individuals to be repeatedly selected multiple times in the tournament strategy.
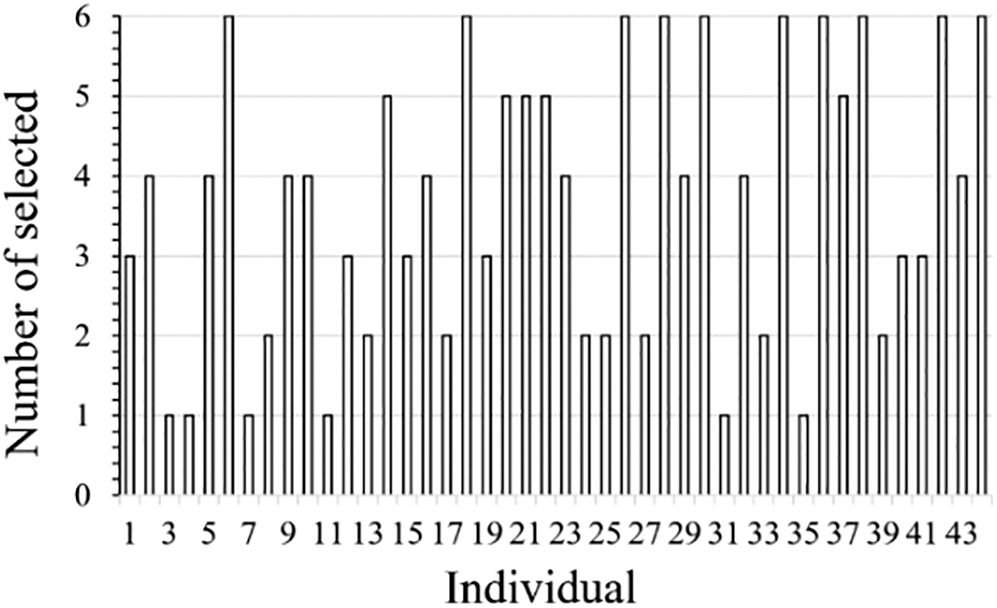
Figure 4: Statistics of the number of individual selections
3.5.3 NSGA-II Based on Degradation Strategy
The tournament selection approach is based on a descending strategy to solve the issue of recurrent selection of the parent individuals. The particular procedure is described as follows: A rapid non-dominated ranking is done on the parent population
where: l is the non-dominance rank of individual S;
If individual S is chosen once during the execution of the tournament selection policy, its priority will be adjusted to:
where: r is a constant, taking value in the range [0, 1] and a step size of 0.1. A larger indicates a lower priority for an individual.
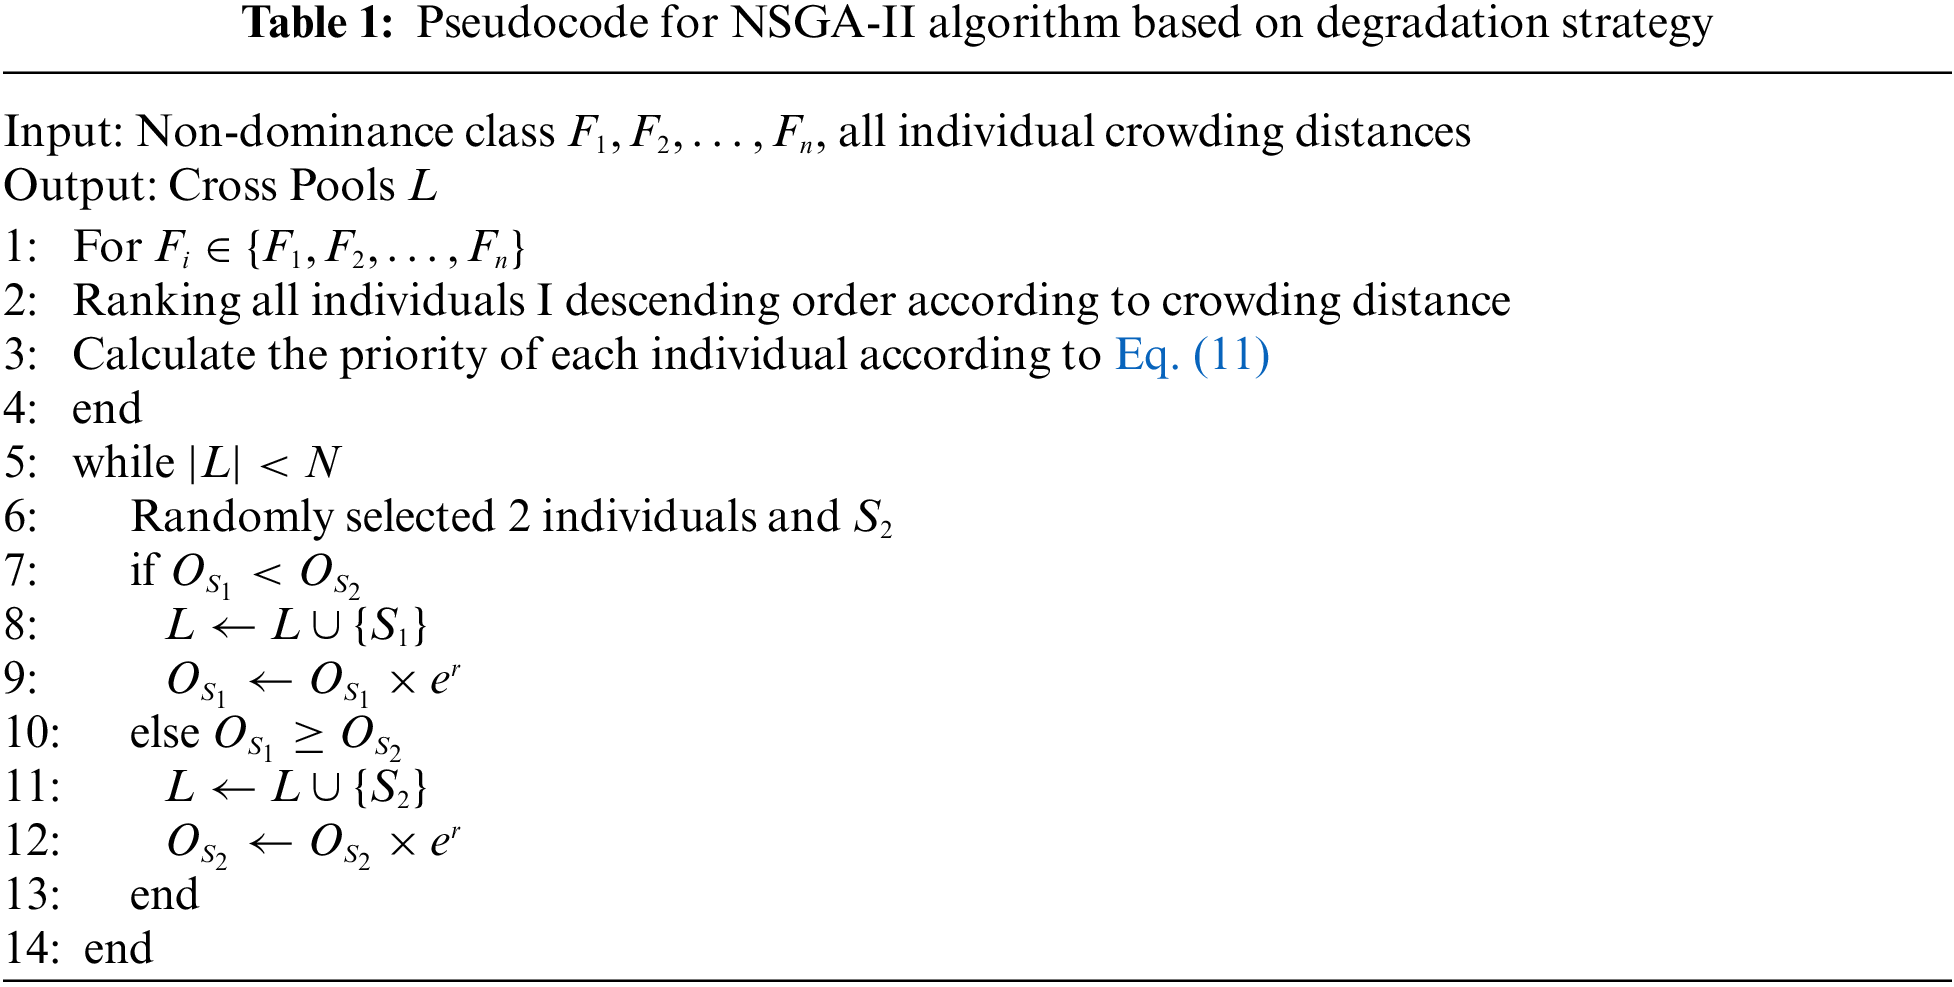
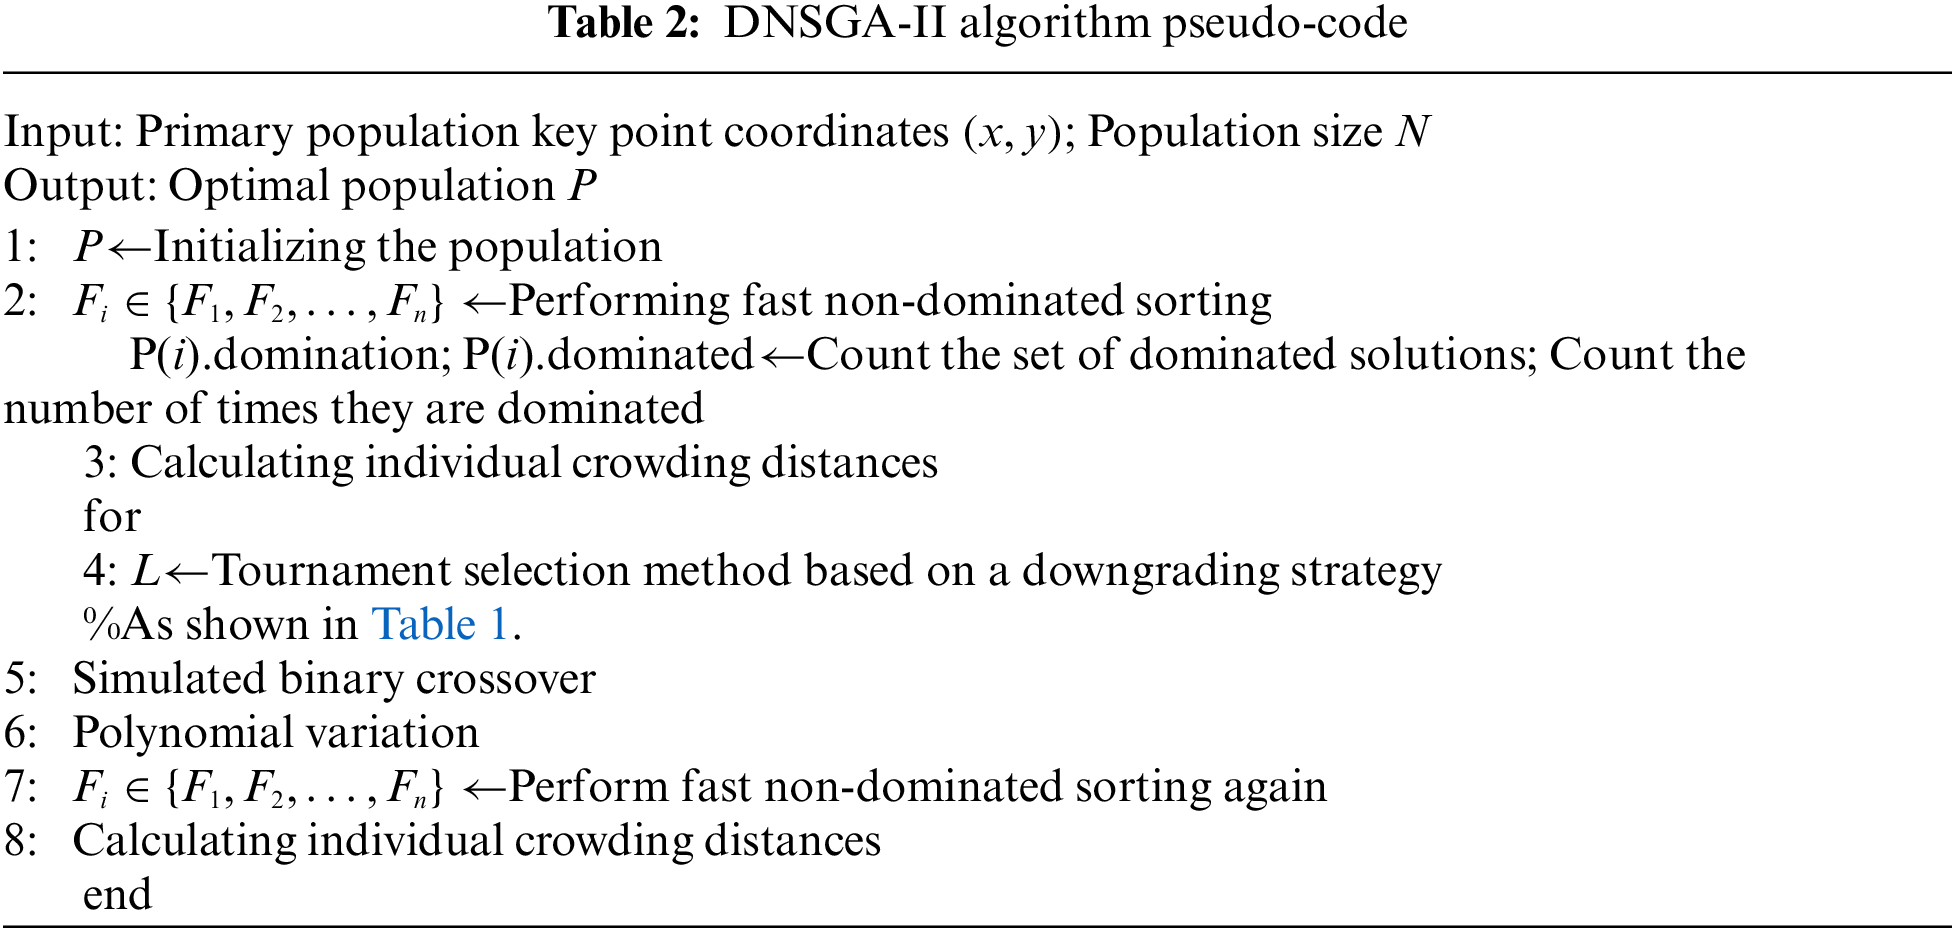
This strategy effectively reduces the likelihood of an individual S being chosen in the subsequent round. Table 1 displays the pseudocode for the NSGA-II algorithm’s detailed method based on the demotion approach. The whole pseudocode of the DNSGA-II algorithm is shown in Table 2.
4.1 Identify Objective Imagery
This paper introduces the proposed multi-objective optimization method for composite image product shape, taking the appearance optimization of medical transceiver stations as an example. A library of enterprise product examples provides a sample of research. Hospital shuttle stations can be divided into single-level stations and double-level stations according to their exterior structure. To ensure the stability of the genetic characteristics of the offspring, this study illustrates the application of the method in this paper by using the lateral map of the two-level site provided by the company as an example.
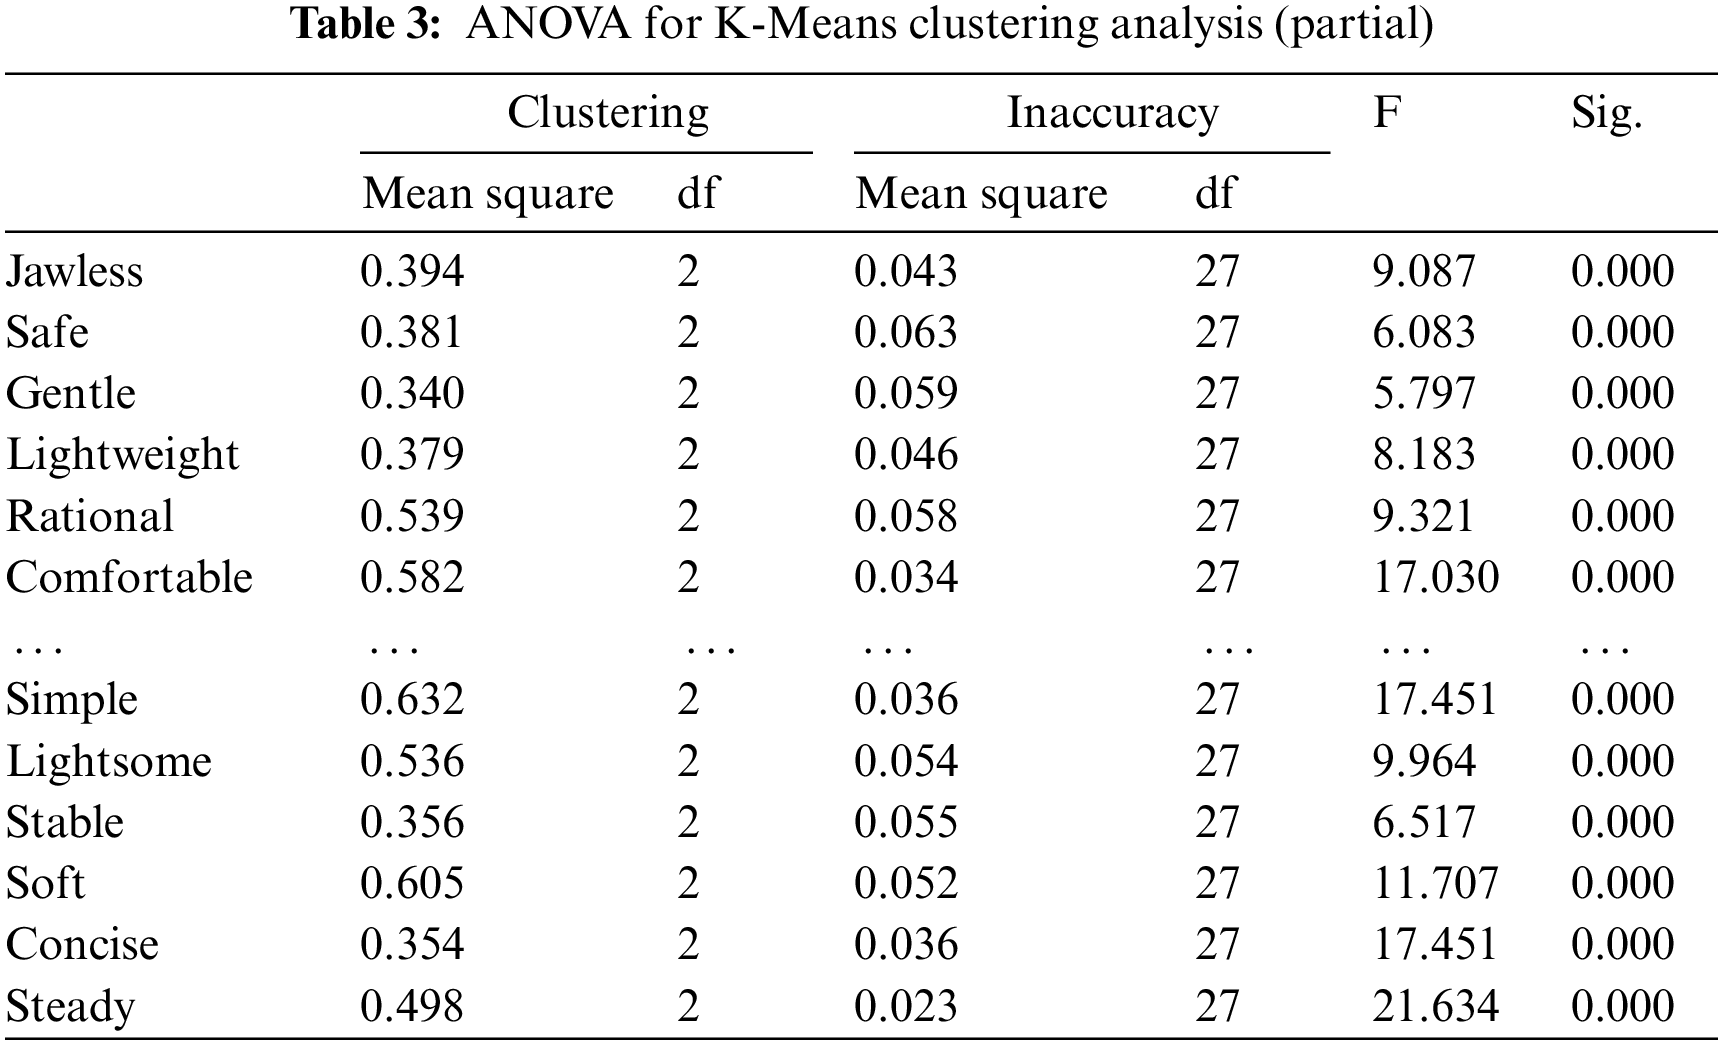
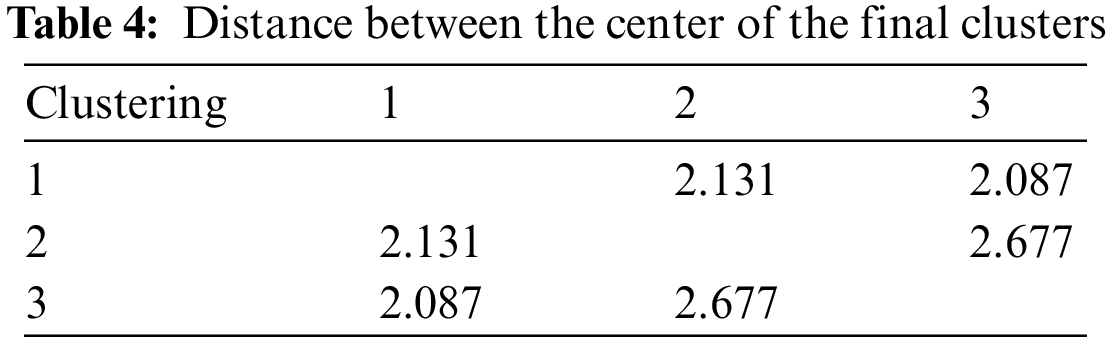
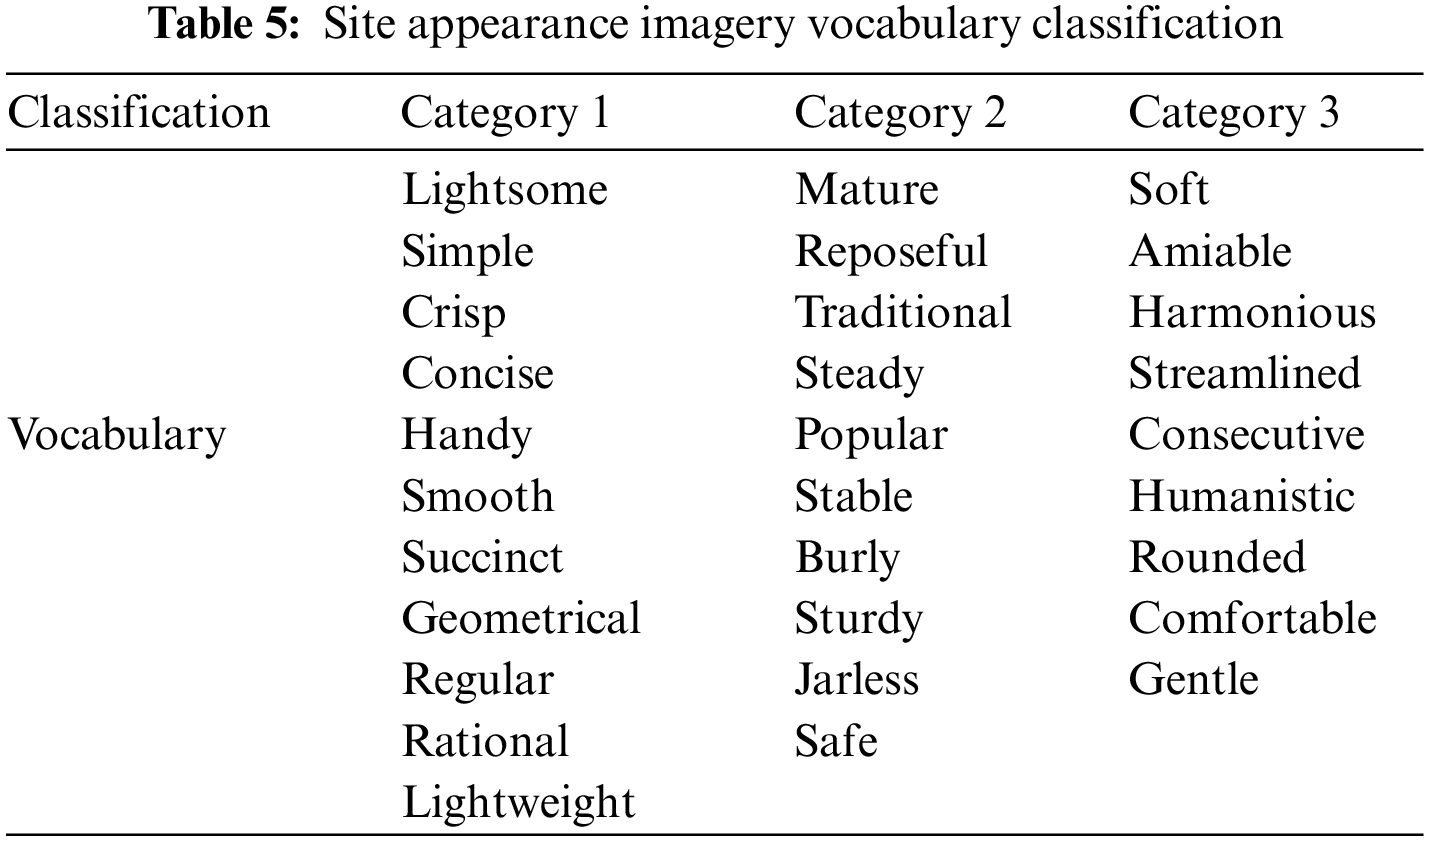
Initially, discussions with medical professionals, industrial design students, and site design engineers were used to compile an initial list of 50 image-related terms. A comparison analysis was conducted to exclude terms that were improper for the research as well as those with similar or repeating meanings, resulting in 30 imagery words. A questionnaire was subsequently created based on the semantic differential approach to quantify the semantics of the imagery vocabulary by comparing the semantic similarity of any two imagery terms. There were 50 questionnaires issued in all, but 46 were ultimately collected. The data findings were compiled to produce the vocabulary similarity matrix for images. The similarity matrix was input into Statistical Product and Service Solutions (SPSS) for K-Means clustering analysis, with the number of clusters set to 3. The mean squared errors of the K-Means clustering analysis are all less than 0.08, as shown in Table 3, meeting the error criteria. Table 4 shows the distance of words from the final clustering center. The 30 imagery words were categorized as indicated in Table 5 based on the findings of the K-Means cluster analysis.
Using a side profile of a hospital shift station, respondents were asked to select three words with high similarity from each category of imagery vocabulary. A total of 60 questionnaires were sent out, of which 60 were valid. As shown in Fig. 5, the votes for each imagery vocabulary were counted and a bar chart was constructed. Based on the voting results, stable, concise, and mild were selected as the representative visual vocabulary for this experiment.

Figure 5: Results of the 30 imagery words poll
4.2 Identify Reference Samples
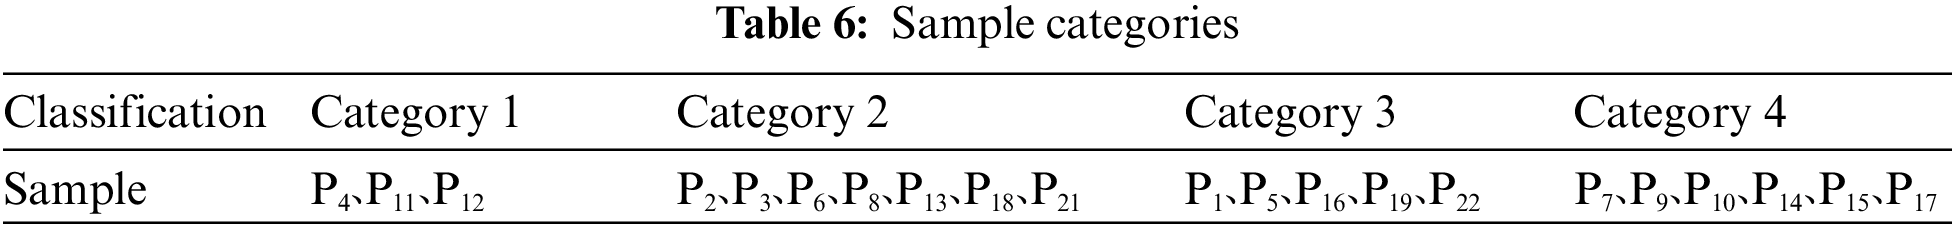
An initial sample of 30 cases was retrieved from the double-decker medical transport site instance library; however, after removing samples with nearly identical profiles and those with entirely distinct profile components, a final sample of 22 instances was produced. The similarity matrix of any two samples was assessed for shape similarity by four experts, and the similarity matrix of four sets of lower triangular matrix data was produced. The similarity matrix was entered into the SPSS software for multidimensional scale analysis, and the rubble diagram was created, as seen in Fig. 6. According to the rubric diagram, splitting the research sample into four groups is more suitable. The multidimensional scale analysis produced a Discrete Admixture Fraction (D.A.F) output of 0.984. Fig. 7 depicts the fit of the example sample under the multidimensional scale analysis. The model virtually fits as a line, and the two sets of data above demonstrate that the model fits well. Fig. 8 depicts the distribution of samples in the two-dimensional common space, and Table 6 divides all example samples into four groups based on the distribution of each sample scatter. Among them, sample P20 is far distant, perhaps as a result of the variation in individual ratings. Therefore, sample P20 is excluded.

Figure 6: Gravel map

Figure 7: Linear fitted scatter plot

Figure 8: Sample public space distribution map
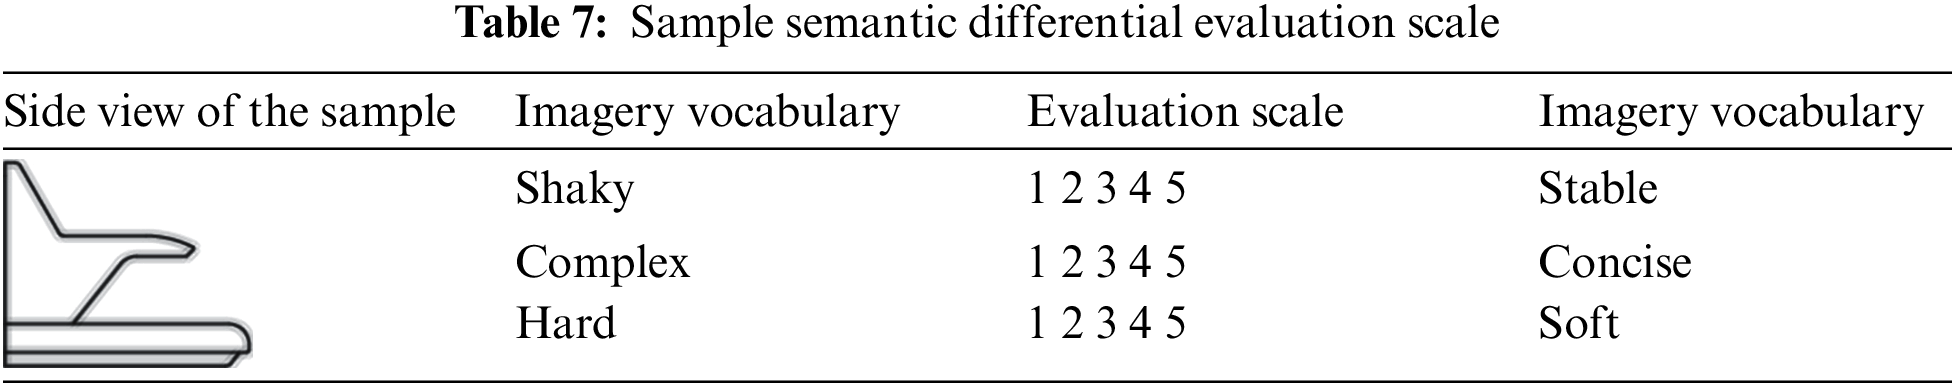
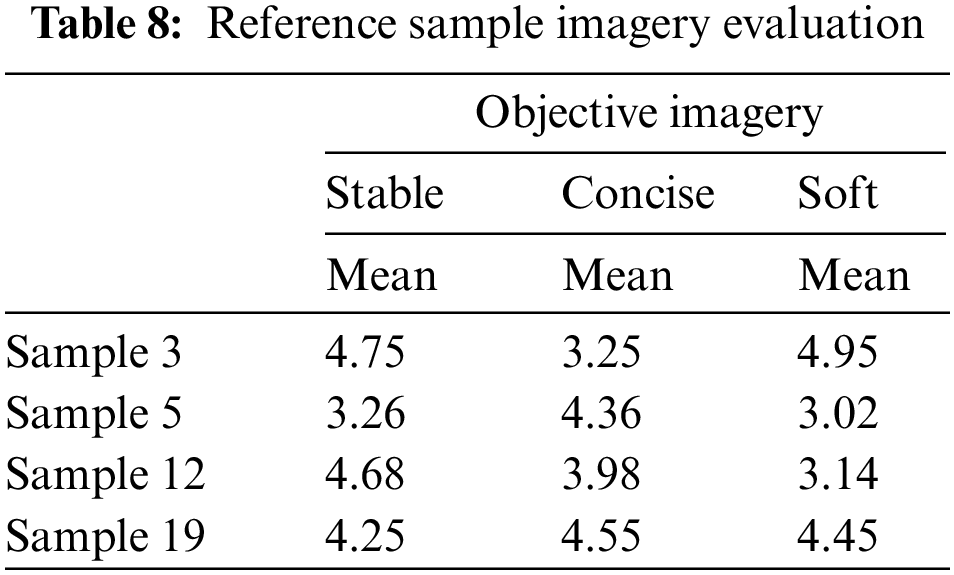
Using the semantic differential method to design the questionnaire, respondents combined the five-point Likert scale to evaluate the imagery of the example sample according to the target imagery, and the semantic evaluation scale is shown in Table 7. Taking solidity as an example, the evaluation score is 1 to 5. The larger the score of the example sample, the more the respondent thinks that the sample approximately conforms to the solidity imagery; conversely, the less the sample conforms to the solidity imagery. A total of 20 questionnaires were distributed, and 20 valid questionnaires were received. Limited to the length of the article, the article only shows the example samples that best fit the target imagery in the four sample sets, as shown in Table 8.
4.3 Reference Sample Parametrization
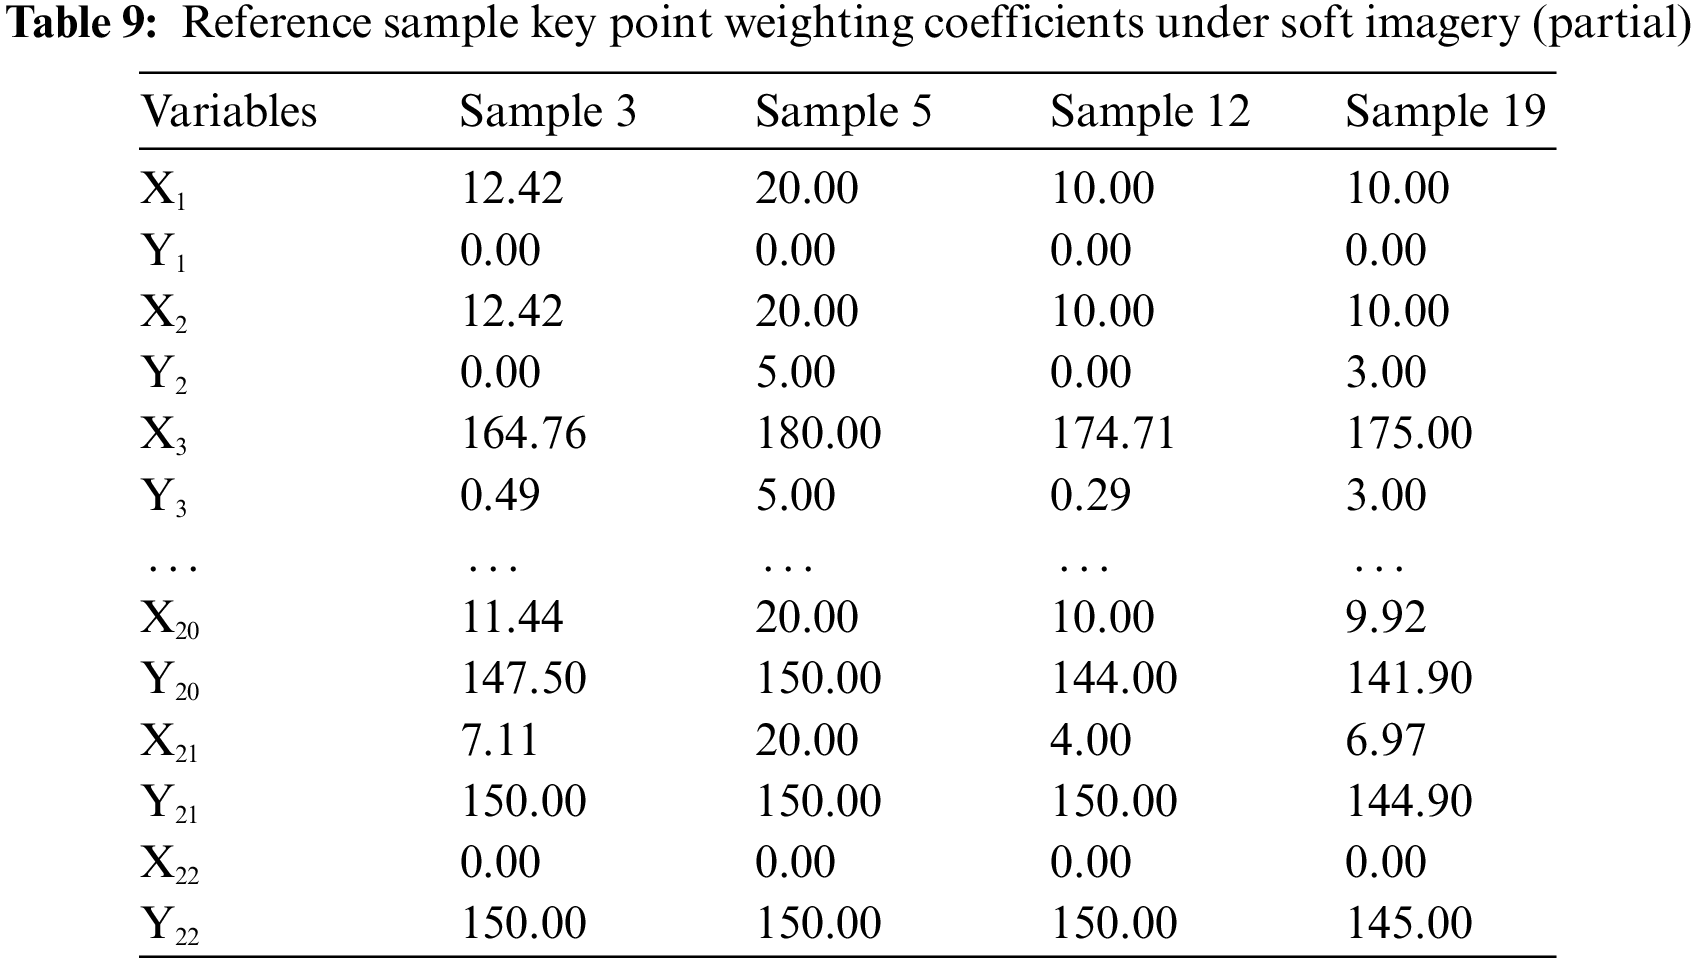
The procedure is as follows: 1) Preprocessing: The size of the sample side view is reduced to 200 * 200 dpi and converted to grayscale. 2) Contour line extraction Pepper noise is applied to the image and binarized, then the morphological opening and closing of the binarized noise image are calculated to generate a sample contour consisting of multiple points. The coordinates of key points are extracted. The points that are most similar to the sample contour line are selected and then the coordinate values of the key points are extracted using MATLAB’s coordinate display tool, see Fig. 9. In this study, the medical connection point shape optimization algorithm takes as input the coordinate values of each key point in a two-dimensional coordinate system so that the set of 22 key points in the transverse contour line of the medical transport point can represent the appearance of the product more comprehensively through product morphology analysis. Fig. 10 depicts the contour lines and key features of the reference sample. The coordinates of the key points are listed in Table 9. Due to space limitations, only some of the coordinate values are shown.

Figure 9: MATLAB profile extraction flow chart

Figure 10: Reference sample key point positioning
4.4 Determine the Imagery Weights of the Sample Key Points
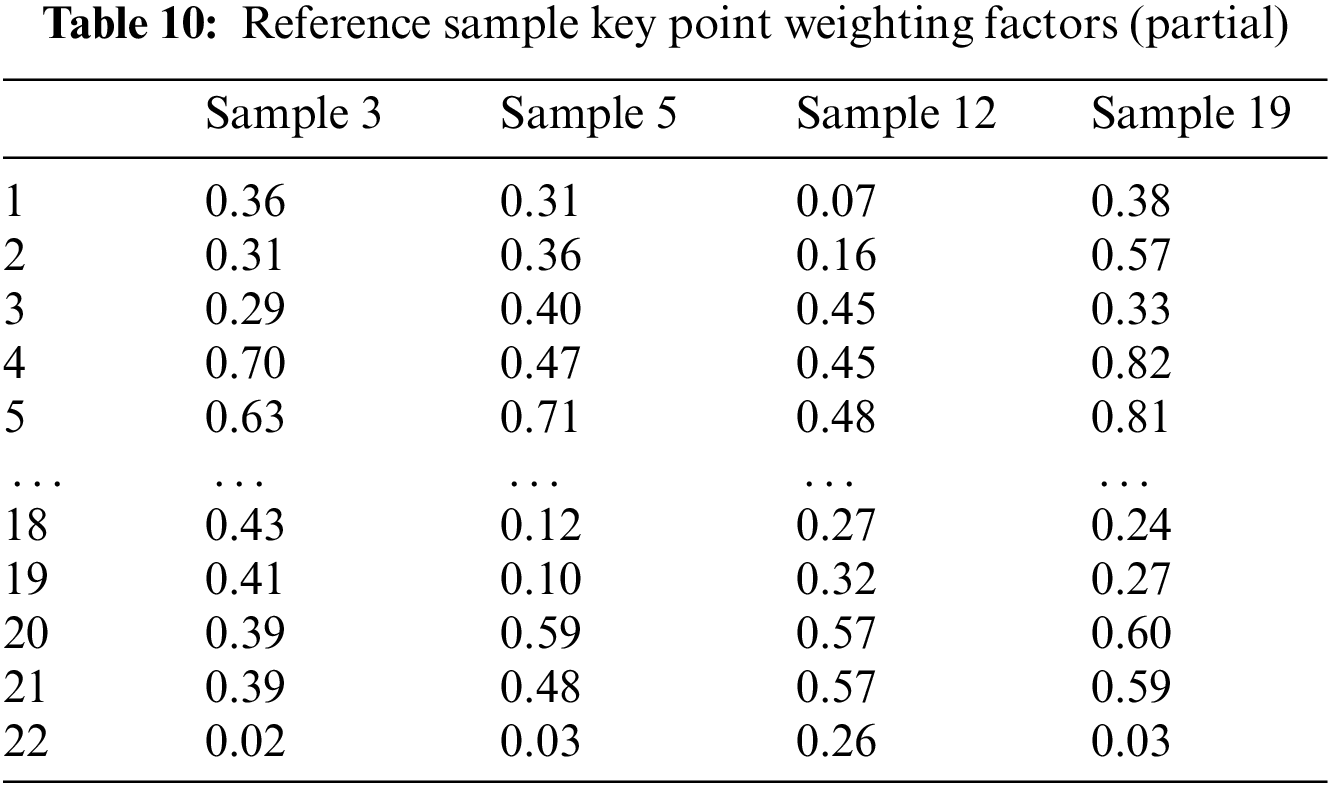
In Section 3.4.2, to obtain the weight coefficients of each key point of the reference sample under the three perceptual imagers, an eye-tracking experiment was designed using the equipment model EC60, also known as the Telemetric Eye-tracking Experiment System, and the experimental scenario is depicted in Fig. 11. The experiment was conducted as follows: 1) Before to beginning the eye movement experiment, the equipment had to be calibrated, and the volunteers were told of the visual language for this series of tests. 2) Throughout the experiment, the participants were required to see each first sample side image for eight seconds to see each first sample side image for eight seconds. A gray page was added between each pair of sample images to avoid visual residuals from influencing the trial outcomes. 3) The preceding experimental technique was repeated until all participants had finished the experiment. All of the 15 participants in this investigation on eye movements had normal visual acuity. Fig. 12 depicts the eye movement trajectory (b) of all individuals after deleting incorrect gaze locations. After receiving the eye-movement data, the imaging weight coefficients W for each key point of the reference sample may be calculated using the formula given in Eq. (9). Table 10 displays the imaging weight coefficients for a few important places under soft imagery. To make the computation easier, the weighting coefficient values in Table 10 have been multiplied by a factor of 10.
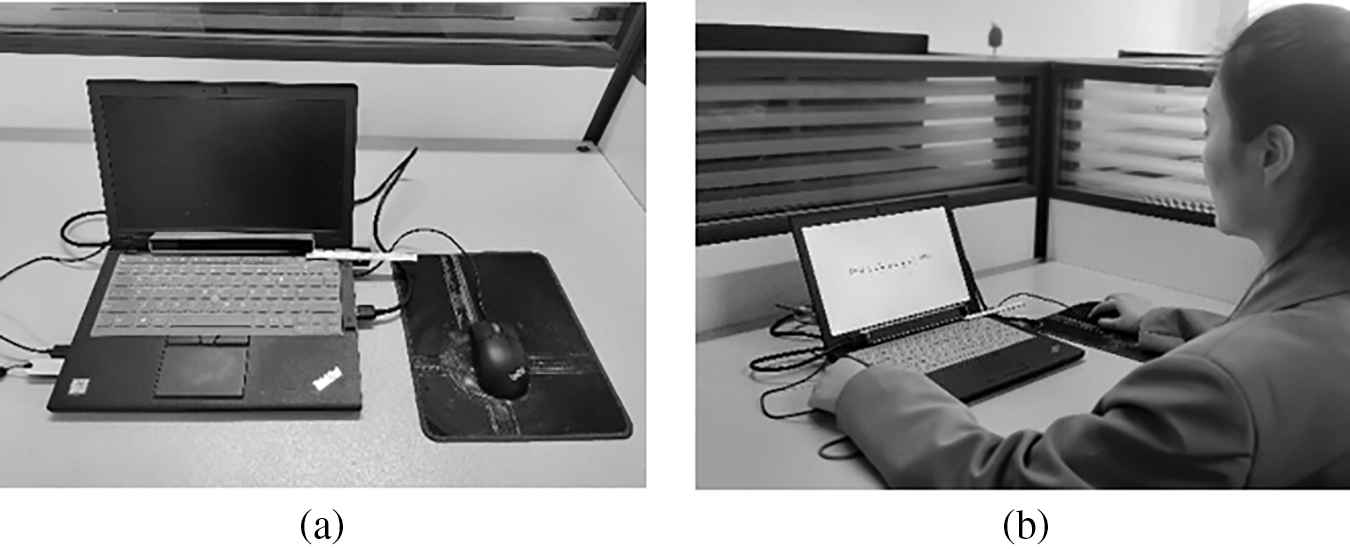
Figure 11: (a) Experimental equipment; (b) experimental scenarios
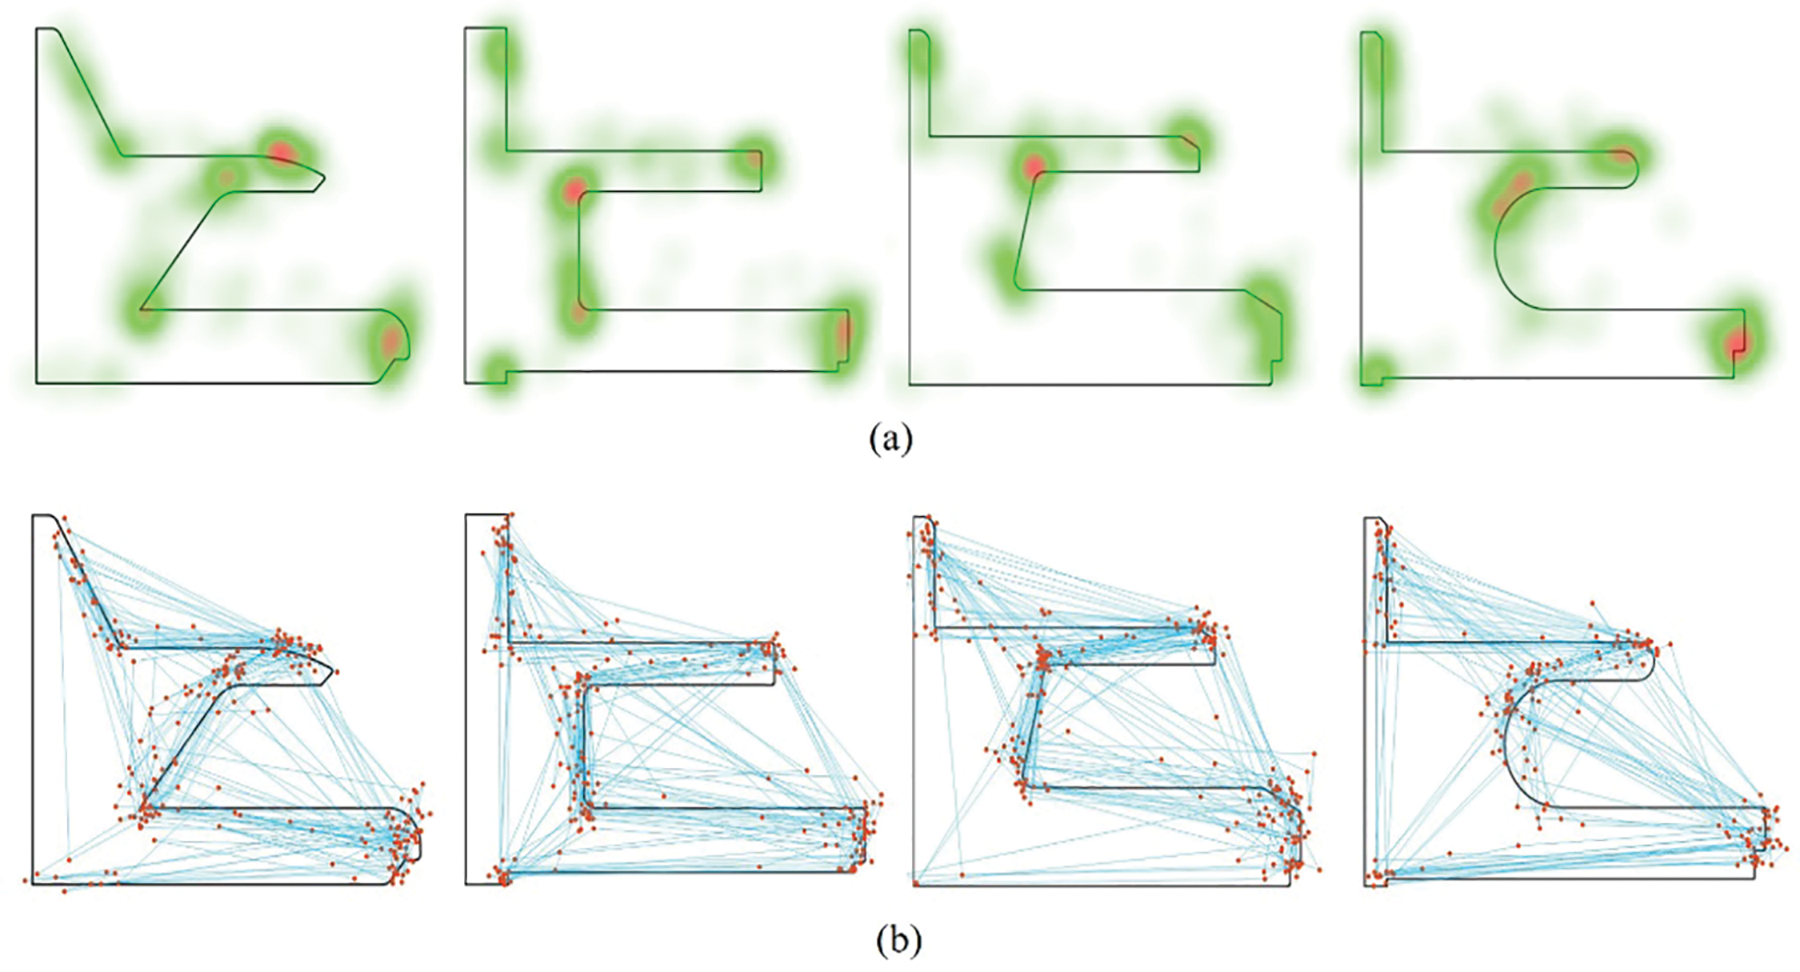
Figure 12: (a) Focus on the hotspot map, (b) gaze trajectory map
4.5 Determine the Objective Function of Perceptual Imagery Optimization
In the product modeling imagery optimization of this paper, since the real Pareto frontier cannot be obtained precisely, this paper combines Eqs. (7) and (8) into the objective function of product modeling optimization and uses the degree of adaptation of product modeling as the perceptual imagery fuzzy score to judge the degree of merit of the modeling scheme. Three objective functions of solid, simple and soft imagery optimization are given, respectively:
Objective function of stable imagery
Objective function of concise imagery
Objective function of soft imagery
The expression of the combined multi-objective optimization function is as follows:
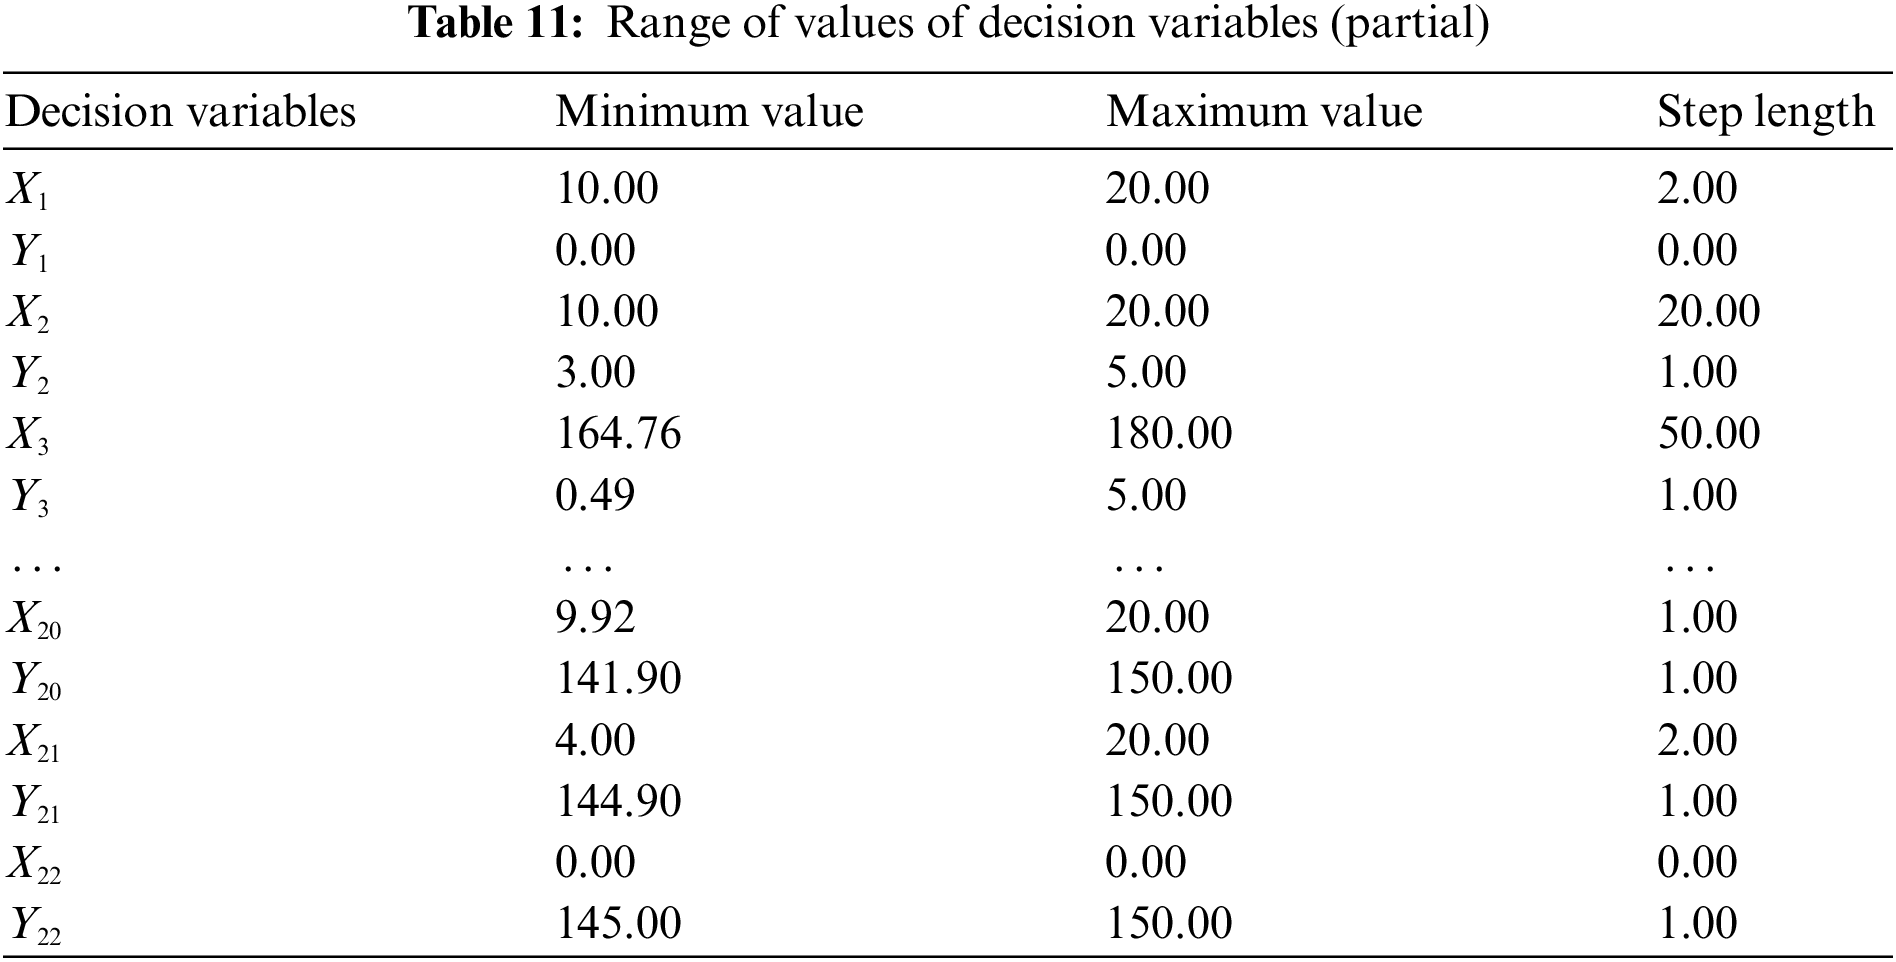
The decision variables of the objective function are the coordinates of the key points of the product profile, and the range of the decision variables is determined by the coordinates of the four reference samples, specifically, the coordinate values of the four reference samples are compared horizontally, and the maximum and minimum values of each coordinate are taken as the range of the decision variables, as shown in Table 11, which gives the range of the coordinates of some key points. The step size of each decision variable is determined according to the requirements of the company’s design and manufacturing experts.
4.6 Validation of the Objective Function
According to Subsection 4.5, the output of the objective function is the fuzzy imagery score of product modeling. To verify the validity of the fuzzy imagery score predicted by the objective function, the remaining product examples in Subsection 4.2 with the reference samples removed are used as the test samples, and the key point coordinates are extracted and input into Eqs. (13)–(15), respectively, to obtain the fuzzy score of each sample relative to the absolute values of the scores are compared with the actual imagery scores of the user for the test samples to verify the effectiveness of the objective function in predicting the imagery scores of the samples, as shown in Fig. 13. To visually compare the fuzzy imagery scores with the users’ actual imagery scores, all the scores are normalized so that their values are grouped between [0, 1]. As can be seen from Fig. 13, the output of the fuzzy evaluation function for the three perceptual imagery tends to be consistent with the results of the actual survey. It indicates that the fuzzy evaluation functions of the 3 perceptual imageries have good predictiveness and can be used as the objective function for product appearance optimization.

Figure 13: (a) Predictive performance of stable imagery objective function; (b) predictive performance of concise imagery objective function; (c) predictive performance of soft imagery objective function
4.7 Evaluation of the Outcomes of Product Appearance Enhancement
As can be seen from Section 4.5, Eqs. (13)∼(15) are the objective functions for product shape optimization, and the DNSGA-II optimization objectives are three. The method was created using MATLAB 2022a. Fig. 14 depicts the two-dimensional plot of the Pareto border produced by several iterations. The graph illustrates that as the number of iterations hits 200, the Pareto border becomes more equally distributed and tends to remain stable. Thus, the Pareto frontier with 200 iterations is chosen as the best solution set for optimizing product form. The algorithm’s parameters are set as follows: The number of iterations is 200, the crossover probability is 0.8, and the mutation probability is 0.1. Fig. 15a depicts the final Pareto frontier for optimizing the design of the medical connection site. To further illustrate the Pareto fronts, the optimum solution set in Fig. 15a is translated into the two-dimensional expressions presented in Figs. 15b–15d, which show the Pareto fronts for stable and soft, concise, and soft, and stable and concise, respectively. Fig. 15e is a parallel coordinate plot of Fig. 15a. Next, designers need to make decisions on product schemes based on the product functions, operating environment and manufacturing costs.

Figure 14: Pareto bounds for different numbers of iterations

Figure 15: (a) The Pareto front of three objectives; (b) the relationship between stable and soft;(c) the relationship between concise and soft; (d) the relationship between stable and concise; (e) parallel coordinate diagram of Pareto front
To verify the performance of the proposed DNSGA-II multi-imagery objective optimization algorithm, four other sets of experiments were conducted in the same environment to introduce the traditional NSGA-II, Strength Pareto Evolutionary Algorithm-II (SPEA-II), Multi-objective Evolutionary Algorithm Based on Decomposition (MOEA/D) and Non-dominated Sorting Genetic AlgorithmIII (NSGA-III) to compare the algorithm performance with DNSGA-II, and the advantages of each algorithm are shown in Table 12. The experimental results of the five groups are plotted as shown in Fig. 16. From Fig. 16, it can be seen that DNSGA-II has a wider search range and is more evenly distributed, while the other optimization algorithms all have uneven distribution or smaller search space.
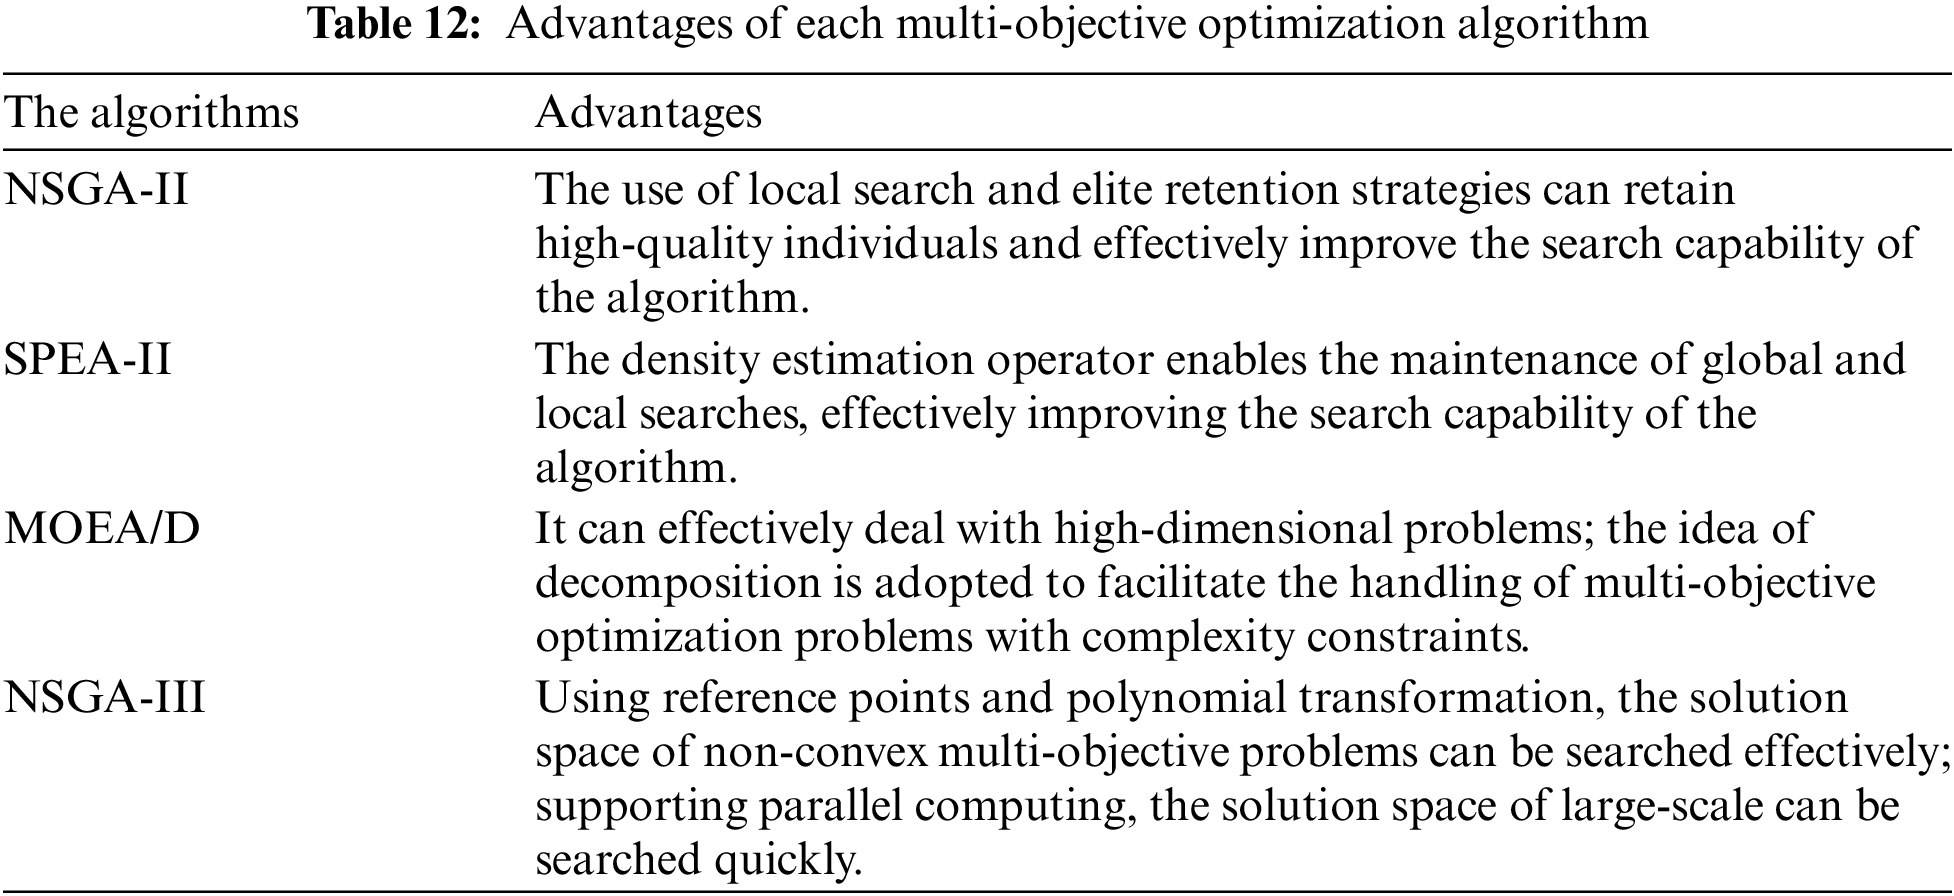

Figure 16: Comparison of the results of DNSGA-II, NSGA-II, SPEA-II, MOEA/D and NSGA-III
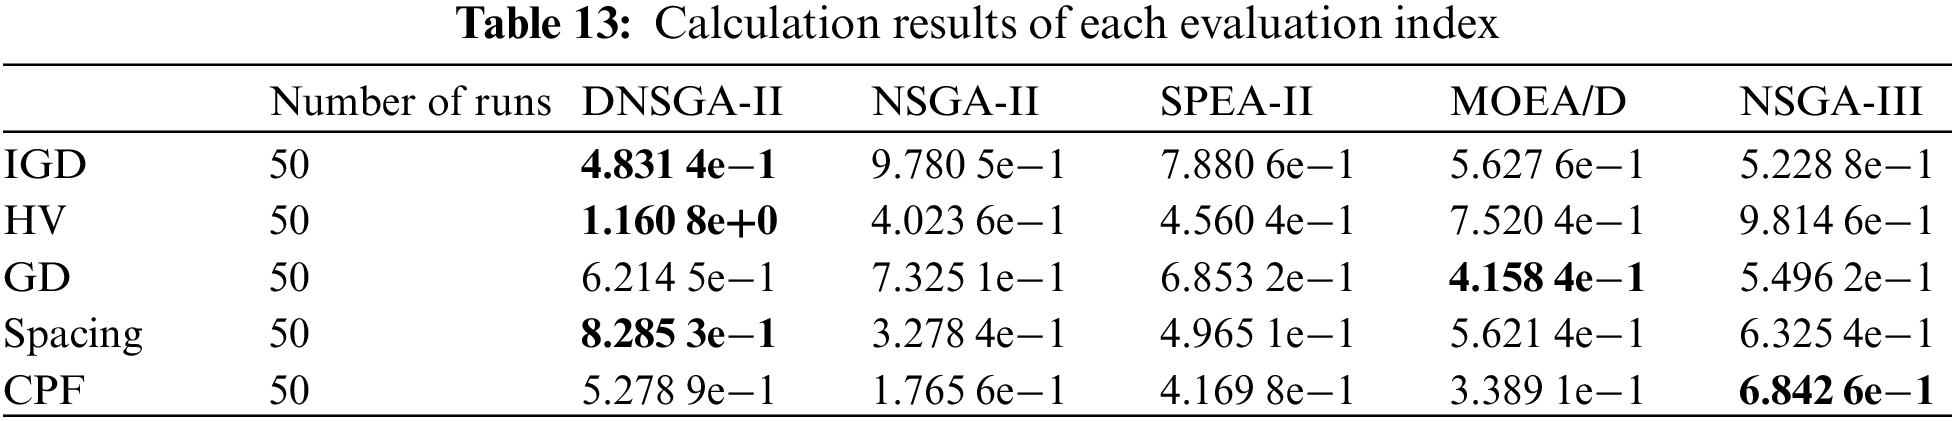
To further validate the performance of the algorithm, it was further evaluated using Inverted Generational Distance (IGD), Hypervolume (HV), Generational Distance (GD), Spacing Metric (Spacing) and Convergence and Preservation Factor (CPF) [36]. The IGD and HV metrics mainly evaluate the convergence and diversity of the algorithm. the smaller the IGD value, the better the performance of the algorithm. The larger the HV value, the better the overall performance of the algorithm. In this paper, four reference samples are used as true Pareto fronts to calculate the IGD values, while their centroids are used as reference points to calculate the HV values. DG mainly evaluates the convergence of the algorithm, and the smaller the GD value, the better the convergence of the algorithm. Spacing mainly evaluates the distributivity of the algorithm, and the larger the Spacing value, the better the distributivity of the algorithm. The CPF mainly evaluates the effectiveness of the algorithm in balancing convergence and diversity, and a higher CPF value indicates that the algorithm has achieved a better balance between convergence and diversity. The computed results of the evaluation metrics of the algorithm are shown in Table 13. the results show that DNSGA-II obtains optimal results in terms of IGD and HV, indicating that the algorithm has a good overall performance. The GD value of DNSGA-II is greater than MOEA/D and NSGA-III, indicating that DNSGA-II is less convergent than both. Interval value of DNSGA-II The CPF value of DNSGA-II is smaller than that of NSGA-III, which indicates that DNSGA-II is inferior to NSGA-III in terms of convergence and diversity of the balancing algorithm. From the above results, it can be seen that DNSGA-II performs best in maintaining individual diversity. The convergence of the algorithm is not well represented, but in general, the overall performance of DNSGA-II is better than both NSGA-II and SPEA-II.
The product appearance optimization methodology developed in this research may successfully improve current product form ideas based on the user’s perceptual image. 1) A user perceptual image cognition experiment was performed using a perceptual engineering research approach, and three objective imageries of stable, concise, and soft were generated by K-means clustering analysis. 2) The objective function of product shape imagery optimization is constructed according to the fuzzy evaluation method, and an eye-movement experiment was created to estimate the imagery weight value of each set of coordinates of the research samples. 3) The NSGA-II method based on the degradation strategy was suggested, and the coordinates of the outer contour of the samples to be assessed were utilized as the decision variables for optimizing the form of the medical feeder station, as an example. Twenty sets of optimum Pareto solution sets were obtained through experiments. The ultimate solution of the product profile must be assessed based on consumption environment, manufacturing cost, production time, and other criteria. Compared to conventional NSGA-II, SPEA-II, MOEA/D and NSGA-III, DNSGA-II has a broader range of Pareto fronts, a more uniform distribution, and a higher overall performance. It successfully overcomes the issue of people being regularly picked many times, resulting in decreased population variety, assures the diversity of individuals in the ideal solution set, and gives a larger search space. The model is also relevant to other multi-objective product appearance optimization challenges.
It is important to note that in this research, the model is based on two-dimensional product outlines, and other factors that impact the perceptual imaging of product forms, such as product material and color, are omitted. In the future study, the use of 3D products in the multi-objective imagery optimization of the form will be further investigated, and the materials and colors of the goods will be integrated to discover more precise ways of product shape parameterization.
Acknowledgement: The authors also gratefully acknowledge the helpful comments and suggestions of the reviewers, which have improved the presentation.
Funding Statement: This research project was supported by National Natural Science Foundation Grant 52065010; the Science and Technology Project supported by Guizhou Province of China ZK [2021]341 and [2021]397; the transformation Project of Scientific and Technological Achievements in Guiyang, Guizhou Province, China [2021]7-3.
Author Contributions: Study conception and design: Yinxue Ao, Jian Lv; data collection: Jian Lv, Zhengming Zhang; analysis and interpretation of results: Yinxue Ao; draft manuscript preparation: Yinxue Ao; Jian Lv and Qingsheng Xie reviewed the results and approved the final version of the manuscript.
Availability of Data and Materials: The data used in this paper can be requested from the corresponding author upon request.
Conflicts of Interest: The authors declare that they have no conflicts of interest to report regarding the present study.
References
1. E. Akgül, M. Özmen, C. Sinanoğlu and E. Kizilkaya Aydoğan, “Rough Kansei mining model for market-oriented product design,” Mathematical Problems in Engineering, vol. 2020, no. 5, pp. 1–11, 2020. [Google Scholar]
2. X. Li, J. N. Su, P. Z. Zhang and R. S. Bai, “Product innovation concept generation based on deep learning and Kansei engineering,” Journal of Engineering Design, vol. 32, no. 10, pp. 56–66, 2021. [Google Scholar]
3. L. Li, Z. E. Guo and M. Q. Yang, “Current research situation and trend of product image-based modeling optimization,” Packaging Engineering, vol. 41, no. 2, pp. 65–79, 2020. [Google Scholar]
4. M. Ding, T. T. Ding, M. J. Song, X. X. Zhang and Z. Liu, “Product color emotional design method based on the implicit measurement and BP neural network,” Computer Integrated Manufacturing Systems, vol. 5, no. 13, pp. 1–15, 2022. [Google Scholar]
5. H. Ren, Y. P. Tan and N. N. Zhang, “Research on form design of automotive dashboard based on Kansei engineering,” in 2019 7th Int. Forum on Industrial Design, Luoyang, China, pp. 34–40, 2019. [Google Scholar]
6. Z. Wang, W. D. Liu, M. L. Yang and D. J. Han, “Product from image design based on elliptic Fourier,” Computer Integrated Manufacturing Systems, vol. 26, no. 2, pp. 481–495, 2020. [Google Scholar]
7. Z. H. Lin, J. C. Woo, F. Luo and Y. T. Chen, “Research on sound imagery of electric shavers based on Kansei engineering and multiple artificial neural networks,” Applied Sciences, vol. 12, no. 20, pp. 78–89, 2022. [Google Scholar]
8. Y. Yeh, “Prediction of optimized color design for sports shoes using an artificial neural network and genetic algorithm,” Applied Sciences, vol. 10, no. 5, pp. 1560–1576, 2020. [Google Scholar]
9. S. W. Hsiao, F. Y. Chui and S. H. Lu, “Product-form design model based on genetic algorithms,” International Journal of Industrial Ergonomics, vol. 40, no. 3, pp. 237–246, 2010. [Google Scholar]
10. L. Xue, Y. Xiao and Y. Zhang, “Research on optimized product image design integrated decision system based on Kansei engineering,” Applied Sciences, vol. 10, no. 4, pp. 56–68, 2020. [Google Scholar]
11. Y. X. Wu, “Product form evolutionary design system construction based on neural network model and multi-objective optimization,” Journal of Intelligent & Fuzzy Systems, vol. 39, no. 5, pp. 112–120, 2020. [Google Scholar]
12. Y. R. Jiao and Q. X. Qu, “A proposal for Kansei knowledge extraction method based on natural language processing technology and online product reviews,” Computers in Industry, vol. 108, pp. 1–11, 2019. [Google Scholar]
13. Y. F. Dong, R. Z. Zhu, W. Peng, Q. H. Tian, G. Guo et al., “A fuzzy mapping method for Kansei needs interpretation considering the individual Kansei variance,” Research in Engineering Design, vol. 32, no. 2, pp. 175–187, 2021. [Google Scholar]
14. F. Guo, Q. X. Qu, N. Mitsuo and V. Duffy, “A proposal of the event-related potential method to effectively identify Kansei words for assessing product design features in Kansei engineering research,” International Journal of Industrial Ergonomics, vol. 76, no. 5, pp. 66–76, 2020. [Google Scholar]
15. K. Wang, R. H. Tan, Q. J. Peng and L. L. Zhang, “Evaluation of design innovation using the lengthy-time dimension and regression analysis,” Journal of Mechanical Science and Technology, vol. 36, no. 11, pp. 5625–5637, 2022. [Google Scholar]
16. Y. Wang, Q. X. Zhao, J. Chen, W. W. Wang, S. H. Yu et al., “Perceptual quantitative decision making and evaluation of product stylable topology design,” Processes, vol. 10, no. 9, pp. 65–75, 2022. [Google Scholar]
17. S. Dar, Y. F. Li and C. Yang, “Comparison of multi-objective evolutionary algorithms in hybrid Kansei engineering system for product form design,” Advanced Engineering Informatics, vol. 36, pp. 31–42, 2018. [Google Scholar]
18. Y. F. Li and L. P. Zhu, “Research on form design of product image based on conjoint analysis,” Journal of Graphics, vol. 33, no. 4, pp. 121–128, 2012. [Google Scholar]
19. S. Y. Han, Z. F. Shi and Y. K. Shi, “Cultural and creative product design and image recognition based on the convolutional neural network model,” Computational Intelligence and Neuroscience, vol. 20, no. 22, pp. 1–8, 2022. [Google Scholar]
20. W. M. Liu and J. J. Leng, “The application research of fuzzy mathematics in design quality evaluation of the industrial product,” IOP Conference Series. Materials Science and Engineering, vol. 573, no. 1, pp. 120–125, 2019. [Google Scholar]
21. Z. D. Zhu, P. M. Zhang, Z. Li, H. L. Sun, Z. Fan et al., “A study on a fuzzy comprehensive evaluation of screw pump design schemes with value engineering,” in 2019 IEEE 6th Int. Conf. on Industrial Engineering and Applications (ICIEA), Tokyo, Japan, pp. 58–66, 2019. [Google Scholar]
22. A. J. Liu, H. S. Hu, X. Zhang and D. M. Lei, “Novel two-phase approach for process optimization of customer collaborative design based on fuzzy-qfd and DSM,” IEEE Transactions on Engineering Management, vol. 64, no. 2, pp. 11–13, 2017. [Google Scholar]
23. K. J. Kim, H. Moskowitz, A. Dhingra and G. Evans, “Fuzzy multicriteria models for quality function deployment,” European Journal of Operational Research, vol. 121, no. 3, pp. 165–178, 2000. [Google Scholar]
24. B. Y. Wu and R. T. Han, “Image representational path of regional cultural and creative products based on genetic algorithm,” Computational Intelligence and Neuroscience, vol. 2022, no. 10, pp. 1–11, 2022. [Google Scholar]
25. W. Wei and P. Y. Wang, “Scale-based product family optimization design based on the improved amps in selecting an optimum strategy,” Robotics and Computer-Integrated Manufacturing, vol. 57, no. 3, pp. 370–378, 2019. [Google Scholar]
26. X. G. Wang, P. F. Sun, W. J. Zuo and J. T. Bai, “Multi-objective optimization of automobile body frame considering weight, rigidity, and frequency for conceptual design,” Advances in Mechanical Engineering, vol. 14, no. 2, pp. 168–176, 2022. [Google Scholar]
27. Y. P. Li, Y. B. Ni, N. Zhang and Z. H. Liu, “Modularization for the complex product considering the design change requirements,” Research in Engineering Design, vol. 32, no. 4, pp. 507–522, 2021. [Google Scholar]
28. N. Weinberger and M. Feder, “K-vectors: An alternating minimization algorithm for learning regression functions,” IEEE Transactions on Information Theory, vol. 66, no. 11, pp. 7196–7221, 2020. [Google Scholar]
29. M. Kwon, J. Lee and Y. Hong, “Product-service system business modeling methodology using morphological analysis,” Sustainability, vol. 11, no. 5, pp. 1376–1384, 2019. [Google Scholar]
30. W. D. Yue, J. Ren, Z. Z. Liu, N. Yang and J. J. Chu, “Conceptual product family design based on spectrum gene control,” Computer Integrated Manufacturing Systems, vol. 27, no. 11, pp. 3273–3281, 2021. [Google Scholar]
31. Y. P. Yang, J. Yu and G. P. Wang, “Decision-making of product industrial design based on incomplete reciprocal preference relations,” Computer Integrated Manufacturing Systems, vol. 27, no. 3, pp. 878–886, 2021. [Google Scholar]
32. S. Garcia and C. T. Trinh, “Comparison of multi-objective evolutionary algorithms to solve the modular cell design problem for novel biocatalysis,” Processes, vol. 7, no. 6, pp. 361–369, 2019. [Google Scholar]
33. Z. Q. Su, “Research on muti-objective optimization design of product under genetic factor,” Ph.D. dissertation, Shandong University of Science and Technology, China, 2017. [Google Scholar]
34. J. N. Su, K. Qiu, S. T. Zhang, L. W. Xiao and X. X. Zhang, “Evaluation method study of product modeling design elements based on eye movement data,” Journal of Machine Design, vol. 34, no. 10, pp. 124–128, 2017. [Google Scholar]
35. K. Deb, S. Agrawal, A. Pratap and T. Meyarivan, “A fast and elitist multiobjective genetic algorithm: NSGA-II,” IEEE Transactions Evolutionary Computation, vol. 6, no. 2, pp. 112–133, 2002. [Google Scholar]
36. I. O. Essiet, Y. Sun and Z. Wang, “Improved genetic algorithm based on particle swarm optimization-inspired reference point placement,” Engineering Optimization, vol. 51, no. 7, pp. 1097–1114, 2019. [Google Scholar]
Cite This Article
 Copyright © 2023 The Author(s). Published by Tech Science Press.
This work is licensed under a Creative Commons Attribution 4.0 International License , which permits unrestricted use, distribution, and reproduction in any medium, provided the original work is properly cited.
 Downloads
 Citation Tools