
 Submit a Paper
 Propose a Special lssue
 Open Access
ARTICLE

Fuzzy Logic Inference System for Managing Intensive Care Unit Resources Based on Knowledge Graph
Department of Computer Science, University College of Al Jamoum, Umm Al-Qura University, Makkah, 21421, Saudi Arabia
* Corresponding Author: Ahmad F Subahi. Email:
Computers, Materials & Continua 2023, 77(3), 3801-3816. https://doi.org/10.32604/cmc.2023.034522
Received 19 July 2022; Accepted 01 November 2022; Issue published 26 December 2023
 View Full Text
 Download PDF
Abstract
With the rapid growth in the availability of digital health-related data, there is a great demand for the utilization of intelligent information systems within the healthcare sector. These systems can manage and manipulate this massive amount of health-related data and encourage different decision-making tasks. They can also provide various sustainable health services such as medical error reduction, diagnosis acceleration, and clinical services quality improvement. The intensive care unit (ICU) is one of the most important hospital units. However, there are limited rooms and resources in most hospitals. During times of seasonal diseases and pandemics, ICUs face high admission demand. In line with this increasing number of admissions, determining health risk levels has become an essential and imperative task. It creates a heightened demand for the implementation of an expert decision support system, enabling doctors to accurately and swiftly determine the risk level of patients. Therefore, this study proposes a fuzzy logic inference system built on domain-specific knowledge graphs, as a proof-of-concept, for tackling this healthcare-related issue. The system employs a combination of two sets of fuzzy input parameters to classify health risk levels of new admissions to hospitals. The proposed system implemented utilizes MATLAB Fuzzy Logic Toolbox via several experiments showing the validity of the proposed system.Keywords
Over time, intensive care units (ICUs), as one of the most important hospital units, have a limited number of rooms and resources in most hospitals. During periods of seasonal diseases, disasters, or world pandemics, such as the ongoing coronavirus disease—that is, COVID-19—pandemic, ICUs face high admission demand. Because of this increasing number of new cases admitted to hospitals, the task of accelerating and recognizing health risk levels of new patients accurately has become more significant and must be considered. Currently, traditional methods continue to be used to diagnose and identify the level of critical cases who need to be admitted to ICU. Therefore, there is now a demand to utilize a type of artificial intelligence (AI)-based expert decision-support system to enable doctors to determine the risk level of patients in an accurate way, using state-of-art technologies, such as knowledge graphs (KGs) and fuzzy logic [1–3].
During the past few decades, graph structure has provided effective conceptualization and management of domain data by depicting real-world entities and concepts, connecting them using a number of semantically recognized relations. The increasing interest in graphs, by the computer science and software and system engineering community, is because of its robust underlying abstract structure. In recent years, domain-specific KGs have become a crucial technology trend that is built on graph theory for knowledge representation. These are driving the current generation of (big) data-driven systems and AI applications [4–6]. KGs can represent data semantics for a particular application’s domain in a machine-readable format using either a particular ontology or schema to solve common real-world problems of that domains [7–11].
Several domains, such as medical and economics [7,8], continue their ongoing interest in developing further intelligent information systems, on the basis of domain-specific KGs, to tackle some of their particular problems. In medical and health-related domains, this type of expert system can be utilized to manage and store various patient-related data, including information extracted from medical records. Doctors, clinicians, physicians, and managers are often required to summarize and retrieve important details from this massive amount of the recorded data (big data) to make better decisions and maintain the quality of healthcare services. In smart disease diagnosis and detection systems, for instance, there is a demand to store and manipulate big medical data.
Fuzzy logic, as one of the common techniques used in expert systems for decades, has also appeared in multiple recent research investigations into tackling various issues in different domains, including industry, economics, security, and medical and health-related domains [9–12]. In the medical domain, this type of solution mainly depends on the utilization of a number of input parameters that are strongly related to disease symptoms, clinical practices, and diagnoses or patient medical records. These parameters are processed via a designed fuzzy inference engine converting them into human-readable crisp values and results [11].
This study aims to recognize the health risk level of a patient on the basis of a combination of vital signs values and Sequential Organ Failure Assessment (SOFA) score [15,16] as health-related input variables to the Mamdani fuzzy logic inference engine. In addition, it aims to retrieve or extract information and knowledge about the clinical conditions of patients from a predesigned domain-specific KG and real-time health condition data that are captured using suitable medical devices and Internet of Things (IoT) technology in clinics and ICUs, or manually entered by physicians and nurses. We employ the widely used MATLAB Fuzzy Logic Toolbox [17] to implement a proof-of-concept for evaluating the proposed system.
Fuzzy logic has been implemented in previous studies for different health-related purposes, such as in [11–14]. A post-surgery medical risk assessment prediction system is developed to analyzed health indicators of acupuncture points and classify the severity after medical operations [11]. Another main health-related area is diagnosis of heart diseases [12]. In In the United States and many European countries, heart disease has one of the highest rates of incidence, with over 3.5 million people diagnosed every year. This high rate has led to the creation of significant budgets for prevention and treatment, which approximately constitutes around 3% of the global healthcare budget. In [12], for instance, a decision-based diagnosis model for heart diseases is presented. This multi-attribute model is built upon a generalization set of two fuzzy parameterized sets: fuzzy hypersoft set (Δ-set) and Riesz summability. A case study built on a Cleveland dataset that contains real attributes and some associated sub-attributes is utilized for heart ailments-based diagnoses. These values are transformed into fuzzy values on the basis of determined criteria and have produced reliable diagnoses results.
In [13], a modified algebraic operation and other basic notions of the possibility neutrosophic hypersoft set (pNHs-set) were conducted to propose a modified fuzzy-based algorithm for heart disease diagnosis. Two main concepts were integrated in this study: the pNHs-set and the modified Sanchez method. Values of the input parameters, including attributes and associated sub-attributives, were extracted from the Cleveland dataset to evaluate real scenarios of the proposed fuzzy-based model. These real values were also transformed on the basis of appropriate mathematical criteria, into fuzzy-based grades, producing reliable results.
Moreover, another interesting study that utilized electrocardiogram (ECG) signals via dual event-related moving average with FrlFT-based fusion technique is discussed in [11]. The presented technique was used to construct an intelligent model for identifying the heart condition and classifying it into five types on the basis of heartbeats: premature ventricular contraction, left bundle branch block, right bundle branch block (RBBB), PACE, and atrial premature contraction (APC) [14]. The proposed model was trained using support vector machine and K-nearest neighbor algorithms, and it was able to analyze the detected ECG signals to categorize the cardiac condition of patients. The experiment was conducted on two datasets: MIT-BIH arrhythmia and SPNH, producing around 99.99% accurate results.
From Section 1.1, it can be clearly observed that various investigations have considered parameters related to heart diseases. In the promising research of this study, various types of health-related parameters were considered fuzzy input parameters to the system. The main contributions of this study can be summarized as follows:
• Only three types of vital signs are utilized as fuzzy input parameters.
• Another six SOFA score attributes are considered fuzzy input parameters.
• Domain-specific KG schema are designed for storing and retrieving all critical parameters.
• Proof-of-concepts of a fuzzy logic inference system are outlined for risk level assessment.
The remainder of this paper is structured as follows. Section 2 discusses in depth a conceptual architectural design of the proposed system, a Mamdani fuzzy logic-based KG inference system and its major components, including the structure of the developed KG and the fuzzy inference engine. Section 3 presents details of the experiments conducted, an analysis of the results, and an evaluation of the proposed proof-of-concept of the introduced system. Last, Section 4 provides the conclusion of this study.
On the basis of the discussion presented in the Section 1, this study recommends, as a main contribution, a conceptual architectural design of a Mamdani fuzzy logic-based KG inference system. It is considered a promising framework solution for one of the common challenges in healthcare services and management, which is monitoring and forecasting bed occupancy and resource utilization inside ICUs, using, mainly, a combination of two groups of parameters: SOFA score parameters and patients’ vital signs parameters [15,16].
The main functions of the recommended system are collecting various vital signs of patients using appropriate and remote IoT sensors or devices, analyzing and evaluating the collected health-related data using fuzzy logic-based system to decide whether the patient status requires urgent care in ICU or not, then storing these health data in a KG. The block diagram of the system and its associated layers are illustrated in Fig. 1. This section provides an overview of the most important components of the overall architecture, which are the KG structure and fuzzy logic-based engine. In subsection “Fuzzy Logic-based Graph Data Store Design,” we explain the fuzzification of data and discuss the development of the rule-based engine.
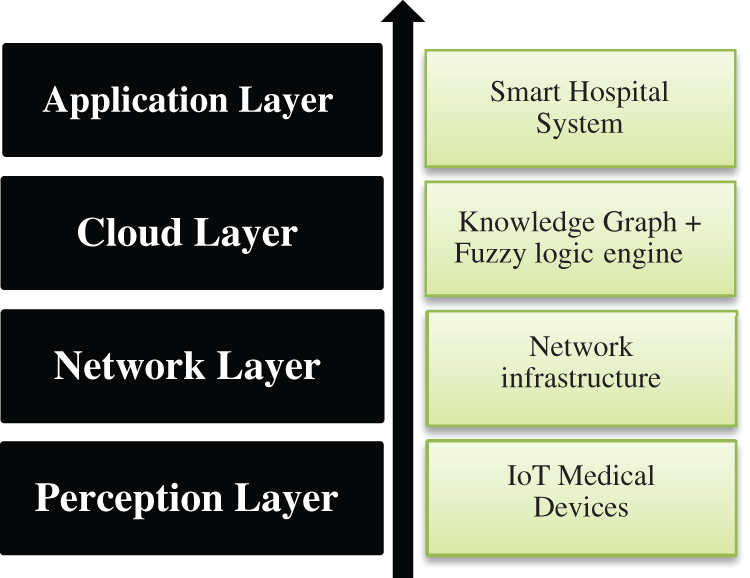
Figure 1: IoT architecture layers and components of the proposed framework
Moreover, in subsection “Knowledge Graph Development Approach,” we discuss the development strategy of a recommended KG model that integrates heterogeneous patients’ vital signs information, collected from different healthcare-related resources, to improve the utilization and management of available ICU resources in hospitals, as a common critical healthcare service. Fig. 2 demonstrates the overall architecture of the recommended approach with detail of its main internal components and the suggested data transformational pipeline.
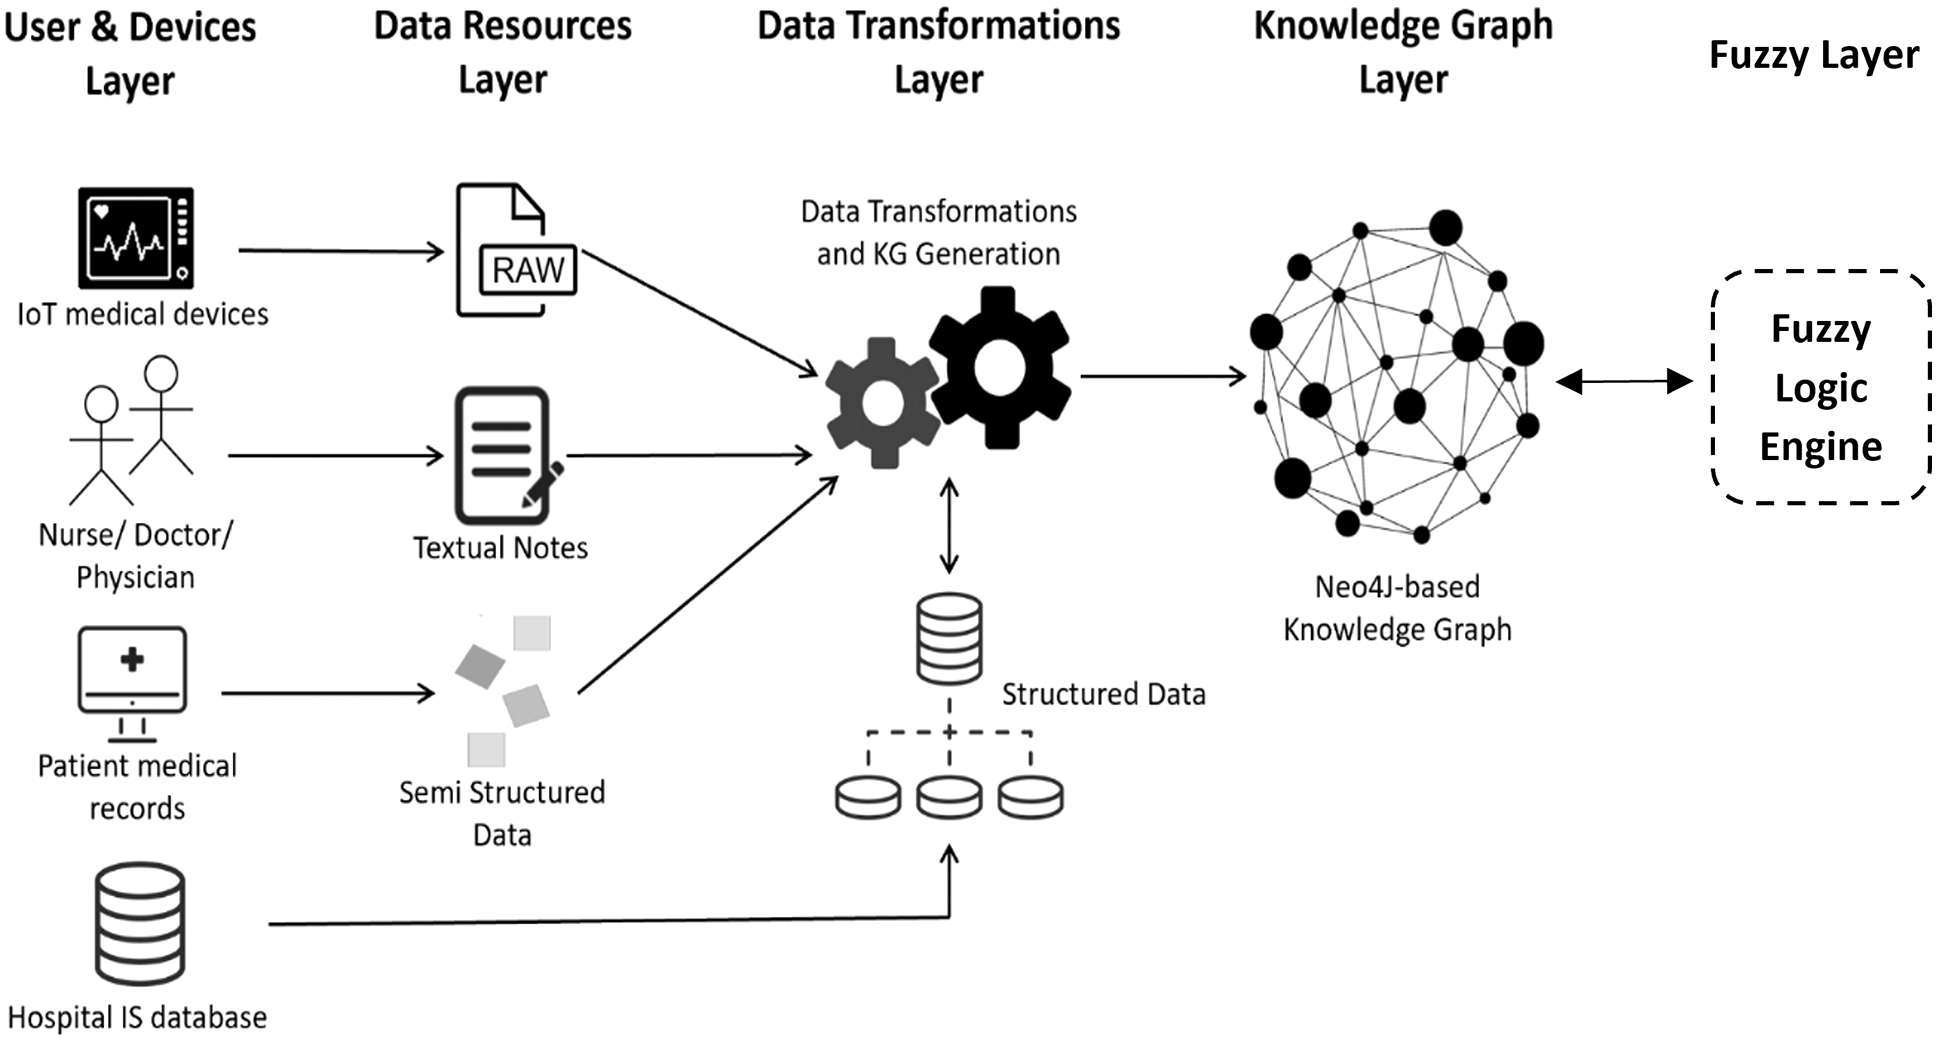
Figure 2: The detailed framework and the suggested data transformational pipeline
2.1 Fuzzy Logic-Based Graph Data Store Design
Analysis of the overall core processes in the healthcare domain revealed that there are a variety of core processes that can be grouped into independent healthcare-related information subsystems, such as laboratory, radiology, pharmacy, and hospital management systems. Some of these information systems are automated, and the rest are paper-based. In the proposed data storage design, a graph-based database is recommended as a design choice of the backend datastore for each related system that has been considered. The suggested graphs are patient electronic medical records (PEMRs), ICU vital signs data, ICU nurse notes, and hospital information subgraphs. All these elements are considered input parameters for the promising fuzzy logic inference system, which it will be presented, in detail, in the following subsections.
These subgraphs are considered parts of the overall domain-specific KG infrastructure developed in this study. Each graph serves the proposed fuzzy logic engine as a source of data collected/captured and stored for patients in the previously mentioned healthcare-related information subsystems. Sections 2.1.1–2.1.4 briefly highlight the types of data utilized in each subgraph and represent the selected parameters used as inputs for the fuzzy logic engine.
2.1.1 Patient Electronic Medical Record
The PEMR subgraph represents various information aspects that appear in the medical record, such as patient characteristics, medical history, laboratory results, and presenting illness history notes. Data can be inserted into this graph, updated, and enriched periodically by hospital front desks, doctors, or nurses, with every patient visit via different hospital units, such as outpatient clinics, radiology units, laboratories, inpatient admission units, and even pharmacies.
Notably, the PEMR consists of the three common formats of data: structured, semi-structured, and unstructured. The personal information, checklists, and choice fields are considered structured data formats, whereas the historical sections, illness history notes, and other written parts are considered semi-structured or unstructured data formats. From this, it can be stated that all types of data formats are recorded to be retrieved and analyzed later using the most suitable technique on the basis of the format.
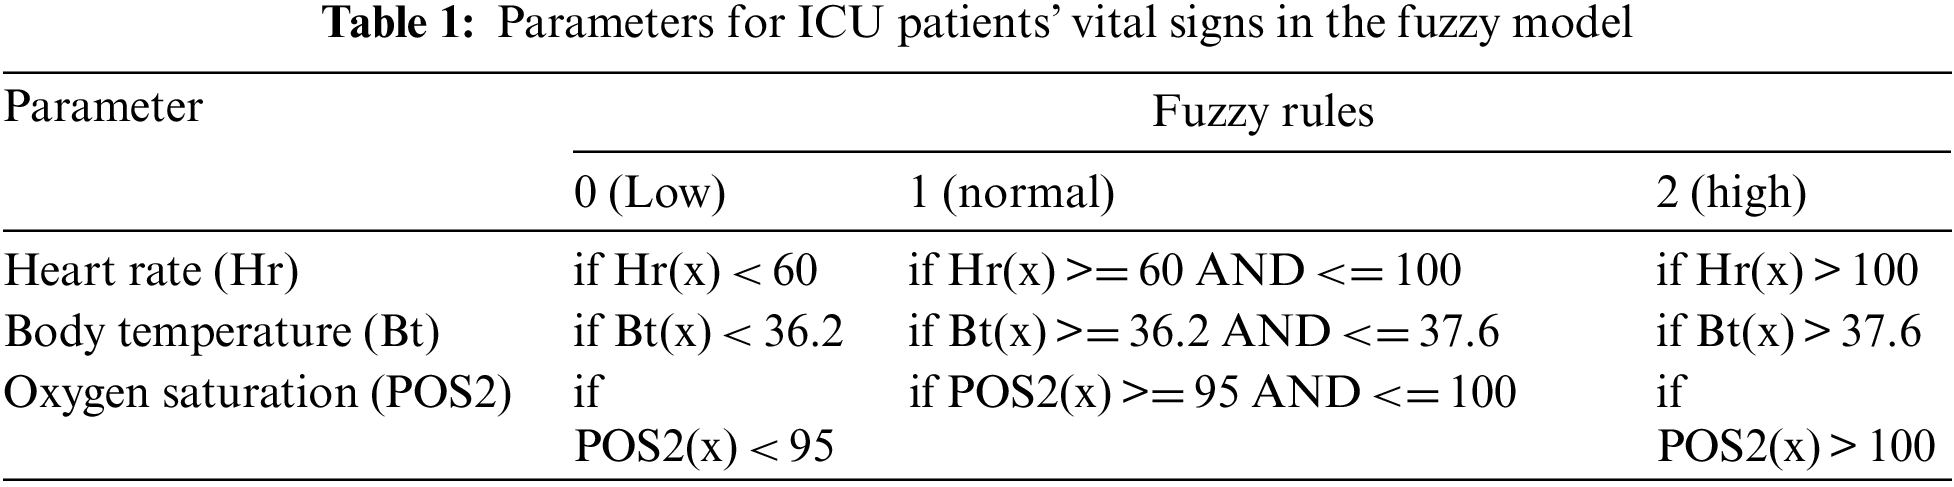
Furthermore, elements in the ICU vital signs subgraph represent different living factors of a patient, including five key parameters: (1) blood pressure, (2) body temperature, (3) oxygen gas level and blood gas analysis, (4) heart activity and pulse parameters, (5) respiratory rate (asthma), and glucose level. Detecting these signs accurately and measuring them correctly is extremely critical for assessing patients’ health in the ICU and even in clinics. For this reason and more, suitable tools must be utilized for collecting all adequate vital signs information. These living factors are captured as raw and unformatted data, via various IoT-based intelligent monitoring systems, connected to different common sensor-based ICU medical devices, or sensors, available in ICU rooms. Table 1 illustrates the selected crucial parameters for ICU patients’ vital signs to be considered in the fuzzy model and their normal values that are built upon patient ages and the allocated score for each category.
It is worth mentioning that there are a variety of IoT applications designed to support medical and healthcare professionals in the domain. These applications are based on Fuzzy logic, such as [18,19].
A detailed discussion of the suggested IoT system architecture and design is out of the scope of this study. However, to summarize, the recommended architecture of this IoT-based subsystem for capturing vital signs of patients falls under the proposed architecture in Fig. 2, which consists of four major layers: perception, networking/middleware, service/business logic, and application layers. In the perception layer, various smart medical devices/sensors are used for collecting living factors and data and monitoring their health status. Indeed, microcontroller sensors can also be used for the same purposes, such as an LM35 sensor for measuring body temperature, a glucometer sensor for measuring the glucose level in the blood, an electrocardiogram (ECG) for monitoring heart activity and detecting cardiac abnormalities, and a photoplethysmogram device [20].
2.1.3 ICU Nurse and Physician Notes
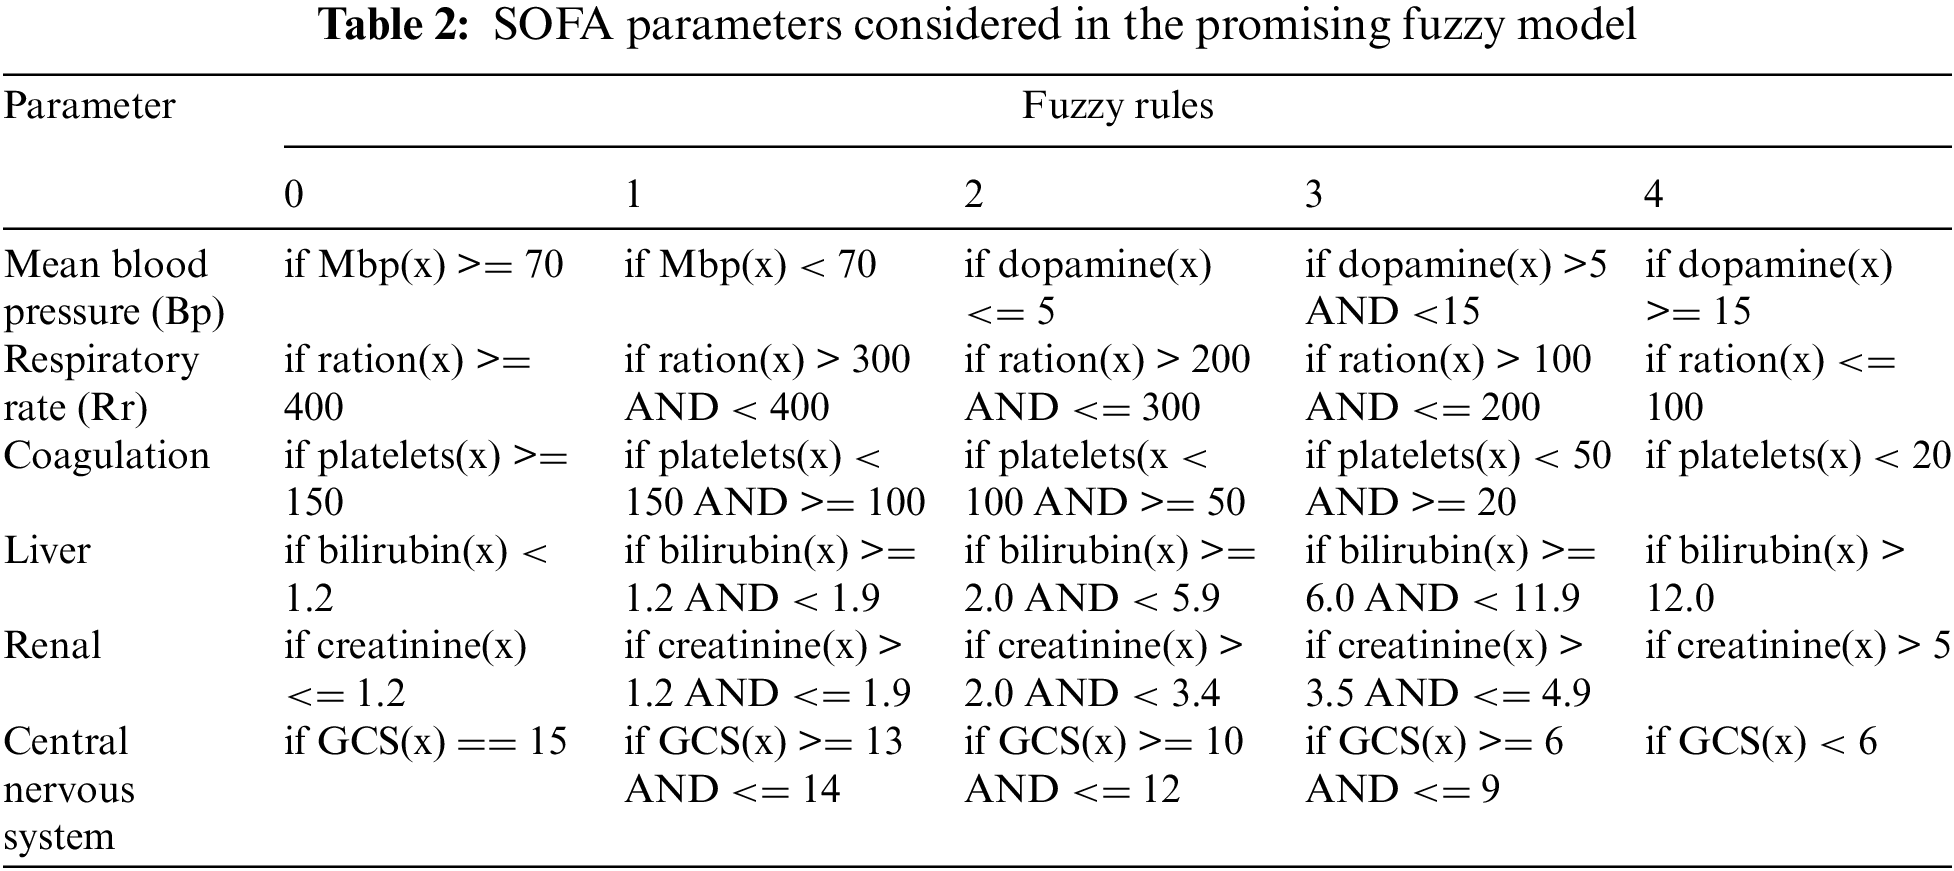
Nurses and physicians can adopt different methods to collect and track a patient’s status during their stay in an ICU room. One such method is monitoring the organ functions and their rate of failure using an appropriate scoring system. The SOFA is a scoring system that can be used to determine the rate of organ failure in ICU patients. It measures six organs or systems: the respiratory, cardiovascular, liver, coagulation, kidneys (renal), and nervous system. Each system involved in the overall, customized SOFA score (from 0 to 4) has its own attributes and scales, measured by ICU nurses. The recommended subgraph of the proposed KG includes a number of nodes to store these values for predicting the clinical outcomes of patients in critical condition in the ICU. Table 2 shows the SOFA parameters that are considered in the promising fuzzy model, their associated fuzzy rules, and the allocated score for each given category.
2.1.4 Hospital Management Information System
Hospital information systems are utilized to simplify daily core financial, operational, clinical, and workflow processes within hospitals. This type of information system requires a robust backend database that stores all related data. In the introduced subgraph, the types of data include hospital profile information (e.g., name, type, and location), number of rooms, number of ICU rooms, number of beds, available medical devices, doctor and staff details, and patient admission flow.
2.2 Knowledge Graph Development Approach
As aforementioned, there are several approaches to construct KGs. One of the main approaches involves developing a data pipeline for extracting data (graph nodes) and their interrelations (graph edges between nodes), on the basis of various techniques, such as machine learning, natural language processing, graph embedding, and other smart data-driven techniques. Nodes and edges of KGs are inferred or automatically generated by the utilized algorithms. The proposed approach is built upon a predefined meta-graph schema that is constructed considering different types of data models utilized in the related healthcare systems. The proposed meta-graph is used as a hierarchical structure of medical and health-related information in which every meta-node appears in the graph associated with a set of other nodes.
2.2.1 Meta-Graph Schema Design
Constructing a comprehensive graph-based schema is considered a compulsory first step toward building a KG to define all core concepts and describe how they relate one to another. This one-time step can be considered equivalent to the process of building a targeted domain ontology. Notably, both machine learning and graph-embedding techniques can also be utilized for building ontologies, but these techniques are beyond the scope of this study.
To organize the collected data from different health-related resources into concepts that form subgraphs, data were classified into six categories at the meta-graph level: (1) patient characteristics to represent the basic personal information section of the medical record of a patient, including name, date of birth, gender, marital status, demography, and alcohol and smoking status; (2) patient history for expressing various aspects of historical information recorded in the medical record, including surgical history, medical history, medications history, family history, pregnancy history, and PHI; (3) ICU components to represent information about different types of resources available in ICU rooms, including monitoring medical devices and beds; (4) actual readings for recording vital signs and other critical health parameters of an ICU inpatient, captured by ICU monitoring devices during daily time intervals, including body temperature, oxygen level in the blood and blood gas analysis; (5) SOFA score, which is used for predicting in-hospital mortality based on the worst parameters for six organ systems every 24 h from patient admission to the ICU until discharge; (6) hospital facilities and infrastructures for storing basic hospital information, such as name and location, as well as information of available ICU beds and equipment, including identities, names, and allocated rooms.
The Neo4j graph database is used here to construct the KG core schema and all related subgraphs in this study. A graph database can be defined as a graph-based data representation that consists of a number of vertices (nodes) and edges (relationships). Each node represents an entity, and each relationship represents the association between nodes. The graph model proposed in this study consists of three clusters of subgraphs framed around the process or the types of collected data [21]. Fig. 3 depicts a demonstration of the meta-graph data model designed for the proposed KG of the recommended system. It consists of six meta nodes, defined at the conceptual schema level, connected by some directed relationships that are implemented using the Neo4j graph-based database.
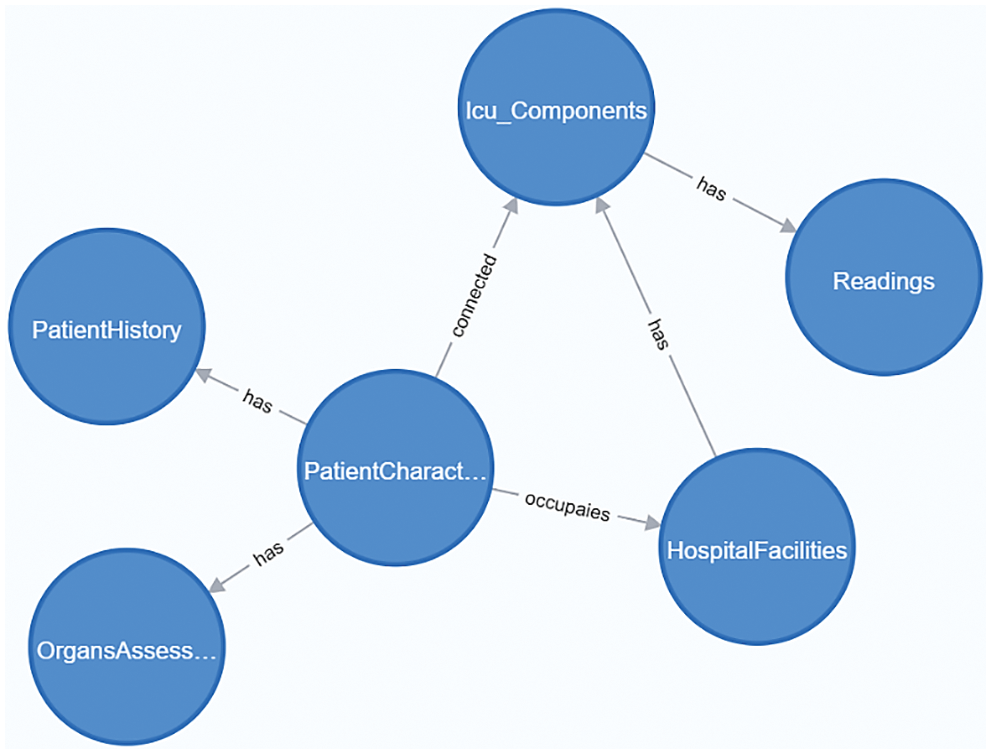
Figure 3: The meta-graph schema structure of the knowledge graph
The detailed KG structure is illustrated in Fig. 4. It shows, for each core meta-node, all connected nodes that represent properties for crucial actual values.
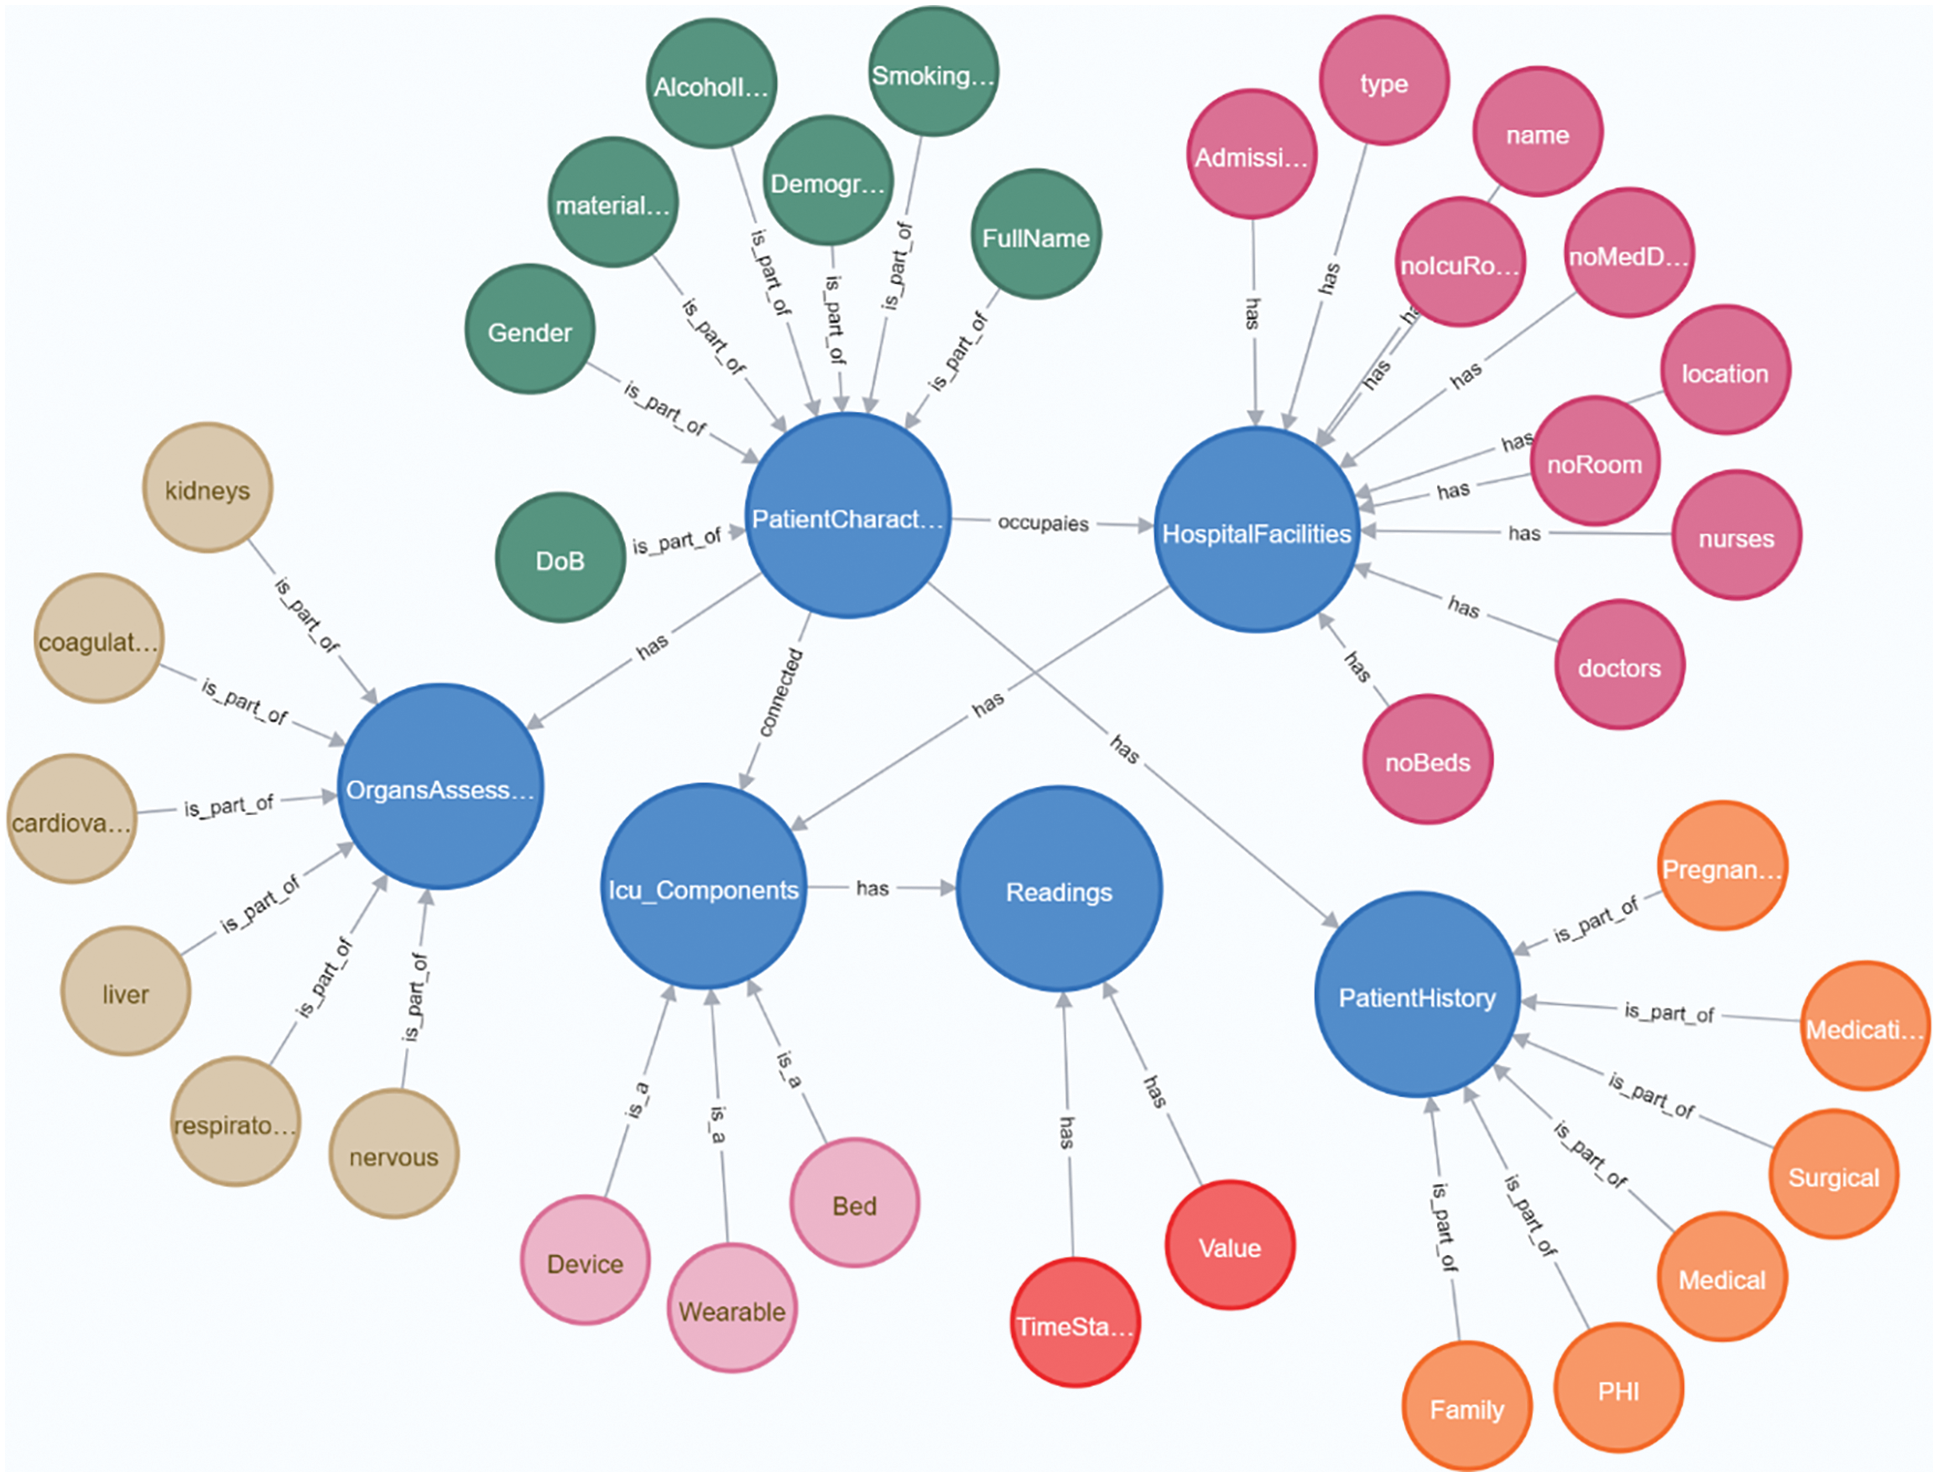
Figure 4: The detailed structure of the KG. Different colors are used to illustrate the group of nodes connected to every core meta-node in the KG schema
2.2.2 Data Processing Pipeline
The development strategy for constructing the proposed KG follows a three-step linear process (pipeline). These steps are data acquisition, data transformations, and KG generation and enrichment. The overall data processing pipeline encompasses some internal data transformations processes for each subgraph. The Unified Modelling Language (UML) activity diagram (Fig. 5) demonstrates the KG creation process pipeline.
• Data acquisition: This step includes defining the strategy for data extraction (collecting), from different sources in different formats, for each core concept defined in the meta-graph schema. It is an initial step of the proposed data transformational pipeline. The sources of data include patient EMRs, ICU medical devices, IoT sensor readings, nurse notes, and information about hospital and ICU facilities.
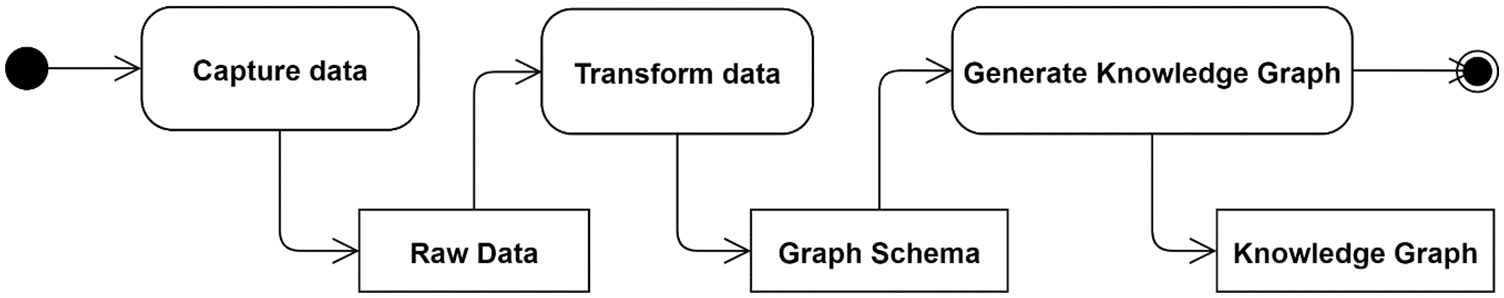
Figure 5: The detailed data transformational steps of the recommended data processing pipeline
• Data transformations: As a part of the developed knowledge representation framework proposed in this study, an extract–transform–load (ETL) data pipeline for converting structured, semi-structured and unstructured healthcare-related data into the proposed domain-specific KG is considered part of the overall proposed data transformational approach.
• The data preprocessing strategy consists of a collaboration between two types of data transformers: data translators and data transformers. Data transformers are responsible for transforming source data, collected in a raw format (unstructured and semi-structured), into a structured format. For instance, the natural language processing transformer is used for transforming raw data extracted from medical records, such as symptoms and doctor notes, after applying a set of internal text processes, including tokenized lexical and semantic analysis. Moreover, data translators are responsible for translating the structured data format into a graph data schema expressed using the Neo4j cypher query language. For example, the IoT data translator is utilized to translate every row stored in the relational-based IoT data into graph triples written in Neo4j cyphers.
• KG generation and enrichment: The third phase is KG generation and enrichment, which includes (1) generating the final KG after executing the translated Neo4j cypher script and (2) constructing relationships (edges) between core elements (or triples) to form a new instance of knowledge. These generated cyphers are executed periodically to supply the KG with new knowledge in terms of new nodes and relationships.
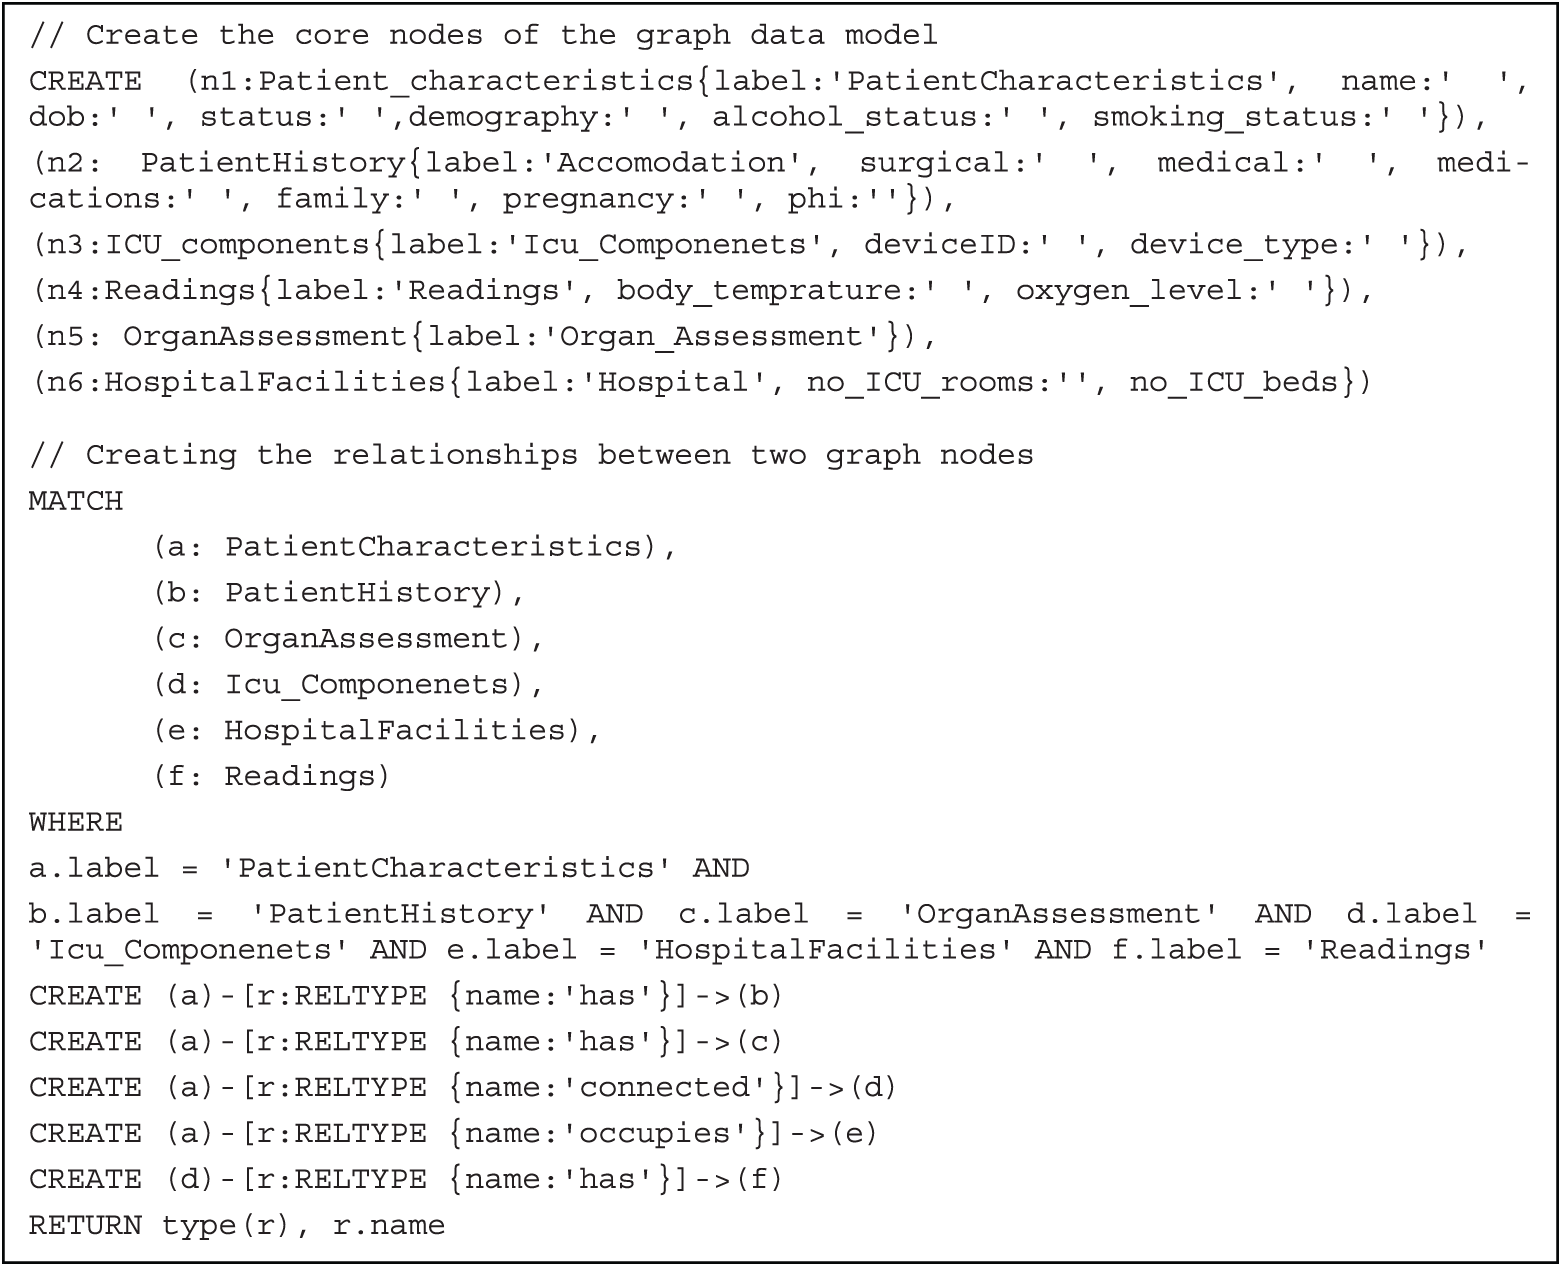
The following snapshots of Neo4j cypher script are utilized for generating the KG. It includes the statements used for generating graph nodes and main edges.
The layout of the overall proposed fuzzy system is illustrated in Fig. 6. The processed information moves from left to right, starting with the fuzzification step toward the defuzzification step. The system processes data, which are related to nine inputs (parameters), resulting in a single output that represents the patients’ health status. The fuzzy system was designed to determine the risk level of a patient to decide whether there is a demand to transfer them to ICU or not. MATLAB Fuzzy Logic Toolbox was used to implement the system as a proof-of-concept. The introduced fuzzy system with nine inputs and the one output is presented in Fig. 7.
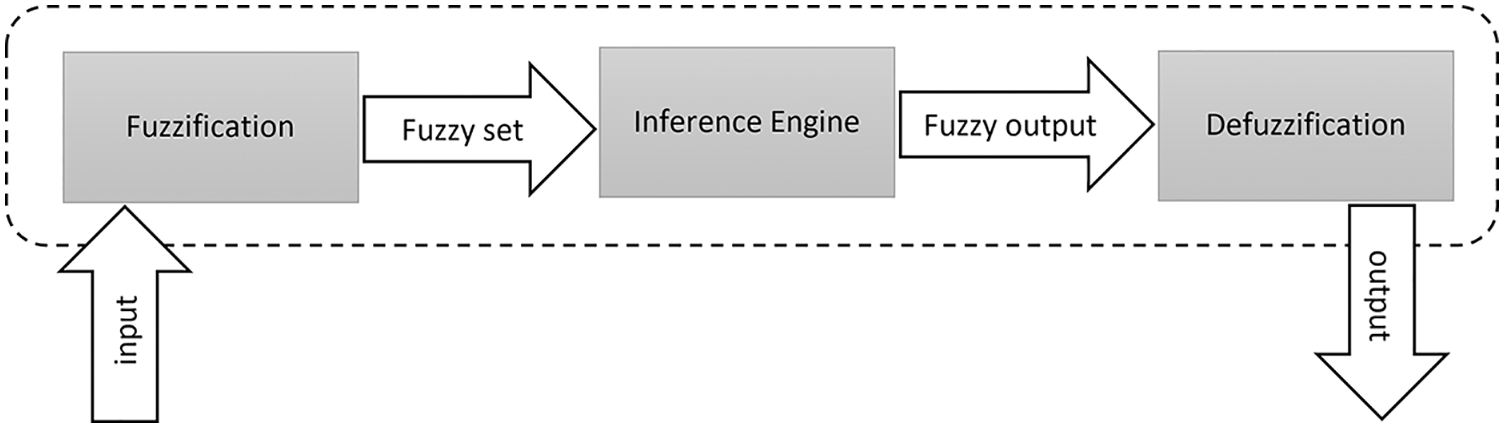
Figure 6: Flow of creation and utilization of the proposed fuzzy logic system
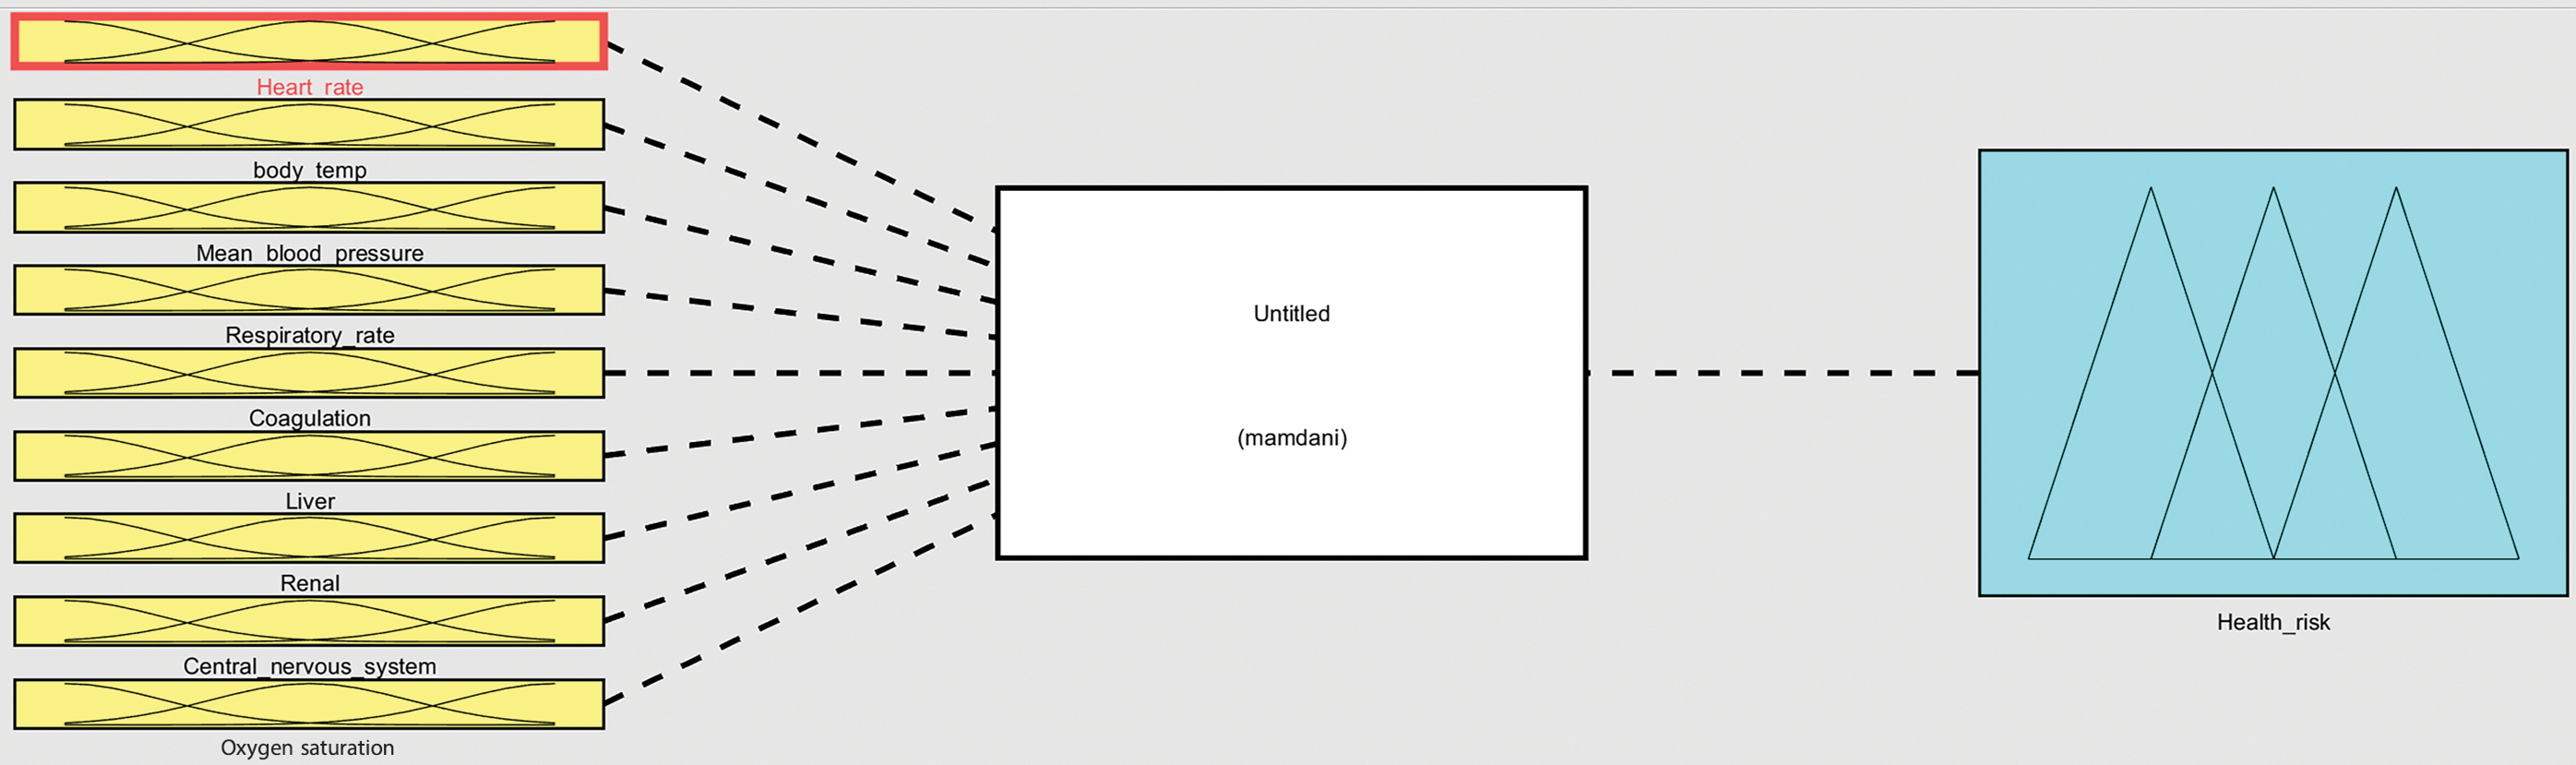
Figure 7: Fuzzy logic system that is built upon center-of-gravity method and Mamdani-based inference approach with nine input variables and one output
The fuzzification step is responsible for converting a real input variable into a degree of belonging, of a calculated score, toward a corresponding linguistic variable. To achieve this, membership functions are used, and a search process is conducted. The total score is calculated for a patient using the nine parameters extracted from two groups of health-related parameters available in the KG, as is shown in Tables 1 and 2, namely, heart rate (Hr), body temperature (Bt), oxygen saturation (POS2), mean blood pressure (Bp), respiratory rate (Rr), coagulation, liver, renal and central nervous system. Each parameter value for each patient is cross-referenced against the fuzzy model, represented in Tables 1 and 2, and a total score from 0 to 30 is allocated. The scores for each parameter are then added to provide the total score.
A total score that falls in the range between 0 and 10 shows that the patient health level is normal; such patients do not need to be taken to the ICU. A total score between 10 and less than 15 shows that the patient is in a mild risk status, which might require them to be taken to the ICU with low priority. Conversely, a score of 15 or more shows that the patient is in a high-risk status, and an admission to an ICU is highly recommended. In addition, to enable the proposed intelligent decision-making system to determine the risk level of a patient and to what degree they need to be admitted to a room in the ICU, the categories were defined using a number of sub-scores. Each sub-score was mapped into a linguistic term that represents the risk degree of a patient health. Furthermore, each group of parameters (category) was identified using a fuzzy set, a range, and a membership function. For instance, three linguistic terms were determined for the first group of parameters to define the associated categories: normal, medium risk, and high risk. Similarly, four terms were identified to define the second category: normal, low risk, high risk, and extremely high risk.
The inference step aims to define the mapping between the inputs, provided to the system, to an output using a set of fuzzy logic rules that are of the if-else type with the AND operator. This mapping enables the system to make the most accurate decision. Overall, the inference process consists of three main components: fuzzy rules, membership functions, and a proper reasoning mechanism for producing output. As mentioned previously, the fuzzy inference system adopted in this study is Mamdani and the following steps are applied to accomplish this inference step:
1. Define the set of fuzzy rules.
2. Fuzzify the inputs using membership functions.
3. Apply fuzzy operation (in our system “AND” operator).
4. Apply the fuzzy rule to combine the fuzzified inputs.
5. Defuzzify the output.
In this regard, the number of risk levels for all categories is used for calculating the total number of rules to be implemented in the system. As clearly discussed in Section 2.1.4 and presented in Tables 1 and 2, the number of levels can be summarized as follows: Hr = 3, Bt = 3, POS2 = 3, Bp = 5, Rr = 5, liver = 5, coagulation = 5, renal = 5, and the central nervous system = 5. Eq. (1) is utilized to compute the total number of rules in the fuzzy system:
where M is the maximum number of rules, n is the number of categories, and a is the number of risk levels for each category. Therefore, the maximum number of the possible fuzzy rules in the proposed system is
The defuzzification step is responsible for converting the fuzzy quantity of the output to a crisp value. In the proposed system, the center-of-gravity method is adopted for the defuzzification process, which can be mathematically defined using Eq. (2):
In the proposed system, the calculated result of the fuzzy inference process determines the health risk level to which the patient belongs. This result is considered one fuzzy set for each output variable. As the output of the proposed fuzzy system is a degree of health risk level in the patient status. We have identified four fuzzy sets for representing the out degree of the demand to take the patient to the ICU: normal, low risk, high risk, and extremely high risk.
Listing 1: Neo4j cypher script for generating the knowledge graph
To evaluate the developed fuzzy logic system, a proof-of-concept that consists of 27 fuzzy rules and three input variables (parameters)—heart rate, body temperature, and oxygen saturation—was implemented using MATLAB Fuzzy Logic Toolbox and has been demonstrated in this section. Fig. 8 illustrates the introduced fuzzy system, designed around Mamdani fuzzy rule inference and the center-of-gravity method, with three inputs and one output.
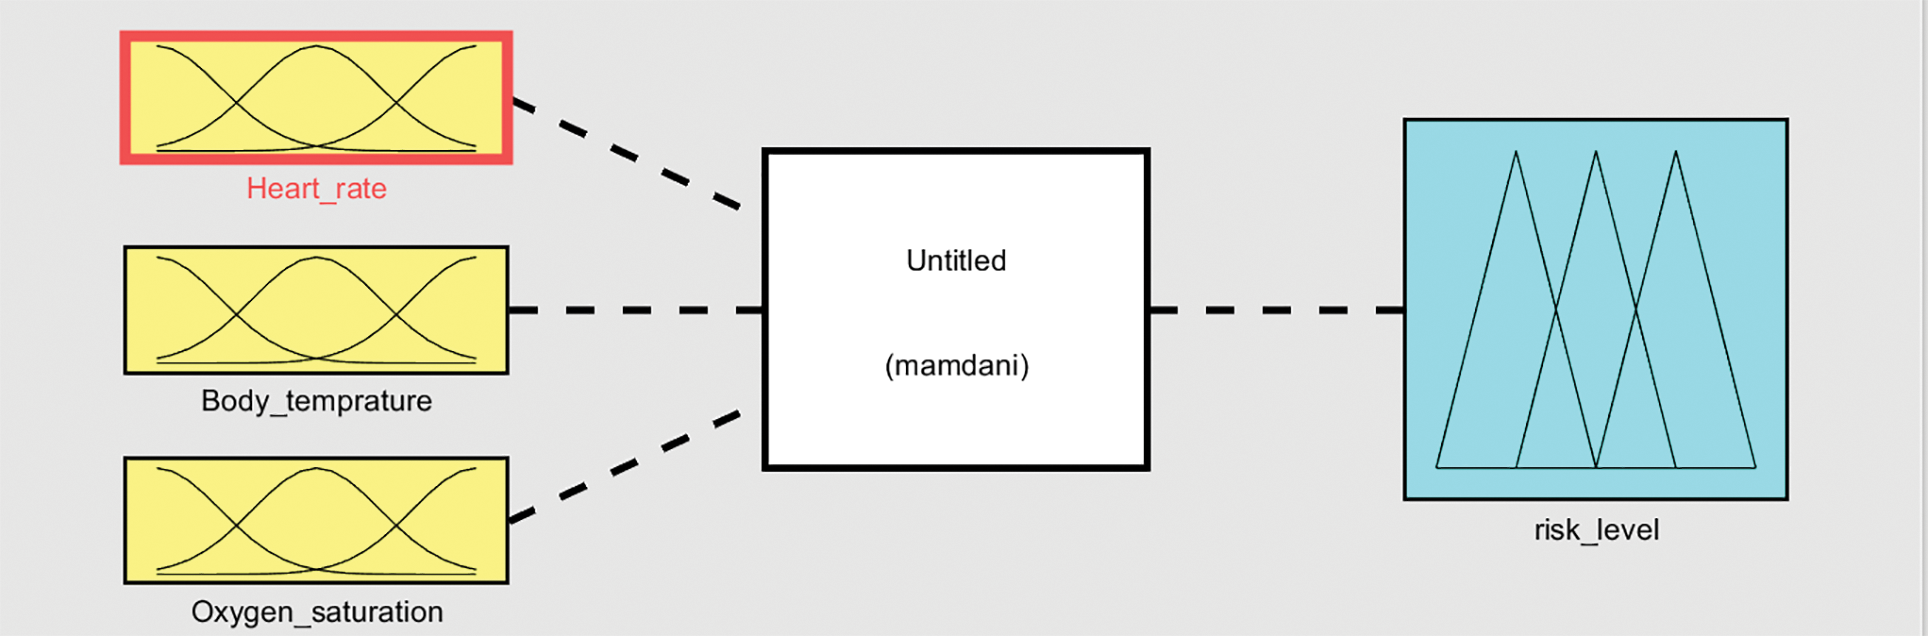
Figure 8: A proof-of-concept of the fuzzy logic system that is framed around the center-of-gravity method and Mamdani-based inference approach with three input variables and one output
As mentioned previously, on the basis of the three selected input variables, 27 rules are generated, which must be combined in some manner to arrive at a decision about the risk level of a given patient case. Three different sets of values for each input variables are generated to demonstrate the variation of the decisions made by the developed system. These are classified into three categories: low, normal, and high, joined with AND operator for each given input variable and three categories for the output: level_0, level_1, and level_2.
According to the first experiment demonstrated in Table 3, the three variables associated with heart rate, body temperature, and oxygen saturation were set at values located in the predefined “normal” category as
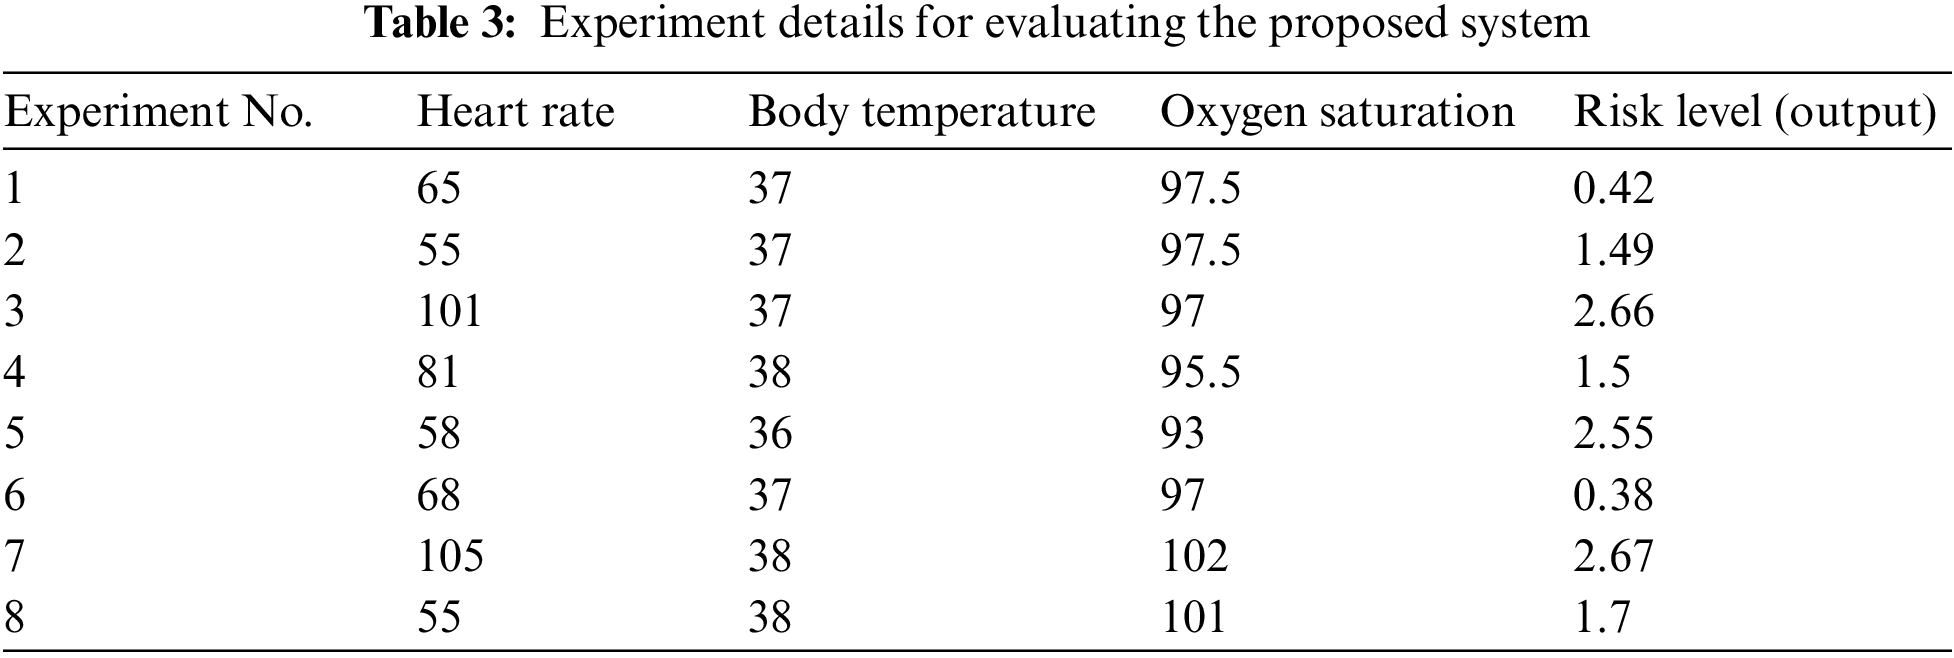
Moreover, in the second experiment, only two variables associated with body temperature and oxygen saturation were set at values located in the predefined “normal” category as
In addition, the third experiment was performed using two variables, which are associated with heart rate and body temperature and were set at values located in the predefined “high” category as follows:
From the presented experiments in Table 3, it can be clearly observed the differences between the resulting health risk level categories from the designed fuzzy logic system according to the variation of the given values of the input variables. These results were utilized as a proof-of-concept to evaluate the proposed system and indicate that fuzzy models might be expanded with the rest of the nine selected input variables to become more accurate for measuring the health risk level of patients.
Aside from that, it is worth emphasizing that implementation or experimental evaluation of the KG performance is not within the scope of this study. Experiments were limited to the utilization of only three major input parameters of the fuzzy logic inference algorithm. They demonstrated good results to validate the idea via the developed proof-of-concept. However, we can recommend a further evaluation strategy that can be conducted to evaluate this part of the framework. Because many types of applications can be developed alongside the constructed KG in an independent form, such as questioning and answering systems, chatbots, or even simple applications with queries, all function as decision-support systems in ICUs. Graph query processing and resulting visualization techniques can be utilized at this stage to measure the quality and accuracy of the query results. Several procedures or graph-based queries can be designed using the Neo4j cypher script command and run as test cases to retrieve certain results and use them in predictions and decision support.
In summary, a recommended fuzzy logic-based framework for recognizing patient health risk level, on the basis of a combination of vital signs and SOFA score parameters of patients, was introduced. A Mamdani fuzzy logic inference engine was utilized and implemented using MATLAB Fuzzy Logic Toolbox as a proof-of-concept. The fuzzy logic system should be able to retrieve, or extract, information and knowledge about clinical condition of patients from a predesigned domain-specific KG and real-time health condition data that are captured using suitable medical devices and IoT technology in clinics and ICUs, or manually entered by physicians and nurses.
Regarding the KG construction process, two levels of graph-based nodes were discussed with a supporting design of a data processing pipeline and strategy. A three-phase linear process that includes data acquisition, data transformations, and KG generation and enrichment, was also discussed, along with the possible evaluation strategy of the overall recombined framework. On the basis of this information and ICUs resources data, the decision-makers at hospitals can manage and organize the ICU admission process when managing a large number of patients with different health risk levels.
Acknowledgement: None.
Funding Statement: This work is funded by the Deanship of Scientific Research at Umm Al-Qura University, Makkah, Kingdom of Saudi Arabia. Under Grant Code: 22UQU4281755DSR05.
Author Contributions: The authors confirm contribution to the paper as follows: study conception and design: Ahmad F Subahi; related works: Areej Athama; analysis and interpretation of results: Ahmad F Subahi; draft manuscript preparation: Ahmad F Subahi, Areej Athama. All authors reviewed the results and approved the final version of the manuscript.
Availability of Data and Materials: The authors confirm that there is no dataset used in this study.
Conflicts of Interest: The authors declare that they have no conflicts of interest to report regarding the present study.
References
1. M. A. Deif, A. A. Solyman, M. H. Alsharif and P. Uthansakul, “Automated triage system for intensive care admissions during the COVID-19 pandemic using hybrid XGBoost-AHP approach,” Sensors, vol. 21, no. 19, pp. 1–17, 2021. [Google Scholar]
2. Y. Alotaibi and A. F. Subahi, “New goal-oriented requirements extraction framework for e-health services: A case study of diagnostic testing during the COVID-19 outbreak,” Business Process Management, vol. 28, no. 1, pp. 273–292, 2021. [Google Scholar]
3. K. Sitammagari, S. Murphy, M. Kowalkowski, S. Chou, M. Sullivan et al., “Insights from rapid deployment of a “virtual hospital” as standard care during the COVID-19 pandemic,” Annals of Internal Medicine, vol. 174, no. 2, pp. 192–199, 2020. [Google Scholar] [PubMed]
4. D. Varshney, A. Zafar, N. K. Behera and A. Ekbal, “Knowledge graph assisted end-to-end medical dialog generation,” Artificial Intelligence in Medicine, vol. 139, pp. 102535, 2023. [Google Scholar] [PubMed]
5. A. Tauqeer, I. Hammid, S. Aghaei, P. Parvin, E. M. Postma et al., “Smell and taste disorders knowledge graph: Answering questions using health data,” Expert Systems with Applications, vol. 234, pp. 121049, 2023. [Google Scholar]
6. J. Shen, T. Pan, M. Xu, D. Gan and B. An, “A novel DL-based algorithm integrating medical knowledge graph and doctor modeling for Q&A pair matching in OHP,” Information Processing & Management, vol. 60, no. 3, pp. 103322, 2023. [Google Scholar]
7. M. Casal-Guisande, A. Comesaña-Campos, I. Dutra, J. Cerqueiro-Pequeño and J. B. Bouza-Rodriguez, “Design and development of an intelligent clinical decision support system applied to the evaluation of breast cancer risk,” Journal of Personalized Medicine, vol. 12, no. 2, pp. 169, 2022. [Google Scholar] [PubMed]
8. P. Manickam, S. A. Mariappan, S. M. Murugesan, S. Hansda, A. Kaushik et al., “Artificial Intelligence (AI) and Internet of Medical Things (IoMT) assisted biomedical systems for intelligent healthcare,” Biosensors, vol. 12, no. 8, pp. 562, 2022. [Google Scholar] [PubMed]
9. A. H. Khan, M. A. Khan, S. Abbas, S. Y. Siddiqui, M. A. Saeed et al., “Simulation, modeling, and optimization of intelligent kidney disease predication empowered with computational intelligence approaches,” Computers, Materials & Continua, vol. 67, no. 2, pp. 1399–1412, 2021. [Google Scholar]
10. H. Taleb, A. Nasser, G. Andrieux, N. Charara, E. M. Cruz et al., “Energy consumption improvement of a healthcare monitoring system: Application to LoRaWAN,” IEEE Sensors Journal, vol. 22, no. 7, pp. 7288–7299, 2022. [Google Scholar]
11. S. Filist, R. T. Al-Kasasbeh, O. Shatalova, N. Korenevskiy, A. Shaqadan et al., “Biotechnical system based on fuzzy logic prediction for surgical risk classification using analysis of current-voltage characteristics of acupuncture points,” Journal of Integrative Medicine, vol. 20, no. 3, pp. 252–264, 2022. [Google Scholar] [PubMed]
12. A. U. Rahman, M. Saeed, M. A. Mohammed, M. M. Jaber and B. Garcia-Zapirain, “A novel fuzzy parameterized fuzzy hypersoft set and riesz summability approach based decision support system for diagnosis of heart diseases,” Diagnostics, vol. 12, no. 7, 2022. [Google Scholar]
13. A. U. Rahman, M. Saeed, M. A. Mohammed, S. Krishnamoorthy, S. Kadry et al., “An integrated algorithmic MADM approach for heart diseases’ diagnosis based on neutrosophic hypersoft set with possibility degree-based setting,” Life, vol. 12, no. 5, pp. 729–747, 2022. [Google Scholar] [PubMed]
14. T. Y. Wah, M. A. Mohammed, U. Iqbal, S. Kadry, A. Majumdar et al., “Novel DERMA fusion technique for ECG heartbeat classification,” Life, vol. 12, no. 6, pp. 842–855, 2022. [Google Scholar] [PubMed]
15. Y. Liu, K. Gao, H. Deng, T. Ling, J. Lin et al., “A time-incorporated SOFA score-based machine learning model for predicting mortality in critically ill patients: A multicenter, real-world study,” International Journal of Medical Informatics, vol. 163, no. 1, pp. 104776–104792, 2022. [Google Scholar] [PubMed]
16. M. Fayed, N. Patel, S. Angappan, K. Nowak, F. V. Torres et al., “Sequential Organ Failure Assessment (SOFA) score and mortality prediction in patients with severe respiratory distress secondary to COVID-19,” Cureus, vol. 14, no. 7, 2022. [Google Scholar]
17. M. Kaczorek and M. Jacyna, “Fuzzy logic as a decision-making support tool in planning transport development,” Archives of Transport, vol. 1, no. 61, pp. 51–70, 2022. [Google Scholar]
18. S. N. Sajedi, M. Maadani and M. N. Moghadam, “F-LEACH: A fuzzy-based data aggregation scheme for healthcare IoT systems,” The Journal of Supercomputing, vol. 78, no. 1, pp. 1030–1047, 2021. [Google Scholar]
19. M. M. Kamruzzaman, S. Alanazi, M. Alruwaili, M. Alruwaili, I. Alrashdi et al., “Fuzzy-assisted machine learning framework for the FOG-computing system in remote healthcare monitoring,” Measurement, vol. 195, pp. 111085, 2022. [Google Scholar]
20. A. F. Subahi, “Edge-based IoT medical record system: Requirements, recommendations and conceptual design,” IEEE Access, vol. 7, pp. 94150–94159, 2019. [Google Scholar]
21. N. Ayinuer, A. Ruxianguli and A. Yasen, “Design and research of unstructured data knowledge graph toolbased on neo4j graph database,” in 2022 11th Int. Conf. on Communications, Circuits and Systems (ICCCAS), pp. 296–300, 2022. [Google Scholar]
Cite This Article
 Copyright © 2023 The Author(s). Published by Tech Science Press.
This work is licensed under a Creative Commons Attribution 4.0 International License , which permits unrestricted use, distribution, and reproduction in any medium, provided the original work is properly cited.
 Downloads
 Citation Tools