
 Submit a Paper
 Propose a Special lssue
 Open Access
ARTICLE

Sanxingdui Cultural Relics Recognition Algorithm Based on Hyperspectral Multi-Network Fusion
1 Key Laboratory of Spectral Imaging Technology CAS, Xi’an Institute of Optics and Precision Mechanics, Chinese Academy of Sciences, Xi’an, China
2 Institute of Culture and Heritage, Northwest Polytechnic University, Xi’an, China
* Corresponding Authors: Pengchang Zhang. Email: ; Bingliang Hu. Email:
(This article belongs to the Special Issue: Development and Industrial Application of AI Technologies)
Computers, Materials & Continua 2023, 77(3), 3783-3800. https://doi.org/10.32604/cmc.2023.042074
Received 17 May 2023; Accepted 09 October 2023; Issue published 26 December 2023
 View Full Text
 Download PDF
Abstract
Sanxingdui cultural relics are the precious cultural heritage of humanity with high values of history, science, culture, art and research. However, mainstream analytical methods are contacting and detrimental, which is unfavorable to the protection of cultural relics. This paper improves the accuracy of the extraction, location, and analysis of artifacts using hyperspectral methods. To improve the accuracy of cultural relic mining, positioning, and analysis, the segmentation algorithm of Sanxingdui cultural relics based on the spatial spectrum integrated network is proposed with the support of hyperspectral techniques. Firstly, region stitching algorithm based on the relative position of hyper spectrally collected data is proposed to improve stitching efficiency. Secondly, given the prominence of traditional HRNet (High-Resolution Net) models in high-resolution data processing, the spatial attention mechanism is put forward to obtain spatial dimension information. Thirdly, in view of the prominence of 3D networks in spectral information acquisition, the pyramid 3D residual network model is proposed to obtain internal spectral dimensional information. Fourthly, four kinds of fusion methods at the level of data and decision are presented to achieve cultural relic labeling. As shown by the experiment results, the proposed network adopts an integrated method of data-level and decision-level, which achieves the optimal average accuracy of identification 0.84, realizes shallow coverage of cultural relics labeling, and effectively supports the mining and protection of cultural relics.Keywords
The Sanxingdui ancient site is one of the greatest archaeological discoveries of human beings, and the unearthed numerous cultural relics are precious human cultural heritage with high historical, scientific, and cultural values [1]. Thus, it is of great significance and meaningfulness to investigate Sanxingdui cultural relics.
Currently, there are various mainstream technologies for analysis of cultural relics. For instance, 3D imaging scanning technology can construct a digital model based on the geometric and appearance data of cultural relics in the real world to achieve virtual restoration of external features of cultural relics [2]. Thermo luminescence analysis technology, as a destructive analysis technique [3], can determine the firing time by measuring the radiation energy stored in this ancient pottery. X-ray fluorescence analysis technology can support identifying the actual content of different elements and components contained in cultural relics, but it simply reflects single-point information [4]. Besides, an electron probe can concentrate and excite the sample by focusing on the electron flow. Under excitation, corresponding elemental feature energy and ray intensity will be generated below the micro-region surface. Through analysis, the element content in the collected samples can be grasped. Although the method can reflect local features, there is still potential to improve the analysis of overall morphology [5]. The core of Raman spectroscopy is reliant on the interaction between light and chemical bonds in materials, which can provide detailed information about the chemical structure, phase and morphology, crystallinity, and molecular interaction of samples [6]. The method can analyze from the perspective of spectral lines, but there is still potential to improve the study of overall spatial morphology. Hyperspectral imaging analysis technology, as a non-contact and non-destructive analysis method with a high spatial and spectral resolution, can intuitively display its spatial morphology and indirectly analyze the material information [7].
With the development of artificial intelligence technology, intellectualization has become an increasingly prevailing technology in the analysis of cultural relics, which mainly involves the digital establishment of cultural relics and feature intelligent labeling. In terms of the establishment of digitalization of cultural relics, Origlia et al. [8] set up a Multiple-source database to achieve intelligent management of cultural relics. Wang et al. [9] proposed digital cultural relic preservation and digital reproduction technology. Li et al. [10] analyzed 3D digital features of cultural relics. Murphy et al. [11] applied lasers to model buildings. Wang et al. [12] achieved dynamic museum tours using virtual reality technology. Li et al. [13] investigated the application of intelligent monitoring technology for cultural heritage collections based on the Internet of Things. Hou et al. [14] constructed a virtual restoration model for damaged cultural relics. Fan et al. [15] put forward a digital design and application strategy for the display of intangible cultural heritage. Jiang et al. [16] achieved virtual interaction in museums by constructing a 3D model. Xiang et al. [17] adopted enhanced technology by X-ray. In terms of the feature intelligent labeling, Colace et al. [18] proposed a context-aware network for analysis of cultural relics. Based on local geometric features, Zhou et al. [19] extracted and classified cultural relic models. Yan et al. [20] researched the splicing method of digital cultural relic fragment models. Wen et al. [21] raised an algorithm for the automatic annotation of cultural relics. Huang et al. [22] proposed a deep-learning Chinese rubbing-image binarization algorithm. Li et al. [23] put forward an adaptive weighted semantic edge detection algorithm for cultural relics. Gao et al. [24] proposed a 3D cultural relic classification method based on a low-dimensional description operator and unsupervised learning. Through a digital image processing approach, Zhang et al. [25] investigated the cultural relic character recognition methods. Peng et al. [26] extracted the framework based on the sketch of the ruins of the detail-aware hierarchical depth network. Pan et al. [27] proposed a relief 3D reconstruction based on weak edge enhanced deep learning. Xie et al. [28] studied historical and cultural communication strategies based on the back-propagation (BP) neural network model. Apart from that, Liu et al. [29] constructed a super-resolution algorithm and implemented the cultural relic image enhancement.
In conclusion, artificial intelligence is highly prevailing in the promotion and exhibition of cultural relics. Due to the unique nature of cultural relics, there are few relevant methods for intelligent analysis of mining sites. To improve the accuracy and precise positioning analysis of cultural relics excavation, this paper has proposed a hyperspectral image labeling algorithm for Sanxingdui cultural relics based on a spatial-spectral fusion network.
The innovations of this paper include: 1) the use of the hyperspectral to obtain cultural relic information; 2) establishment of a model to identify cultural relics from the perspective of space and spectrum; 3) construction of four kinds of data-level and decision-level fusion methods to assist archeologists in better mining, protecting, and analyzing the cultural relics.
Hyperspectral imaging technology, which contains two-dimensional geometric spatial and one-dimensional spectral information of the detection target, can obtain continuous and narrow-band image data with high spectral resolution [30]. Hyperspectral image data is conductive to intuitively displaying its spatial form, indirectly analyzing material information, and distinguishing the cultural relics, adhesion, decoration and substrate applied in cultural relics through the spectral analysis algorithms (e.g., spectral classification, spectral mixing-removal, and automatic extraction of target components). Meanwhile, hyperspectral image data can utilize feature spectral images to extract invisible information from different cultural relics, identify materials, and detect images. To comprehensively leverage the prominence of high spatial and inter-spectral resolution of spectral images, this paper explores and designs the research block diagram (see Fig. 1). Firstly, hyperspectral images are spliced to obtain a larger range of images for analysis. Secondly, the spatial attention HRNet model is proposed to extract features of image spatial dimensions. Thirdly, a pyramid-based 3D residual network model is put forward to extract features from inter-spectral dimensions. Fourthly, a multi-level fusion mechanism is proposed to achieve hyperspectral image labeling of Sanxingdui cultural relics.
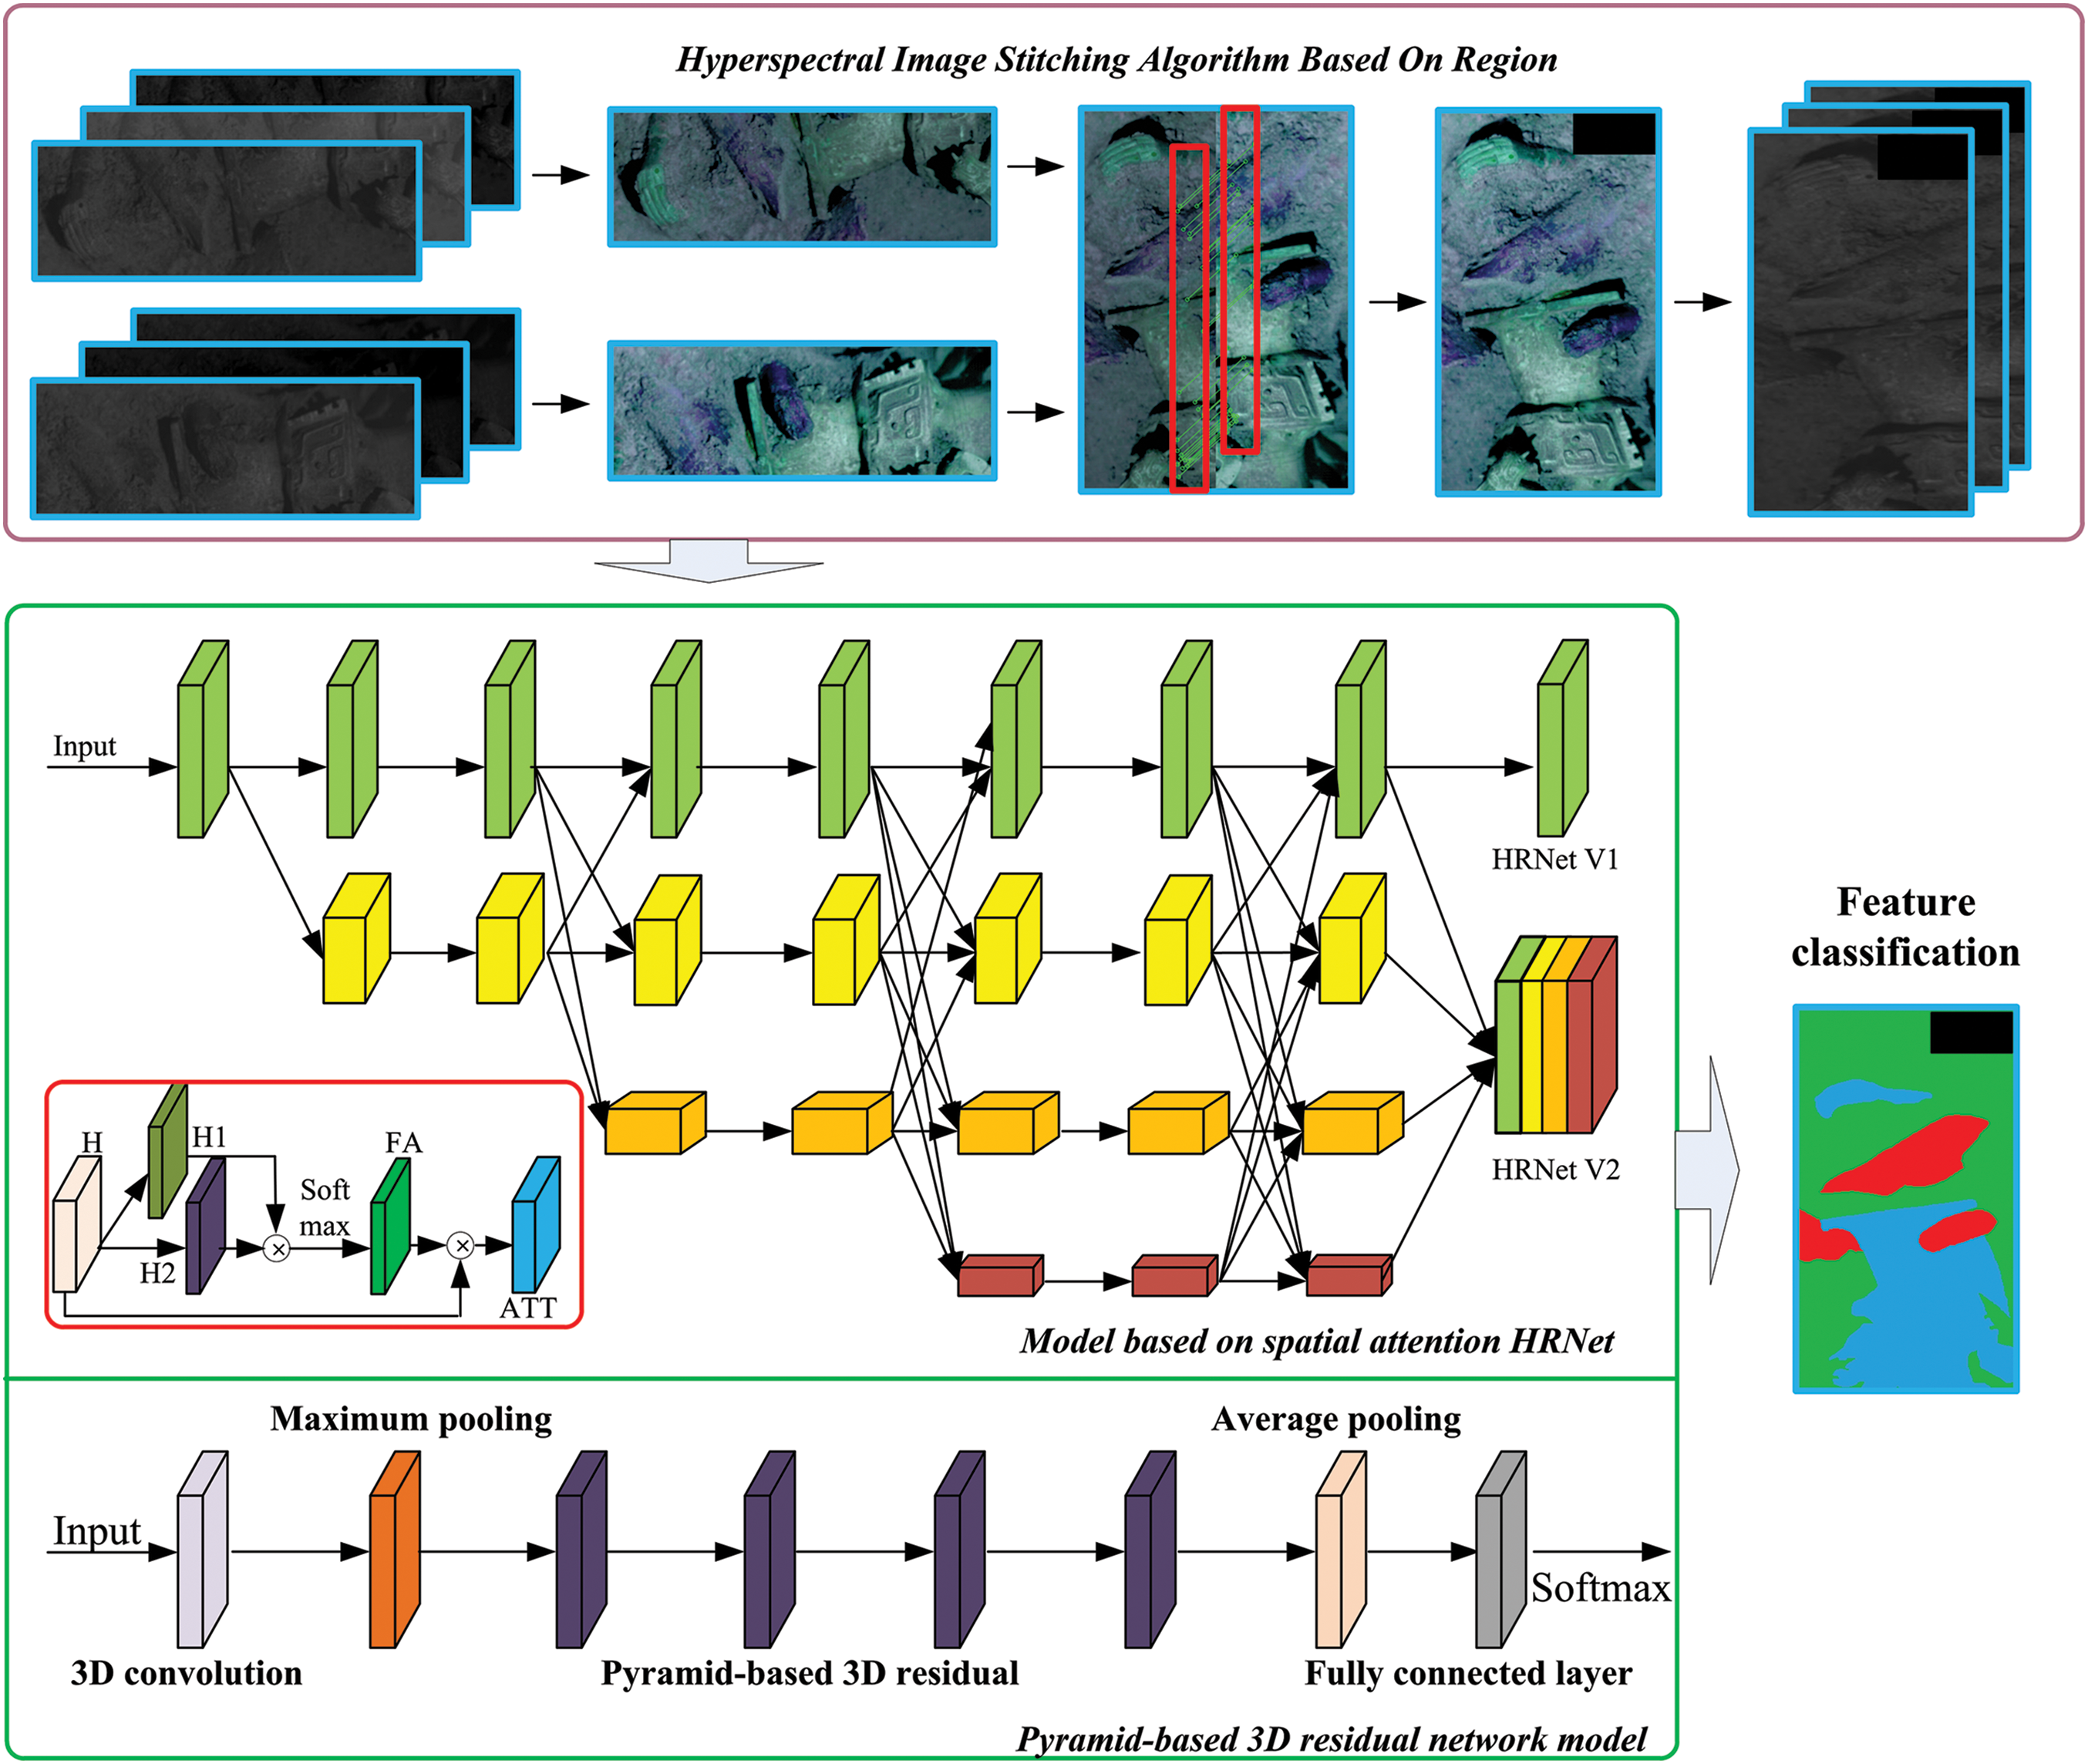
Figure 1: Algorithm flowchart
2.1 Hyperspectral Image Stitching Algorithm Based on Region
The push-type spectrometer can perform a single scanning to ensure high spatial resolution. Due to the limited area of obtained hyperspectral image information, multi-track image information shall be stitched to obtain high spatial and high-resolution image data [31]. During the stitching process, image matching and correction are worthy of attention. Image correction is achieved by solving pixel by pixel and realizing pixel correction, whose computational complexity is relatively fixed. Besides, this paper designs a fast image-matching algorithm to improve the efficiency of image stitching. Traditional image-matching algorithms can calculate feature points for panoramic images. Given that the known relative coordinates of the hyperspectral instrument are used for each shot, this paper simply obtains feature matching points within the overlapping areas to improve the image efficiency.
Firstly, this paper calculates the overlapping area of the image. As shown in Fig. 2, the overlapping area can be calculated as:

Figure 2: Overlapping area
where, xk represents the abscissa of adjacent vertices of overlapping polygons, and yk represents the ordinate of adjacent vertices of overlapping polygons. The overlap between adjacent images can be calculated as:
where, Sall represents the area of a single original image. If η < 0.25, it is deemed as a match, and the connection matrix is symmetric. The matrix elements (i, j) represent the overlap between the ith and jth images. Since the overlap of the image itself is not calculated, the diagonal element is 0.
The Dense Scale-Invariant Feature Transform (SIFT) operator first performs Gaussian smoothing on the image, and obtains the sampling point coordinates and feature descriptors in the image through a sliding window. This paper constructs a sliding window with the upper left corner of the image as the initial position, and calculates the gradient in 8 directions of each pixel within the window to form a feature vector.
The Dense SIFT operator can achieve fast feature extraction, with large numbers of extracted feature points. This paper focuses on the overlapping areas of the images, obtains matching points between the corresponding images, and divides the images into blocks. After acquisition of the initial matching points for the image block, the Random Sample Consensus (RANSAC) algorithm is utilized to eliminate matching points.
This paper matches the down-sampling images to improve the calculation efficiency of Dense SIFT. However, the problem lies in that the two successfully matched feature points have deviations in their actual positions. To address this issue, this paper applies the Normalization Cross Correlation (NCC) matching algorithm for both the sampled images and the original images, performs fine matching on the Dense SIFT matching results, and applies a parabolic fitting to obtain sub-pixel precision matching points.
By calculating the correlation coefficient between matching windows, Normalization Cross Correlation (NCC) can perform the matching, which has high accuracy in situations where grayscale changes and geometric distortions are not significant. If matching is only performed in a small area, the method is free from the influence of local lighting changes and has fast matching speed:
where,
(1) In terms of the image down-sampling, the search window size is set with the reference image Dense SIFT matching point as the center.
(2) This study calculates the NCC correlation coefficient between the Dense SIFT matching points of the image to be matched and the pixels in the search window.
(3) According to calculation, the maximum point ρ is the best match point.
(4) Combining with the image down-sampling magnification, the point mapping to the original image can be matched. By performing NCC matching on the original image search window, the point with the highest correlation coefficient can be deemed as the initial matching point of the original image.
(5) The matching correlation coefficients of adjacent pixels in the row and column directions of the initial matching points are calculated. Then, the optimal matching position is calculated by improving the application of parabolic fitting correlation coefficients, and sub-pixel level matching points on the original image can be obtained.
(6) RANSAC algorithm is applied to estimate the fundamental matrix between images, and eliminate the matching points with poor accuracy.
If the correlation between adjacent images is unilaterally considered, the error in attitude estimation will be superimposed, resulting in unreliable estimation results, and the final stitching result will have a significant deviation. To solve this problem, the paper considers the matching points of all images as observation values, and integrates them into the regional network as a whole. Beyond that, this paper makes global adjustments to all images. The calculation can be expressed as follows:
where, [V1 V2]T represents the pixel error, t1 and t2 represent the matrix composed of extended region elements, X represents the column matrix composed of coordinate correction numbers at the fixed point, A1 and A2 represent the coefficient matrices of t1 and t2, respectively. B1 and B2 represent the coefficient matrix of X. l1 and l2 represent constant terms corresponding to V1 and V2.
When the expanded area elements of each image are obtained by bundle adjustment, the collinearity equation is applied to project each image to the same elevation plane by using the accurate expanded elements of each image, and the projection (X, Y) of the coordinates (x, y) of each image on the elevation plane is calculated.
where, A, B, and C represent elements of the image orthogonal transformation matrix. ZH represents the projection plane matrix, Xs, Ys, and Zs represent the extended element coordinates, and f represents the focal length. Based on the projection coordinates of the image corners, the boundary coordinates of the original image elevation plane can be calculated. By setting the ground sampling interval, this paper can calculate the corresponding point coordinates starting from the upper left corner of the projection boundary. The bilinear interpolation method is used to calculate the coordinates of pixel points and correcting each image to the object plane, and then the difference image of the overlapping area image can be calculated. According to the line-by-line search method, this paper selects a path with the smallest difference between the two images on the difference image as the mosaic line, and adopts the mosaic line to segment and concatenate the image to obtain the final mosaic image.
2.2 Model Based on Spatial Attention HRNet
Visual recognition has three main core elements: image classification, object detection, and semantic segmentation. It is difficult to get accurate prediction results for low-resolution and spatial accuracy-sensitive tasks obtained through continuous structured convolution or pooling through classification networks. To compensate for the loss of spatial accuracy, researchers have introduced the up-sampling operation and combined hole convolution to reduce the number of down-sampling and improve the resolution of feature maps based on the classification convolution neural network structure.
High-resolution characterization is mainly reflected in two aspects. To be specific, the first aspect is the original high-resolution characterization. Notably, after a small number of convolution operations, it can only provide low-level semantic expression. The second aspect is the high-resolution representation obtained through up-sampling for low-resolution representation. Despite its good semantic expression capability, the up-sampling itself is unavailable to fully compensate for the loss of spatial resolution. Therefore, the spatial sensitivity of the high-resolution representation of the final output is not high enough, which is largely limited by the resolution corresponding to the strong semantic expression of the representation.
The entire network always maintains a high-resolution feature map and gradually introduces low-resolution convolution, which connects convolutions of different resolutions in parallel. Meanwhile, this paper continuously exchanges information between multi-resolution representations to enhance the expression capability of high-resolution and low-resolution representations, with a view to better promoting each other between multi-resolution representations.
Currently, the mainstream HRNet [32] network consists of two versions. Starting from high-resolution blocks, HRNet V1 utilizes convolution operations to establish the connection between high-resolution and low-resolution block, which leaves multi-resolution convolutions connected in parallel, takes the output of high-resolution blocks as the result, and obtains different dimensional features from both horizontal and vertical directions. Based on HRNet V1, HRNet V2 adds a head layer for semantic segmentation.
Mainstream HRNet tend to use traditional convolutional operations, which obtain features in a forward direction with limited information. To obtain more detailed information, multispectral images are considered based on their high spatial resolution. However, during the down-sampling process, some details will be lost inevitably. To reduce the loss caused by down-sampling, this paper introduces a spatial attention mechanism (see Fig. 3), calculates weights by combining the information of coordinate pixels, focuses on key areas, and decomposes the feature map H into H1 and H2. Meanwhile, this paper multiplies H1 and H2, and applies Softmax to obtain attention map FA. After multiplying FA and H to obtain attention features, this paper constructs a ResNet [33] structure and achieves the final feature aggregation.

Figure 3: Model based on spatial attention HRNet
2.3 Pyramid-Based 3D Residual Network Model
Pyramid-based 3D residual network model mainly consists of three parts, as shown in Fig. 4. 1) 3D sample extraction; the samples are composed of pixels to be classified and surrounding 3D domain is used for network training, and the labels of the sample points are determined by the category of the center pixel of the 3D cube; 2) Feature extraction; after passing through convolutional layers, down-sampling layers, and multiple pyramid residual network modules, the 3D data blocks extracted from the image obtain deep features for classification; 3) Classification; after global average pooling, the information is aggregated, and the feature map obtained from the feature extraction section is input into the fully connected layer, and the final result of the classifier is obtained by combining with Softmax.

Figure 4: Pyramid-based 3D residual network model
The pyramid residual module is composed of multiple pyramid residual units stacked together, and the combination of each pyramid residual block determines the network depth of the entire model. Pyramid residual network extracts spectral spatial features by gradually increasing the dimension of the feature map with residual units, which not only improves the classification effect, but also avoids exponential growth of network parameters with the increased network depth. Fig. 5 shows the pyramid residual unit structure used in this paper. Before convolution, the Batch Normalization (BN) layers and ReLu layers are set to normalize the data and accelerate the training and convergence speed of the network. The BN layer associates all data together, and ReLu incorporates nonlinear factors to improve the model’s expressive power, where the output of the data is influenced by other data in multiple batches, and each training batch is acquired randomly. Therefore, the whole network will not over-learn in a single direction, which can effectively avoid over-fitting under the deep network.

Figure 5: Pyramid residual unit structure
As for short connection paths, identity mapping or convolution projection is popular. However, identity mapping or convolution projection becomes inapplicable for a deep network model. In view of the feature graph dimension of the pyramid model, this paper intelligently chooses a 1 × 1 convolutional network or short connection of a zero-filled identity map. Given that a 1 × 1 convolutional network will cause feature degradation, this paper uses the zero-filling method to build the network.
With the increased network, most networks significantly increase the number of feature maps while reducing their size. The number of feature map parameters for residual units can be expressed as:
where, n represents the index number of the group, and k represents the residual unit index number. The residual units of the same group are of the same feature size. For the nth residual group, the feature size decreases by 0.5, and the dimension of the feature map becomes twice the original after each residual unit. With the increased depth of the network, the dimension of the feature map increases sharply. The increased number of feature maps in the 3D pyramid residual network can be expressed as:
where, N represents the number of residual units, and α represents the added dimensions of the final feature map. Between the residual units of the pyramid, the dimensions of the feature map are controlled by α/(N − 1) after passing through 1 residual block. The dimensional growth pattern triggers a linear increase in the number of feature maps as the number of residual units passed through increases. The number of feature maps in the entire network model ultimately presents a “Pyramid” shape. This paper constructs a network from a 3D perspective to extract local spatial and spectral features, achieving the extraction of cultural relics.
2.4 Multilevel Integration Mechanism
This paper introduces the construction of a model based on spatial attention HRNet and a pyramid-based 3D residual network model, and achieves the final labeling result by fusing the two networks. At present, prevailing fusion strategies include data-level integration, feature-level integration, and decision-level integration. Hyperspectral images have spatial and spectral dimensions, and data fusion strategies from different angles also influence the final annotation effect. This paper adopts a decision-level approach for integration so as to fully leverage the advantages of the spatial attention HRNet network for high-resolution images and the inclusion of spatial-spectral information in the pyramid 3D residual network.
The model based on spatial attention HRNet does not support direct input of high-dimensional spectral data. This paper reduces the dimensionality of the data or extracts layer representative bands. The mainstream methods include:
(1) Single band image: The information contained in each layer of an image has certain differences, which can reflect the degree of response of ground objects in that spectral range.
(2) Principal Component Analysis (PCA) dimensionality reduction: In image recognition and high-dimensional data dimensionality reduction processing, PCA dimensionality reduction is of strong applicability. Its algorithm mainly performs a linear transformation on the original data by calculating and selecting feature vectors with larger eigenvalues. This removes useless noise and reduces computational complexity.
(3) Maximum density projection: The maximum value in the pixel block that each spectral line passes through is calculated as the output image.
(4) Visual mapping model: Based on the principle of visual perception, areas with similar colors can be classified into one category. For this purpose, this paper randomly selects 100 individuals aged from 10 to 40 and continuously adjusts the three-channel images using the univariate method. The images are displayed in pseudo color, and the colors are classified into seven colors, as shown in Fig. 6. Besides, the average result of 100 people is used as the final color mapping interval.

Figure 6: Visual mapping model
Therefore, this paper extracts three spectral bands from hyperspectral images and applies the univariate method to form pseudo-color images. Through analysis of color mapping, this paper determines the differences to assist in the selection of spectral images, and takes this spectral combination as input to the HRNet image.
The above four algorithms obtain image features from different dimensions. To determine the final network fusion method, this paper adopts the fusion method, as shown in Fig. 7a, based on a single frame and frame-by-frame input image. The fusion weight of each item can directly affect the subsequent annotation effect. The method based on multi-frame fusion is presented in Fig. 7b, which is applicable to methods 2, 3, and 4. The weights of the spatial attention HRNet based model and the pyramid 3D residual network model are both set to 0.5.

Figure 7: Structure of feature integration model
Hyperspectral data, collected on-site by an infrared spectrum spectrometer that mainly includes bronze, ivory, gold and jade, are used to conduct the experiments. There are 821 frames of hyperspectral images with image resolutions ranging from 600 × 800 to 1400 × 3200. This paper manually labels hyperspectral data as the gold standard. Each pixel can be deemed as a set of spectral data. The ratio of training and test data is 1:1. The typical hyperspectral curve is shown in Fig. 8. Besides, the spectral curves of different objects have certain differences, supporting the extraction of cultural relics.
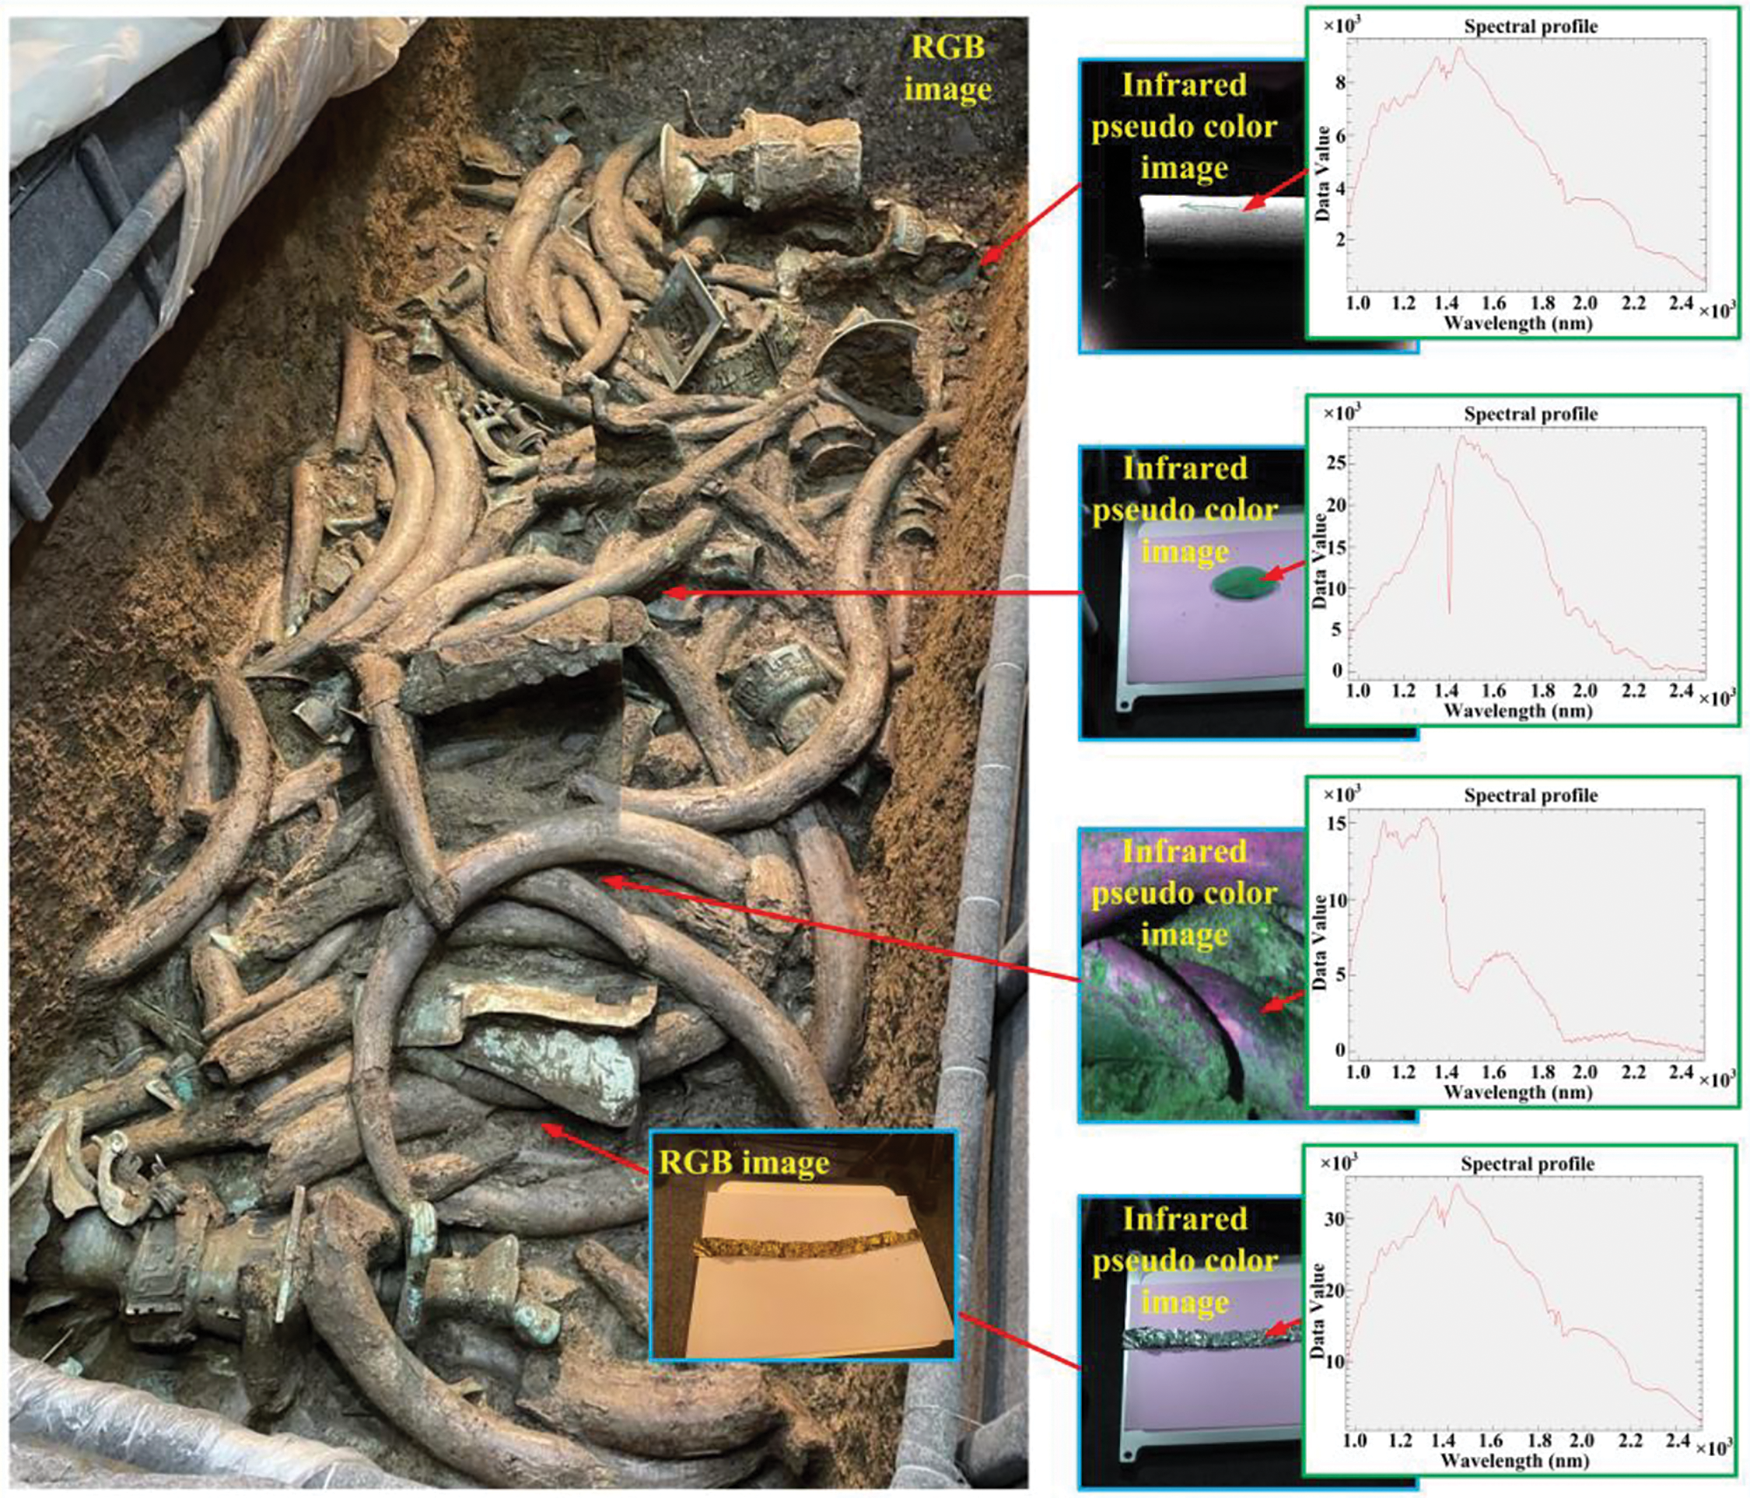
Figure 8: Site cultural relics data
3.1 Performance of Cultural Relics Splicing Algorithm
To verify the performance of the hyperspectral image stitching algorithm, this paper measures from two aspects: feature selection dimension and stitching effect. The selected features are a prerequisite for stitching, and the number of features contained in each frame of the image has certain differences, as shown in Fig. 9. The SIFT feature extraction produces more feature points, while the Oriented FAST and Rotated BRIEF feature extraction produces relatively insufficient features. The feature points reach their peak near 75 frames, and their calculation time is positively correlated with the image size. Therefore, calculating features within a small domain reduces computational complexity and improves the accuracy of subsequent pixel matching.

Figure 9: Feature quantity curve
To visually demonstrate the fast stitching algorithm based on hyperspectral images, this paper extracts the stitching effects of three bands of pseudo color images for display (see the performance in Fig. 10). It is noteworthy that Fig. 10a consists of 7 sets of hyperspectral data, with significant differences in the information contained in each set of image. There are fewer overlapping areas between hyperspectral data, and the data is not in the same horizontal dimension. Fig. 10b consists of 7 sets of data, each containing a large overlapping area that is basically in the same horizontal dimension. Fig. 10c consists of 5 sets of data, with collected spectral data closer to the target, a smaller field of view, and higher spatial resolution. Fig. 10d consists of 12 sets of data, which contains a wide range of spatial information and exhibits differences in both horizontal and vertical dimensions. In conclusion, these four types of data represent the majority of data-splicing situations. As shown by the stitching effect, the stitching image is of sound consistency, and there is no obvious display at the stitching line.

Figure 10: Hyperspectral pseudo color image stitching effect display
3.2 Comparison Experiment of Integration Mechanism
To verify the performance of the four fusion algorithms, this paper annotates the images at the pixel level and classifies them into ivory, bronze, and ground. Fig. 11 shows the performance of algorithm annotation. The confusion matrix is used to quantitatively evaluate [34] the effect, and specific measures are: 1) Single band image input as shown in Fig. 11a; This paper integrates the output results of each layer with the same weight to achieve decision-level fusion and target annotation. However, the information contained in each frame of the image is different, resulting in poor performance if calculated with the same weight. 2) Image input for PCA dimensionality reduction as shown in Fig. 11b; Based on the correlation between the data, this paper reduces the hyperspectral data to a lower dimension, but these images contain most of the information of the hyperspectral data. Meanwhile, this paper inputs the reduced dimensionality image sequence, which reduces network computation time and achieves good target annotation results. 3) Maximum density projection image input as shown in Fig. 11c; Through constructing the point composition image with the strongest response data in spectral images, the target area is highlighted and performance is further improved. 4) Visual mapping image input as shown in Fig. 11d; By simulating the visual perception process, the maximum saliency of band combinations is extracted and input, and the experiment achieves the best results.

Figure 11: Annotation effects of different integration mechanisms
3.3 Comparison of Target Annotation Performance
To verify the annotation performance of different algorithms, this paper uses ivory as a typical feature and calculates the Receiver Operating Characteristic (ROC) curves of UNet [35], DenseNet [36], HRNet [32], spatial attention-based HRNet model, pyramid-based 3D residual network model, and the proposed model to obtain features (see the data in Fig. 12). To sum up, UNet adopts an Encoder-Decoder structure, which is simple and can achieve target annotation. Through the connection of features on channels, DenseNet can achieve feature reuse, which reduces the cost of parameters and calculations. By paralleling multiple resolution branches and constantly interacting information between different branches, HRNet can simultaneously achieve the goal of strong semantic information and accurate location information, and obtain good performances. The simulation of the spatial attention HRNet (SA-HRNet) model highlights the idea of key regions in visual simulation, which improves the computational efficiency and performance of the algorithm. Moreover, good annotation performance is achieved by focusing on local spectral information based on the pyramid 3D residual network (P-3D ResNet) model. This paper proposes an algorithm that integrates the above two algorithms and achieves the best results in building models at both the data-level and the decision-level.

Figure 12: ROC curve
The algorithm annotation effect is shown in Fig. 13. In terms of the concatenated hyperspectral images, the differences in the composition and distribution of ground features cause slight differences in the labeling effect. However, the overall accuracy is better than 0.8. Especially, in the face of targets with shallow soil cover, labeling can be effectively achieved through the differences in different hyperspectral features.
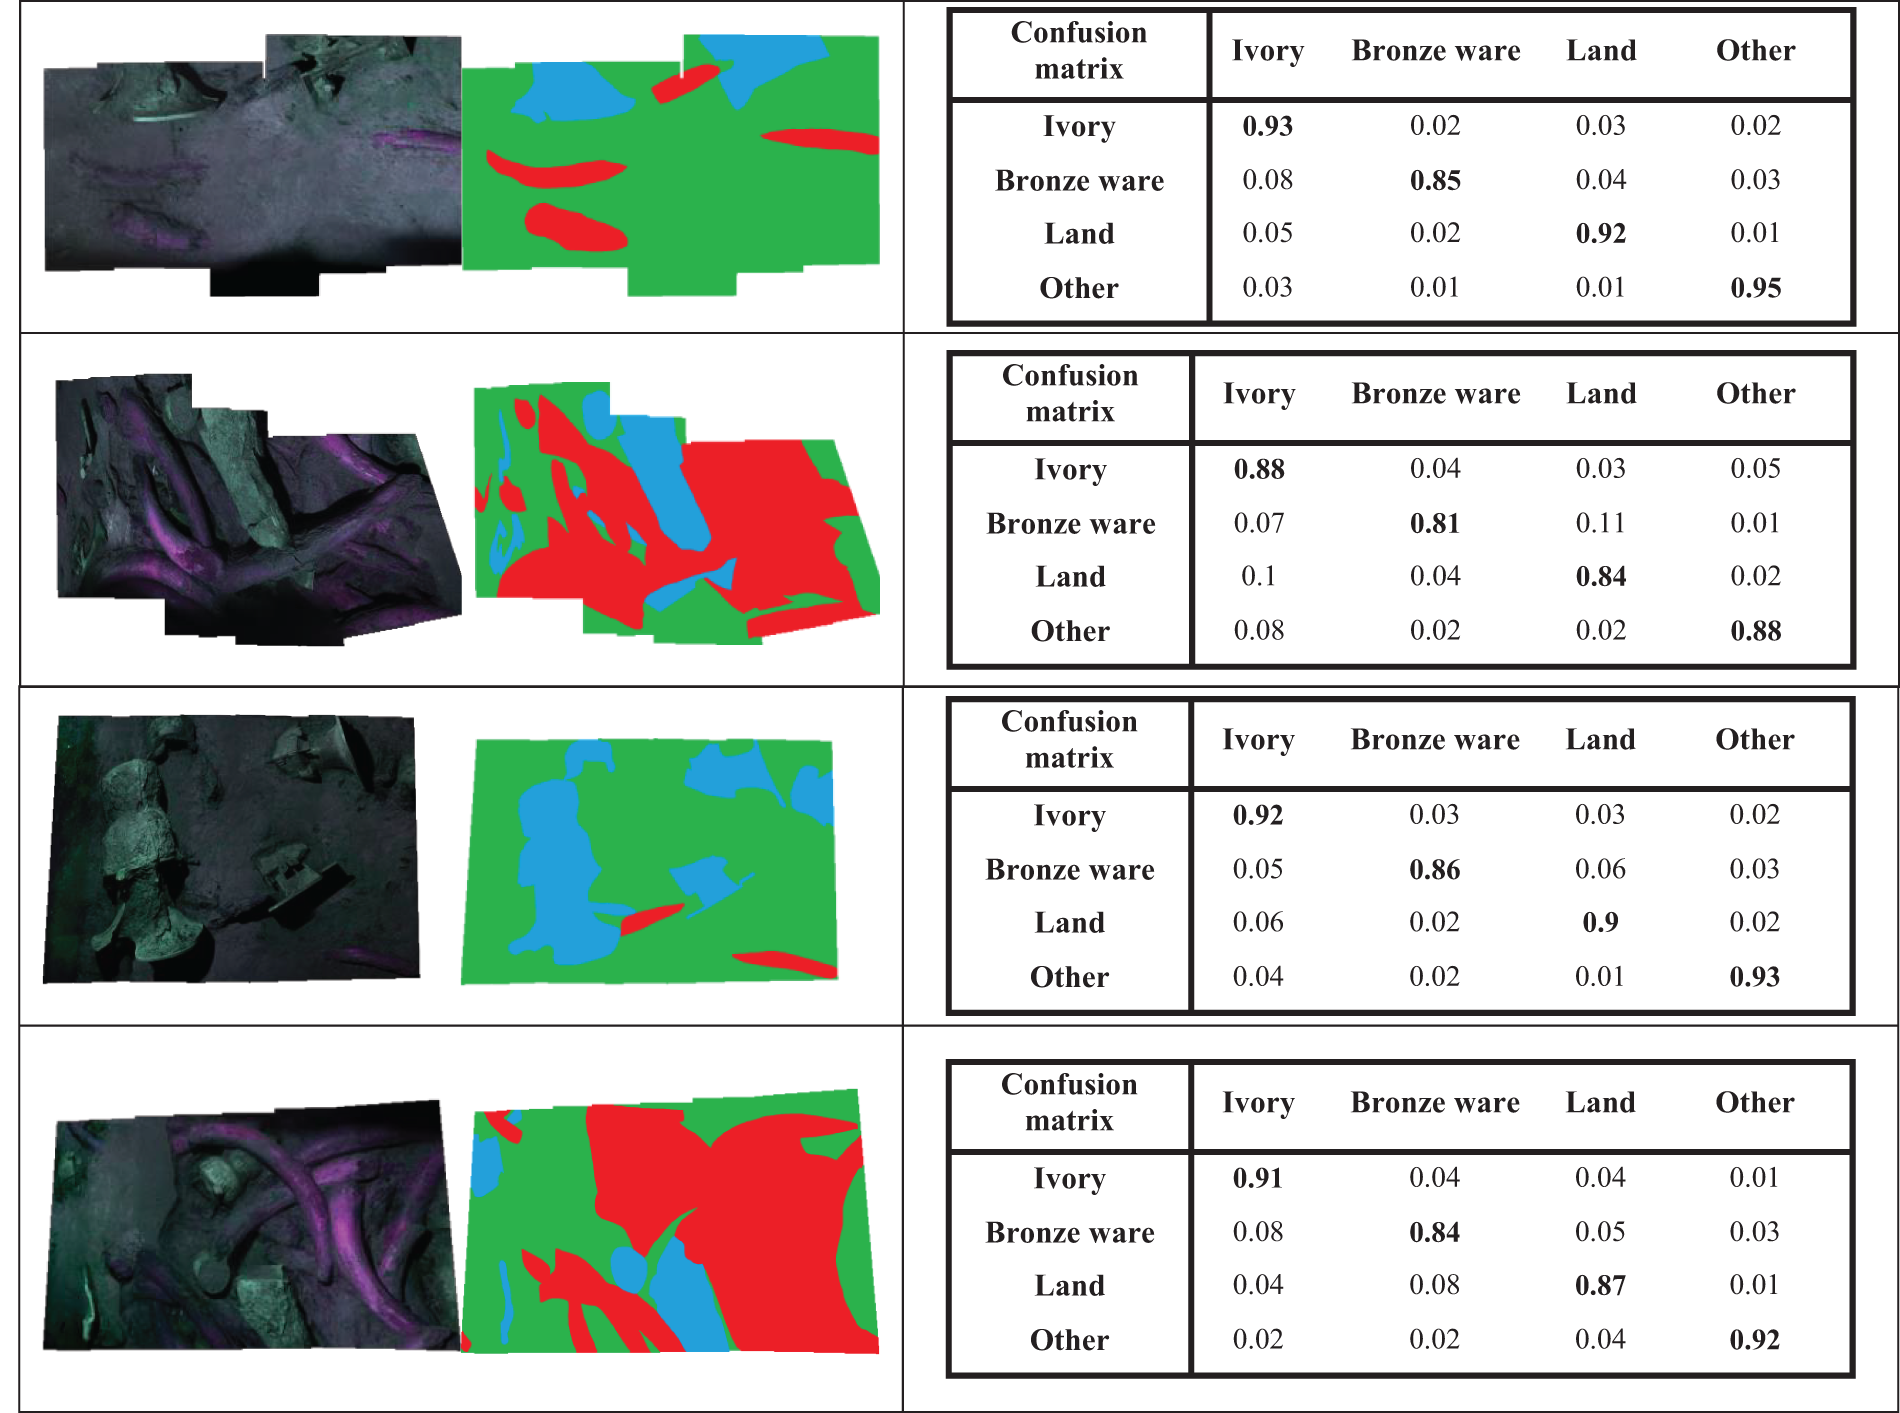
Figure 13: Target annotation effect
To improve the accuracy of cultural relic mining and protection, this paper has proposed a spatial-spectral fusion network-based Sanxingdui cultural relic recognition algorithm with the support of hyperspectral techniques.
This paper optimizes traditional stitching algorithms and improves stitching efficiency by combining with relative coordinates of hyperspectral instruments. Based on the HRNet model, a spatial attention mechanism is proposed to identify Sanxingdui cultural relics from a spatial dimension. Furthermore, a pyramid structure is put forward by using a 3D residual network model to identify Sanxingdui cultural relics from the inter-spectral dimension. To fully leverage network performance, the paper proposes four fusion mechanisms from the perspectives of data-level and decision-level. As shown by the experiment results, the fusion strategy based on the visual mapping model achieves the optimal effect. In the future research, how to analyze and label cultural relics with a small sample size is of great significance and worthy of exploration.
Acknowledgement: Thanks for Sichuan Institute of Cultural Relics and Archaeology. The authors also grate fully acknowledge the helpful comments and suggestions of the reviewers, which have improved the presentation.
Funding Statement: This work is supported by Light of West China (No. XAB2022YN10), Shaanxi Key Rsearch and Development Plan (No. 2018ZDXM-SF-093) and Shaanxi Province Key Industrial Innovation Chain (Nos. S2022-YF-ZDCXL-ZDLGY-0093 and 2023-ZDLGY-45).
Author Contributions: Shi Qiu, Pengchang Zhang and Xingjia Tang performed the experiments. Zimu Zeng, Miao Zhang and Bingliang Hu analyzed the data. All authors conceived and designed research, and contributed to the interpretation of the data and drafting the work.
Availability of Data and Materials: The data used to support the findings of this study are available from the corresponding author upon request.
Conflicts of Interest: The authors declare that they have no conflicts of interest to report regarding the present study.
References
1. H. Tian, X. Zeng, J. Guo, L. Qu and K. Chen, “X-ray computed tomography reveals special casting techniques used with unusual bronze objects unearthed from the Sanxingdui site,” Advances in Archaeomaterials, vol. 3, no. 1, pp. 28–33, 2022. [Google Scholar]
2. Y. H. Jo and S. Hong, “Application of three-dimensional scanning, haptic modeling, and printing technologies for restoring damaged artifacts,” Journal of Conservation Science, vol. 35, no. 1, pp. 71–80, 2019. [Google Scholar]
3. S. Fiorentino, M. Vandini, T. Chinni, M. Caccia, M. Martini et al., “Colourants and opacifiers of mosaic glass tesserae from Khirbet al-Mafjar (Jericho, PalestineAddressing technological issues by a multi-analytical approach and evaluating the potentialities of thermoluminescence and optically stimulated luminescence dating,” Archaeological and Anthropological Sciences, vol. 11, pp. 337–359, 2019. [Google Scholar]
4. W. Lee, M. J. Jee, H. Kang, D. Ryu, T. Kimm et al., “Reconstruction of radio relics and X-ray tails in an off-axis cluster merger: Hydrodynamical simulations of A115,” The Astrophysical Journal, vol. 894, no. 1, pp. 60, 2020. [Google Scholar]
5. K. E. Wright, J. M. Harp and L. Capriotti, “Electron probe microanalysis of irradiated FUTURIX-FTA U-Pu-Zr alloy with added minor actinides,” Journal of Nuclear Materials, vol. 526, no. 1, pp. 151745, 2019. [Google Scholar]
6. J. Brandt, K. Mattsson and M. Hassellöv, “Deep learning for reconstructing low-quality FTIR and raman spectra—A case study in microplastic analyses,” Analytical Chemistry, vol. 93, no. 49, pp. 16360–16368, 2021. [Google Scholar] [PubMed]
7. Z. Zhang, Y. Ding, X. Zhao, L. Siye, N. Yang et al., “Multireceptive field: An adaptive path aggregation graph neural framework for hyperspectral image classification,” Expert Systems with Applications, vol. 217, no. 11, pp. 119508, 2023. [Google Scholar]
8. A. Origlia, S. Rossi, S. D. Martino, F. Cutugno and M. L. Chiacchio, “Multiple-source data collection and processing into a graph database supporting cultural heritage applications,” Journal on Computing and Cultural Heritage, vol. 14, no. 4, pp. 1–27, 2021. [Google Scholar]
9. Y. C. Wang, C. L. Chen and Y. Y. Deng, “Museum-authorization of digital rights: A sustainable and traceable cultural relics exhibition mechanism,” Sustainability, vol. 13, no. 4, pp. 2046, 2021. [Google Scholar]
10. F. Li and H. Zhao, “3D real scene data collection of cultural relics and historical sites based on digital image processing,” Computational Intelligence and Neuroscience, vol. 2022, pp. 1–9, 2022. [Google Scholar]
11. M. Murphy, E. McGovern and S. Pavia, “Historic building information modelling-adding intelligence to laser and image based surveys of European classical architecture,” ISPRS Journal of Photogrammetry and Remote Sensing, vol. 76, no. 3, pp. 89–102, 2013. [Google Scholar]
12. R. G. Wang, H. L. Dong, M. W. Wu and Q. F. Wu, “Research and design of digital museum based on virtual reality,” Advanced Materials Research, vol. 926, pp. 2516–2520, 2014. [Google Scholar]
13. H. Li, Y. Wang and K. Zhang, “Research on the application of intelligent monitoring technology for collection of cultural relics based on the internet of things,” in 2017 7th Int. Conf. on Mechatronics, Computer and Education Informationization (MCEI 2017), Shenyang, China, Atlantis Press, pp. 770–774, 2017. [Google Scholar]
14. M. Hou, S. Yang, Y. Hu, Y. Wu, L. Jiang et al., “Novel method for virtual restoration of cultural relics with complex geometric structure based on multiscale spatial geometry,” ISPRS International Journal of Geo-Information, vol. 7, no. 9, pp. 353, 2018. [Google Scholar]
15. J. Fan, “Digital design and application strategy of intangible cultural heritage presentation,” in 2018 Int. Conf. on Management and Education, Humanities and Social Sciences (MEHSS 2018), Hangzhou, China, Atlantis Press, pp. 279–283, 2018. [Google Scholar]
16. H. Jiang, X. L. Liu, X. Peng, M. X. Tang, D. He et al., “3D models to educated museum interactive exhibition with computing techniques,” in Software Engineering Trends and Techniques in Intelligent Systems, Paris, France, Springer International Publishing, vol. 3, pp. 168–178, 2017. [Google Scholar]
17. J. Xiang, M. Wu, Z. Wang, G. Zhen and L. Ma, “Application of image enhancement in X-ray photography of cultural relics,” Laser & Optoelectronics Progress, vol. 56, no. 6, pp. 063402, 2019. [Google Scholar]
18. F. Colace, M. D. Santo, L. Greco, S. Lemma, M. Lombardi et al., “A context-aware framework for cultural heritage applications,” in 2014 Tenth Int. Conf. on Signal-Image Technology and Internet-Based Systems, Marrakech, Morocco, IEEE, pp. 469–476, 2014. [Google Scholar]
19. J. Zhou, M. Zhou, G. Geng and X. Wang, “Extraction and classification of the cultural relic model based on local geometric features,” Journal of Advanced Computational Intelligence and Intelligent Informatics, vol. 20, no. 6, pp. 1013–1017, 2016. [Google Scholar]
20. X. Yan, Y. Hu and M. Hou, “Research on splicing method of digital relic fragment model,” The International Archives of the Photogrammetry, Remote Sensing and Spatial Information Sciences, vol. 42, no. 3, pp. 2059–2065, 2018. [Google Scholar]
21. C. Wen and Z. Li, “PFCO-based automatic annotation on cultural relic images,” in 2019 IEEE 3rd Information Technology, Networking, Electronic and Automation Control Conf. (ITNEC), Chengdu, China, IEEE, pp. 1962–1966, 2019. [Google Scholar]
22. Z. K. Huang, Z. N. Wang, J. M. Xi and L. Y. Hou, “Chinese rubbing image binarization based on deep learning for image denoising,” in Proc. of the 2nd Int. Conf. on Control and Computer Vision, Jeju, Korea, pp. 46–50, 2019. [Google Scholar]
23. X. Li, X. Li, S. Li and X. Zou, “Adaptive weighted semantic edge detection of cultural relics,” in Twelfth Int. Conf. on Digital Image Processing (ICDIP 2020), Osaka, Japan, SPIE, vol. 11519, pp. 113–119, 2020. [Google Scholar]
24. H. Gao, G. Geng and S. Zeng, “Approach for 3D cultural relic classification based on a low-dimensional descriptor and unsupervised learning,” Entropy, vol. 22, no. 11, pp. 1290, 2020. [Google Scholar] [PubMed]
25. S. Zhang, “Character recognition of historical and cultural relics based on digital image processing,” in 2021 5th Int. Conf. on Electronics, Communication and Aerospace Technology (ICECA), Coimbatore, India, IEEE, pp. 799–802, 2021. [Google Scholar]
26. J. Peng, J. Wang, J. Wang, E. Zhang, Q. Zhang et al., “A relic sketch extraction framework based on detail-aware hierarchical deep network,” Signal Processing, vol. 183, no. 6, pp. 108008, 2021. [Google Scholar]
27. J. Pan, L. Li, H. Yamaguchi, K. Hasegawa, F. I. Thufail et al., “3D reconstruction of borobudur reliefs from 2D monocular photographs based on soft-edge enhanced deep learning,” ISPRS Journal of Photogrammetry and Remote Sensing, vol. 183, pp. 439–450, 2022. [Google Scholar]
28. D. Xie and C. Yin, “Research on the communication strategy of history and culture in Shaanxi based on BP neural network model,” Computational Intelligence and Neuroscience, vol. 2022, no. 7, pp. 1–10, 2022. [Google Scholar]
29. J. Liu, Y. F. Ge and M. Tian, “Research on super-resolution reconstruction algorithm of cultural relic images,” Acta Electonica Sinica, vol. 51, no. 1, pp. 139–145, 2023. [Google Scholar]
30. Z. Chen, G. Wu, H. Gao, Y. Ding, D. Hong et al., “Local aggregation and global attention network for hyperspectral image classification with spectral-induced aligned superpixel segmentation,” Expert Systems with Applications, vol. 232, no. 3, pp. 120828, 2023. [Google Scholar]
31. Z. Chen, Z. Lu, H. Gao, Y. Zhang, J. Zhao et al., “Global to local: A hierarchical detection algorithm for hyperspectral image target detection,” IEEE Transactions on Geoscience and Remote Sensing, vol. 60, pp. 1–15, 2022. [Google Scholar]
32. S. Qiu, H. Ye and X. Liao, “Coastline recognition algorithm based on multi-feature network fusion of multi-spectral remote sensing images,” Remote Sensing, vol. 14, no. 23, pp. 5931, 2022. [Google Scholar]
33. Z. Wu, C. Shen and A. van den Hengel, “Wider or deeper: Revisiting the resnet model for visual recognition,” Pattern Recognition, vol. 90, no. 3, pp. 119–133, 2019. [Google Scholar]
34. Y. Cai, Z. Zhang, P. Ghamisi, Z. Cai, X. Liu et al., “Fully linear graph convolutional networks for semi-supervised and unsupervised classification,” ACM Transactions on Intelligent Systems and Technology, vol. 14, no. 3, pp. 1–23, 2023. [Google Scholar]
35. S. Guan, A. A. Khan, S. Sikdar and P. V. Chitnis, “Fully dense UNet for 2-D sparse photoacoustic tomography artifact removal,” IEEE Journal of Biomedical and Health Informatics, vol. 24, no. 2, pp. 568–576, 2019. [Google Scholar] [PubMed]
36. K. Zhang, Y. Guo, X. Wang, J. Yuan and Q. Ding, “Multiple feature reweight densenet for image classification,” IEEE Access, vol. 7, pp. 9872–9880, 2019. [Google Scholar]
Cite This Article
 Copyright © 2023 The Author(s). Published by Tech Science Press.
This work is licensed under a Creative Commons Attribution 4.0 International License , which permits unrestricted use, distribution, and reproduction in any medium, provided the original work is properly cited.
 Downloads
 Citation Tools