
 Submit a Paper
 Propose a Special lssue
 Open Access
ARTICLE

Multi-Equipment Detection Method for Distribution Lines Based on Improved YOLOx-s
1 School of Computer and Information Engineering, Jiangxi Normal University, Nanchang, 330022, China
2 School of Digital Industry, Jiangxi Normal University, Shangrao, 334005, China
3 Department of Science and Technology, State Grid Jiangxi Electric Power Research Institute, Nanchang, 330096, China
4 School of Information, North China University of Technology, Beijing, 100144, China
* Corresponding Author: Lei Hu. Email:
(This article belongs to the Special Issue: Machine Vision Detection and Intelligent Recognition)
Computers, Materials & Continua 2023, 77(3), 2735-2749. https://doi.org/10.32604/cmc.2023.042974
Received 18 June 2023; Accepted 12 October 2023; Issue published 26 December 2023
 View Full Text
 Download PDF
Abstract
The YOLOx-s network does not sufficiently meet the accuracy demand of equipment detection in the autonomous inspection of distribution lines by Unmanned Aerial Vehicle (UAV) due to the complex background of distribution lines, variable morphology of equipment, and large differences in equipment sizes. Therefore, aiming at the difficult detection of power equipment in UAV inspection images, we propose a multi-equipment detection method for inspection of distribution lines based on the YOLOx-s. Based on the YOLOx-s network, we make the following improvements: 1) The Receptive Field Block (RFB) module is added after the shallow feature layer of the backbone network to expand the receptive field of the network. 2) The Coordinate Attention (CA) module is added to obtain the spatial direction information of the targets and improve the accuracy of target localization. 3) After the first fusion of features in the Path Aggregation Network (PANet), the Adaptively Spatial Feature Fusion (ASFF) module is added to achieve efficient re-fusion of multi-scale deep and shallow feature maps by assigning adaptive weight parameters to features at different scales. 4) The loss function Binary Cross Entropy (BCE) Loss in YOLOx-s is replaced by Focal Loss to alleviate the difficulty of network convergence caused by the imbalance between positive and negative samples of small-sized targets. The experiments take a private dataset consisting of four types of power equipment: Transformers, Isolators, Drop Fuses, and Lightning Arrestors. On average, the mean Average Precision (mAP) of the proposed method can reach 93.64%, an increase of 3.27%. The experimental results show that the proposed method can better identify multiple types of power equipment of different scales at the same time, which helps to improve the intelligence of UAV autonomous inspection in distribution lines.Keywords
There are large scale and high complexity in China’s power grid, which has a prominent demand for the inspection of distribution lines. In the past, manual inspection and helicopter inspection were mainly used for the inspection of distribution lines [1]. However, due to the complex terrain passed by transmission lines, a wide range of distribution lines, numerous categories of equipment, and large quantities of equipment, the difficulty and cost of manual inspection and helicopter inspection are increasing. Manual inspection and helicopter inspection make it very difficult to meet the daily inspection needs of distribution lines. Through shooting and interpreting the images of the distribution lines, Unmanned Aerial Vehicle (UAV) autonomous inspection [2–4] has the advantages of low cost, high efficiency, wide coverage, and little influence by the geographical environment. So, UAV autonomous inspection is used to replace inefficient manual inspection and helicopter inspection. Equipment identification is one of the basic tasks of UAV autonomous inspection. By target detection method, UAV automatic inspection can automatically detect power equipment, which is of great significance to improve the automation of the operation and management of distribution lines. Therefore, the accurate detection of power equipment in UAV automatic inspection is vital.
At present, because of belonging to the target detection methods, power equipment detection methods for distribution lines based on UAV inspection images are mainly divided into two types: one is the method based on traditional image processing, and the other is the method based on deep learning. Traditional image processing methods use manually set detectors for feature extraction. It separates the target from the background by color, texture, and other features, and then performs target detection by modeling. Traditional methods rely on sufficient prior knowledge or image processing experience, which cannot mine more high-level semantic information for complex and changing scenes. Compared with traditional image processing methods, deep learning methods can obtain the intrinsic rules and representation levels of sample data by learning a large amount of sample data [5] to discover the feature information in image data.
Target detection methods based on deep learning can be further divided into one-stage methods and two-stage methods. The one-stage methods, such as the single-shot multi-box detector (SSD) [6] and You Only Look Once (YOLO) series [7–12], omit the stage of candidate region generation and directly obtain the information about target classification and location. The SSD uses Visual Geometry Group (VGG) [13] as the baseline network, adding five convolutional layers to extract feature maps of different scales. Then, multiple prior boxes of different sizes are set on the extracted feature maps for detection and regression. Each detector in the YOLO series consists of the backbone network, the neck, and the detection head. There are many one-stage methods for UAV autonomous inspection in distribution lines. By using ResNet instead of VGG and adding a self-attention mechanism, Dai et al. [14] adopted an improved SSD method, which could effectively identify the rusted area of the equipment. However, in the ResNet backbone network down-sampling process, small target features might be lost, and the self-attention mechanism requires a large amount of data to establish the global relationship. Based on YOLOv3, Chen et al. [15] adopted a method combined with Squeeze-and-Excitation Networks (SENet) for the recognition of U-ring nuts of high-voltage insulators. This method could be used to improve the accuracy of small target recognition, but SENet only considered channel information and ignored spatial location information. Liu et al. [16] adopted an improved YOLOv4 algorithm for hidden trouble warnings of transmission lines. By using the K-means clustering algorithm and Intersection over Union (IoU) loss function to determine the anchor boxes, the detection accuracy of small targets with hidden dangers on transmission lines was improved, but the deep and shallow features were not fully used. For the detection of insulator defects on overhead transmission lines, based on YOLOv5, Huang et al. [17] designed a receptive field module to replace the Spatial Pyramid Pooling (SPP) module to extract feature information and used the lightweight module of GhostNet to build a backbone network to reduce the amount of network computation. The two-stage methods, like Faster Region-based Convolutional Neural Network (Faster RCNN) [18], first select the candidate regions on the input image that may contain the detection targets and then classify the candidate regions and regress their positions to obtain the detection results. Ni et al. [19] adopted Faster RCNN to detect some defects in transmission lines, used Inception-ResNetv2 as the backbone network for feature extraction, and adjusted and optimized the convolution kernel size to improve the detection accuracy. However, the Parameters and Floating Point Operations (FLOPs) of this method were large, which would hardly meet the real-time requirement of UAV autonomous inspection. Compared with the one-stage methods, the two-stage methods can usually achieve higher accuracy, while the one-stage methods have an obvious advantage in detection efficiency.
The above methods were always applied to object detection on single-category equipment or defects of distribution lines. However, in the process of UAV autonomous inspection, multiple types of equipment are often detected. Liu et al. [20] detected several key components of transmission lines based on YOLOv3 but did not optimize the method, resulting in poor detection accuracy on small-sized components like bird nests and damper defects. Zhang [21] used the two-stage method Faster RCNN combined with multiple attention modules to improve the detection accuracy of multi-target. However, the Parameters and FLOPs of the network were not considered, resulting in poor real-time detection. There is still a large improvement room for the accuracy, real-time, and stability of power equipment detection in distribution lines, because of the complex backgrounds, multiple categories, and small size.
To solve the above problems, this paper uses the improved one-stage method YOLOx-s to propose a multi-equipment detection method for distribution lines, which can be mounted on the UAV platform for real-time detection. Based on YOLOx-s, the proposed method firstly adds the Receptive Field Block (RFB-s) module in the shallow feature extraction part of the backbone network to expand the network receptive field, which aims to improve the detection accuracy of small-sized equipment. Then, three Coordinate Attention (CA) modules are added to make the network better obtain the target spatial direction information. The Adaptively Spatial Feature Fusion (ASFF) module is added to secondary fuse the feature layer in the feature fusion part of the Path Aggregation Network (PANet) [22] so that the shallow and deep features are fully fused. Finally, aiming at the imbalance problem between positive and negative samples, the loss function is replaced with Focal Loss to alleviate the problem of difficult convergence of network training.
2 Multi-Equipment Detection Method for Distribution Lines
The YOLOx-s [12] network consists of three parts. The part of the backbone network is Cross Stage Partial Darknet (CSPDarknet), which contains the Focus module, CBS layer, Cross Stage Partial (CSP) layer, and SPP layer. The Focus module performs down-sampling and slicing operations. The CBS layer consists of Convolution (Conv), Batch Normalization (BN), and Sigmoid Linear Unit (SiLU). The CSP layer is designed to optimize the computational efficiency of the network and enhance the performance of gradient transfer. The SPP layer expands the receptive field of the network by Max Pooling and convolution. The part of the neck uses the PANet or Feature Pyramid Network (FPN) as the network for feature fusion. The part of the detection head adopts a Decoupled Head. It assigns the classification task and location task of target detection to two different branches, which improves the detection accuracy and convergence speed.
In the YOLOx-s network, the data augmentation strategy combining Mosaic [23] and Mixup is used. The dynamic sample matching technology of Simplified Optimal Transport Assignment (SimOTA) [24] is added in an innovative way to match positive samples for the targets of different scales. The dynamic Top-k strategy is used to calculate the optimal transmission to reduce the network training time. The anchor-free target detector is used to reduce the network parameters and accelerate the detection speed because it does not need to cluster the candidate boxes.
This paper makes the following improvements based on the original network YOLOx-s: (1) The RFB-s module is added after the shallow feature layer CSP1_3, and the dilated convolution layer is introduced to expand the receptive field. (2) The CA module is added after CSP1_3 and CSP2_1 of the backbone network to better obtain the target spatial direction information. (3) The three feature maps P3, P4, and P5 are fused for the first time to output three feature maps P3_out, P4_out, and P5_out with different scales, and then the ASFF module is added for the second fusing to generate the final fused feature maps. (4) Aiming at the imbalance problem between positive and negative samples, the loss function is replaced with Focal Loss. The details of the improvements of the YOLOx-s network are shown in Fig. 1, and the improvements will be introduced in detail in the following subsections.
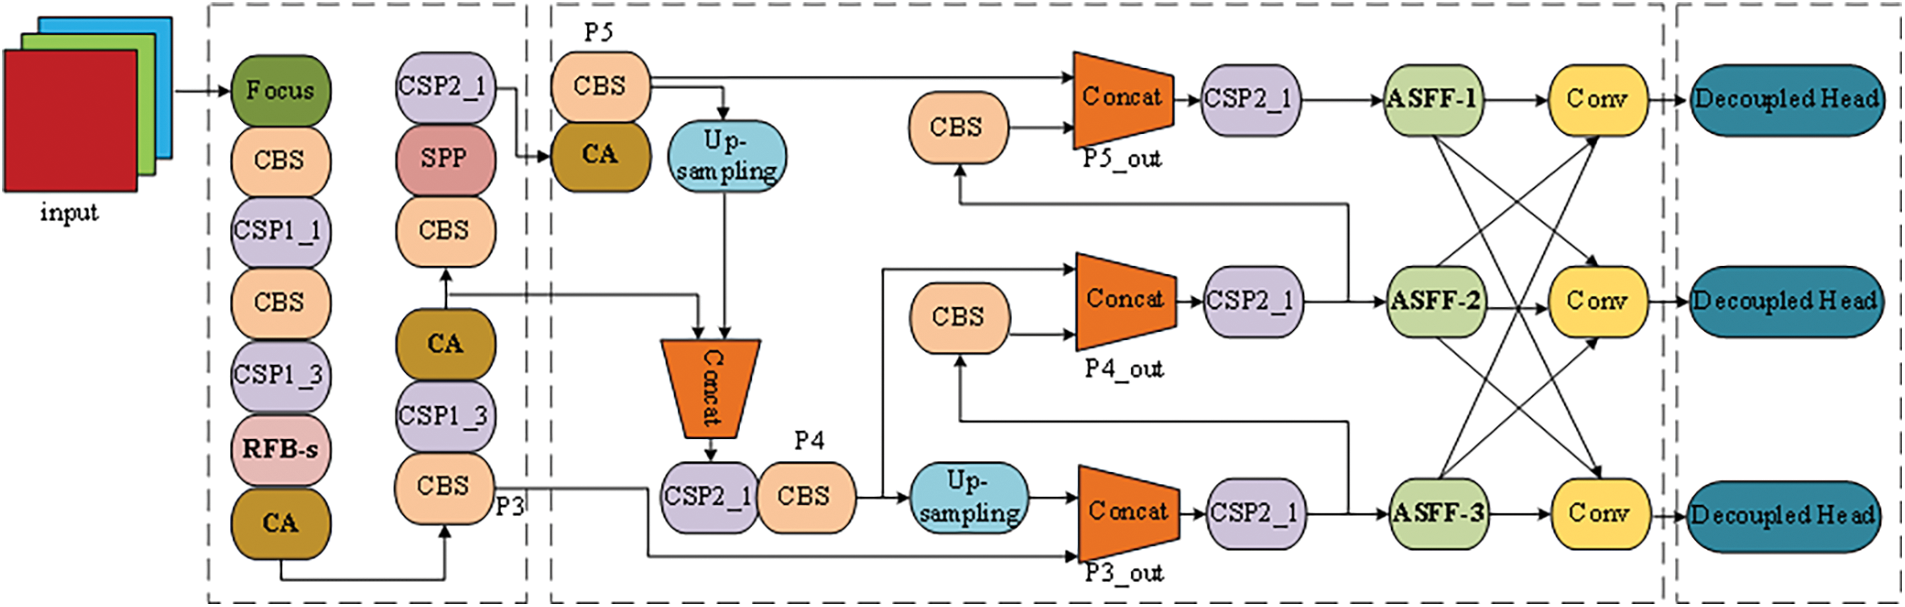
Figure 1: Multi-equipment detection network for distribution lines based on improved YOLOx-s
2.2 Receptive Field Block (RFB-s) Module
Because small-sized targets occupy fewer pixels in the image, their limited detail information is easy to lose and difficult to extract with the down-sampling operation in the backbone network, resulting in low detection accuracy of small-sized targets. The RFB-s module [25] uses the idea of dilated convolution and refers to the Inception network structure [26]. Based on the structure of human visual Receptive Fields (RFs), the RFB-s module uses dilated convolution kernels with multiple sizes and multiple eccentricities to construct a multi-branch structure. Among them, the high eccentricity branch can extend the context semantic information for the low eccentricity branch, and the low eccentricity branch can compensate for the loss of detail information caused by the convolution kernel diffusion of the high eccentricity branch.
As shown in Fig. 2, this paper uses the RFB-s module to expand the network receptive field. The RFB-s module uses convolution layers with different-sized kernels to extract features of different-sized targets in the images in parallel. RFB-s module is composed of four branches. The first branch consists of 1 × 1 convolution and 3 × 3 dilated convolution with a dilation rate of 1. The second branch is divided into two branches, which consist of 1 × 1 convolution, 1 × 3 convolution, 3 × 3 dilated convolution with a dilation rate of 3 and 1 × 1 convolution, 3 × 1 convolution, 3 × 3 dilated convolution with a dilation rate of 3, respectively. The third branch consists of 1 × 1 convolution, 3 × 3 convolution, and 3 × 3 dilated convolution with a dilation rate of 5. The fourth branch is a shortcut connection that maps the input directly to the output. For the input feature map of the previous layer, the first three branches are firstly processed with convolution kernels of different sizes, and then the dilated convolution kernels with different eccentricities are used to obtain the feature maps of different receptive fields, and finally, the output feature maps of the three branches are concatenated and fused by 1 × 1 convolution to obtain an enhanced feature map. This enhanced feature map is added element-by-element with the output of the last branch, and then the Rectified Linear Unit (ReLU) activation function is used to obtain the final output of the RFB-s module.
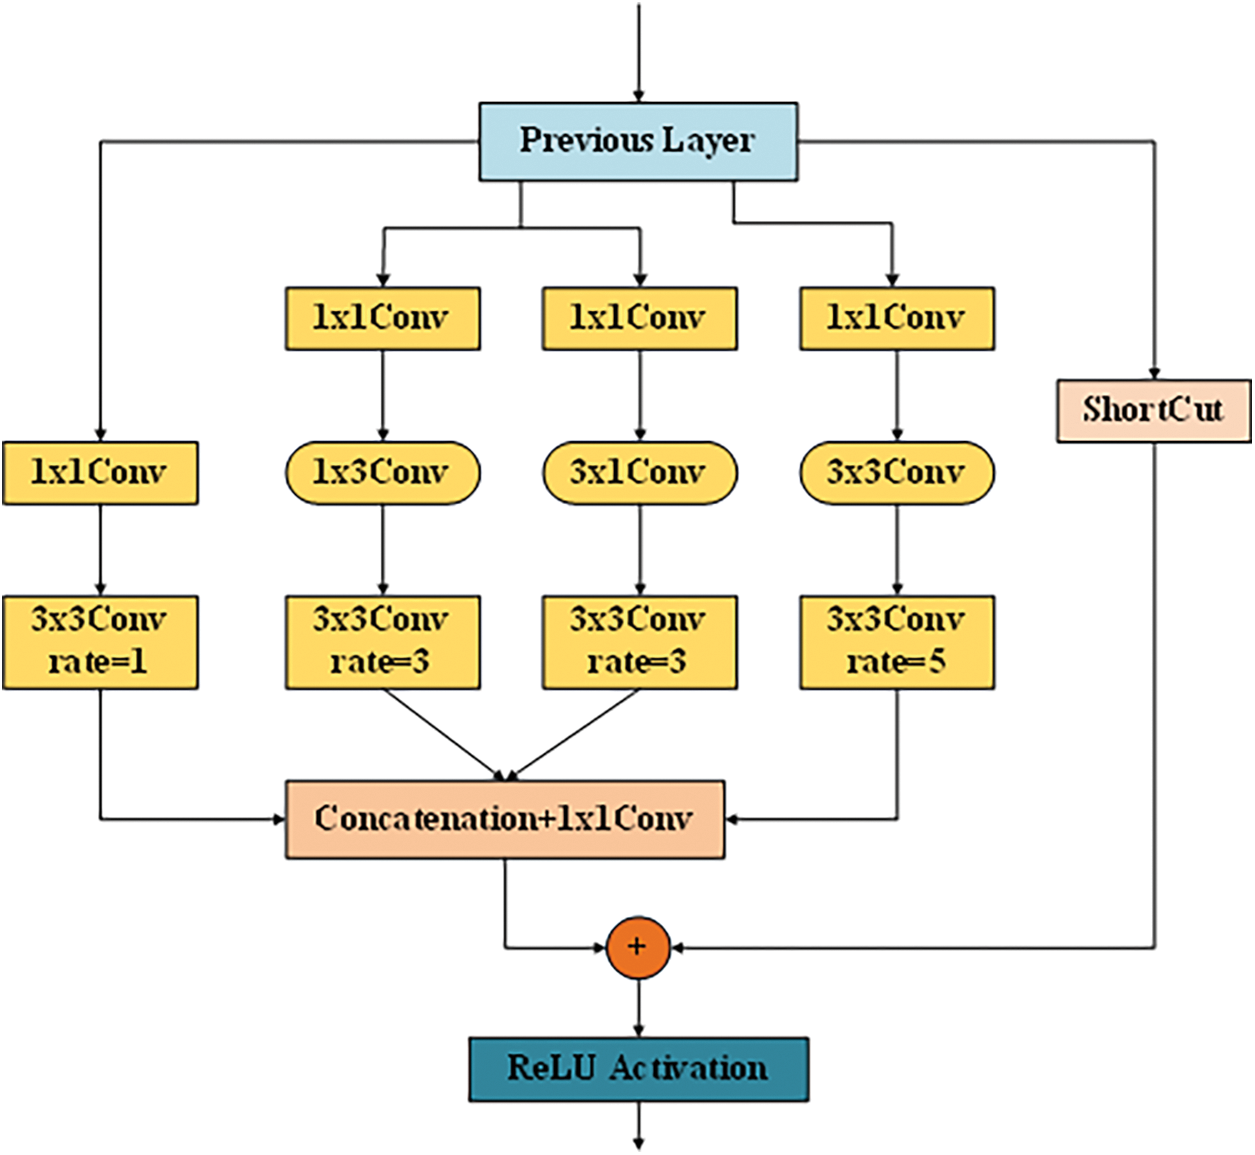
Figure 2: Receptive Field Block (RFB-s) module structure
2.3 Coordinate Attention (CA) Module
In the CA module [27], the location information is embedded into the channel features, so that the network can better obtain the spatial direction information of multiple type targets and make the detection and location of multiple types of equipment more accurate. As shown in Fig. 3, the CA module adopts a residual structure. The input feature map
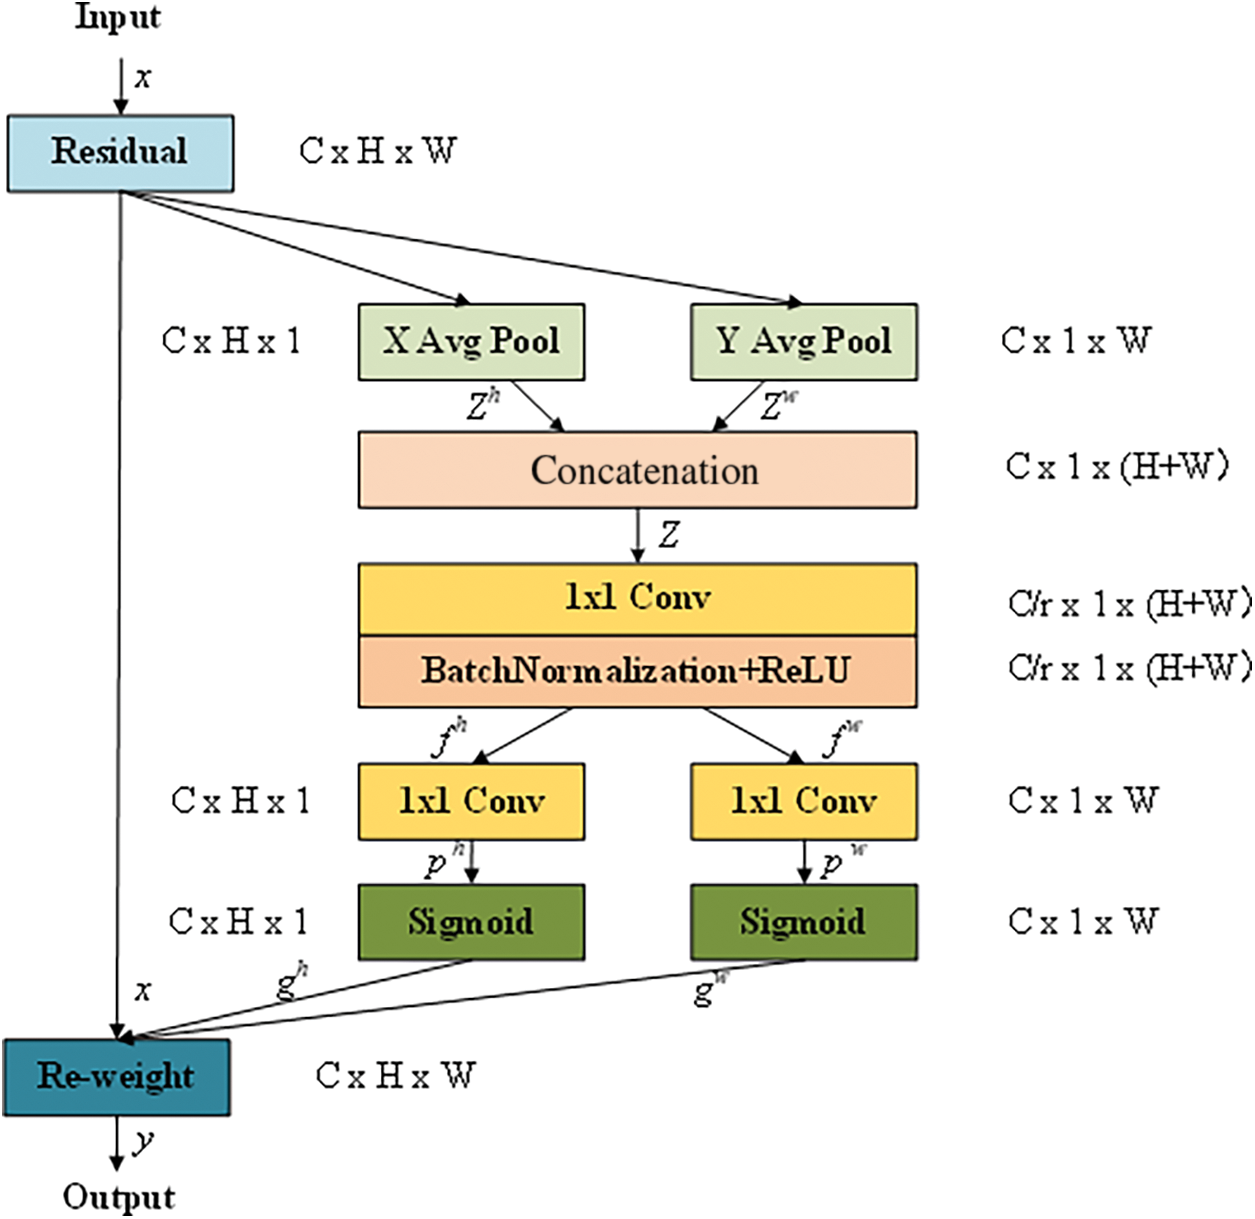
Figure 3: Coordinate Attention (CA) module structure
Coordinate information embedding: All channels of the input feature map (C × H × W) are averaged pooling along the horizontal and vertical directions, to obtain feature maps
Coordinate attention generation: The generated feature maps
where
The obtained intermediate feature map
where
Finally, the output feature maps
2.4 Improved Path Aggregation Network (PANet) Structure
The necks of the YOLO series networks use the PANet structure, which performs feature fusion of three feature maps of different scales. In feature fusion, the feature maps are directly converted to the same scale by up-down sampling and then concatenated, which cannot make full use of features of different scales. The ASFF module [28] enables the network to learn how to filter features of other levels in space, and only keeps the critical feature information for fusion, so that the shallow and deep features can be fully fused, reducing the loss of target feature information caused by multiple down-sampling.
In this paper, the ASFF module is added to the PANet structure, as shown in Fig. 4. After the fusion of YOLOx-s neck features, the feature maps Level 1, Level 2, and Level 3 of three different scales are obtained, in Fig. 1, they are the outputs of CSP2_1 with the inputs of P3_out, P4_out, and P5_out. The three feature maps Level 1, Level 2, and Level 3 are ordered by scale from small to large, the larger the scale, the smaller the number of channels. We add ASFF-1, ASFF-2, and ASFF-3 to fuse the three feature maps of different scales. ASFF-3 is taken as an example. The channel number of Level 1 is adjusted to be consistent with Level 3 by 1 × 1 convolution, and the scale of Level 1 is adjusted to the same scale as Level 3 with interpolation, then
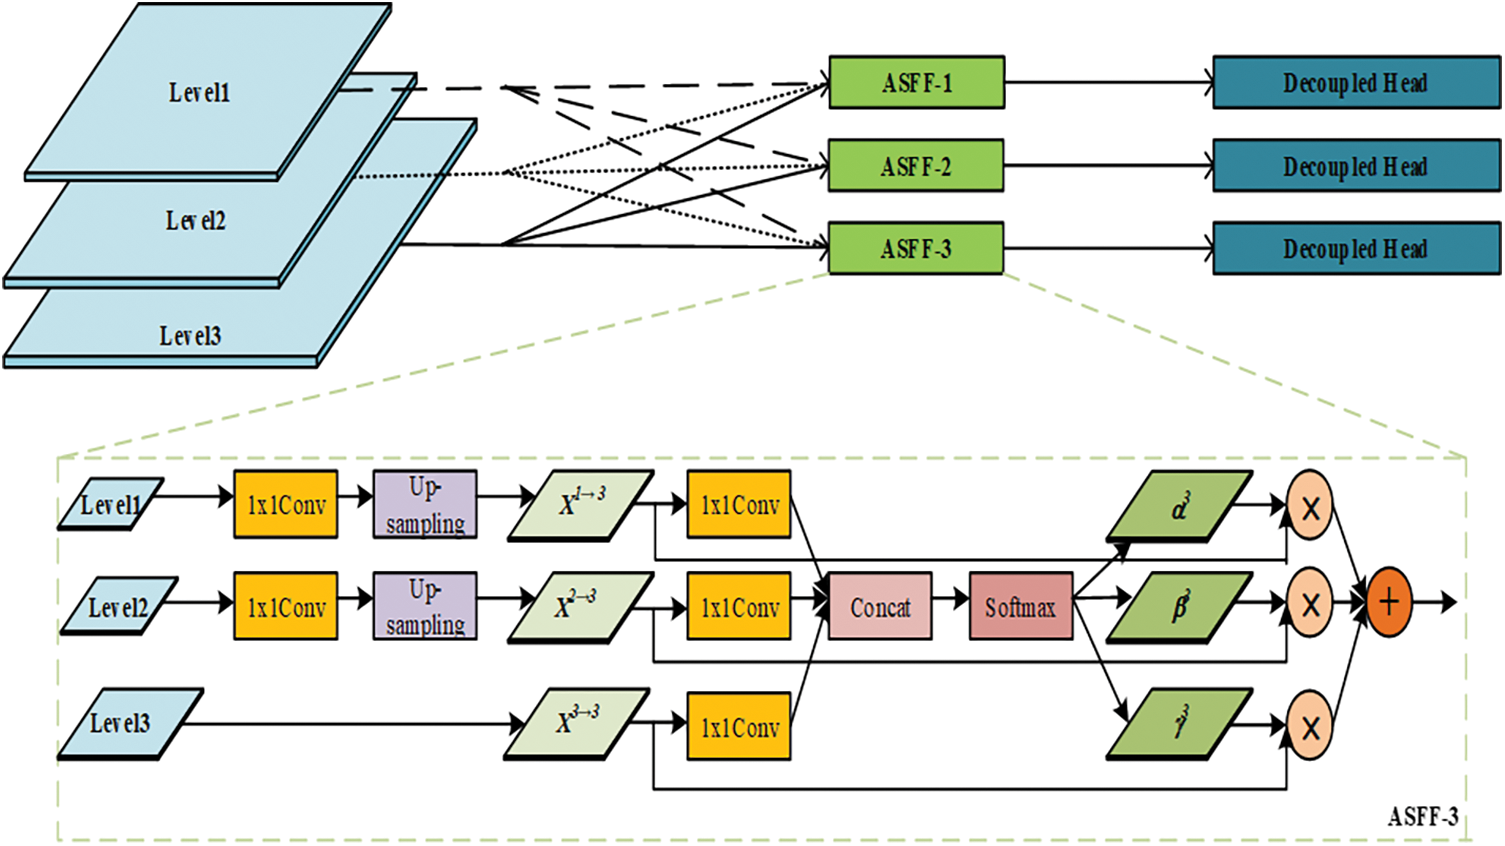
Figure 4: Adaptively Spatial Feature Fusion (ASFF) module structure
where
The target area occupies a small proportion of the whole picture, and the positive and negative samples are unbalanced, which makes the network training process difficult to converge and makes the network performance unstable. The parameters
where
3 Experimental Results and Analysis
In this paper, we use the private dataset of distribution lines from the State Grid Jiangxi Electric Power Research Institute of China. The dataset contains about 8,000 high-definition images collected by the UAV during the autonomous inspection of the distribution lines. The image size is mainly 2,736 × 1,824 px. The types of power equipment involved in the dataset, such as Transformers, Isolators, Drop Fuses, and Lightning Arrestors, are labeled. There are about 1,500 pieces of each type. Among them, the size of the Transformers is large, and the proportion of the size in the original image is about one-tenth. The size of the three types of Isolators, Drop Fuses, and Lightning Arrestors is small, and the proportion of the size in the original image is less than about one percent. In the experiment, the ratio of the training set and test set is 8:2. As shown in Fig. 5, typical power equipment samples in the dataset are shown. Due to the change of angle, scene, and distance of the images taken by the UAV, each type of power equipment presents different shapes.
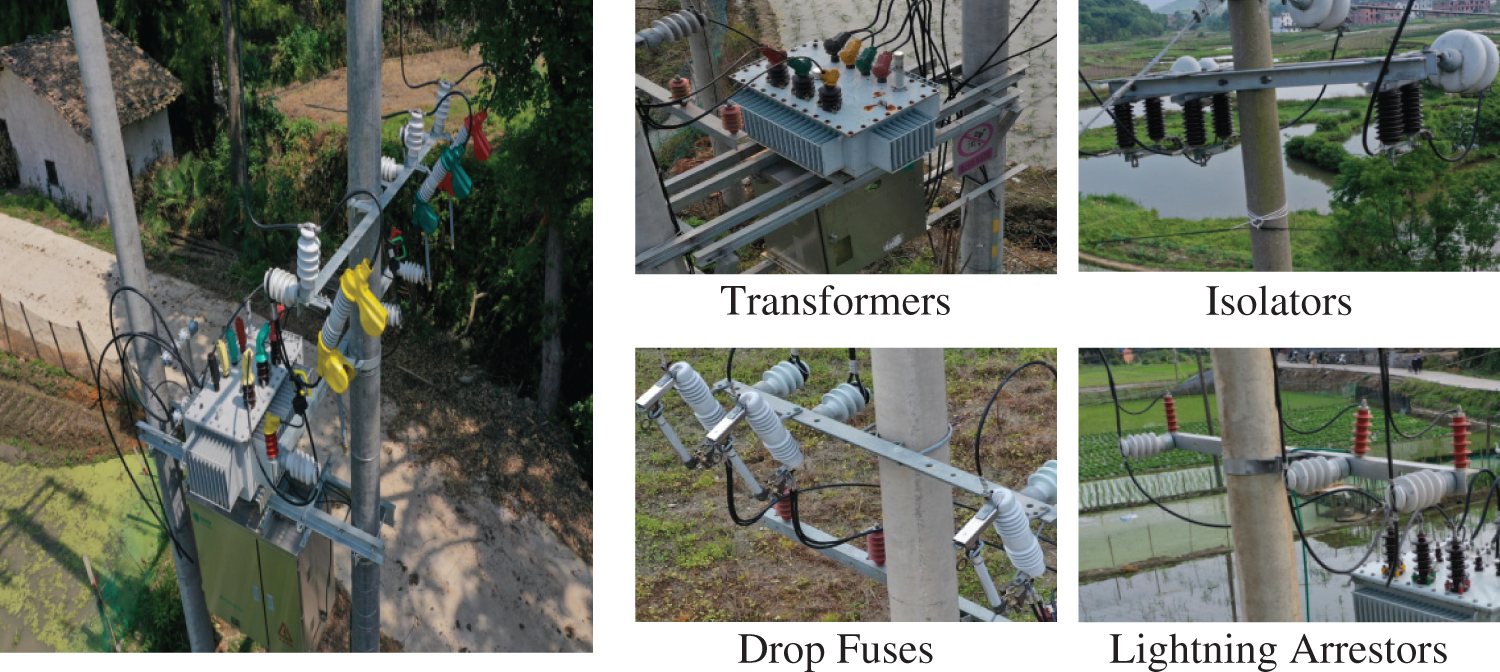
Figure 5: Power distribution line dataset
3.2 Experimental Environment Setting
In this paper, the deep learning PyTorch framework is used. The experimental platform is Windows10 operating system, the CPU is Intel(R)Core(TM) i5-10400F @2.90 GHz, the memory capacity is 32 GB, and the GPU is a single NVIDIA GeForce GTX 1080Ti.
3.3 Training Parameter Setting
During the experiment, the network training batch is 300. Limited by the performance of the GPU, the two-stage mode training is used. In the first stage, the network is trained for 150 batches on the premise of freezing the backbone network. During this stage, because the backbone network is frozen, the feature extraction network is not changed, and only the network is fine-tuned, which occupies less GPU memory. In the second stage, the backbone network is unfrozen, and the network is trained again for 150 batches. During this stage, the feature extraction network changes, which occupies a large amount of GPU memory, and all the parameters of the network are changed. Network freezing training can improve training efficiency and protect the weight of the network.
In this paper, the experimental training parameters are set as follows: the input size of the training images is 640 × 640, the initial learning rate is 0.0001, the learning rate is adjusted by Cosine Annealing, and the Batch Size is 4.
3.4 Experimental Results and Analysis
In this paper, Precision (P), Recall (R), mean Average Precision (mAP), and F1-Score (F1) are used as evaluation indicators to verify the effectiveness of the proposed method. Among them, Precision is the accuracy rate, and Recall is the recall rate.
where
To better evaluate the effectiveness of the proposed method on multi-equipment detection of distribution lines, the classical target detection methods are trained and tested on the same dataset in the experimental stage.
Table 1 shows the performance comparison between the proposed method and other classical target detection methods. In terms of

Table 1 shows that the average performance indicator of YOLOx-s is better than the other classical methods, so the proposed method is only compared with YOLOx-s in Tables 2 and 3.


Table 2 shows the performance indicators between the proposed method and YOLOx-s on multi-type equipment image detection. The
Table 2 shows that the performance indicators of the proposed method are significantly better than that of the baseline network YOLOx-s for multi-type equipment detection in distribution lines. There, the effect of adding different modules to YOLOx-s on
As shown in Table 3, after adding the RFB-s module to the backbone network, the
This paper selects typical scenes with complex backgrounds, multi-type equipment, and occluded targets for testing and verification. Key equipment types in the scenes include Transformers, Isolators, Drop Fuses, and Lightning Arrestors.
As shown in Fig. 6, the images contain multi-type equipment with a different number of targets, and partial equipment is occluded. Among them, Faster RCNN has a poor detection effect, and there is false detection of the Transformers and missed detection of the Lightning Arrestors. SSD has missed detection, and the occluded Drop Fuses are not detected. YOLOv5s and YOLOx-s have no missed detection and false detection, and the occluded Drop Fuses can also be detected. And the confidence of the detection results of YOLOx-s is relatively higher than that of YOLOv5s. The proposed method has no missed detection and false detection, and the detection confidence is overall high in the five groups of comparative experiments. In general, the detection effect of the proposed method is the best.
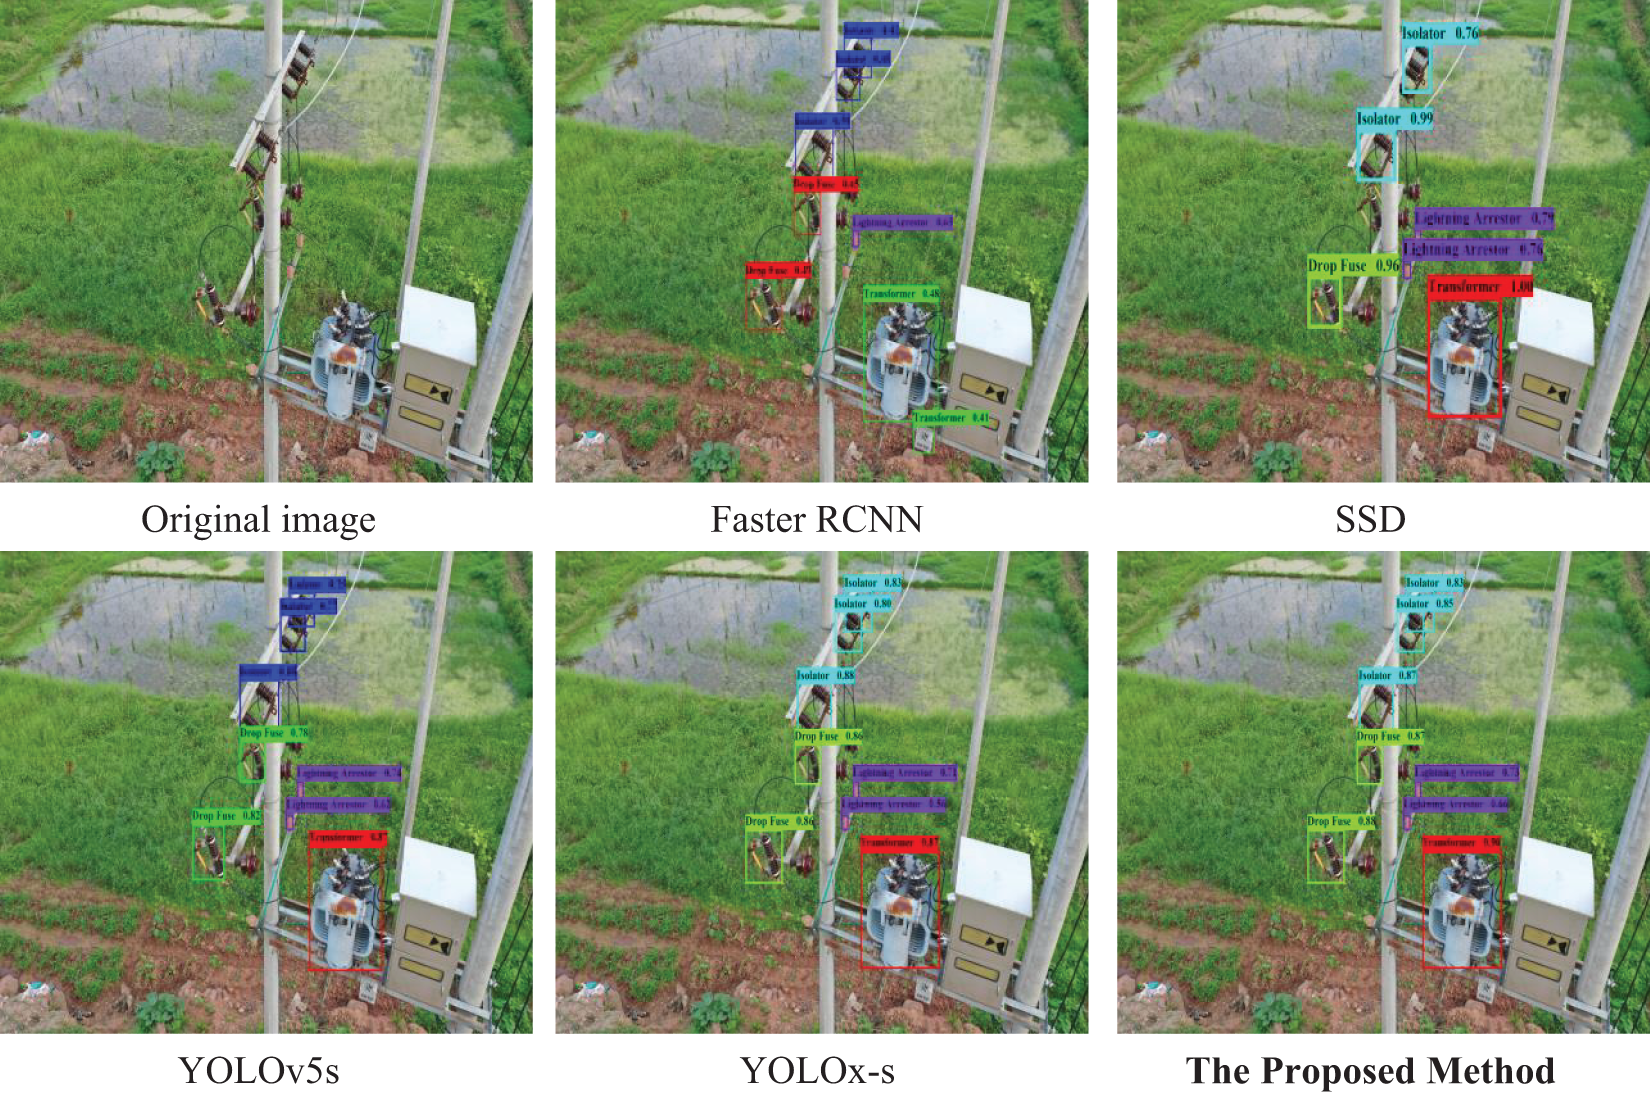
Figure 6: Side-shot equipment detection results
As shown in Fig. 7, the long-distance shooting targets are disturbed by background information and occluded by obstacles, resulting in less obvious target features. The small-sized targets occupy a small number of pixels in the image, which increases the difficulty of detection. Among them, for Faster RCNN, only the large-sized equipment Transformers can fully be detected in the images taken from a long distance, while part of small-sized equipment such as Drop Fuses, Lightning Arrestors, and Isolators cannot be detected, and the detection confidence is low, so the detection effect is not good. SSD has missed detection, and all four types of equipment have missed detection. So the detection effect is poor. YOLOv5s has false detection of Drop Fuses, Isolators, and missed detection of two rear Isolators. The detection effect of YOLOx-s is good. The equipment that is not detected by the previous methods is detected, and there is no missed detection or false detection. The proposed method has no missed detection and false detection, and the detection confidence is overall high in the five groups of comparative experiments. In general, the detection effect of the proposed method is the best.
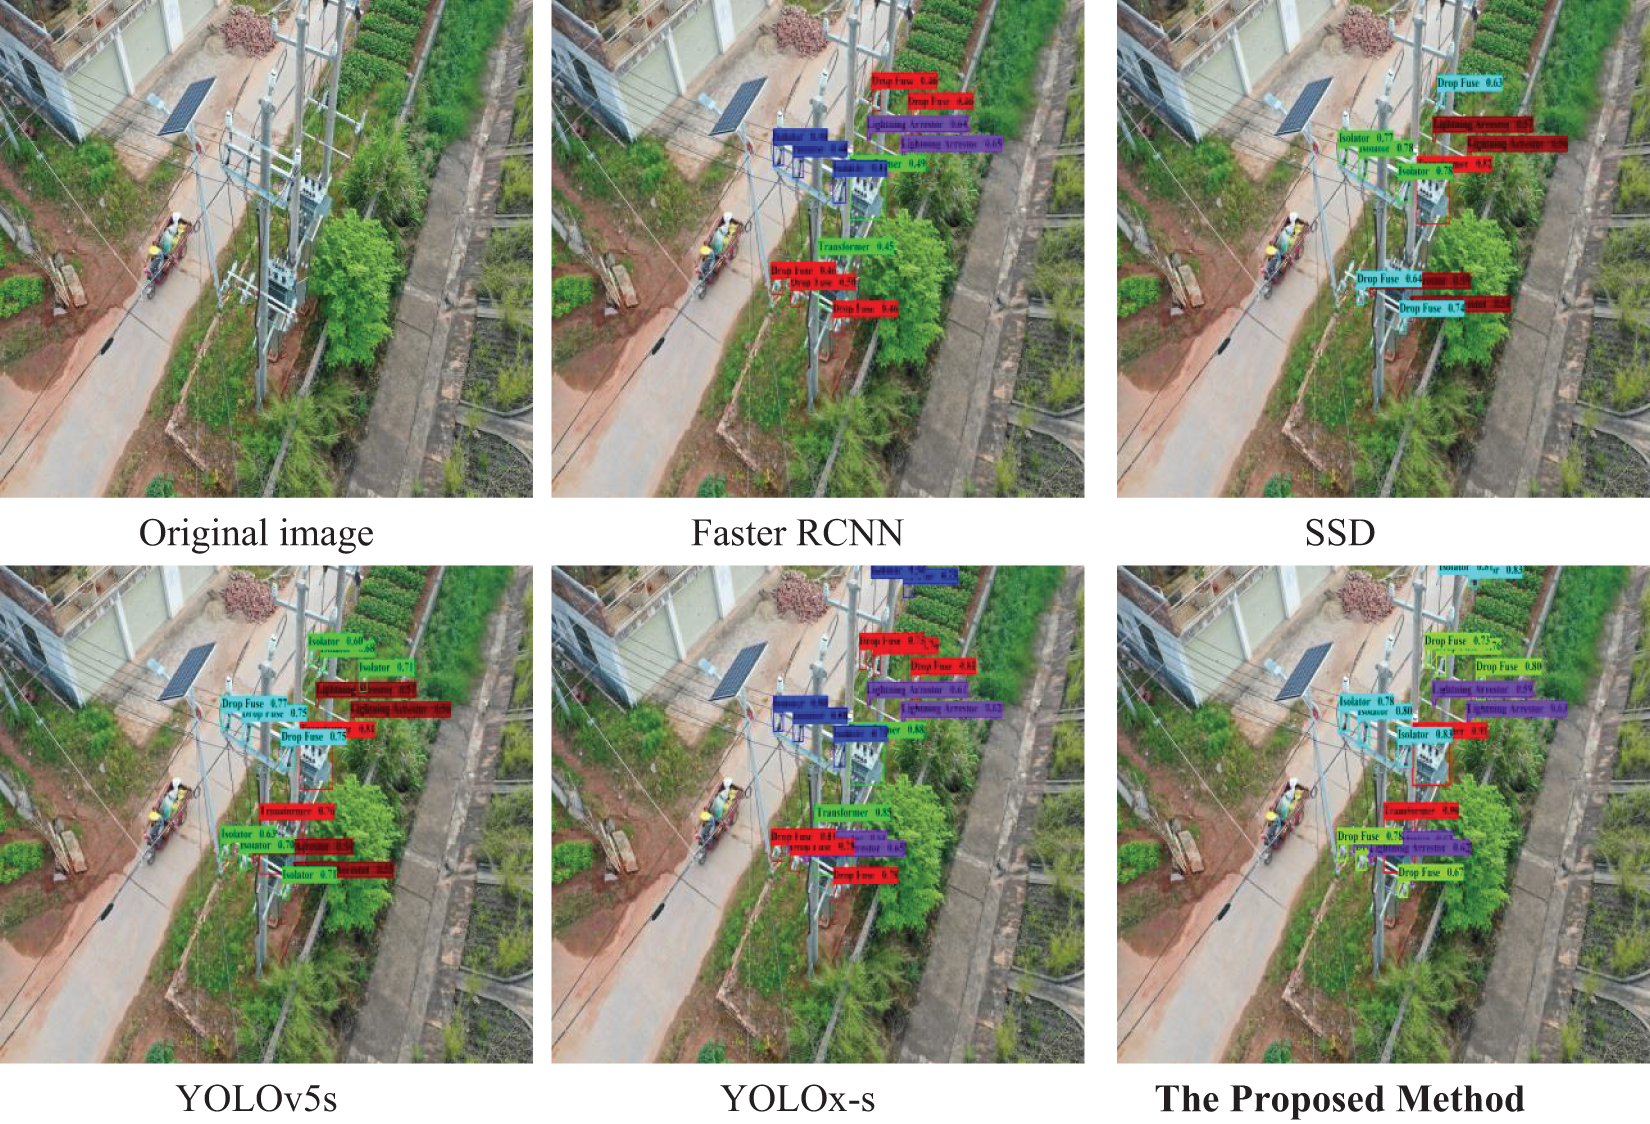
Figure 7: Long-distance shooting equipment detection results
(1) Compared with other target detection methods, YOLOx-s has higher detection accuracy and detection efficiency. According to the results in Table 1, YOLOx-s is superior to other target detection methods. Therefore, the proposed method uses YOLOx-s as the baseline network. According to the results in Tables 2 and 3, the proposed method has a significant improvement in the four types of power equipment. However, due to the addition of the RFB-s module, the CA module, and other modules, the Parameters, FLOPs, and Latency of the proposed method are increased by about 40%.
(2) In Figs. 6 and 7, the detection accuracy of the proposed method is better than that of other target detection methods on the images with different shooting angles and distances, which reflects the robustness of the proposed method. However, the proposed method still has some limitations, such as the confidence of the small-sized targets is not very high.
(3) Although the proposed method needs to be further optimized, compared with YOLOx-s, the mAP of the proposed method on the power equipment detection of distribution lines is increased to 93.64%, an increase of 3.27%. In summary, the proposed multi-equipment detection method for distribution lines based on our improved YOLOx-s can better realize the multi-equipment detection of UAV autonomous inspection in distribution lines, and the method has good accuracy and stability.
In the images of UAV autonomous inspection in distribution lines, due to the complex backgrounds, various shapes, and different sizes of the power equipment, most target detection methods are prone to miss detection and false detection. This paper proposes a multi-equipment detection method for UAV autonomous inspection in distribution lines based on improved YOLOx-s, which uses the advantages of the RFB-s module, the CA module, the ASFF module, and the Focal Loss function to improve the detection accuracy. Through the analysis of experimental results, the proposed method has the advantages of higher detection accuracy, better recall rate, fewer missed detections, and fewer false detections, which can provide theoretical reference value and practical application prospects for the multi-equipment detection of distribution lines based on UAV automatic inspection.
Although the proposed method has a good effect on the power equipment detection of distribution lines, further research is needed. The used dataset has fewer types of power equipment. In the future, our method will detect more types of power equipment more accurately and faster. In the process of UAV image shooting, due to the influence of environment, shooting angle, and other factors, targets will overlap and polymorphic, resulting in missed detection and false detection of power equipment, which still needs further research.
Acknowledgement: Not applicable.
Funding Statement: This project is supported by the National Natural Science Foundation of China under Grants 62362040 and 61662033. This project is supported by the Science and Technology Project of the State Grid Jiangxi Electric Power Co., Ltd. of China under Grant 521820210006.
Author Contributions: Study conception and design: Lei Hu and Yuanwen Lu; data collection: Wenbin Wang; analysis and interpretation of results: Lei Hu, Yuanwen Lu and Si Wang; draft manuscript preparation: Yuanwen Lu, Si Wang and Lei Hu; manuscript revision: Lei Hu, Yongmei Zhang, Yuanwen Lu and Si Wang. All authors reviewed the results and approved the final version of the manuscript.
Availability of Data and Materials: This study uses the private dataset of distribution lines from the State Grid Jiangxi Electric Power Research Institute of China. The authors do not have permission to share the data.
Conflicts of Interest: The authors declare no conflicts of interest to report regarding the present study.
References
1. Y. H. Luo, X. C. Yu, D. S. Yang and B. W. Zhou, “A survey of intelligent transmission line inspection based on unmanned aerial vehicle,” Artificial Intelligence Review, vol. 56, pp. 173–201, 2023. [Google Scholar]
2. Q. W. Du, W. Z. Dong, W. Su and Q. Wang, “UAV inspection technology and application of transmission line,” in 2022 IEEE 5th Int. Conf. on Information Systems and Computer Aided Education (ICISCAE), Dalian, China, pp. 594–597, 2022. [Google Scholar]
3. V. N. Nguyen, R. Jenssen and D. Roverso, “Automatic autonomous vision-based power line inspection: A review of current status and the potential role of deep learning,” International Journal of Electrical Power & Energy Systems, vol. 99, pp. 107–120, 2018. [Google Scholar]
4. B. Y. Xu, Y. L. Zhao, T. Wang and Q. N. Chen, “Development of power transmission line detection technology based on unmanned aerial vehicle image vision,” SN Applied Sciences, vol. 5, pp. 1–15, 2023. [Google Scholar]
5. L. C. Jiao, F. Zhang, F. Liu, S. Y. Yang, L. L. Li et al., “A survey of deep learning-based object detection,” IEEE Access, vol. 7, pp. 128837–128868, 2019. [Google Scholar]
6. W. Liu, D. Anguelov, D. Erthan, C. Szegedy, S. Reed et al., “SSD: Single shot multibox detector,” in Proc. of the European Conf. on Computer Vision, Amsterdam, Netherlands, pp. 21–37, 2016. [Google Scholar]
7. J. Redmon, S. Divvala, R. Girshick and A. Farhadi, “You only look once: Unified, real-time object detection,” in IEEE Conf. on Computer Vision and Pattern Recognition, Las Vegas, NV, USA, pp. 779–788, 2016. [Google Scholar]
8. J. Redmon and A. Farhadi, “YOLO9000: Better, faster, stronger,” in IEEE Conf. on Computer Vision and Pattern Recognition, Honolulu, HI, USA, pp. 6517–6525, 2017. [Google Scholar]
9. J. Redmon and A. Farhadi, “YOLOv3: An incremental improvement,” arXiv:1804.02767, 2018. [Google Scholar]
10. A. Bochkovskiy, C. Y. Wang and H. Y. M. Liao, “YOLOv4: Optimal speed and accuracy of object detection,” arXiv:2004.10934, 2020. [Google Scholar]
11. G. Jocher, “YOLOv5,” 2020. [Online]. Available: https://github.com/ultralytics/yolov5 (accessed on 06/10/2020). [Google Scholar]
12. Z. Ge, S. T. Liu, F. Wang, Z. M. Li and J. Sun, “YOLOX: Exceeding YOLO series in 2021,” arXiv:2107.08430, 2021. [Google Scholar]
13. K. Simonyan and A. Zisserman, “Very deep convolutional networks for large-scale image recognition,” arXiv:1409.1556, 2014. [Google Scholar]
14. Y. Dai, R. Han, L. Liu, X. W. Jiang, S. F. Qian et al., “Research on substation equipment rust detection method based on improved SSD,” in 2021 Int. Conf. on Advanced Electrical Equipment and Reliable Operation, Beijing, China, pp. 1–3, 2021. [Google Scholar]
15. Q. Chen, L. Liu, Q. Han, J. Y. Qian and D. L. Qi, “Image identification method on high speed railway contact network based on YOLOv3 and SENet,” in 2019 Chinese Control Conf., Chengdu, Sichuan, China, pp. 8772–8777, 2019. [Google Scholar]
16. X. J. Liu, X. Gao, L. Hu, Z. Wang, N. Chen et al., “Research on early warning of transmission line hidden trouble based on improved YOLOv4 algorithm,” in 2022 IEEE 6th Information Technology and Mechatronics Engineering Conf., Chongqing, China, pp. 2001–2005, 2022. [Google Scholar]
17. Y. R. Huang, L. Y. Jiang, T. Han, S. Y. Xu, Y. W. Liu et al., “High-accuracy insulator defect detection for overhead transmission lines based on improved YOLOv5,” Applied Sciences, vol. 12, no. 24, pp. 12682, 2022. [Google Scholar]
18. S. Q. Ren, K. M. He, R. Girshick and J. Sun, “Faster R-CNN: Towards real-time object detection with region proposal networks,” IEEE Transactions on Pattern Analysis & Machine Intelligence, vol. 39, no. 6, pp. 1137–1149, 2017. [Google Scholar]
19. H. X. Ni, M. Z. Wang and L. Y. Zhao, “An improved faster R-CNN for defect recognition of key components of transmission line,” Mathematical Biosciences and Engineering, vol. 18, no. 4, pp. 4679–4695, 2021. [Google Scholar] [PubMed]
20. S. Liu, F. Shang, Y. Lin, X. K. Yu, D. D. Li et al., “A method and implementation of transmission line’s key components and defects identification based on YOLO,” in 2022 IEEE 10th Joint Int. Information Technology and Artificial Intelligence Conf., Chongqing, China, pp. 144–148, 2022. [Google Scholar]
21. K. Zhang, “Faster R-CNN transmission line multi-target detection based on BAM,” in 2022 4th Int. Conf. on Intelligent Control, Measurement and Signal Processing (ICMSP), Hangzhou, China, pp. 364–369, 2022. [Google Scholar]
22. Q. J. Zhao, T. Sheng, Y. T. Wang, Z. Tang, Y. Chen et al., “M2Det: A single-shot object detector based on multi-level feature pyramid network,” in Proc. of the AAAI Conf. on Artificial Intelligence, Honolulu, Hawaii, USA, pp. 9259–9266, 2019. [Google Scholar]
23. H. Y. Zhang, M. Cisse, Y. N. Dauphin and D. Lopez-Paz, “mixup: Beyond empirical risk minimization,” arXiv:1710.09412, 2017. [Google Scholar]
24. Z. Ge, S. T. Liu, Z. M. Li, O. Yoshie and J. Sun, “OTA: Optimal transport assignment for object detection,” in Proc. of the IEEE/CVF Conf. on Computer Vision and Pattern Recognition, Seoul, Korea, pp. 303–312, 2021. [Google Scholar]
25. S. Liu and D. Huang, “Receptive field block net for accurate and fast object detection,” in Proc. of the European Conf. on Computer Vision, Munich, Germany, pp. 385–400, 2018. [Google Scholar]
26. C. Szegedy, W. Liu, Y. Q. Jia, P. Sermanet, S. Reed et al., “Going deeper with convolutions,” in Proc. of the IEEE Conf. on Computer Vision and Pattern Recognition, Boston, USA, pp. 1–9, 2015. [Google Scholar]
27. Q. B. Hou, D. Q. Zhou and J. S. Feng, “Coordinate attention for efficient mobile network design,” in Proc. of the IEEE/CVF Conf. on Computer Vision and Pattern Recognition, New York, USA, pp. 13713–13722, 2019. [Google Scholar]
28. S. T. Liu, D. Huang and Y. H. Wang, “Learning spatial fusion for single-shot object detection,” arXiv:1911.09516, 2019. [Google Scholar]
29. T. Y. Lin, P. Goyal, R. Girshick, K. M. He and P. Dollar, “Focal loss for dense object detection,” in Proc. of the IEEE Int. Conf. on Computer Vision, Venice, Italy, pp. 2980–2988, 2017. [Google Scholar]
Cite This Article
 Copyright © 2023 The Author(s). Published by Tech Science Press.
This work is licensed under a Creative Commons Attribution 4.0 International License , which permits unrestricted use, distribution, and reproduction in any medium, provided the original work is properly cited.
 Downloads
 Citation Tools