
 Submit a Paper
 Propose a Special lssue
 Open Access
ARTICLE

An Intelligent Detection Method for Optical Remote Sensing Images Based on Improved YOLOv7
School of Automation, Xi’an University of Posts and Telecommunications, Xi’an, 710121, China
* Corresponding Author: Xiangkui Jiang. Email:
(This article belongs to the Special Issue: Machine Vision Detection and Intelligent Recognition)
Computers, Materials & Continua 2023, 77(3), 3015-3036. https://doi.org/10.32604/cmc.2023.044735
Received 07 August 2023; Accepted 24 October 2023; Issue published 26 December 2023
 View Full Text
 Download PDF
Abstract
To address the issue of imbalanced detection performance and detection speed in current mainstream object detection algorithms for optical remote sensing images, this paper proposes a multi-scale object detection model for remote sensing images on complex backgrounds, called DI-YOLO, based on You Only Look Once v7-tiny (YOLOv7-tiny). Firstly, to enhance the model’s ability to capture irregular-shaped objects and deformation features, as well as to extract high-level semantic information, deformable convolutions are used to replace standard convolutions in the original model. Secondly, a Content Coordination Attention Feature Pyramid Network (CCA-FPN) structure is designed to replace the Neck part of the original model, which can further perceive relationships between different pixels, reduce feature loss in remote sensing images, and improve the overall model’s ability to detect multi-scale objects. Thirdly, an Implicitly Efficient Decoupled Head (IEDH) is proposed to increase the model's flexibility, making it more adaptable to complex detection tasks in various scenarios. Finally, the Smoothed Intersection over Union (SIoU) loss function replaces the Complete Intersection over Union (CIoU) loss function in the original model, resulting in more accurate prediction of bounding boxes and continuous model optimization. Experimental results on the High-Resolution Remote Sensing Detection (HRRSD) dataset demonstrate that the proposed DI-YOLO model outperforms mainstream target detection algorithms in terms of mean Average Precision (mAP) for optical remote sensing image detection. Furthermore, it achieves Frames Per Second (FPS) of 138.9, meeting fast and accurate detection requirements.Keywords
The detection of objects in optical remote sensing images has become a hot research topic in the field of remote sensing, which is widely used in agriculture, the ocean, the military, and other fields [1–3]. However, optical remote sensing images are characterized by a wide image field, large differences in the scales of objects in the image, and intricate backgrounds [4], which leads to a serious impact on detection performance. As artificial intelligence technology continues to develop, it is necessary to design an accurate and fast method to meet actual detection needs.
Traditional image processing algorithms such as Haar-like Feature Classifier (Haar-like) [5], Histogram of Oriented Gradients (HOG) [6], and Deformable Part-based Model (DPM) [7] are used in the field of object detection. Yao et al. [8] proposed to first use the AdaBoost classifier trained on Haar-like features for coarse detection of ships, and then Line Segment Detector (LSD) to achieve fine detection, which achieves a low false detection rate. Yu et al. [9] proposed a method for vehicle detection. Firstly, the optical remote sensing image is converted into hyperspectral form by using the image conversion technique, and then the AdaBoost algorithm and Haar-like verify whether the candidate vehicle is true or not, to accomplish the detection task. Qi et al. [10] proposed the S-HOG method based on HOG, which solves the problem of HOG being sensitive to direction and unable to detect low-resolution small objects, and the proposed S-HOG method has strong robustness in complex scenes and scenes with large ship transformations. Luo et al. [11] proposed a method based on the object proposal technique using HOG-SVM (Support Vector Machine) classifiers to detect, which has good detection performance while reducing the amount of computation. Qiu et al. [12] proposed an improved model Partial Configuration Model (PCM), which solves the problem of DPM in detecting occluded objects. The problem of performance degradation in detecting remote sensing images with occlusions. Although traditional object detection methods have achieved some success in the field of computer vision, traditional object detection algorithms suffer from the problems of difficulty in extracting image features in complex scenes, high model complexity, and limited generalization ability.
Convolutional Neural Networks (CNN) have introduced a series of object detection methods that have achieved significant detection performance. Arikumar et al. [13] used a convolutional neural network to further process the point cloud data from 3D LiDAR sensors and camera sensors to improve the accuracy of the model in recognizing objects, which significantly improves the environment-sensing ability of self-driving vehicles. With convolutional neural networks, features of an image are automatically extracted using convolutional kernels, in contrast to traditional image processing algorithms. There are two main types of object detection methods currently available: region extraction-based (two-stage) and regression-based (single-stage). It is common for most of these two-stage object detection algorithms to make use of the Region-CNN (R-CNN) [14–16] family, and the single-stage object detection algorithms include the You Only Look Once (YOLO) family of algorithms [17–24] and the Single Shot MultiBox Detector (SSD) family of algorithms [25,26].
Based on YOLOv7-tiny, this paper designs a detection model that can effectively identify remote sensing images under complex backgrounds. Specifically, to effectively capture the feature information of multi-scale objects, this paper reconstructs the backbone network to improve the perception ability of objects of different sizes. To enable the network to learn the different information between different features, this paper designs the Content Coordination Attention Feature Pyramid Network (CCA-FPN) structure to improve the feature representation ability. To provide more accurate prediction information, an Implicit Efficient decoupling head (IEDH) is designed to provide more detailed texture content and edge information for classification tasks and regression tasks. Finally, the Smoothed Intersection over Union (SIoU) loss function is used to accelerate the convergence speed of the network.
The contributions of this paper are summarized as follows:
(1) To enhance the learning ability of the model for multi-scale objects, the backbone network structure is improved.
(2) To obtain rich channel and spatial information, the CCA-FPN structure is proposed to improve the ability to capture global information.
(3) To improve the overall recognition accuracy of the model, this paper proposes an IEDH structure to provide the required feature information for regression tasks and classification tasks, respectively.
(4) The use of the SIoU loss function aims to alleviate the discrepancy between the predicted bounding box and the ground truth, thereby enhancing the detection performance of the model.
Recent years have seen the application of deep learning to optical remote sensing images and remarkable results. Detecting multiple objects accurately in optical remote sensing images, for instance, is crucial in practical applications. For the purpose of resolving this issue, Zhang et al. [27] proposed a novel context-aware detection network (CAD-Net) based on Faster Region-based CNN (Faster R-CNN), which utilizes an attention mechanism to regulate the feature map while combining the feature maps. Based on Mask R-CNN, Fu et al. [28] developed an enhanced algorithm that enables rapid assessment of the range and scale of post-earthquake landslides, contributing to post-earthquake rescue and disaster assessment efforts. Zhang et al. [29] presented an enhanced algorithm based on R-CNN, reducing false detection rates and improving overall detection results for ship detection, enabling more accurate detection of vessels in coastal and inland rivers. The research presented by Zhang et al. [30] addressed the challenges involved in extracting diverse and complex buildings from optical remote sensing images. These challenges included an insufficient ability to detect edges and partial feature extraction. Using the Mask R-CNN framework, the authors presented a method for combining edge features to enhance building identification efficiency.
Despite the advantages of two-stage object detection algorithms with respect to accuracy and performance, these algorithms require complex model structures and extensive parameter computations, which make it difficult to maintain a balance between detection speed and accuracy. Furthermore, two-stage algorithms may lose spatial information about local objects within the entire image. As a result, researchers have started researching single-stage algorithms that balance speed and accuracy. According to Lu et al. [31], attention mechanisms and multiscale feature fusion modules based on SSD were introduced to address the challenges posed by small objects, complex backgrounds, and scale variations. The images can be successfully detected using this method for small objects, but the overall detection performance is inadequate. A YOLOrs network model [32] was proposed based on ResNet [33] and YOLOv3. As a solution, YOLOrs has been designed for real-time object detection, and it is capable of detecting objects at multiple scales. Although this model can meet real-time requirements, it has certain limitations in detection performance.
In conclusion, applying deep learning methods to the field of optical remote sensing image detection is feasible, but there are still some challenges that need to be addressed. For example, remote sensing image datasets contain targets of various sizes and scales, which poses a challenge for models to adapt to these variations in target sizes. Additionally, some targets in the dataset may have indistinct features in the images, making it difficult for traditional feature extraction methods to accurately detect and identify them. This underscores the need for models with enhanced feature learning and representation capabilities. Furthermore, these datasets may include densely distributed targets, resulting in multiple targets overlapping each other, making their separation a challenging task. This situation increases the complexity of object detection, as models must be capable of distinguishing and precisely locating overlapping targets. Consequently, these challenges present difficulties for most object detection algorithms in achieving a balance between detection speed and performance. Therefore, there is a pressing need to develop more efficient and accurate object detection algorithms to overcome these obstacles, ultimately leading to improved results in practical applications.
The current YOLO family of algorithms includes YOLOv3-tiny, YOLOv4-tiny, and YOLOv7-tiny. These “Tiny” versions are lightweight versions of the original YOLO models designed to reduce the number of parameters and the computational complexity of the models while maintaining high detection performance for embedded devices and resource-limited environments, where YOLOv7-tiny can achieve faster detection speeds with the same YOLOv7-tiny can achieve faster detection speeds with the same computational resources. To solve the problem of mismatch between detection speed and detection performance, this paper proposes a DI-YOLO object detection model based on YOLOv7-tiny, which realizes fast and accurate detection of optical remote sensing images. In this paper, the effectiveness of this network model is verified on the HRRSD-Dataset: High-Resolution Remote Sensing Detection (HRRSD) [34] dataset and NWPU VHR-10 [35] dataset.
3.1 Overall Structure of DI-YOLO
In order to ensure that the model has a high detection accuracy while guaranteeing that the model has a fast detection speed, this paper proposes an improved model DI-YOLO based on YOLOv7-tiny, whose overall structure is shown in Fig. 1. First, to better deal with the presence of irregular shapes and deformed features in the image, this paper replaces the standard convolution in the backbone network with deformable convolution [36], which enhances the extraction ability of the backbone network for multi-scale target features. Secondly, to obtain detailed information in the high-resolution feature map, this paper designs the Content Coordination Attention Feature Pyramid Network (CCA-FPN) structure for feature fusion to enhance the neck network’s ability to perceive spatial relationships. Then, focusing on the texture content and edge information of the target to improve model performance, this paper designs an Implicit Efficient Decoupling Head (IEDH) as the final network output. Finally, to improve the quality of bounding box matching by considering the degree of overlap between the target shape and the bounding box, this paper optimizes the prediction results using the Smoothed Intersection over Union (SIoU) loss function.
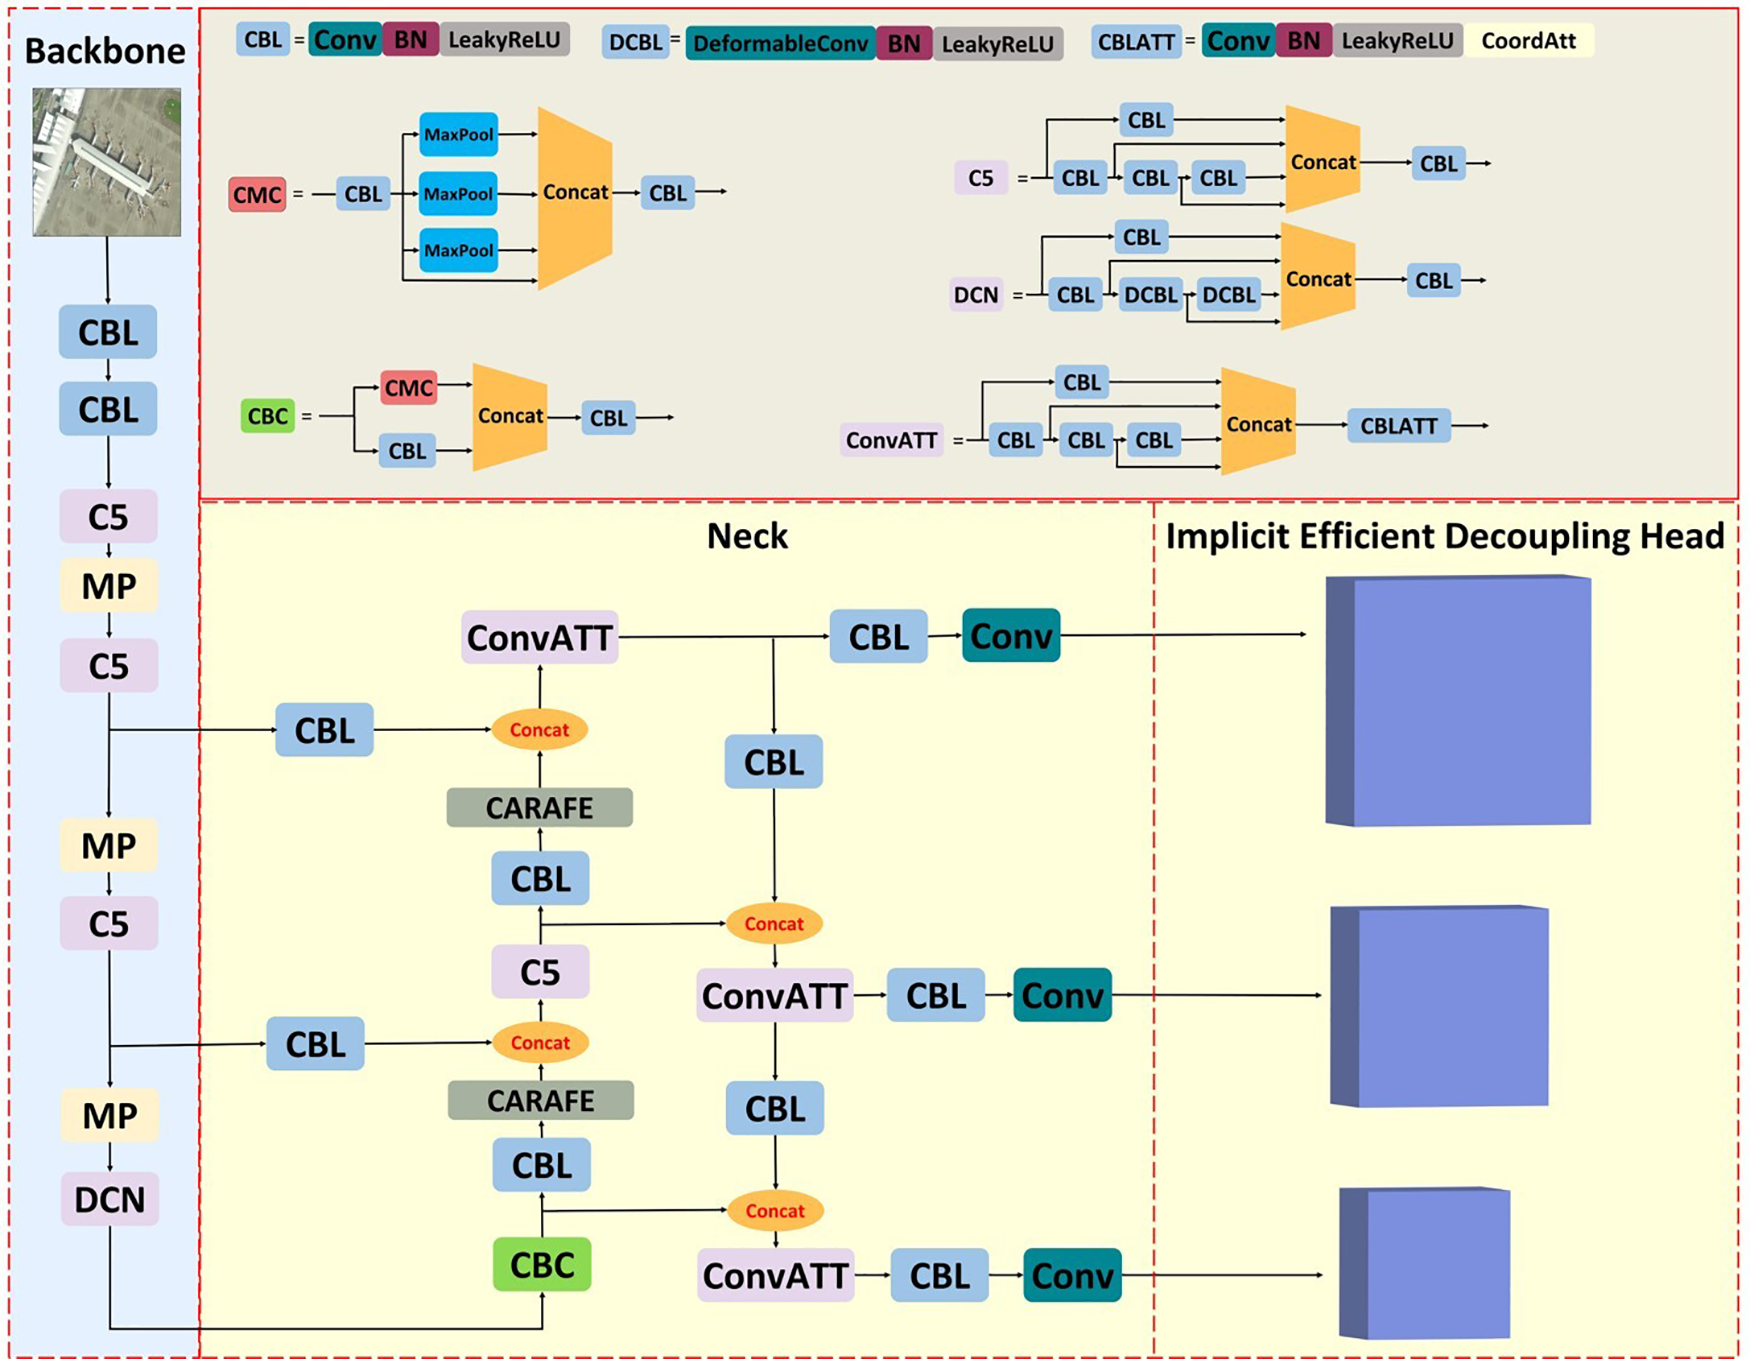
Figure 1: DI-YOLO overall structure diagram
With deformable convolution, the sampling position of the convolution kernel can be adjusted as opposed to standard convolution. The comparison of deformable convolution with standard convolution is shown in Fig. 2.
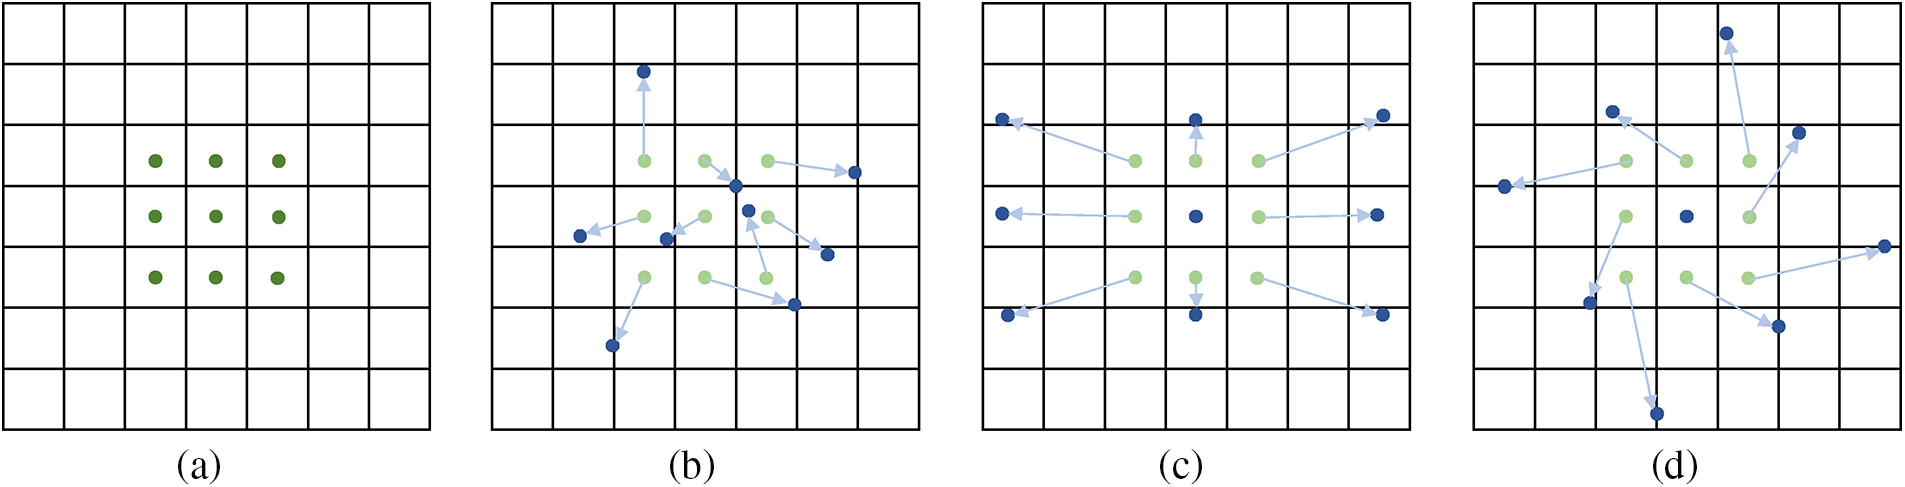
Figure 2: Comparison of deformable convolution and traditional standard convolution. (a) shows a regular sampling grid (green dots); (b) shows demonstrates the sampled positions (deep blue dots) of deformable convolution with increased offsets (light blue arrows); (c) and (d) show depict special cases of (b), including scaling, aspect ratios (anisotropy), and rotation of the image
Deformable convolution and pooling operations are both two-dimensional operations performed within the same channel. The difference between deformable convolution and standard convolution lies in deformable convolution’s ability to dynamically adjust the sampling positions of the convolution kernels using learned offsets. This allows it to adapt to object shape variations. This capability enables deformable convolution to sample input features at more precise locations.
The operation of standard convolution is mainly divided into sampling and weighting operations on the input feature map through a regular grid
For each position
However, the operation of deformable convolution is different as it incorporates an offset
Now, the sampling positions have become irregular due to the introduction of the offset
where
In summary compared to standard convolution deformable convolution can improve the network model’s ability to model multi-scale object deformation in optical remote sensing images, enabling models to adapt more effectively to objects of different sizes and shapes.
This paper presents a feature fusion network CCA-FPN structure as a means of improving the model’s ability to represent image features. Among them, Content-Aware ReAssembly of Features (CARAFE) [37] has a larger sensory field, which can utilize the feature information more efficiently despite the introduction of a small number of parameters and computation. Coordinate Attention (CA) [38] module, which further improves the model’s ability to acquire desired object features in complex environments. Fig. 3 shows its structure.
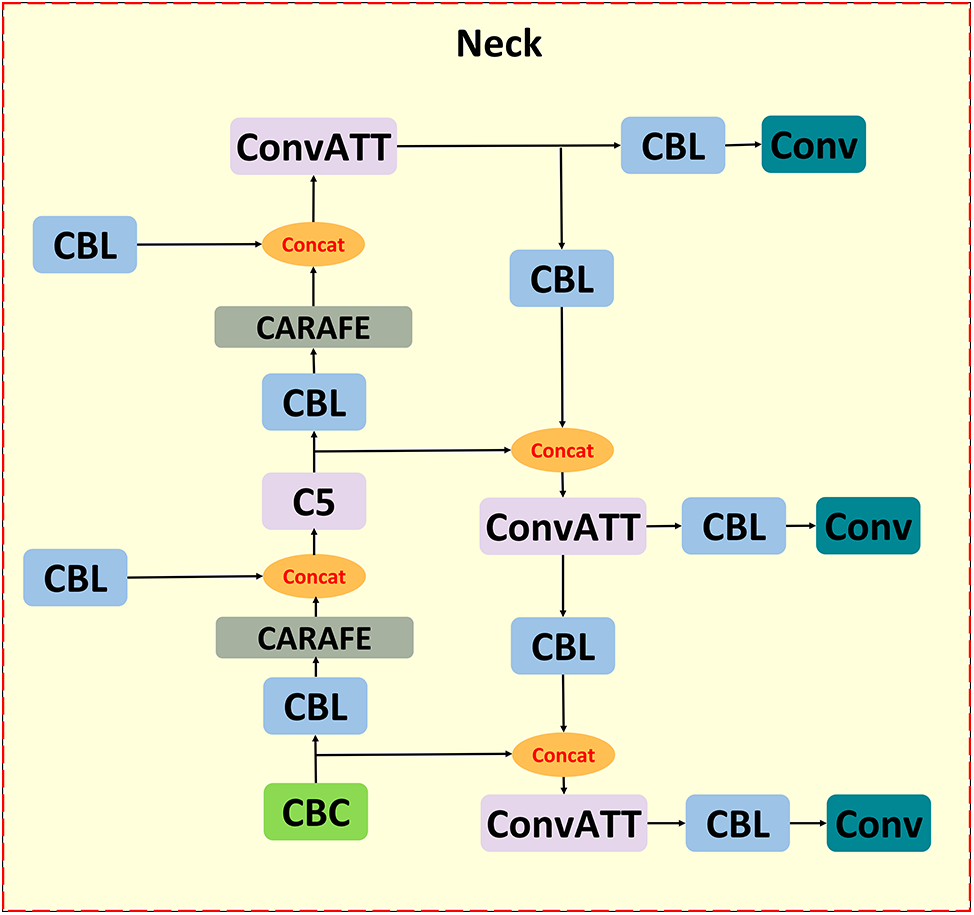
Figure 3: CCA-FPN structure
3.3.1 Content-Aware ReAssembly of Features Lightweight Upsampling Operator Module
The up-sampling operation in YOLOv7-tiny uses the nearest neighbor interpolation method. Although the method is fast in computation, has a small number of parameters, and is simple to implement, the method only considers the pixel value closest to the object pixel without considering the relationship between the neighboring pixel values, which image may lose some of its features due to this process. Therefore, this paper proposes to replace the original up-sampling module of YOLOv7-tiny with a lightweight up-sampling operator CARAFE, which views the feature up-sampling process as a process of feature reorganization.
Fig. 4 illustrates that CARAFE consists of two main modules: the upsampling kernel prediction module
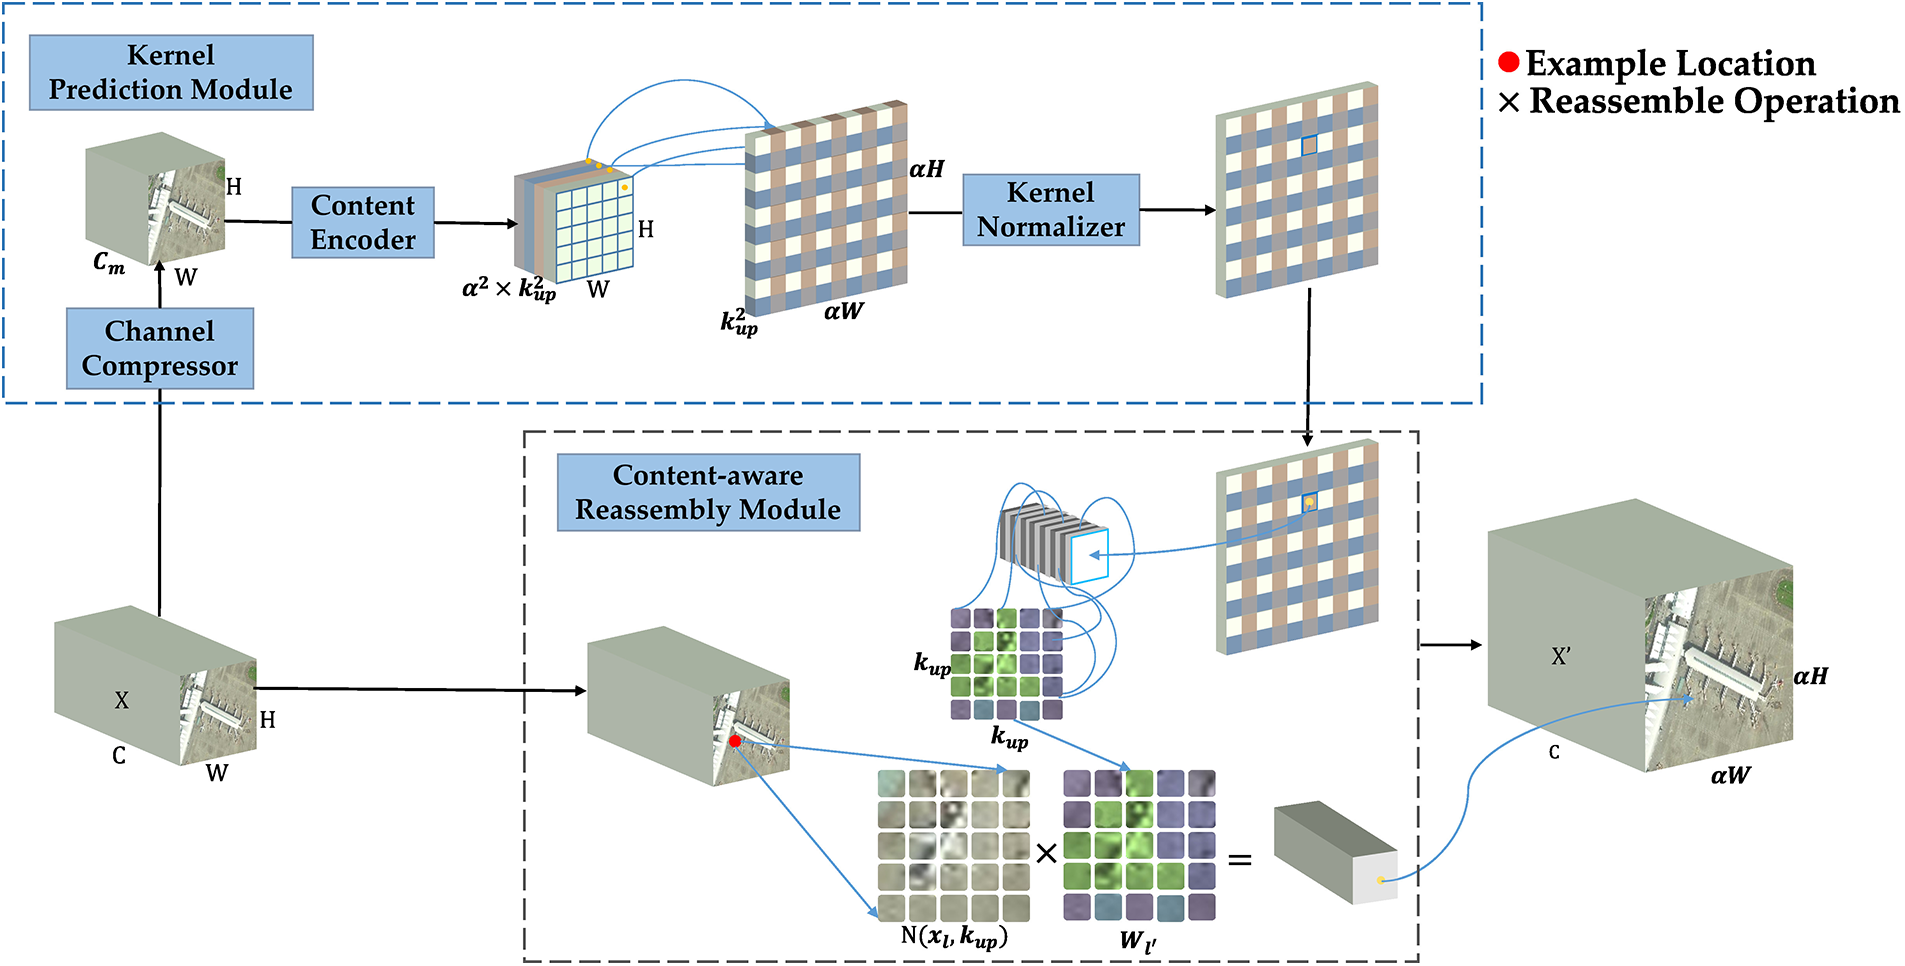
Figure 4: Content-Aware ReAssembly of Features Module structure diagram
Upsampling kernel prediction module
Content-aware reassembly module
The CARAFE algorithm employs the feature recombination module to perform upsampling on a feature input map that has a shape of
In summary, the CARAFE module possesses a substantial receptive field and accomplishes lightweight operations through the integration of upsampling kernels that exploit the semantic information within the feature map.
3.3.2 Coordinate Attention Module
Hybrid attention mechanisms, which consider multiple types of information simultaneously, enable more comprehensive feature extraction and improve model performance. Fig. 5 illustrates the basic structure of the CA model. The CA model incorporates not only channel information but also position information related to directions. Due to its lightweight and flexible design, CA can be easily integrated into various deep learning models without introducing excessive computational burden, thereby enhancing model efficiency and speed while maintaining performance.
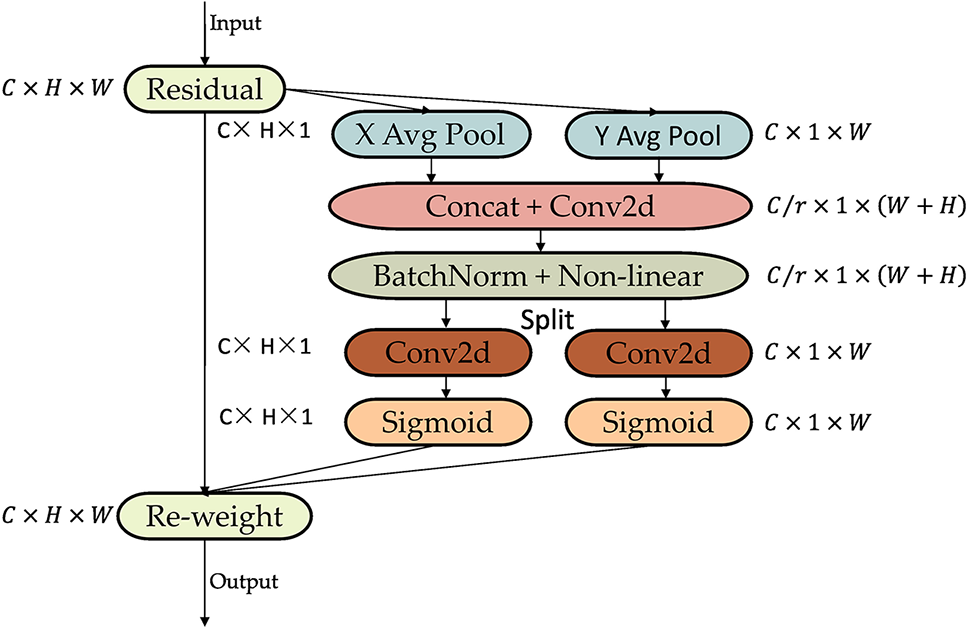
Figure 5: Coordinate attention module structural diagram
The combination of information embedding and attention generation makes this attention mechanism capable of encoding long-term dependencies and channel relationships. The following describes these two steps.
First is the coordinate information embedding. Given an input feature map
Along the horizontal direction, specifically for the output at height h in channel
Along the vertical direction, specifically for the output at width
A pair of direction-aware feature maps is derived by aggregating the two transformations mentioned above along the two spatial directions,
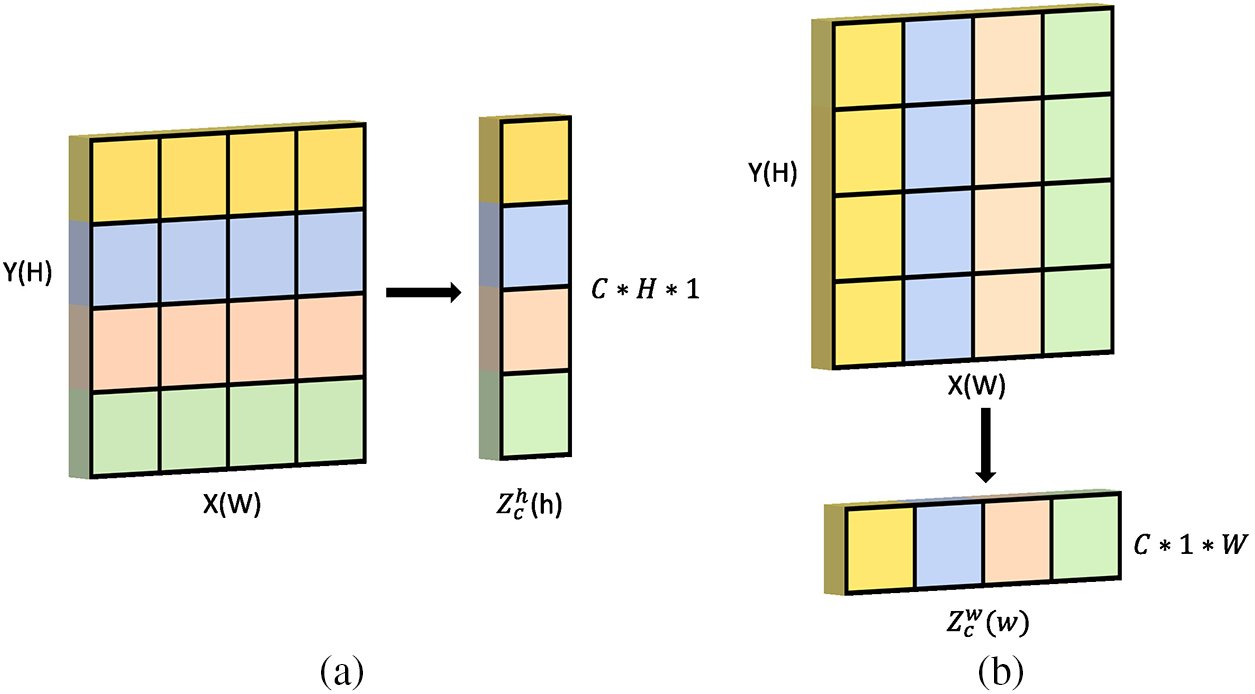
Figure 6: Direction-aware feature map
Next is the process of attention generation, known as coordinate attention generation. According to the two feature maps obtained,
Subsequently, a split operation is performed along the spatial dimension, yielding two separate feature maps,
Finally, the attention vectors
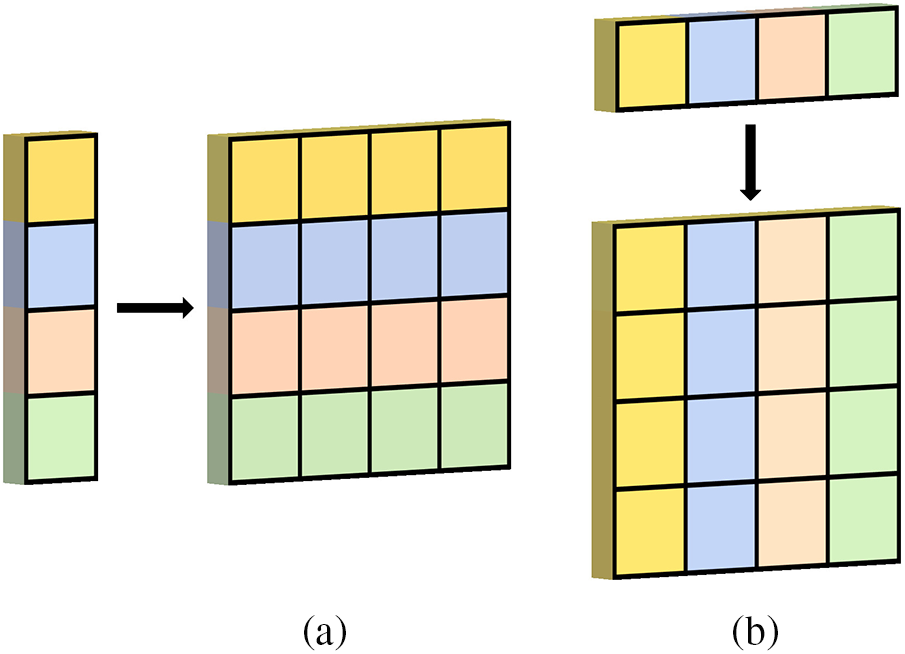
Figure 7: Feature expansion diagram
Unlike other attention mechanisms such as SENet that focus solely on constructing interdependencies among channels while neglecting spatial information, thereby exhibiting certain limitations [40], in CA attention mechanisms, both channel information and spatial information are considered. The module generates two attention maps by attending to the input tensor in both horizontal and vertical directions. According to attention maps, each element reflects whether the object of interest appears in the corresponding row and column. Through the encoding process, attention is more effectively coordinated to locate objects of interest, improving recognition performance.
3.4 Implicitly Efficient Decoupled Head
By combining the decoupled operations from YOLOX, YOLOv6, and the implicit knowledge learning operation introduced in YOLOR, this paper proposes a method with an IEDH. As shown in Fig. 8, this decoupled head exhibits improved detection performance and faster speed.
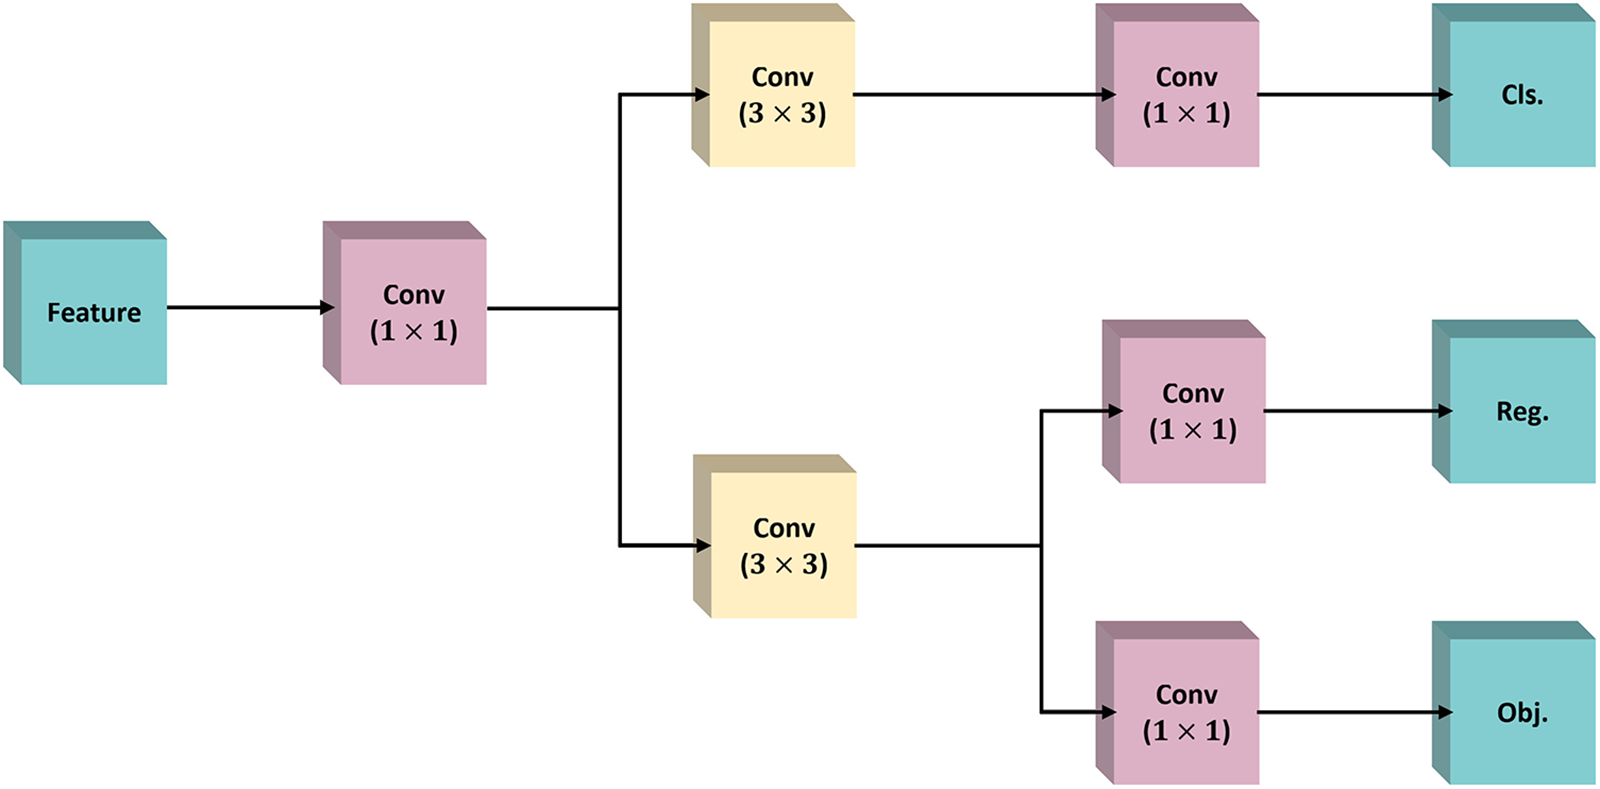
Figure 8: Implicit efficient decoupled head structure
The construction process of the implicit efficient decoupling head is as follows: first, the input feature layer is feature-integrated by 1 × 1 convolution, and then the whole prediction process is divided into a classification part and a regression part. The classification part uses 3 × 3 convolution for feature extraction, and then the classification task is performed by 1 × 1 convolution to determine which category it belongs to. The regression part uses the same operation as the classification part, but after feature extraction, the regression part employs two 1 × 1 convolutions to obtain regression prediction results to determine whether the feature has a corresponding object. Finally, these three predictions are superimposed and integrated.
3.5 Smoothed Intersection over Union Loss Function
Complete Intersection over Union (CIoU) loss function does not incorporate the direction information contained in the ground truth, which may affect the training speed of network models and inference accuracy. Given the diverse range of sizes and shapes exhibited by objects, we propose the SIoU [41] loss function as a viable alternative to the CIoU loss function. There are four cost functions in the SIoU loss function.
According to Eq. (14), angular loss cost is defined as follows:
where
In Eqs. (15) and (16),
The angle loss is zero when
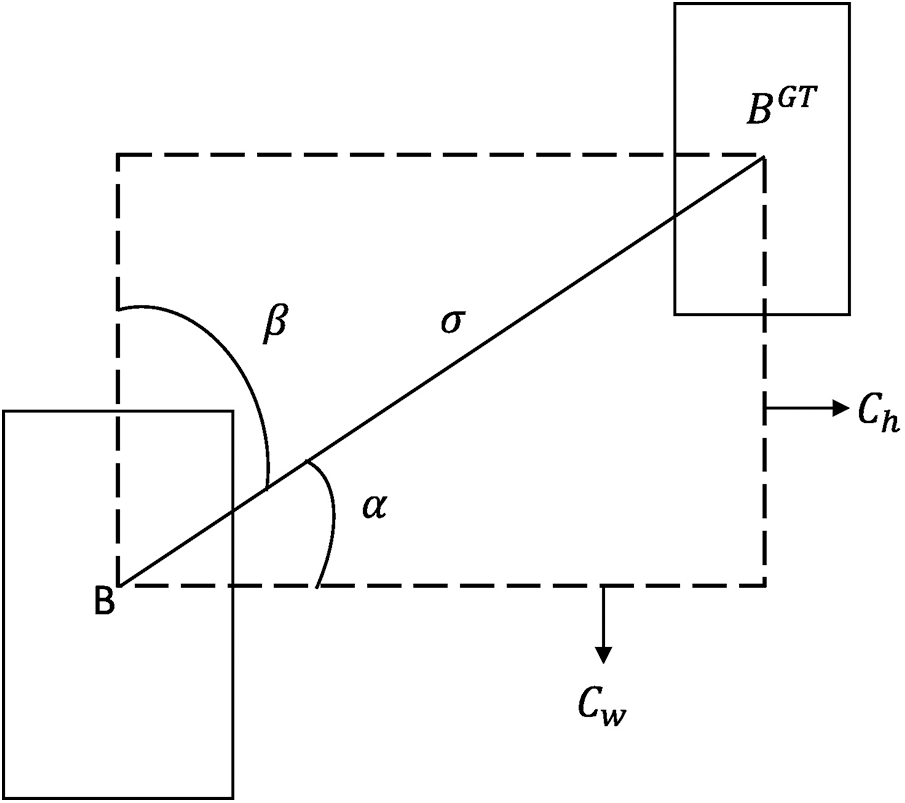
Figure 9: Angular loss value
The distance loss cost function is defined in Eq. (18):
where
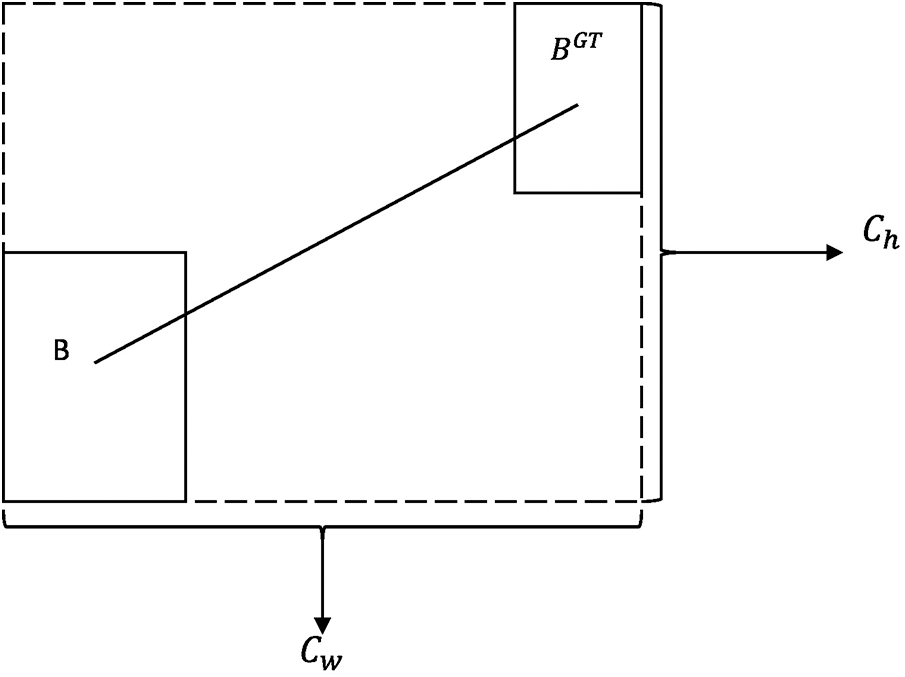
Figure 10: Distance loss calculation
The shape loss cost function is defined as in Eq. (20).
where the
in Eq. (21), w, h,
According to Eq. (22), the IoU cost function is as follows:
As a summary, Eq. (23) illustrates the SIoU loss function.
To validate the reliability of the proposed model, two datasets were used: HRRSD and NWPU VHR-10. HRRSD is a dataset developed in 2017 by the Center for Optical Imagery Analysis and Learning of the Xi’an Institute of Optics and Precision Mechanics of the Chinese Academy of Sciences, specifically designed for remote sensing image object detection research. A total of 55,740 object instances are included in the HRRSD dataset, with approximately 4,000 instances per category. It covers 13 types of remote sensing land object categories, including ships, bridges, ground track fields, storage tanks, basketball courts, tennis courts, airplanes, baseball fields, harbors, vehicles, intersections, T-intersections, and parking lots. One notable feature of this dataset is the relatively balanced sample distribution among different categories, with each category containing over 4,000 samples. Moreover, the dataset includes a diverse range of detection objects, with each image containing various sizes and types of objects, and some images containing densely packed objects. Northwestern Polytechnical University, China, has released the NWPU VHR-10 dataset. With 650 images containing objects, 150 background images, and 10 object classes, it is comprised of 650 images from Google Earth.
4.1.2 Experimental Environment
The experimental setup for this study is shown in Table 1.

The hyperparameter settings before model training in this paper are shown in Table 2.

A metric used to evaluate network models’ object detection performance is mean Average Precision (mAP). mAP represents the average of all class results and is used to evaluate the overall performance of the detection algorithm, where mAP0.5 evaluates the object detection performance at an IoU threshold of 0.5, mAP0.5:0.95 provides a more detailed evaluation by considering a range of IoU thresholds between 0.5 and 0.95 in steps of 0.05. This study utilizes Precision (P), Recall (R), Average Precision (AP), and mAP as performance evaluation metrics for DI-YOLO. The following are specific expressions:
True Positives (TP) in Eq. (24) are the number of positive samples correctly recognized as positive samples; False Positives (FP) are false positive samples, the number of negative samples incorrectly recognized as positive samples.
False Negatives (FN) in Eq. (25) is the number of false negatives, the number of positive samples that are incorrectly recognized as negative.
In Eq. (26) P stands for precision and R stands for recall.
N in Eq. (27) denotes N classifications in the dataset.
Employing YOLOv7-tiny as the base model, we performed ablation experiments on the HRRSD dataset to substantiate the efficacy of the proposed algorithm for optical remote sensing image detection. Various improvement modules were evaluated in the DI-YOLO model to determine their performance. The results of the experiments are presented in Table 3.

Based on deformable convolution characteristics, this paper replaces standard convolution with deformable convolution in the YOLOv7-tiny backbone network. As indicated in Table 3, the model’s overall performance continues to improve following the implementation of deformable convolution, while reducing the computational burden.
In Fig. 11, the gradient-weighted class activation mapping (Grad-CAM) [42] is used to visualize the heatmap of CCA-FPN. It can be clearly observed that with the addition of the CCA-FPN structure again, the high-confidence regions of the object become more prominent, thus focusing on the important elements and reducing the interference in the recognition process.
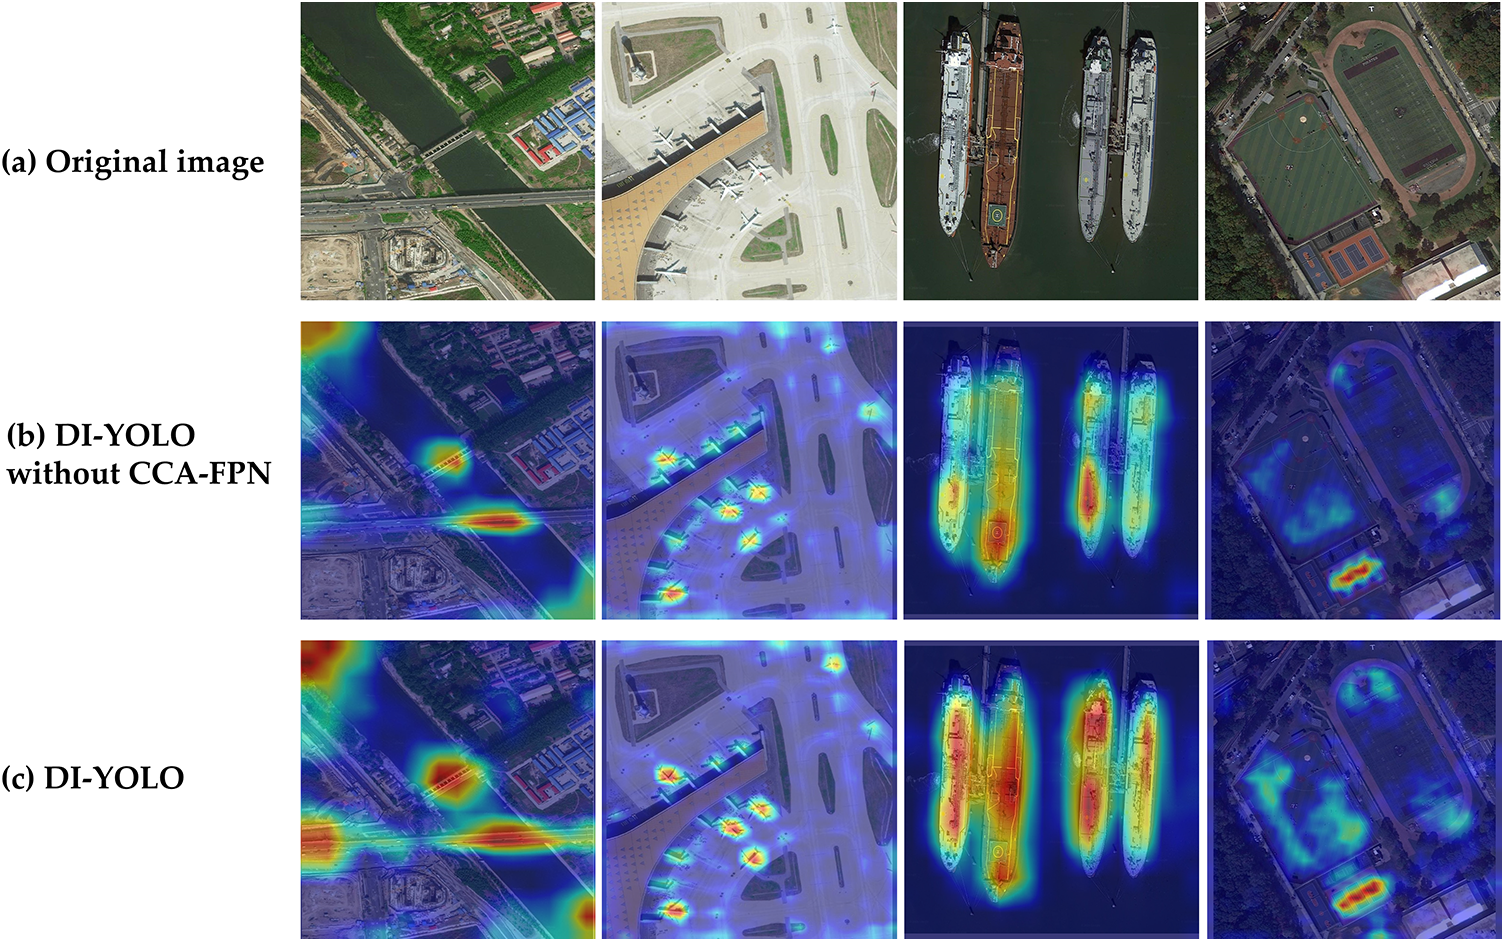
Figure 11: Heat map of detection results using Grad-CAM before and after adding the CCA-FPN module
To fully extract information from the feature map, IEDH is used as the final output of the network. Lastly, the SIoU loss function is used in this paper to accelerate network convergence. The experimental results show that although DI-YOLO increases the parameters and computation, its precision increases by 4.2%, recall by 2.3%, mAP0.5 by 2.9%, and mAP0.5:0.95 by 2.5%. According to the results above, the model maintains high recognition performance while meeting the requirements of real-time processing.
In addition, Fig. 12 illustrates a performance comparison graph between the DI-YOLO and YOLOv7-tiny models based on ablation results. These graphs include precision curves, recall curves, and mAP0.5 curves. Based on the comparison graphs, it is evident that the DI-YOLO model outperforms YOLOv7-tiny in each of the aforementioned evaluation metrics.
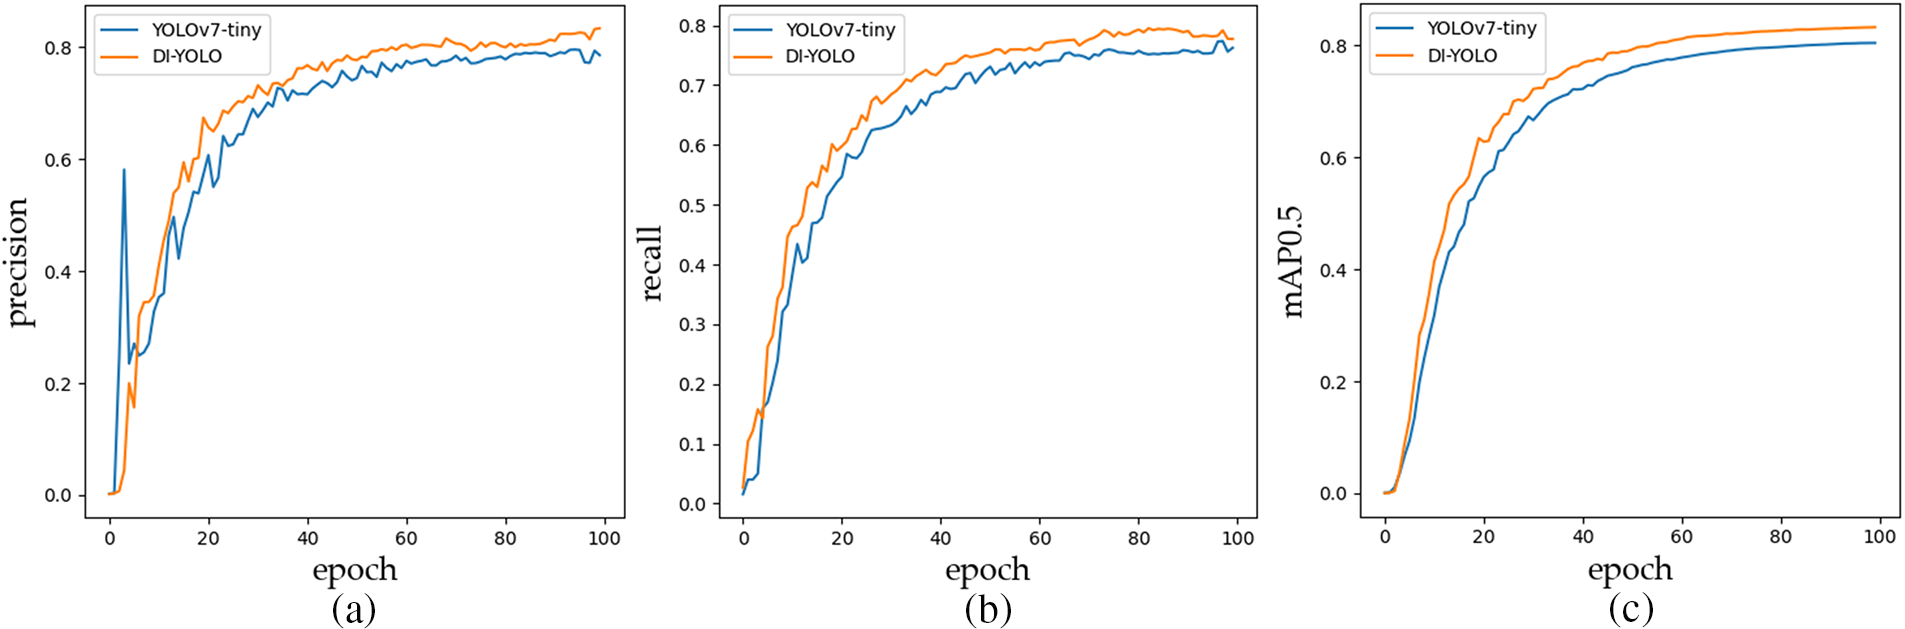
Figure 12: Performance comparison between YOLOv7-tiny and DI-YOLO models
Fig. 13 illustrates the loss comparison graph. The graph indicates that the proposed model introduced in this paper exhibits a faster convergence speed compared to the baseline model YOLOv7-tiny.
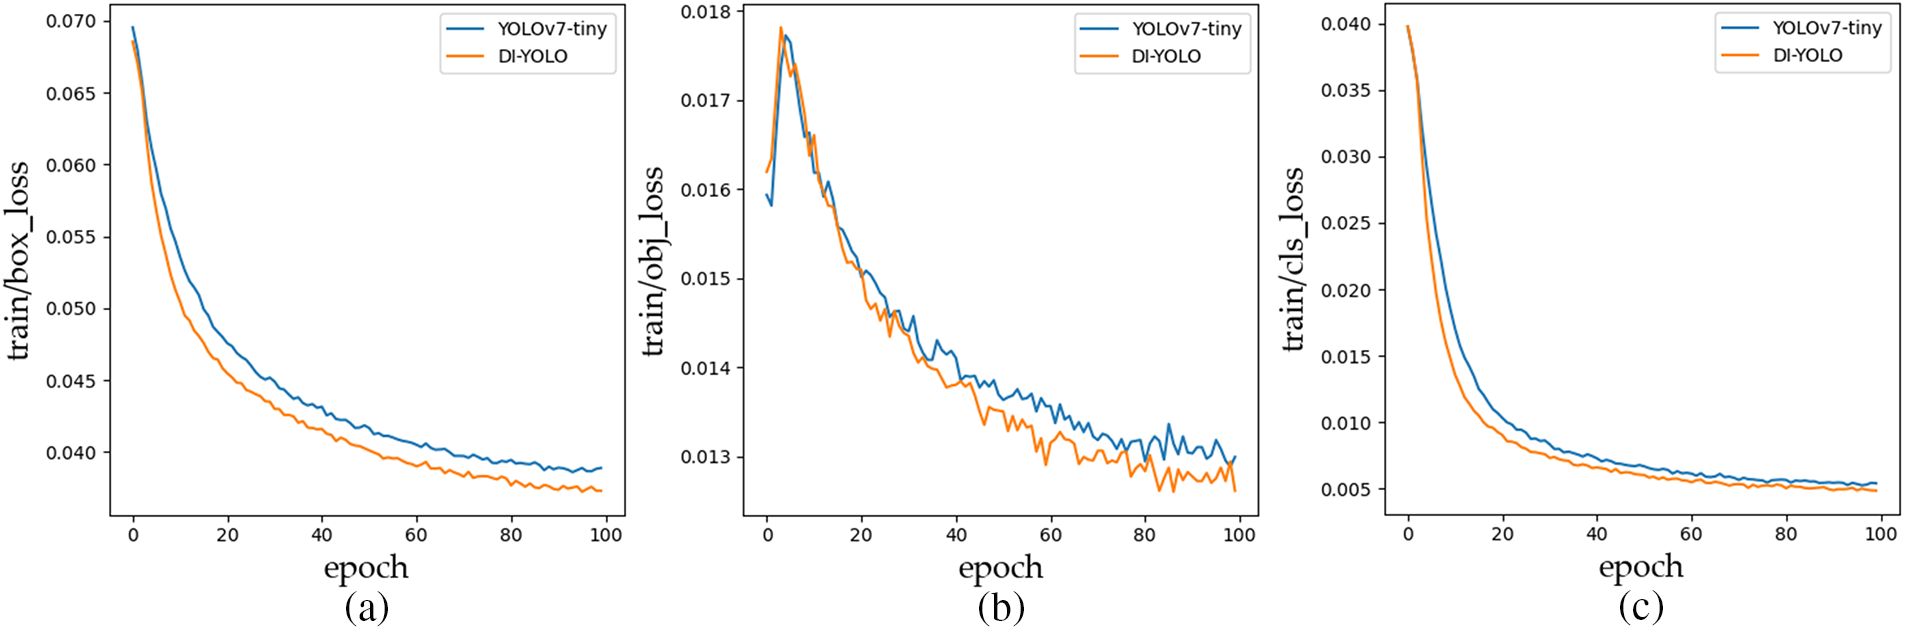
Figure 13: Loss comparison between YOLOv7-tiny and DI-YOLO models
As shown in Table 4, the proposed DI-YOLO is compared with classical object detection algorithms using Resnet-50 as the backbone of Faster R-CNN, YOLOv3-tiny, YOLOv4-tiny, YOLOv5n, YOLOv7-tiny and YOLOv8-n.

In Fig. 14, it is shown that DI-YOLO has high performance, can accurately extract image features, and is suitable to detect multiscale image detection under complex backgrounds such as those encountered in optical remote sensing.
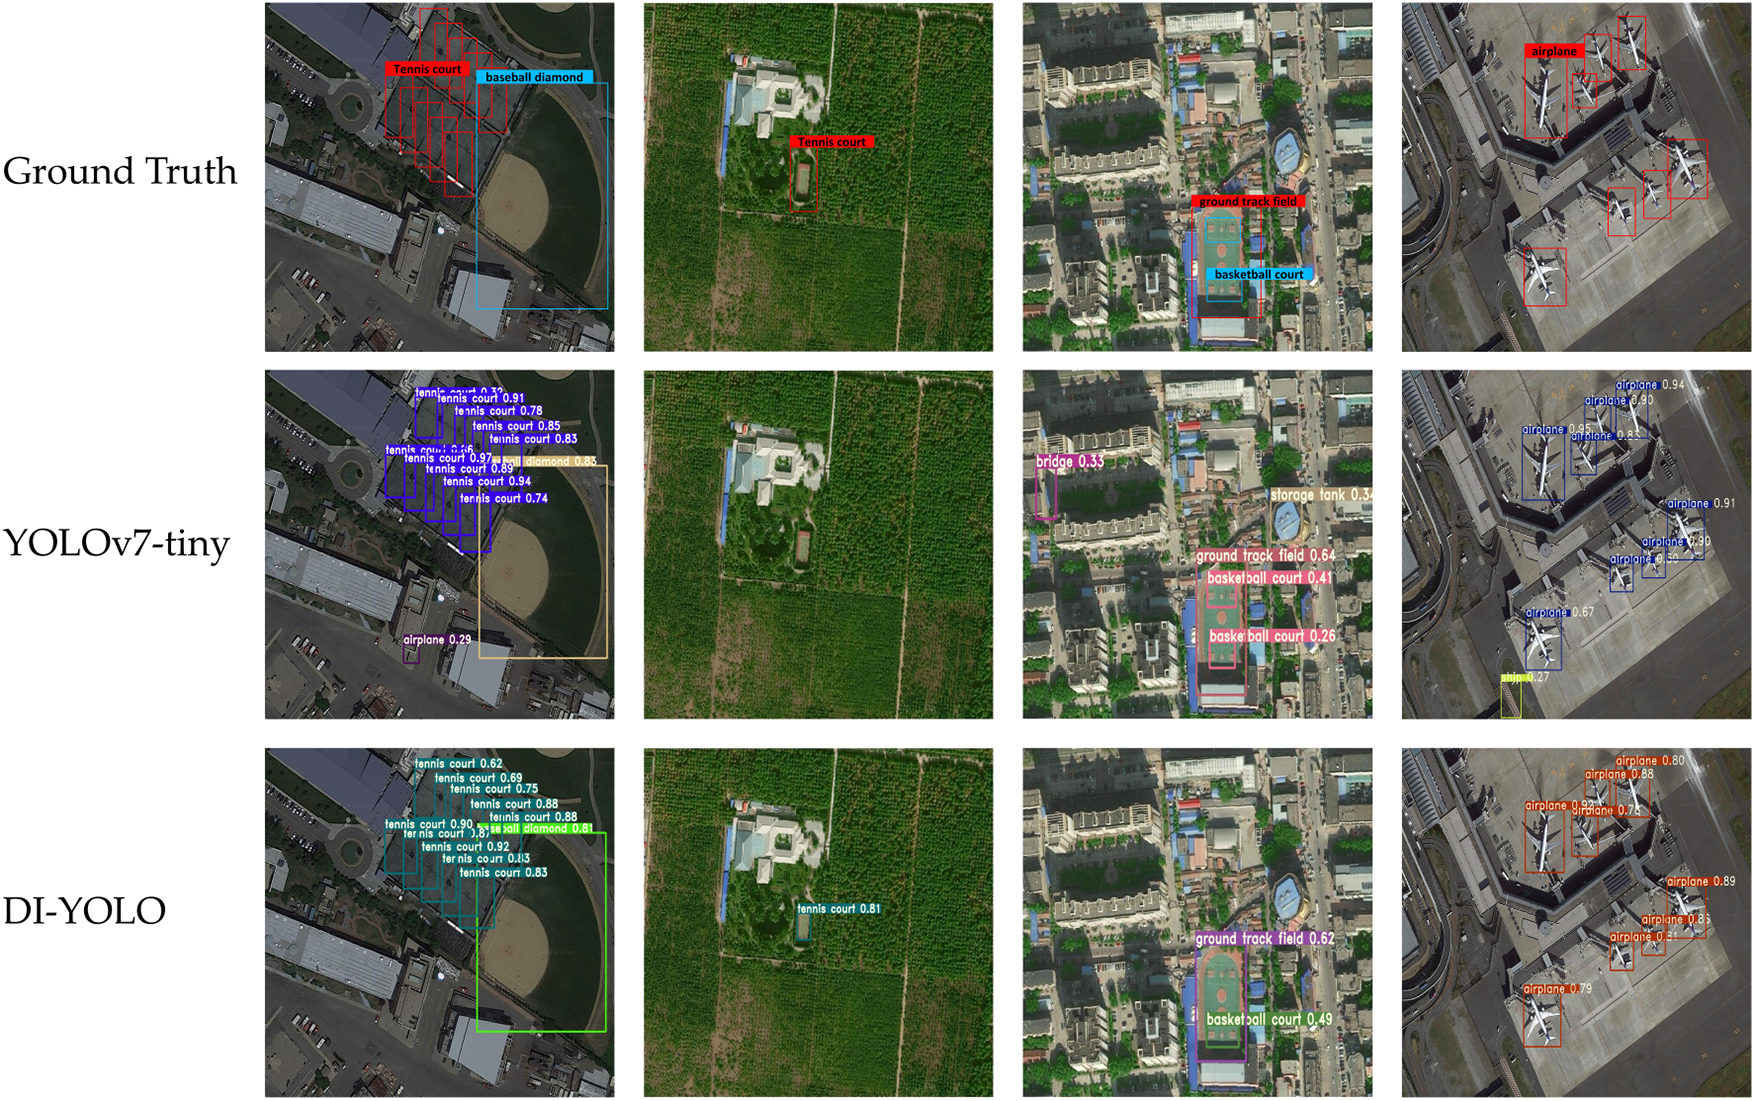
Figure 14: The HRRSD dataset was used to compare the detection effects of DI-YOLO
From the experimental results, it is shown that the mAP of DI-YOLO is the best, which is because the CCA-FPN structure improves the feature resolution by feature reorganization, introduces context modeling in the feature up-sampling process, which in turn can adapt to targets with different scales, orientations, and shapes, and improves the sensitivity to various types of targets in remote sensing images, which proves that the structure can be used for multiscale in the complicated context of object detection tasks in complex backgrounds. Combined with Fig. 14, it can be concluded that DI-YOLO performs better in the case of complex background features or large differences between background feature scales and targets, which is due to the fact that the efficient decoupling head proposed in this paper better handles both the classification and the localization task.
4.3.3 Generalizability Verification
The DI-YOLO model needs to be evaluated on an image set that does not include HRRSD data to further validate its generalization ability. The HRRSD dataset contains the same categories as the NWPU VHR-10 dataset for validation purposes. The experimental samples include but are not limited to, ships, aircraft, baseball fields, and ports of various sizes in different contexts. Fig. 15 illustrates the comparison of detection results between YOLOv7-tiny and DI-YOLO. Although DI-YOLO has a few misclassifications based on experimental results, the proposed DI-YOLO model shows better object detection accuracy compared to YOLOv7-tiny while maintaining real-time performance.
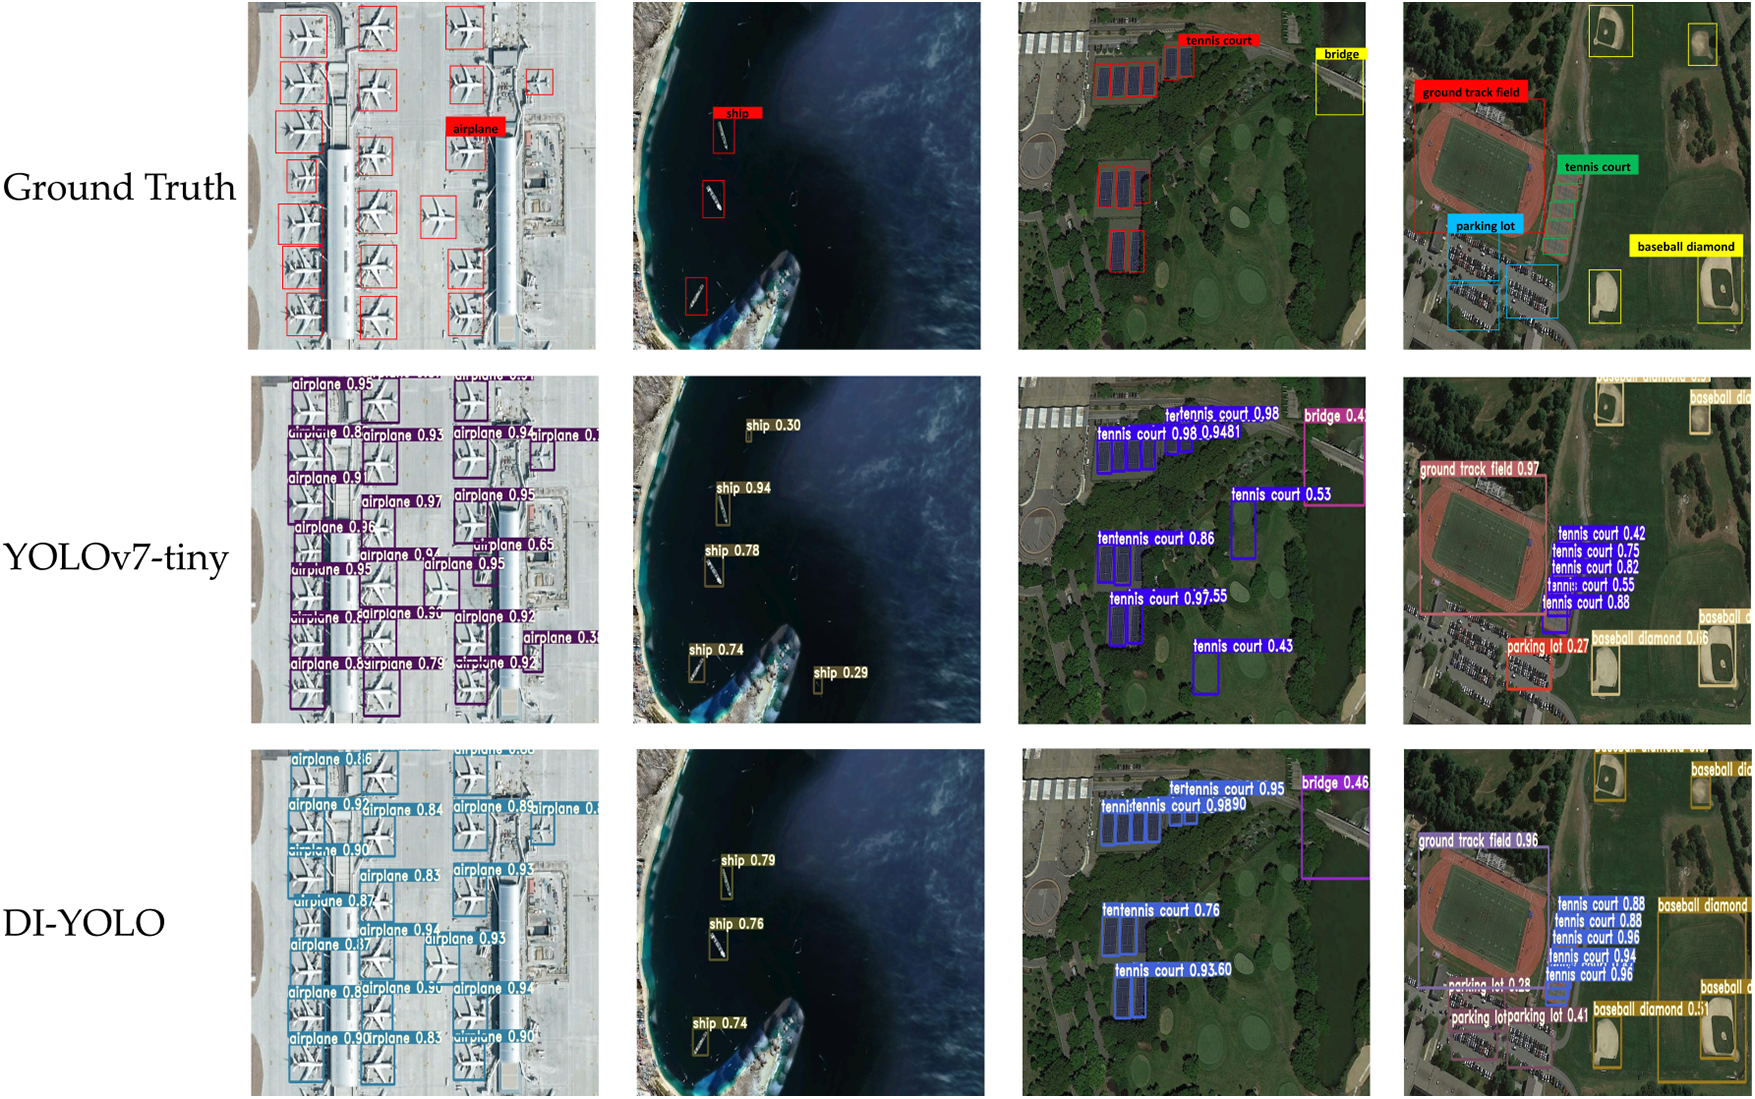
Figure 15: The NWPU VHR-10 dataset was used to compare the detection effects of DI-YOLO
This paper presents a model for object detection, DI-YOLO, by improving on the basic framework of YOLOv7-tiny. The deformable convolution was first used to make the model optimized for feature extraction of multi-scale objects. Secondly, a CCA-FPN structure is designed to enhance the model’s capability to recognize multi-objects. Next, the IEDH is employed to further focus on the object’s texture content and edge information. Lastly, the bias effect can be reduced by using the SIoU loss function. The experiments show that compared with other mainstream algorithms, DI-YOLO can obtain better detection results while ensuring real-time performance. Although the overall detection performance of DI-YOLO performs better, its effect on detecting optical remote sensing images with severely dense targets and tiny targets performs poorly compared to mainstream models, which will be a key research focus in the future.
Acknowledgement: The authors gratefully acknowledge the support of Shaanxi Province’s Key Research and Development Plan.
Funding Statement: Funding for this research was provided by 511 Shaanxi Province’s Key Research and Development Plan (No. 2022NY-087).
Author Contributions: The authors confirm contribution to the paper as follows: study conception and design: Chao Dong and Xiangkui Jiang; data collection: Chao Dong; analysis and interpretation of results: Chao Dong and Xiangkui Jiang; draft manuscript preparation: Chao Dong. All authors reviewed the results and approved the final version of the manuscript.
Availability of Data and Materials: The datasets presented in this study are available through: https://github.com/CrazyStoneonRoad/TGRS-HRRSD-Dataset; https://gcheng-nwpu.github.io/#Datasets.
Conflicts of Interest: The authors declare that they have no conflicts of interest to report regarding the present study.
References
1. X. Wu, W. Li, D. Hong, R. Tao and Q. Du, “Deep learning for unmanned aerial vehicle-based object detection and tracking: A survey,” IEEE Geoscience and Remote Sensing Magazine, vol. 10, no. 1, pp. 91–124, 2022. [Google Scholar]
2. B. Li, X. Xie, X. Wei and W. Tang, “Ship detection and classification from optical remote sensing images: A survey,” Chinese Journal of Aeronautics, vol. 34, no. 3, pp. 145–163, 2021. [Google Scholar]
3. X. Ma, R. Zhao and Z. Shi, “Multiscale methods for optical remote-sensing image captioning,” IEEE Geoscience and Remote Sensing Letters, vol. 18, no. 11, pp. 2001–2005, 2021. [Google Scholar]
4. G. Cheng and J. Han, “A survey on object detection in optical remote sensing images,” ISPRS Journal of Photogrammetry and Remote Sensing, vol. 117, pp. 11–28, 2016. [Google Scholar]
5. R. Lienhart and J. Maydt, “An extended set of Haar-like features for rapid object detection,” in IEEE Int. Conf. on Image Processing, Rochester, NY, USA, pp. I-900–I-903, 2002. [Google Scholar]
6. N. Dalal and B. Triggs, “Histograms of oriented gradients for human detection,” in IEEE Computer Society Conf. on Computer Vision and Pattern Recognition, San Diego, CA, USA, pp. 886–893, 2005. [Google Scholar]
7. P. F. Felzenszwalb, R. B. Girshick, D. McAllester and D. Ramanan, “Object detection with discriminatively trained part-based models,” IEEE Transactions on Pattern Analysis and Machine Intelligence, vol. 32, no. 9, pp. 1627–1645, 2010. [Google Scholar] [PubMed]
8. Y. Yao, Z. Jiang, H. Zhang, M. Wang and G. Meng, “Ship detection in panchromatic images: A new method and its DSP implementation,” in ISPRS Int. Conf. on Computer Vision in Remote Sensing, Xiamen, China, pp. 99010Q, 2016. [Google Scholar]
9. X. Yu and Z. Shi, “Vehicle detection in remote sensing imagery based on salient information and local shape feature,” Optik, vol. 126, no. 20, pp. 2485–2490, 2015. [Google Scholar]
10. S. Qi, J. Ma, J. Lin, Y. Li and J. Tian, “Unsupervised ship detection based on saliency and S-HOG descriptor from optical satellite images,” IEEE Geoscience and Remote Sensing Letters, vol. 12, no. 7, pp. 1451–1455, 2015. [Google Scholar]
11. Q. Luo and Z. Shi, “Airplane detection in remote sensing images based on object proposal,” in IEEE Int. Geoscience and Remote Sensing Symp., Beijing, China, pp. 1388–1391, 2016. [Google Scholar]
12. S. Qiu, G. Wen and Y. Fan, “Occluded object detection in high-resolution remote sensing images using partial configuration object model,” IEEE Journal of Selected Topics in Applied Earth Observations and Remote Sensing, vol. 10, no. 5, pp. 1909–1925, 2017. [Google Scholar]
13. K. S. Arikumar, A. Deepak Kumar, T. R. Gadekallu, S. B. Prathiba and K. Tamilarasi, “Real-time 3D object detection and classification in autonomous driving environment using 3D LiDAR and camera sensors,” Electronics, vol. 11, no. 24, pp. 4203, 2022. [Google Scholar]
14. R. Girshick, J. Donahue, T. Darrell and J. Malik, “Rich feature hierarchies for accurate object detection and semantic segmentation,” in IEEE Conf. on Computer Vision and Pattern Recognition, Ohio, OH, USA, pp. 580–587, 2014. [Google Scholar]
15. R. Girshick, “Fast R-CNN,” in IEEE Int. Conf. on Computer Vision, Santiago, pp. 1440–1448, 2015. [Google Scholar]
16. S. Ren, K. He, R. Girshick and J. Sun, “Faster R-CNN: Towards real-time object detection with region proposal networks,” IEEE Transactions on Pattern Analysis and Machine Intelligence, vol. 39, no. 6, pp. 1137–1149, 2017. [Google Scholar] [PubMed]
17. J. Redmon, S. Divvala, R. Girshick and A. Farhadi, “You only look once: Unified, real-time object detection,” in IEEE Conf. on Computer Vision and Pattern Recognition, Seattle, WA, USA, pp. 779–788, 2016. [Google Scholar]
18. J. Redmon and A. Farhadi, “YOLO9000: Better, faster, stronger,” in IEEE Conf. on Computer Vision and Pattern Recognition, Hawaii, HI, USA, pp. 6517–6525, 2017. [Google Scholar]
19. J. Redmon and A. Farhadi, “YOLOv3: An incremental improvement,” 2018. [Online]. Available: http://arxiv.org/abs/1804.02767 (accessed on 06/05/2023) [Google Scholar]
20. A. Bochkovskiy, C. Y. Wang and H. Y. M. Liao, “YOLOv4: Optimal speed and accuracy of object detection,” 2018. [Online]. Available: http://arxiv.org/abs/2004.10934 (accessed on 06/05/2023) [Google Scholar]
21. Z. Ge, S. Liu, F. Wang, Z. Li and J. Sun, “YOLOX: Exceeding YOLO series in 2021,” 2021. [Online]. Available: http://arxiv.org/abs/2107.08430 (accessed on 06/05/2023) [Google Scholar]
22. C. Y. Wang, I. H. Yeh and H. Y. M. Liao, “You only learn one representation: Unified network for multiple tasks,” 2021. [Online]. Available: http://arxiv.org/abs/2105 (accessed on 06/13/2023) [Google Scholar]
23. C. Li, L. Li, H. Jiang, K. Weng, Y. Geng et al., “YOLOv6: A single-stage object detection framework for industrial applications,” 2023. [Online]. Available: http://arxiv.org/abs/2209.02976 (accessed on 06/06/2023) [Google Scholar]
24. C. Y. Wang, A. Bochkovskiy and H. Y. M. Liao, “YOLOv7: Trainable bag-of-freebies sets new state-of-the-art for real-time object detectors,” 2023. [Online]. Available: http://arxiv.org/abs/2207.02696 (accessed on 06/05/2023) [Google Scholar]
25. W. Liu, D. Anguelov, D. Erhan, C. Szegedy, S. Reed et al., “SSD: Single shot multibox detector,” Lecture Notes in Computer Science, vol. 9905, pp. 21–37, 2016. [Google Scholar]
26. C. Y. Fu, W. Liu, A. Ranga, A. Tyagi and A. C. Berg, “DSSD: Deconvolutional single shot detector,” 2017. [Online]. Available: http://arxiv.org/abs/1701.06659 (accessed on 06/05/2023) [Google Scholar]
27. G. Zhang, S. Lu and W. Zhang, “CAD-Net: A context-aware detection network for objects in remote sensing imagery,” IEEE Transactions on Geoscience and Remote Sensing, vol. 57, no. 12, pp. 10015–10024, 2019. [Google Scholar]
28. R. Fu, J. He, G. Liu, W. Li, J. Mao et al., “Fast seismic landslide detection based on improved mask R-CNN,” Remote Sensing, vol. 14, no. 16, pp. 3928, 2022. [Google Scholar]
29. S. Zhang, R. Wu, K. Xu, J. Wang and W. Sun, “R-CNN-Based ship detection from high resolution remote sensing imagery,” Remote Sensing, vol. 11, no. 6, pp. 631, 2019. [Google Scholar]
30. L. Zhang, J. Wu, Y. Fan, H. Gao and Y. Shao, “An efficient building extraction method from high spatial resolution remote sensing images based on improved Mask R-CNN,” Sensors, vol. 20, no. 5, pp. 1465, 2020. [Google Scholar] [PubMed]
31. X. Lu, J. Ji, Z. Xing and Q. Miao, “Attention and feature fusion SSD for remote sensing object detection,” IEEE Transactions on Instrumentation and Measurement, vol. 70, pp. 1–9, 2021. [Google Scholar]
32. M. Sharma, M. Dhanaraj, S. Karnam, D. G. Chachlakis, R. Ptucha et al., “YOLOrs: Object detection in multimodal remote sensing imagery,” IEEE Journal of Selected Topics in Applied Earth Observations and Remote Sensing, vol. 14, pp. 1497–1508, 2021. [Google Scholar]
33. K. He, X. Zhang, S. Ren and J. Sun, “Deep residual learning for image recognition,” in IEEE Conf. on Computer Vision and Pattern Recognition, Seattle, WA, USA, pp. 770–778, 2016. [Google Scholar]
34. Y. Zhang, Y. Yuan, Y. Feng and X. Lu, “Hierarchical and robust convolutional neural network for very high-resolution remote sensing object detection,” IEEE Transactions on Geoscience and Remote Sensing, vol. 57, no. 8, pp. 5535–5548, 2019. [Google Scholar]
35. G. Cheng, J. Han, P. Zhou and L. Guo, “Multi-class geospatial object detection and geographic image classification based on collection of part detectors,” ISPRS Journal of Photogrammetry and Remote Sensing, vol. 98, pp. 119–132, 2014. [Google Scholar]
36. J. Dai, H. Qi, Y. Xiong, Y. Li, G. Zhang et al., “Deformable convolutional networks,” in IEEE Int. Conf. on Computer Vision, Venice, pp. 764–773, 2017. [Google Scholar]
37. J. Wang, K. Chen, R. Xu, Z. Liu, C. C. Loy et al., “CARAFE: Content-Aware ReAssembly of FEatures,” in IEEE/CVF Int. Conf. on Computer Vision, Seoul, Korea, pp. 3007–3016, 2019. [Google Scholar]
38. Q. Hou, D. Zhou and J. Feng, “Coordinate attention for efficient mobile network design,” in IEEE/CVF Conf. on Computer Vision and Pattern Recognition, Nashville, TN, USA, pp. 13708–13717, 2021. [Google Scholar]
39. J. Hu, L. Shen and G. Sun, “Squeeze-and-Excitation networks,” in IEEE/CVF Conf. on Computer Vision and Pattern Recognition, Salt Lake City, UT, USA, pp. 7132–7141, 2018. [Google Scholar]
40. B. Su, J. Liu, X. Su, B. Luo and Q. Wang, “CFCANet: A complete frequency channel attention network for SAR image scene classification,” IEEE Journal of Selected Topics in Applied Earth Observations and Remote Sensing, vol. 14, pp. 11750–11763, 2021. [Google Scholar]
41. Z. Gevorgyan, “SIoU loss: More powerful learning for bounding box regression,” 2022. [Online]. Available: http://arxiv.org/abs/2205.12740 (accessed on 06/25/2023) [Google Scholar]
42. R. R. Selvaraju, M. Cogswell, A. Das, R. Vedantam, D. Parikh et al., “Grad-CAM: Visual explanations from deep networks via gradient-based localization,” in IEEE Int. Conf. on Computer Vision, Venice, pp. 618–626, 2017. [Google Scholar]
Cite This Article
 Copyright © 2023 The Author(s). Published by Tech Science Press.
This work is licensed under a Creative Commons Attribution 4.0 International License , which permits unrestricted use, distribution, and reproduction in any medium, provided the original work is properly cited.
 Downloads
 Citation Tools