
 Submit a Paper
 Propose a Special lssue
 Open Access
ARTICLE

Braille Character Segmentation Algorithm Based on Gaussian Diffusion
School of Computer Science and Technology, Zhejiang Sci-Tech University, Hangzhou, 310018, China
* Corresponding Author: Jie Feng. Email:
(This article belongs to the Special Issue: Metaheuristics, Soft Computing, and Machine Learning in Image Processing and Computer Vision)
Computers, Materials & Continua 2024, 79(1), 1481-1496. https://doi.org/10.32604/cmc.2024.048002
Received 24 November 2023; Accepted 22 January 2024; Issue published 25 April 2024
 View Full Text
 Download PDF
Abstract
Optical braille recognition methods typically employ existing target detection models or segmentation models for the direct detection and recognition of braille characters in original braille images. However, these methods need improvement in accuracy and generalizability, especially in densely dotted braille image environments. This paper presents a two-stage braille recognition framework. The first stage is a braille dot detection algorithm based on Gaussian diffusion, targeting Gaussian heatmaps generated by the convex dots in braille images. This is applied to the detection of convex dots in double-sided braille, achieving high accuracy in determining the central coordinates of the braille convex dots. The second stage involves constructing a braille grid using traditional post-processing algorithms to recognize braille character information. Experimental results demonstrate that this framework exhibits strong robustness and effectiveness in detecting braille dots and recognizing braille characters in complex double-sided braille image datasets. The framework achieved an F1 score of 99.89% for Braille dot detection and 99.78% for Braille character recognition. Compared to the highest accuracy in existing methods, these represent improvements of 0.08% and 0.02%, respectively.Keywords
Approximately 1.3 billion people globally suffer from various degrees of visual impairment [1], and braille is the foundational language for communication and learning among the visually impaired. Braille is composed of braille characters or units, arranged according to specific rules. Each braille unit consists of six raised or flat dots, arranged in three rows and two columns, totaling 64 different types of braille characters. Despite technological advancements providing new opportunities for the blind to receive and transmit information, braille remains frequently used in communication between the blind and sighted individuals. Sighted teachers working with blind students often need to handle textbooks and student work written in braille. However, sighted individuals dealing with braille text usually lack sufficient tactile skills to read with their fingers and are forced to use visual reading. Braille text has poor visual recognizability, making reading double-sided braille particularly challenging. Employing optical recognition methods for braille recognition can significantly improve work efficiency.
Braille cells detection and recognition are fundamental technologies of Optical Braille Recognition (OBR) systems and are key steps in achieving automatic reading and understanding of braille. In traditional methods, braille dot detection and character recognition are often conducted using image processing techniques [2–4] and machine learning methods [5,6]. However, these methods often face issues like low accuracy in braille dot detection and difficulty in handling complex braille images, hindering subsequent precise braille character recognition. Recently, rapid progress in deep learning-based object detection models [7–11] and segmentation models [12–16] has been observed. Many researchers have proposed methods for direct detection and recognition of braille characters in entire original braille images. These methods categorize by analyzing the structure of braille characters, enabling rapid recognition and data acquisition of braille. However, due to the scarcity of public braille datasets, the models’ generalization performance in braille recognition tasks is not prominent. The existing models, which are based on anchor box detection, often struggle with accurate Braille recognition when encountering densely packed Braille dots or when the distance between two Braille characters is too close. Despite significant advancements in segmentation tasks achieved by the U-Net segmentation model [17] and Gaussian diffusion techniques [18], their application in Optical Braille Recognition (OBR) has been limited. Several methods primarily focus on the classification of cropped Braille characters, which poses challenges for practical application in real-world scenarios.
This paper introduces BddNet, based on Gaussian diffusion for braille dot detection tasks and traditional algorithms for braille character recognition through braille dot construction. BddNet utilizes the principle of Gaussian diffusion, based on U-Net for probability statistics of each braille dot center, adapting well to the task of braille dot recognition and enhancing overall task accuracy. It further uses high-accuracy braille dots for character matching, ultimately recognizing braille characters.
The main contributions of this paper are:
1. We expanded the public braille dataset DSBI by sourcing 53 images of braille books from other sources.
2. We proposed the U-Net-based braille dot detection network BddNet, which uses Gaussian diffusion to determine the probability of braille dot center coordinates and employs post-processing algorithms to convert the probability map into braille dot center detection.
3. We introduced a post-processing algorithm for braille dot clustering based on horizontal and vertical distances, generating braille character information by matching the detected dots according to rules.
Optical Braille Recognition (OBR) systems have been developing since the 1990s [19]. Traditional image processing techniques have been widely used. Antonacopoulos et al. introduced a local adaptive method that segmented braille images into three parts, including shadows, lights, and background, then recognized braille convex and concave dots through the combination rules of these parts. They also constructed a braille grid based on the arrangement rules of braille, translating braille dots into characters. However, these methods were sensitive to segmentation and the designed rules.
To overcome these limitations, some approaches have employed machine learning techniques for braille dot recognition. Li et al. used Haar’s cascade classifier for rapid braille dot detection. TS-OBR employed Haar's cascade classifiers for rapid braille dot detection and utilized Support Vector Machine (SVM) with a sliding window strategy for braille dot recognition. Recently, Li et al. proposed a two-stage learning framework for recognizing double-sided braille images. In the first stage, a cascade classifier with Haar features was used for rapid braille dot detection, followed by image deskewing and braille cell construction. They also employed multiple SVM classifiers with HOG or LBP features [20] in the second stage for further classification at each grid intersection. However, traditional machine learning methods have certain limitations in enhancing accuracy.
More recently, researchers have attempted to use deep learning techniques for direct detection and recognition of braille characters in original braille images. Li et al. introduced BraUNet [21], a deep learning segmentation model based on U-Net that captures more low-level features through long-distance connections between the encoder and decoder, facilitating the extraction of individual braille character regions. Additionally, Ovodov proposed AnglinaNet [22], a model based on the RetinaNet object detection algorithm, which detects the position of braille characters after perspective transformation of images. Due to the small scale of publicly available braille datasets, deep learning methods require extensive training data to enhance accuracy, making them less applicable to complex braille images.
Addressing these issues, this paper presents BddNet, a deep learning-based framework for braille dot detection tasks. Notably, the dataset samples for braille dot detection far exceed those for braille character samples. Furthermore, the DSBI dataset was expanded to assess the model’s generalization capabilities.
This paper applies semantic segmentation methods from natural image analysis to the task of optical braille dot recognition. We propose a universal and robust Optical Braille Recognition (OBR) framework based on the U-Net-derived braille dot detection network BddNet and traditional post-processing algorithms. Compared to existing methods that directly detect braille characters in braille images, our proposed framework structure is more suitable for the accurate detection of braille characters and generalization of detected braille data. The framework proposed in this paper, in contrast to existing methods that directly detect Braille characters in Braille images, targets the detection of Braille dots. At the dataset level, it employs a more dense annotation approach for Braille dots, significantly exceeding the quantity of annotations for Braille characters. Consequently, compared to other models, our model demonstrates superior performance in complex scenarios and exhibits stronger generalization capabilities. Fig. 1 illustrates our proposed framework. We re-annotated the existing public braille dataset DSBI for braille dots, which were then input into the semantic segmentation network BddNet, based on Gaussian diffusion, for training and testing. Subsequently, we used a traditional algorithm based on horizontal and vertical distances for braille dot clustering to form the required braille characters, ultimately recognizing these characters. We will detail our framework in the following sections.

Figure 1: Illustrates our proposed framework for braille character detection and recognition
Our primary goal is to precisely locate each individual braille dot in braille images. To achieve this, we propose a high-performance network for our Optical Braille Recognition (OBR) task, based on U-Net and augmented with additional techniques based on Gaussian diffusion to enhance feature learning capabilities. Fig. 2 depicts the training framework of the BddNet model.

Figure 2: The training framework of the BddNet model
This text utilizes a fully convolutional network architecture based on ResNet-50 [23] as its backbone, divided into an encoder (downsampling) and a decoder (upsampling). The encoder employs ResNet-50 to extract image features, with its lightweight structure and smaller parameter scale ensuring efficient performance while meeting task requirements. The decoder uses transpose convolution layers (also known as deconvolution layers) for upsampling the features, retaining more detail information. Remote connections between the encoder and decoder link feature maps of corresponding sizes, enhancing the accuracy of low-level edge prediction. The final decoded output channels serve as the region score maps for braille dots.
For each training braille image, we generate a base truth label for the dot region score using the bounding box of each braille dot in the image. The region score represents the probability that a given pixel is the center of a braille dot. We encode the probability of braille dot centers using Gaussian heatmaps. Gaussian heatmaps apply a Gaussian distribution function to the location of each keypoint, generating a Gaussian heatmap centered on that keypoint to denote its position. By generating Gaussian heatmaps, we can easily locate an object or feature within an image, thereby enhancing the accuracy and robustness of computer vision algorithms. Gaussian heatmaps are somewhat akin to soft labels in classification problems, adding a gradual distribution process at the target location, which helps the network more smoothly find the gradient descent process. Specifically, the Gaussian distribution function centered on a keypoint will attain its maximum value at that point and gradually decrease as the distance from the center increases. Their definition is as follows:
where
When generating Gaussian heatmaps using braille dots, we consider the center position of the braille dot as the heat source, that is, the location of
where A represents the amplitude,
We set the heatmap range for each braille dot, calculating the heat flow density values within the range of each braille dot, thereby obtaining the Gaussian heatmap, as illustrated in Fig. 3.

Figure 3: Gaussian heatmap of braille dots
Due to the high degree of flexibility offered by Gaussian heatmaps in processing non-rigid braille images, we adopt heatmaps based on Gaussian diffusion to determine the probability statistics of the central area of braille convex dots.
In the task of braille dot detection, the choice of the loss function is crucial. The loss function is used to measure the discrepancy between the model’s predictions and the actual results, thereby guiding the direction of model optimization. In this paper, we have ultimately chosen the L2 loss function and compared it with the L1 loss function [24].
L2 and L1 loss functions are two commonly used loss functions, differing in their computational methods and effects on model optimization. The L2 loss function involves squaring the differences between the predicted and actual values, summing these squares, and then taking the square root of this sum. On the other hand, the L1 loss function involves summing the absolute differences between the predicted and actual values. Specifically, the mathematical expressions for L1 and L2 loss functions are as follows:
where
In the task of braille dot detection, the application of the L2 loss function has several unique advantages. Firstly, the computation of the L2 loss function is relatively straightforward, facilitating its execution on devices with limited computational resources. Secondly, the gradient calculation of the L2 loss function is more stable, which aids in enhancing the training effectiveness of our proposed model. Moreover, the L2 loss function is sensitive to outliers, allowing it to better guide the model to focus on important features within the data.
3.3.1 Post-Processing Algorithm for Braille Convex Dot Detection
The Gaussian heatmap detection model used in this paper differs from other detection models in that its network output only forms a distribution map of probability statistics, rather than directly outputting the coordinates of pixels with the highest regional probability. This means the model’s output is a heatmap representing the probability of each pixel belonging to a braille dot, rather than a definite location of braille dots.
To address this issue, Each Braille document comprises hundreds of Braille characters, each contained within a rectangular block known as a Braille cell. This cell contains six Braille dots arranged in a grid of three rows and two columns. These six dots can be small protrusions, often referred to as embossed or raised dots, representing specific Braille characters. Typically, the Braille cell grid is a regular matrix, where the distances between the horizontal and vertical lines are uniform. Consequently, we have employed traditional algorithms as the post-processing method for our model. Specifically, we first set a regional probability threshold, threshold. The purpose of this threshold is to filter out areas with higher probabilities for subsequent 4-adjacency connected component analysis. We mark the parts of the probability area where threshold is greater than 0.5 as potential braille dot regions.
Next, we perform connected component analysis on these potential braille dot regions. Connected component analysis is an image processing algorithm that identifies continuous regions in an image with the same attributes. In the task of braille dot recognition, we consider continuous regions within the braille dot range with a probability value greater than threshold as a connected component. Through connected component analysis, we can divide the potential braille dot regions into multiple independent braille dots.
Finally, we output braille dot detection boxes based on the results of connected component analysis, as shown in Fig. 4. Each detection box represents an independent braille dot, and its center is the coordinate of the braille convex dot. Through this method, we can convert the model’s output of probability statistical distribution maps into specific braille dot location coordinates. It is important to note that the effectiveness of this post-processing algorithm depends on the choice of threshold and the parameter settings of the connected component analysis. Therefore, it needs to be adjusted and optimized according to specific situations in practical applications.

Figure 4: Braille dot range detection using connected component analysis
3.3.2 Post-Processing Algorithm for Braille Dot Clustering Based on Horizontal and Vertical Distances
Each braille image consists of hundreds of braille characters, and each braille character occupies a rectangular block known as a braille cell, containing six braille dots arranged in three rows and two columns. These dots can be small protrusions, referred to as raised dots, or flat, to represent a specific braille character.
With the aforementioned network structure, only the coordinate information of braille dots can be detected, without displaying the braille character information in the braille image. Therefore, we introduce a robust and flexible method to construct a braille information grid through statistical information. The braille information grid can be dynamically generated based on the distribution of braille dots. Our method consists of four steps: Horizontally detecting braille dot coordinate information and constructing horizontal braille line equations; vertically detecting braille dot coordinate information and constructing vertical braille line equations; calculating the intersection points of vertical and horizontal braille line equations to construct pseudo braille character information grid points; and obtaining braille character information through rule matching with the detected braille dots. The Braille Character Recognition Algorithm is as follows.

To construct horizontal braille line equations, we arrange the braille dot coordinates (x, y) in ascending order based on the y-coordinate, setting a threshold range for the y-coordinate. When the y-coordinate values of two points fall within the threshold range, they belong to the same horizontal braille line.
For example: D1 (
For the braille dot coordinates on the same braille line, we fit the equation of the horizontal braille line. The fitting curve method is linear least squares, and the basic idea is as follows:
In the formula:
Braille lines are regularly spaced straight lines. Therefore, when fitting the braille line, the highest order term is generally linear.
To construct vertical braille line equations, we arrange the braille dot coordinates (
For example: D1(
We then fit the equation of the vertical braille line for the braille dot coordinates on the same braille line. As illustrated in Fig. 5, we proceed with the construction of braille lines.

Figure 5: Construction of horizontal and vertical braille lines
Construction of Pseudo Braille Character Information Grid Points. By using the equations of horizontal and vertical braille lines, we calculate the intersection points (
where
The intersection points calculated are then arranged to form pseudo braille information grid points, as shown in Fig. 6.

Figure 6: Pseudo braille information grid points
Construction of Braille Character Information. We set a threshold and calculate the distance between the model-detected points (
After removing the superfluous pseudo braille character information grid points, we construct the required braille character information, as shown in Fig. 7.

Figure 7: Construction of braille character information
The availability of public datasets for braille research is limited. Here, we introduce a dataset, DSBI [25], which contains 114 double-sided braille images obtained by a 200 dpi scanner with a resolution of 1700 × 2338 pixels. Notably, this dataset originates from six different braille books, covering various domains such as massage, professional textbooks, and novels.
The training set in the DSBI dataset includes 26 braille images, consisting of 27,846 braille dots, while the test set contains 88 braille images from all books, with a total of 94,271 braille dots. This dataset also provides original braille images and deskewed images.
For the deep learning model BraUNet, proposed by Li et al. [21] for direct detection of braille character information, it was necessary to re-partition the DSBI dataset into training and test sets to increase training data for better model performance. However, we chose to use the original training and test sets provided by the dataset, but not the original annotation information. Instead, we re-annotated the images in the dataset. Specifically, we replaced the row and column position information, which was originally the only information provided, with the central pixel coordinate information of the braille convex dots in the image data. Additionally, we did not annotate braille concave dots, thereby saving a significant amount of annotation time.
Furthermore, to better evaluate our created braille dot detection model framework and to better understand and assess the performance of braille dot detection, we expanded the publicly available DSBI dataset. We sourced 53 images of braille books from other braille books, averaging over 1300 braille dots per page. This allows for a more comprehensive assessment of the model’s performance, identification of potential flaws, and evaluation of the model’s stability and robustness. Information about the two datasets is shown in Table 1.

We utilized a range of evaluation metrics including precision, recall, and F1 score for a comprehensive assessment of the proposed method. In our approach, Braille dot centers predicted by the model are classified as True Positives (
where
4.3.1 Experimental Setup and Details
We configured the training parameters for the network BddNet with a learning rate of 1e-7, 200 epochs, and the optimizer set to SGD. The software platform used includes Ubuntu 22.04, Python 3.7.11, Pytorch 1.10.0, Cuda 11.3, and Cudnn 8. On the hardware side, we utilized an i5 CPU and a GPU 3060 to implement our proposed braille detection framework.
To evaluate the effectiveness and superiority of our proposed method, we conducted detailed experimental comparative analyses, comparing our approach with Ovodov’s deep learning-based object detection model AnglinaNet, Li’s semantic segmentation-based braille character detection model BraUNet, and the traditional machine learning method TS-OBR for braille dot detection.
Specifically, our proposed method and those of Ovodov and Li directly detect braille characters using deep learning. Ovodov’s method is an optical braille recognition approach using the existing object detection convolutional neural network model RetinaNet to detect entire characters at once. Their algorithms are robust to deformations and perspective distortions of braille pages in images. Both their methods detect entire braille characters at once, using the semantic segmentation model BraUNet for pixel-level detection and classification of braille characters. TS-OBR employs machine learning methods (Haar + Adaboost) for braille dot detection, adapting better to the task of detecting braille.
All models of AnglinaNet, BraUNet, and TS-OBR proposed by Ovodov were trained on the public double-sided braille dataset DSBI, and we evaluated the performance of these models.
4.3.2 Results of Gaussian Heatmap Range Comparison
Here, we propose a semantic segmentation neural network based on Gaussian diffusion. The most distinctive feature of this network is that it treats the center of braille convex dots as the point of maximum probability and diffuses this probability outwards in a Gaussian manner, gradually decreasing with increasing distance from the center. In the DSBI dataset, since the distance between braille convex dots is relatively small, determining the Gaussian diffusion range for a braille convex dot is crucial for the entire network model’s training and testing results, directly affecting the model’s performance. If the Gaussian diffusion range is too large, it may affect the detection accuracy of adjacent braille convex dots, while too small a range may lead to poorer detection of the corresponding braille dots.
To explore the impact of Gaussian diffusion range on model performance, we conducted comparative experimental studies and summarized the results in Table 2. As can be seen from the table, setting different Gaussian diffusion ranges of 3 × 3, 5 × 5, and 7 × 7 does not continuously improve the model’s performance metrics. When the Gaussian range reaches 5 × 5, the model achieves optimal performance in detecting braille dots, with all metrics reaching their best levels.

In summary, through experimental comparative analysis, we have verified the significant impact of Gaussian diffusion range on model performance. In our method, when the Gaussian range is set to 5 × 5, the model exhibits optimal performance in braille dot detection, demonstrating superior generalization ability and accuracy.
Additionally, to improve the efficiency of annotating braille dots, we adopted a semi-automatic annotation method. For the 26 training images, we manually annotated 7 images first, totaling 7785 braille convex dots. After training the model with these 7 images, we annotated the subsequent training set images using the pre-trained model, followed by manual verification and correction, significantly accelerating the annotation process.
4.3.3 Braille Convex Dot Detection Results
Table 3 shows the performance of various methods, including Haar, HOG, LBP, SVM, SVM Grid, TS-OBR, and our proposed method, in braille dot detection on the DSBI dataset and DSBI (extend) dataset. We used precision, recall, and F1 score metrics for a comprehensive evaluation of these methods. For a fair comparison of different methods, the DSBI dataset used 26 training images and 88 test images for model training and testing.

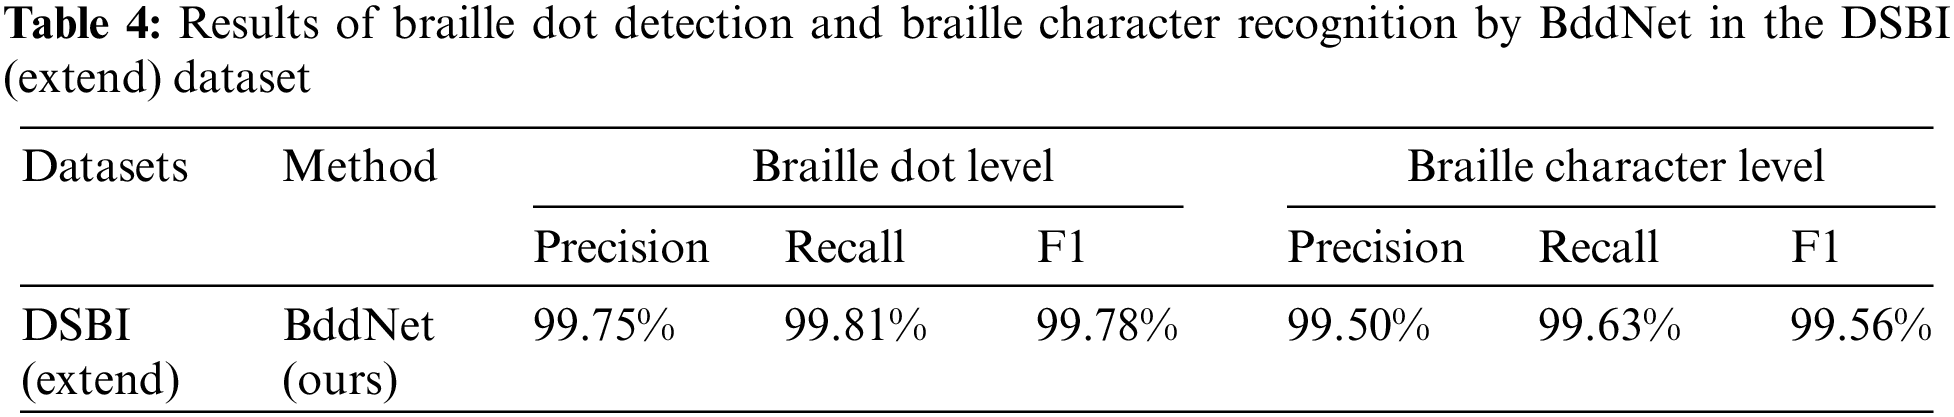
Despite the challenges posed by double-sided braille datasets, which are influenced by the concave dots in the images, Table 3 reveals that both traditional machine learning methods and our proposed semantic segmentation method based on Gaussian diffusion exhibit commendable performance in this challenging task. However, our braille dot detection method achieved the best technical indicators, improving accuracy by 0.22% and F1 score by 0.09% compared to the highest precision of TS-OBR. It is worth noting that the BddNet proposed in this article still surpasses the speed of the currently fastest model in braille dot detection by 0.75 s. In the expanded DSBI (extend) dataset, it also performed well, achieving an accuracy of 99.75%, as shown in Table 4.
It is worth noting that AnglinaNet, proposed by Ovodov et al., also discussed braille dot detection metrics. However, their approach involved deducing braille dot information after one-time detection of braille character information, rather than directly using a model framework to detect the pixel positions of braille dots. Therefore, we did not compare their method with ours here.
4.3.4 Braille Character Detection Results
Table 5 presents the performance of BraUNet, Ovodov’s object detection model, and our method in braille character detection on the DSBI dataset and the expanded DSBI (extend) dataset. Similar to the previous braille dot detection performance analysis, we used precision, recall, and F1 score metrics for a comprehensive evaluation of these methods. It is important to note that due to different frameworks, the division of the DSBI dataset we used was entirely consistent with the original DSBI dataset’s division. In contrast, both BraUNet and Ovodov’s methods re-partitioned the DSBI dataset, specifically expanding the training set to 84 images and the test set to 30 braille images.
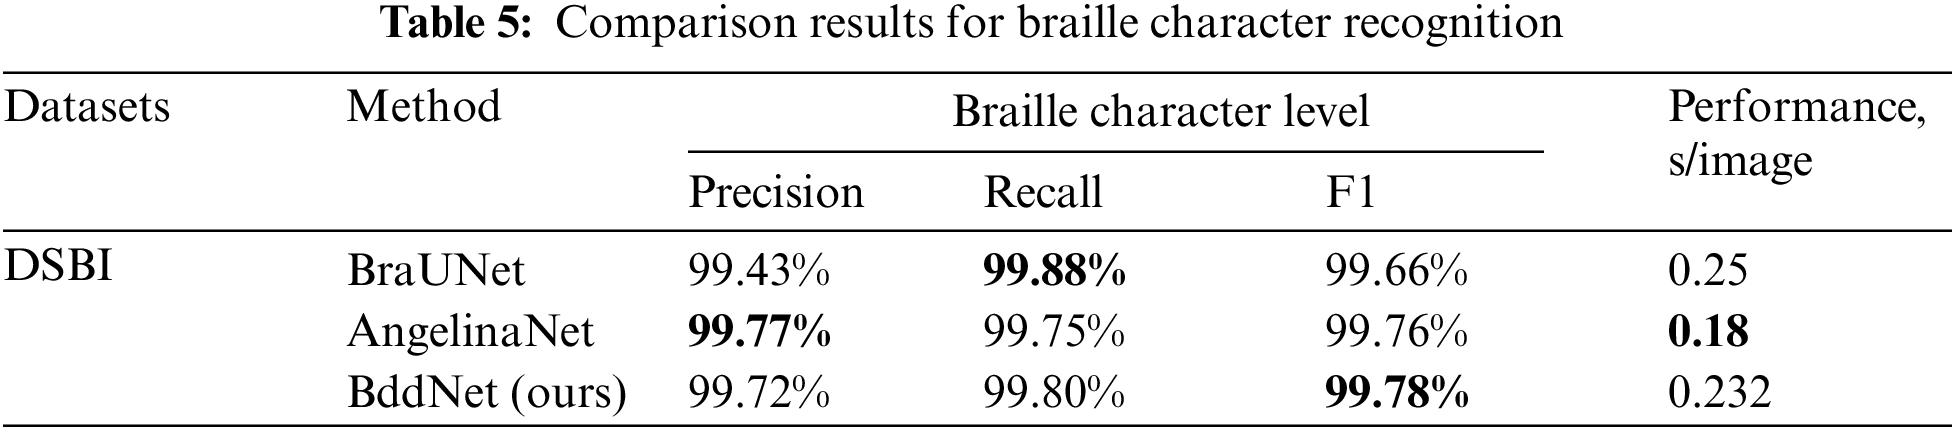
Despite this, our proposed method still achieved notable results in technical indicators, as shown in Fig. 8, achieving 99.72% accuracy, 99.80% recall, and 99.78% F1 score. In terms of F1 score, this was a 0.02% improvement over existing technologies. In contrast, due to our braille recognition being a two-stage framework, there is some time loss in the braille recognition task. In the DSBI (extend) dataset, it achieved 99.50% accuracy, 99.63% recall, and 99.56% F1 score, as shown in Table 4.

Figure 8: Results of braille character recognition
However, our framework also has certain limitations. For instance, as observed in Fig. 9, a notable phenomenon occurs with the increase in light intensity: The framework we employ exhibits a decline in precision in recognizing Braille dots. This finding indicates that the system’s performance might be compromised under high illumination conditions, leading to a reduction in the accuracy of Braille recognition. Specifically, an increase in light intensity can cause image overexposure, resulting in blurred edges of the Braille dots, which directly impacts the effectiveness of the pattern recognition algorithms. Therefore, this observation suggests that future design and optimization of such recognition systems should place greater emphasis on the impact of environmental lighting conditions and explore more robust methods to address varying illumination environments, ensuring accurate recognition of Braille dots.

Figure 9: Comparison of braille dot recognition under different lighting conditions
This paper presents a framework for the detection of Braille dots and recognition of Braille characters in entire Braille images. The framework employs a two-stage approach. Initially, it utilizes a Braille dot detection network, BddNet, based on Gaussian diffusion, which is particularly suited for detecting raised dots in double-sided Braille. Compared to existing methods, BddNet achieves an optimal detection F1 score of 99.89%, demonstrating superior detection performance. Subsequently, a post-processing algorithm is applied to obtain the final Braille character recognition results, achieving an F1 score of 99.78%, which also represents the best recognition performance to date. Our proposed framework is effective and versatile, capable of detecting and recognizing Braille characters in raw Braille images. The robustness and efficacy of this method have been validated through experiments on the public double-sided Braille image dataset DSBI and its expanded version.
We acknowledge that the current Braille dataset still lacks diversity, especially in complex scenarios involving page curvature and variations in lighting conditions. These factors continue to pose significant challenges to the accuracy of our model’s detection capabilities. To overcome these limitations, there is an urgent need to collect a larger and more varied set of Braille images. These images should encompass a wide range of real-world scenarios, including different page orientations, various degrees of curvature, diverse lighting conditions, and a variety of Braille cell sizes. In future research, this enriched dataset will enable us to rigorously test and enhance the performance of the Optical Braille Recognition (OBR) system. By exposing the model to a broader spectrum of realistic conditions, we aim to improve its ability to accurately detect and interpret Braille in a multitude of challenging environments.
Acknowledgement: Not applicable.
Funding Statement: The authors received no specific funding for this study.
Author Contributions: Study conception and design: Zezheng Meng, Jie Feng; data collection: Zezheng Meng, Zefeng Cai; analysis and interpretation of results: Jie Feng, Shaohua Li, Haixiang Zhang, Hanjie Ma; draft manuscript preparation: Zezheng Meng. All authors reviewed the results and approved the final version of the manuscript.
Availability of Data and Materials: The data used in the study is publicly available in https://github.com/yeluo1994/DSBI, and the code can be obtained from the corresponding author under reasonable circumstances.
Conflicts of Interest: The authors declare that they have no conflicts of interest to report regarding the present research.
References
1. J. Németh, “Preventing blindness and visual impairment in Europe: What do we have to do?,” Eur. J. Ophthalmol., vol. 29, no. 2, pp. 129–132, 2019. doi: 10.1177/1120672118819397 [Google Scholar] [PubMed] [CrossRef]
2. S. Isayed and R. Tahboub, “A review of optical braille recognition,” in Proc. WSWAN, Sousse, Tunisia, 2015, pp. 1–6. [Google Scholar]
3. A. Antonacopoulos and D. Bridson, “A robust braille recognition system,” in Proc. DAS, 2004, pp. 533–545. [Google Scholar]
4. M. Y. Babadi and S. Jafari, “Novel grid-based optical braille conversion: From scanning to wording,” Int. J. Electron., vol. 98, no. 12, pp. 1659–1671, 2011. doi: 10.1080/00207217.2011.609975. [Google Scholar] [CrossRef]
5. R. Li, H. Liu, X. Wang, and Y. Qian, “Effective optical braille recognition based on two-stage learning for double-sided braille image,” in Proc. PRICAI, vol. 11672, pp. 150–163, 2019. doi: 10.1007/978-3-030-29894-4. [Google Scholar] [CrossRef]
6. L. Li and X. Yan, “Optical braille character recognition with support-vector machine classifier,” in Proc. ICCASM2010, vol. 12, pp. V12–219, 2010. doi: 10.1109/ICCASM.2010.5622245. [Google Scholar] [CrossRef]
7. J. Redmon, “You only look once: Unified, real-time object detection,” in Comput. Vis. & Pattern Recognit. IEEE, Las Vegas, Nevada, USA, 2016, pp. 779–788. [Google Scholar]
8. W. Liu et al., “SSD: Single shot multibox detector,” in Comput. Vis.-ECCV 2016: 14th Eur. Conf., Amsterdam, North Holland, The Netherlands, 2016, pp. 21–37. [Google Scholar]
9. C. Y. Wang, A. Bochkovskiy, and H. Y. M. Liao, “YOLOv7: Trainable bag-of-freebies sets new state-of-the-art for real-time object detectors,” in Proc. IEEE/CVF Conf. Comput. Vis. Pattern Recognit., Vancouver, BC, Canada, 2023, pp. 7464–7475. [Google Scholar]
10. S. Ren, K. He, R. Girshick, and J. Sun, “Faster R-CNN: Towards real-time object detection with region proposal networks,” Adv. Neural Inf. Process. Syst., vol. 28, 2015. [Google Scholar]
11. J. Redmon, S. Divvala, R. Girshick, and A. Farhadi, “You only look once: Unified, real-time object detection,” in Proc. IEEE Conf. Comput. Vis. Pattern Recognit., Las Vegas, Nevada, USA, 2016, pp. 779–788. [Google Scholar]
12. V. Badrinarayanan, A. Kendall, and R. Cipolla, “SegNet: A deep convolutional encoder-decoder architecture for image segmentation,” IEEE Trans. Pattern Anal. Mach. Intell., vol. 39, no. 12, pp. 2481–2495, 2017. doi: 10.1109/TPAMI.2016.2644615 [Google Scholar] [PubMed] [CrossRef]
13. L. C. Chen, G. Papandreou, I. Kokkinos, K. Murphy, and A. L. Yuille, “Deeplab: Semantic image segmentation with deep convolutional nets, atrous convolution, and fully connected CRFs,” IEEE Trans. Pattern Anal. Mach. Intell., vol. 40, no. 4, pp. 834–848, 2017. doi: 10.1109/TPAMI.2017.2699184 [Google Scholar] [PubMed] [CrossRef]
14. P. Arbeláez, M. Maire, C. Fowlkes, and J. Malik, “Contour detection and hierarchical image segmentation,” IEEE Trans. Pattern Anal. Mach. Intell., vol. 33, no. 5, pp. 898–916, 2011. doi: 10.1109/TPAMI.2010.161 [Google Scholar] [PubMed] [CrossRef]
15. P. F. Felzenszwalb and D. P. Huttenlocher, “Efficient graph-based image segmentation,” Int. J. Comput. Vis., vol. 59, no. 2, pp. 167–181, 2004. doi: 10.1023/B:VISI.0000022288.19776.77. [Google Scholar] [CrossRef]
16. R. Achanta, A. Shaji, K. Smith, A. Lucchi, P. Fua and S. Süsstrunk, “SLIC superpixels compared to state-of-the-art superpixel methods,” IEEE Trans. Pattern Anal. Mach. Intell., vol. 34, no. 11, pp. 2274–2282, 2012. doi: 10.1109/TPAMI.2012.120 [Google Scholar] [PubMed] [CrossRef]
17. O. Ronneberger, P. Fischer, and T. Brox, “U-Net: Convolutional networks for biomedical image segmentation,” in Proc. MICCAI, vol. 9351, pp. 234–241, 2015. doi: 10.1007/978-3-319-24574-4. [Google Scholar] [CrossRef]
18. Y. Baek, B. Lee, D. Han, S. Yun, and H. Lee, “Character region awareness for text detection,” in Proc. CVPR, Long Beach, California, USA, 2019, pp. 9365–9374. [Google Scholar]
19. J. Mennens, L. V. Tichelen, G. Francois, and J. J. Engelen, “Optical recognition of braille writing,” in Proc. ICDAR, Tsukuba, Ibaraki, Japan, 1993, pp. 428–431. [Google Scholar]
20. Z. Khanam and A. Usmani, “Optical braille recognition using circular hough transform,” arXiv preprint arXiv:2107.00993, 2021. [Google Scholar]
21. R. Li, H. Liu, X. Wang, J. Xu, and Y. Qian, “Optical braille recognition based on semantic segmentation network with auxiliary learning strategy,” in Proc. CVPR, Seattle, WA, USA, 2020, pp. 554–555. [Google Scholar]
22. I. G. Ovodov, “Optical braille recognition using object detection neural network,” in Proc. ICCV, Seattle, WA, USA, 2021, pp. 554–555. [Google Scholar]
23. K. He, X. Zhang, S. Ren, and J. Sun, “Deep residual learning for image recognition,” in Proc. IEEE Conf. Comput. Vis. Pattern Recognit., Las Vegas, Nevada, USA, 2016, pp. 770–778. [Google Scholar]
24. H. Zhao, O. Gallo, I. Frosio, and J. Kautz, “Loss functions for image restoration with neural networks,” IEEE Trans. Comput. Imaging, vol. 3, no. 1, pp. 47–57, 2017. doi: 10.1109/TCI.2016.2644865. [Google Scholar] [CrossRef]
25. R. Li, H. Liu, X. Wang, and Y. Qian, “DSBI: Double-sided braille image dataset and algorithm evaluation for braille dots detection,” in Proc. ICVIP, 2018, pp. 65–69. [Google Scholar]
Cite This Article
 Copyright © 2024 The Author(s). Published by Tech Science Press.
This work is licensed under a Creative Commons Attribution 4.0 International License , which permits unrestricted use, distribution, and reproduction in any medium, provided the original work is properly cited.
 Downloads
 Citation Tools