
 Submit a Paper
 Propose a Special lssue
 Open Access
ARTICLE

Multi-Objective Optimization Algorithm for Grouping Decision Variables Based on Extreme Point Pareto Frontier
1 College of Computer Science and Technology, Shenyang University of Chemical Technology, Shenyang, 110142, China
2 Key Laboratory of Intelligent Technology for Chemical Process Industry of Liaoning Province, Shenyang University of Chemical Technology, Shenyang, 110142, China
3 Industrial Engineering Department, College of Engineering, King Saud University, P.O. Box 800, Riyadh, 11421, Saudi Arabia
* Corresponding Author: Funan Peng. Email:
(This article belongs to the Special Issue: Recent Advances in Ensemble Framework of Meta-heuristics and Machine Learning: Methods and Applications)
Computers, Materials & Continua 2024, 79(1), 1281-1299. https://doi.org/10.32604/cmc.2024.048495
Received 09 December 2023; Accepted 04 March 2024; Issue published 25 April 2024
 View Full Text
 Download PDF
Abstract
The existing algorithms for solving multi-objective optimization problems fall into three main categories: Decomposition-based, dominance-based, and indicator-based. Traditional multi-objective optimization problems mainly focus on objectives, treating decision variables as a total variable to solve the problem without considering the critical role of decision variables in objective optimization. As seen, a variety of decision variable grouping algorithms have been proposed. However, these algorithms are relatively broad for the changes of most decision variables in the evolution process and are time-consuming in the process of finding the Pareto frontier. To solve these problems, a multi-objective optimization algorithm for grouping decision variables based on extreme point Pareto frontier (MOEA-DV/EPF) is proposed. This algorithm adopts a preprocessing rule to solve the Pareto optimal solution set of extreme points generated by simultaneous evolution in various target directions, obtains the basic Pareto front surface to determine the convergence effect, and analyzes the convergence and distribution effects of decision variables. In the later stages of algorithm optimization, different mutation strategies are adopted according to the nature of the decision variables to speed up the rate of evolution to obtain excellent individuals, thus enhancing the performance of the algorithm. Evaluation validation of the test functions shows that this algorithm can solve the multi-objective optimization problem more efficiently.Keywords
List of Abbreviations
| EAs | Evolutionary algorithms |
| MOP | Multi-objective optimization problem |
| MOEA-DV/EPF | Multi-objective optimization algorithm for grouping decision variables based on extreme point Pareto frontier |
| NSGA-III | Non-dominated sorting genetic algorithm-III |
| MOEA/DD | An evolutionary many-objective optimization algorithm based on dominance and decomposition |
| KnEA | A knee point-driven evolutionary algorithm for many-objective optimization |
| MOEA/D | Multi-objective evolutionary algorithm based on decomposition |
| OD-RVEA | Decomposition-based sub-problem optimal solution updating direction-guided evolutionary many-objective algorithm |
| R2-EMOA | Focused multiobjective search using R2-indicator-based selection |
| HV | Hypervolume |
| MOFDO | Multi-objective fitness-dependent optimizer algorithm |
| MOEA/DVA | A multiobjective evolutionary algorithm based on decision variable analyses for multiobjective optimization problems with large-scale variables |
| LMEA | A decision variable clustering-based evolutionary algorithm for large-scale many-objective optimization |
| PS | Pareto optimal solution set |
| PF | Pareto frontier |
| PBI | Penalty-based boundary intersection |
| DTLZ | Deb-Thiele-Laumanns-Zitzler |
| WFG | Walking fish group |
| ZDT | Zitzler-Deb-Thiele |
| SBX | Simulated binary crossover |
| GD | Generational distance |
| MS | Maximum spread |
| IGD | Inverted generational distance |
As time progresses and continues to develop, the needs of the production industry become increasingly complex, and multi-objective problems gradually appear in the public eye. The keys to solving these problems are evolutionary algorithms, decision variable influencing factors, and decision variable grouping methods (e.g., random grouping, linear grouping, ordered grouping, and differential grouping [1,2]) are of great importance to solving the problems. The decision on how to solve multi-objective optimization problems using optimal strategies has attracted extensive attention from researchers and practitioners.
Evolutionary algorithms (EAs) are an essential vehicle in problem-solving, which serve to generate multiple approximate solutions with good characteristics at once. Many real-world problems can be solved based on evolutionary algorithms. For example, improving the fireworks algorithm for the protein-ligand docking problem [3,4]. Different evolutionary algorithms are utilized for drone path planning [5], multi-objective deep neural network architecture search [6], and so on [7–10]. The fundamental aspect of tackling multi-objective problems involves recognizing the varying strengths and weaknesses of different evolutionary algorithms. This involves applying different algorithms to optimize objectives specific to each situation, thereby achieving the utmost performance by aligning the algorithm selection with the unique characteristics of the given problem [11]. Multi-objective optimization problem (MOP) [12] refers to a situation when the number of objectives is two or more. Its main aim is to address the balance between convergence pressure and the difficulty of diversity management, with researchers proposing various solutions to these challenges [13,14]. It can be classified into the following categories according to its evolutionary approach.
The first category is based on the Pareto dominance relation, which can enhance the convergence ability of multi-objective by modifying the Pareto dominance advantage, such as adaptive objective function dominance relation ε-dominance [15], preference ranking scheme [16], fuzzy multi-objective programming [17], etc. Some ideas consider not only dominance metrics but also other convergence metrics, such as a reference-point-based many-objective evolutionary algorithm(NSGA-III): Adaptive in updating and including new reference points on the fly [2], ε-domination-based Two_Arch2 algorithm [18], an evolutionary many-objective optimization algorithm based on dominance and decomposition (MOEA/DD) [19], a knee point-driven evolutionary algorithm for many-objective optimization (KnEA) [20], etc.
The second category depends upon the idea of decomposition, where the multi-objective is divided into several sub-problems to be optimized. The most basic one is a multiobjective evolutionary algorithm based on decomposition (MOEA/D) [21]. There are also decomposition algorithms such as decomposition-based sub-problem optimal solution updating direction-guided evolutionary many-objective algorithm (OD-RVEA) [22], the adaptive weight adjustment algorithm [23], the Pareto sampling algorithm [24], the external archive-based guidance [25], and the reference vector-based guidance [26].
The third category is concerned with evaluation metrics that decide the set of non-dominated solutions that are indistinguishable from the traditional Pareto dominance relations according to their metrics. Such as a two-stage R2 indicator based evolutionary algorithm [27], focused multiobjective search using R2-indicator-based selection (R2-EMOA) [28], an algorithm for fast hypervolume-based many-objective optimization (HV) [29], and other algorithms [30–33].
In the process of evolution, the adaptability of the solution also determines the quality of the algorithm. The multi-objective fitness correlation optimization algorithm (MOFDO) [34] proposes a multi-objective fitness correlation optimizer, which uses additional storage space to save previous steps for reuse in future iterations. Hypercube grid is used to help select local and global guide individuals for optimization, which provides an effective method for fast selection of solution sets. Although these evolutionary algorithms can guarantee the convergence and diversity of the sought solutions at the same time, all decision variables are treated as a whole in the optimization process, resulting in interference between these variables, resulting in reduced algorithm efficiency. To address the complexity of MOP problems, a method for simplifying these challenges is proposed. The idealized method can be roughly summarized as dividing the high-dimensional target into multiple simple low-dimensional subfunctions.
At present, one of the key factors that complicate multi-objective problems and make them difficult to decompose and optimize is the different effects of decision variables [35]. Inspired by the decomposition algorithm and combined with its influence, the decision variables are decomposed, which means dividing them into sub-components with different effects. Ma et al. proposed a multi-objective optimization algorithm based on decision variable analysis, abbreviated as MOEA/DVA [36]. This algorithm analyzes and groups decision variables based on dominance relationships, dividing them into three categories: Positional variables, distant variables, and mixed variables. Mixed variables include both convergent and distributed variables, which do not allow for an accurate distinction between the roles of different decision variables. Zhang et al. proposed a decision variable clustering-based evolutionary algorithm for large-scale many-objective optimization, abbreviated as LMEA [37]. This grouping method solves the problem of mixed variables being indivisible.
Regarding the “divide and conquer” method, simply applying concepts from single-objective optimization cannot effectively solve multi-objective problems. In multi-objective problems, objectives often conflict with each other. This conflict arises from the continuous disturbance of decision variables, resulting in a diverse set of incomparable solutions. To solve a multi-objective problem, specifically, conflict is used to identify a set of Pareto-optimal solutions rather than a single, isolated solution. Convergent variables, due to their influence on the evolution of generated solutions, are considered the primary factor influencing conflicts in objective functions. Therefore, allowing individual solutions to converge is the key to solving multi-objective optimization.
The key to solving multi-objective optimization problems is to allow the solution convergence. This means that we need to find a way so that the solution gradually approaches the set of Pareto optimal solutions over the course of evolution. This article focuses on the changing trend of decision variables, accurately finds the convergent variables, and deeply studies the influence of convergent variables on the generated solutions in order to better solve the multi-objective optimization problem. Therefore, this article proposes a multi-objective optimization algorithm for grouping decision variables based on the extreme point Pareto frontier (MOEA-DV/EPF). The algorithm can quickly identify convergent variables. The overall idea is as follows. First, a preprocessing algorithm optimizes each direction of the multi-target, obtaining an extremum point Pareto optimal solution set composed of non-dominated solutions of each direction. Second, based on the preprocessed Pareto optimal solution set of extreme points, the convergence and distribution of decision variables are determined, dividing into two groups, and the convergence interval of the convergence variable is determined. The above preprocessing stage basically determines the convergence effect; in the later optimization process, to balance the ability of population convergence and distribution, more attention will be paid to the distribution of individuals. In the optimization stage, this article adopts different optimization strategies for different variables. This involves perturbing convergent variables within their convergence range and randomly perturbing distributed variables within their original value range to obtain an optimally adaptable population.
This algorithm is compared with MOEA/D, NSGAIII, LMEA, MOEA/DVA, MOEA/DD, and MOFDO algorithms. The following conclusions can be obtained through the calculation of DTLZ, WFG, ZDT, and other test functions. Firstly, compared with the traditional multi-objective algorithm, the number of non-dominated solution sets obtained by this algorithm is large and balanced on the basis of the same computation time. Secondly, for the multi-objective optimization algorithm that adopts decision variable classification, this algorithm can quickly find convergence variables in the initial stage, improve the speed of variable classification, and save the running time of the algorithm. Finally, the inverted generation distance (IGD) and standard deviation of MOEA-DV/EPF algorithm compared with the latest version of the multi-objective improvement algorithm show that the algorithm performs well on the ZDT testing problem. In the process of comparison experiment, it is found that the algorithm can be optimized by adding preprocessing algebra properly under the premise of reasonable convergence width setting, which shows the necessity of algorithm parameter research.
1. Multi-Objective Optimization Problem (MOP): Let M be the number of objective functions. We say that this is a multi-objective optimization problem, if
where the i-th objective to be optimized is denoted by
2. Pareto Domination: Let
3. Pareto Optimal Solution: Let P be a randomly selected individual in the decision space. We say that it is a Pareto optimal solution, if the value of the objective function corresponding to P is better than any other individual, that is, no other solution can dominate P.
4. Pareto Optimal Solution Set: Let Pareto optimal solutions form a set. We say that it is the Pareto optimal solution set, denoted by PS, if the solutions are not mutually dominant.
5. Pareto Frontier: Let F(X) be a set. We say that it is a Pareto frontier, denoted by PF, if the target value vector of each optimal solution of PS in the target space belongs to F(X).
Solving multi-objective problems is more complicated. This article addresses how to achieve a solution set with better distribution and convergence, setting forth a decision variable grouping for a multi-objective optimization algorithm based on the extreme point Pareto frontier for obtaining a solution set with better distribution and convergence.
3.1 Basic Idea of the Algorithm
The basic idea of the algorithm is that in the face of multiple objectives, the control variable method is used to simultaneously evolve each single objective direction to obtain a set of extreme points. Under the premise that the Pareto optimal solution set of all the extreme points in the objective direction belongs to the Pareto optimal solution set of the problem, according to the properties of the decision variables provided by the extreme points, the decision variables are divided into two categories: The convergent variables that can converge to a certain small enough range and the distribution variables that have no convergence point. On this basis, the range of convergence variables is determined. In this paper, according to the preconditioning algebra adjustment, we can know that the variables found in a certain range are convergence variables. In the later multi-objective optimization process, different mutation strategies are adopted for convergent variables and distributed variables to accelerate the evolution process. For convergent variables, they are allowed to converge in the value domain, where the oscillation amplitude gradually decreases with the evolution process. For a distributed variable, it is randomly perturbed within its original value domain. Finally, the optimal population is obtained based on adaptability.
3.1.1 Pareto Optimal Solution Set of Extremum Points in Each Target Direction
By using the decomposition approach in multi-objective analysis, the target space is divided into
The solution of the Pareto optimal solution set for single objective directional extremum points is also an evolutionary process. During an evolution process, each target corresponds to a target queue, and its ranking relationship is calculated using the penalty-based boundary intersection (PBI) fitness function given in Eq. (4). Among them, the individual target value is denoted by x, and the target direction vector is denoted by w. The component of x in the target direction is denoted by
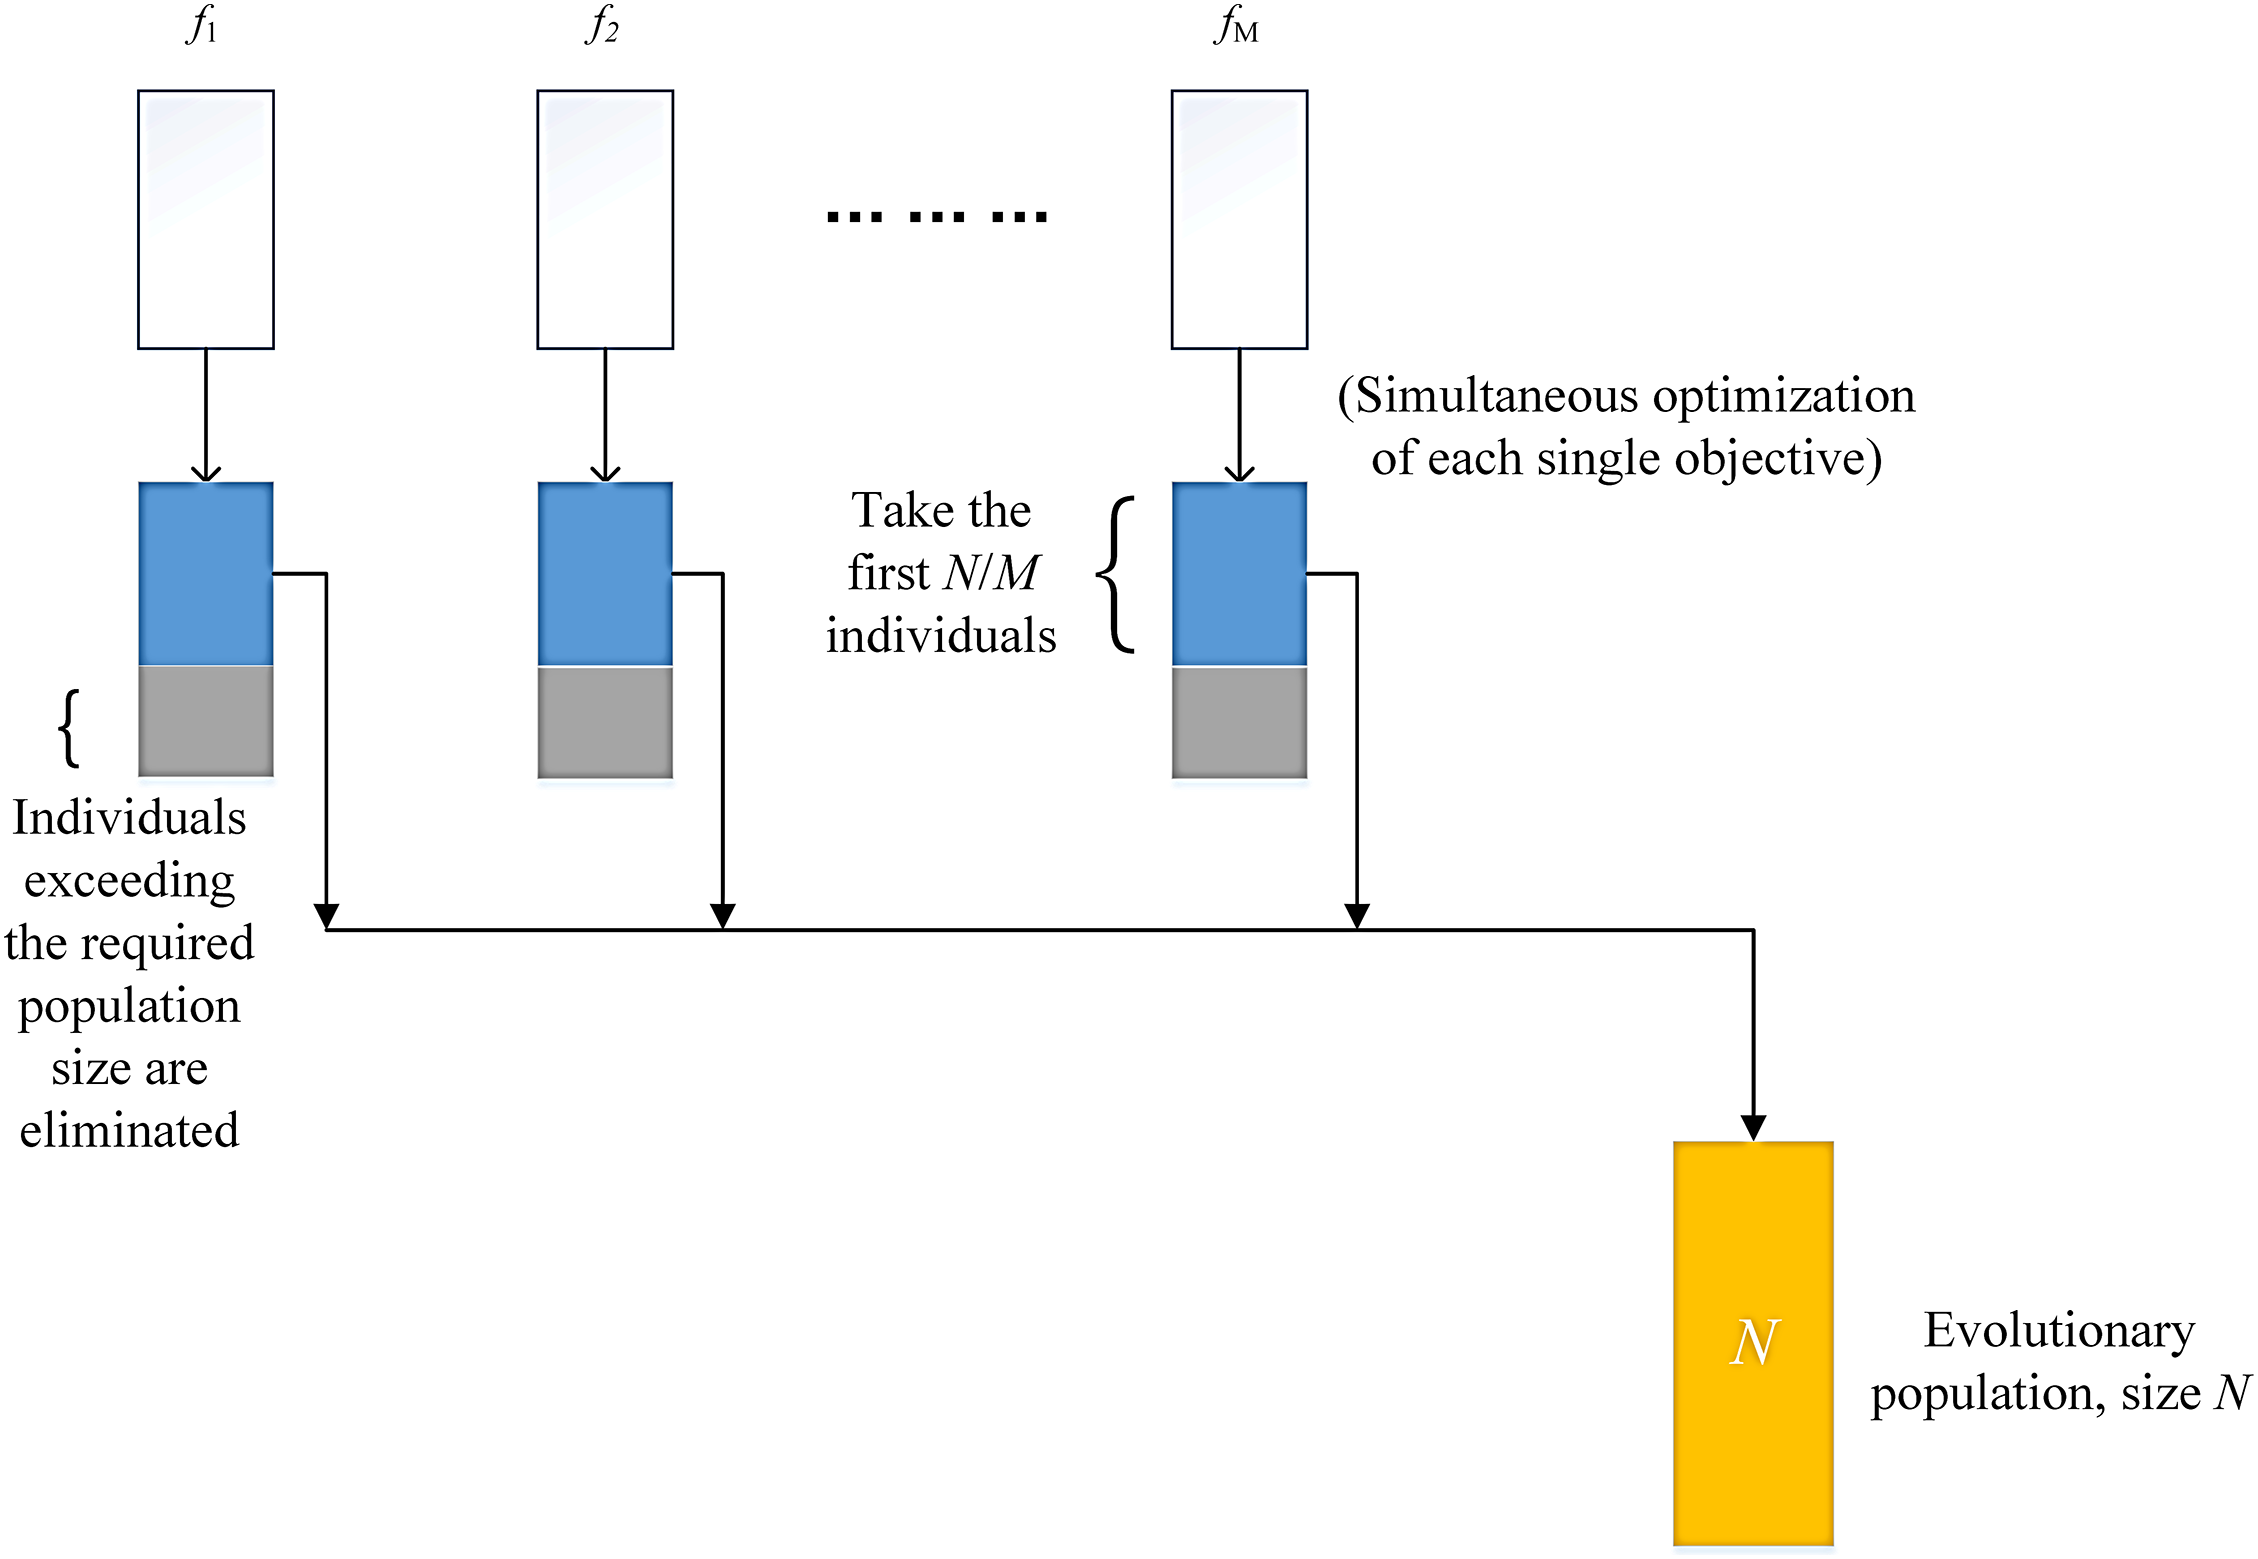
Figure 1: Population selection
3.1.2 Classification of Decision Variable
This article assesses the convergence and distribution properties of variables based on the Pareto optimal solution set of extreme points obtained during the aforementioned preprocessing stage and divides them into two groups. It can be proven that the objective values of each solution in these extreme points Pareto optimal solution sets belong to the final global multi-objective Pareto frontier. Therefore, the decision variables of all individuals in the solution set with different combinations of values form a set of optimal solutions. For convergent decision variables, they will converge to their corresponding convergence point, that is, they will approach a certain fixed value.
First, the range of values for the same decision variable corresponding to all individuals in the solution set is determined based on their different values. Second, the nature of the decision variable is determined based on whether the given convergence width is greater than the value range of the decision variable. If the value range of the decision variable is less than the convergence width, it is categorized as a convergence variable, the other way around, it is categorized as a distribution variable. Setting the convergence width too wide can result in distribution variables being incorrectly categorized as convergence variables, thereby affecting the quality of the subsequent solutions; conversely, setting it too narrow can lead to missing convergence variables, impacting the efficiency of later solutions. To ensure that the value of the convergence variable can enter the true convergence point (especially in the case of convergence boundary), this article has made moderate relaxation when adjusting the range of convergence variable values.
In this paper, according to the different characteristics of decision variables, different mutation strategies are used in the process of evolution, and the fast non-dominated ordering strategy is used to carry out evolutionary operations [2]. This can ensure that individuals finally achieve good distribution under the premise of obvious convergence in Pareto front. As the convergence variables found in the initial stage of the algorithm are almost in a convergence state, only small perturbations within the convergence range are needed during the evolution process. Among them, an oscillation amplitude function is set for convergence optimization, and as the evolution process increases, its oscillation amplitude gradually decreases. The variation form is shown in Fig. 2. Mathematical expression in Eq. (5). The oscillation amplitude coefficient is represented by y, the evolutionary process is represented by x, the random variation interval is represented by r (set as [−0.5, 0.5] in this section), and the convergence accuracy is represented by pre. When the convergence changes are basically determined, the more important thing is to optimize the distribution variables. To spread the population more widely, the changes in distribution variables only need to be randomly perturbed within the original variable range, which can obtain more individuals to maintain distribution ability. Finally, fitness selection is made based on the perturbed population, and the final individual is selected as the final output population.
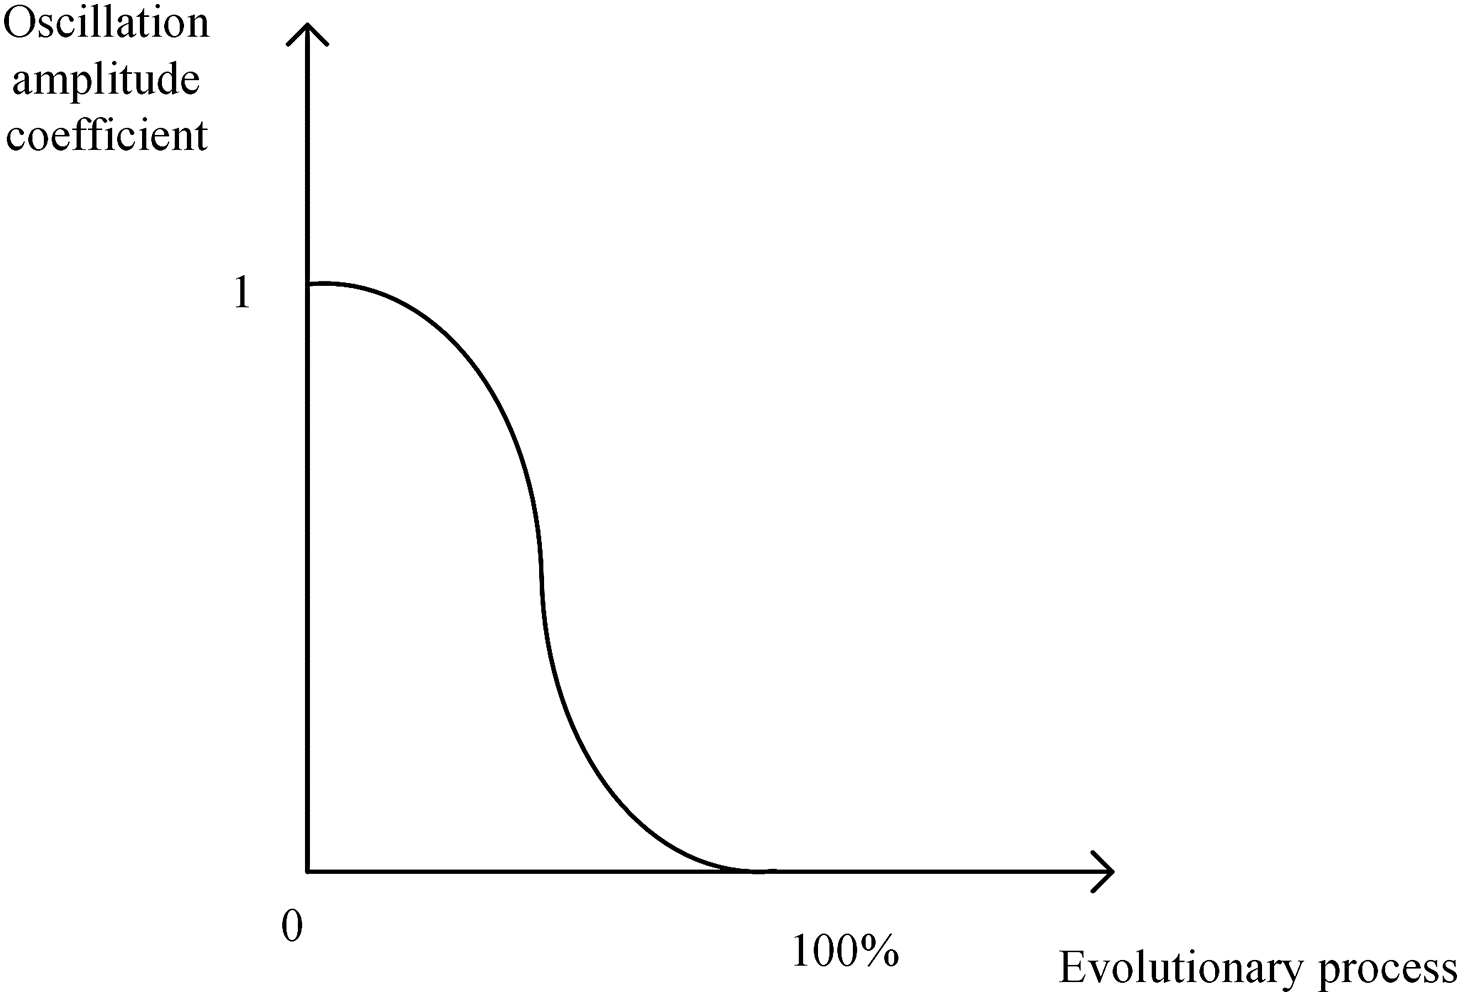
Figure 2: Convergence variable graph

4 Experimental Environment Support
4.1 Experimental Platform and Testing Issues
To ensure a fair comparison, all algorithms are implemented using IDEA combined with Python. The testing questions used in this article are taken from two widely used testing questions, DTLZ [38], WFG [39] and ZDT [34]. These testing issues include DTLZ1-DTLZ7,WFG1-WFG9 and ZDT1-4.
4.2 Experimental Parameter Settings
All algorithms in this article use recommended parameter values to achieve optimal performance.
1. Population size
Since the population size in the MOEA/D and NSGAIII algorithms directly affects the degree of their algorithmic performance, the population sizes for all comparison algorithms in this paper are set uniformly to ensure reasonable and fair experimentation, and the population is generated by a two-layer reference-point generation strategy according to the population selection suggested in the article [2,4,19], i.e., N = 126 for M = 5, and M = 10, N = 275.
2. Cross mutation
In this article, all algorithms use simulated binary crossover strategy SBX [40] and polynomial mutation strategy to create descendants for all testing problems. The distribution indices of its cross-mutation are all set to 20, and the cross probability pc and mutation probability pm are set to pc = 1.0 and pm = 1/D, respectively (D represents the number of decision variables.)
3. Number of terminated runs
In this paper, the number of iterations is used as a termination criterion for the algorithm. Depending on the number of decision variables, different parameter settings are configured. For 100 and 500 decision variables, the number of termination iterations is set to 6000 and 10000 as well as 1000000 and 6800000 (In the MOEA-DV/EPF algorithm, which involves grouping decision variables, the grouping iterations are set to one-third of the optimization iterations, with the latter set to 6000 and 10000.)
4.3 Performance Evaluation Indicators
Performance evaluation metrics are divided into three categories: Convergence metrics, diversity metrics, and metrics that combine convergence and diversity.
The convergence metric is to evaluate the degree of closeness of the obtained solution set to the Pareto true frontier. Representative evaluation metrics include Generational Distance (GD) [41] and Set Coverage (C-metric) [42]. Diversity metrics are determined by calculating the degree of coverage of the approximate solution set in the true frontier, such as Spacing Metric [43], and Maximum Spread (MS) [44]. The combination of diversity and convergence indicators, which combines the performance of the above two types of evaluation indicators, is of some significance in evaluating diversity algorithms, such as IGD [45], and Hyper-Volume Indicator (HV) [29].
To accurately assess the algorithm’s performance, this paper adopts a widely-used performance metric: The inverse iteration distance IGD, which evaluates the algorithm's ability to achieve good convergence and distribution in the Pareto front. Its expression is shown by Eq. (6).
where the solution set obtained by the algorithm is denoted by S, the solution set of the true frontier distribution is denoted by P, the minimum Euclidean distance from P to each individual in S is indicated by dis (S, P), and the size of P is given by |Q|.
5 Comparative Analysis of Experimental Performance
To elucidate the commendable performance of MOEA-DV/EPF, this section conducts a comparative analysis in three aspects. First, in order to demonstrate the effectiveness of preprocessing in the MOEA-DV/EPF algorithm, it is compared with traditional multi-objective optimization algorithms. Second, to more fully evaluate the MOEA-DV/EPF algorithm’s performance, we compared it with multi-objective optimization algorithms using decision variable analysis. Finally, in order to emphasize the timeliness of the proposed algorithm, it is compared with the latest version of multi-objective fitness optimizer algorithm and NSGAIII improved MOEA/DD algorithm. All comparative algorithms include MOEA/D, NSGA-III, MOEA/DVA, LMEA, MOEA/DD and MOFDO algorithms. After all the comparison tests, this section also carries out its own algorithm parameter analysis, and reasonable setting of parameters can optimize the computational efficiency of the algorithm. All the above results show that the algorithm proposed in this article can achieve better results in dealing with multi-objective problems and can efficiently handle multi-objective problems.
5.1 Effectiveness of Preprocessing in MOEA-DV/EPF Algorithm
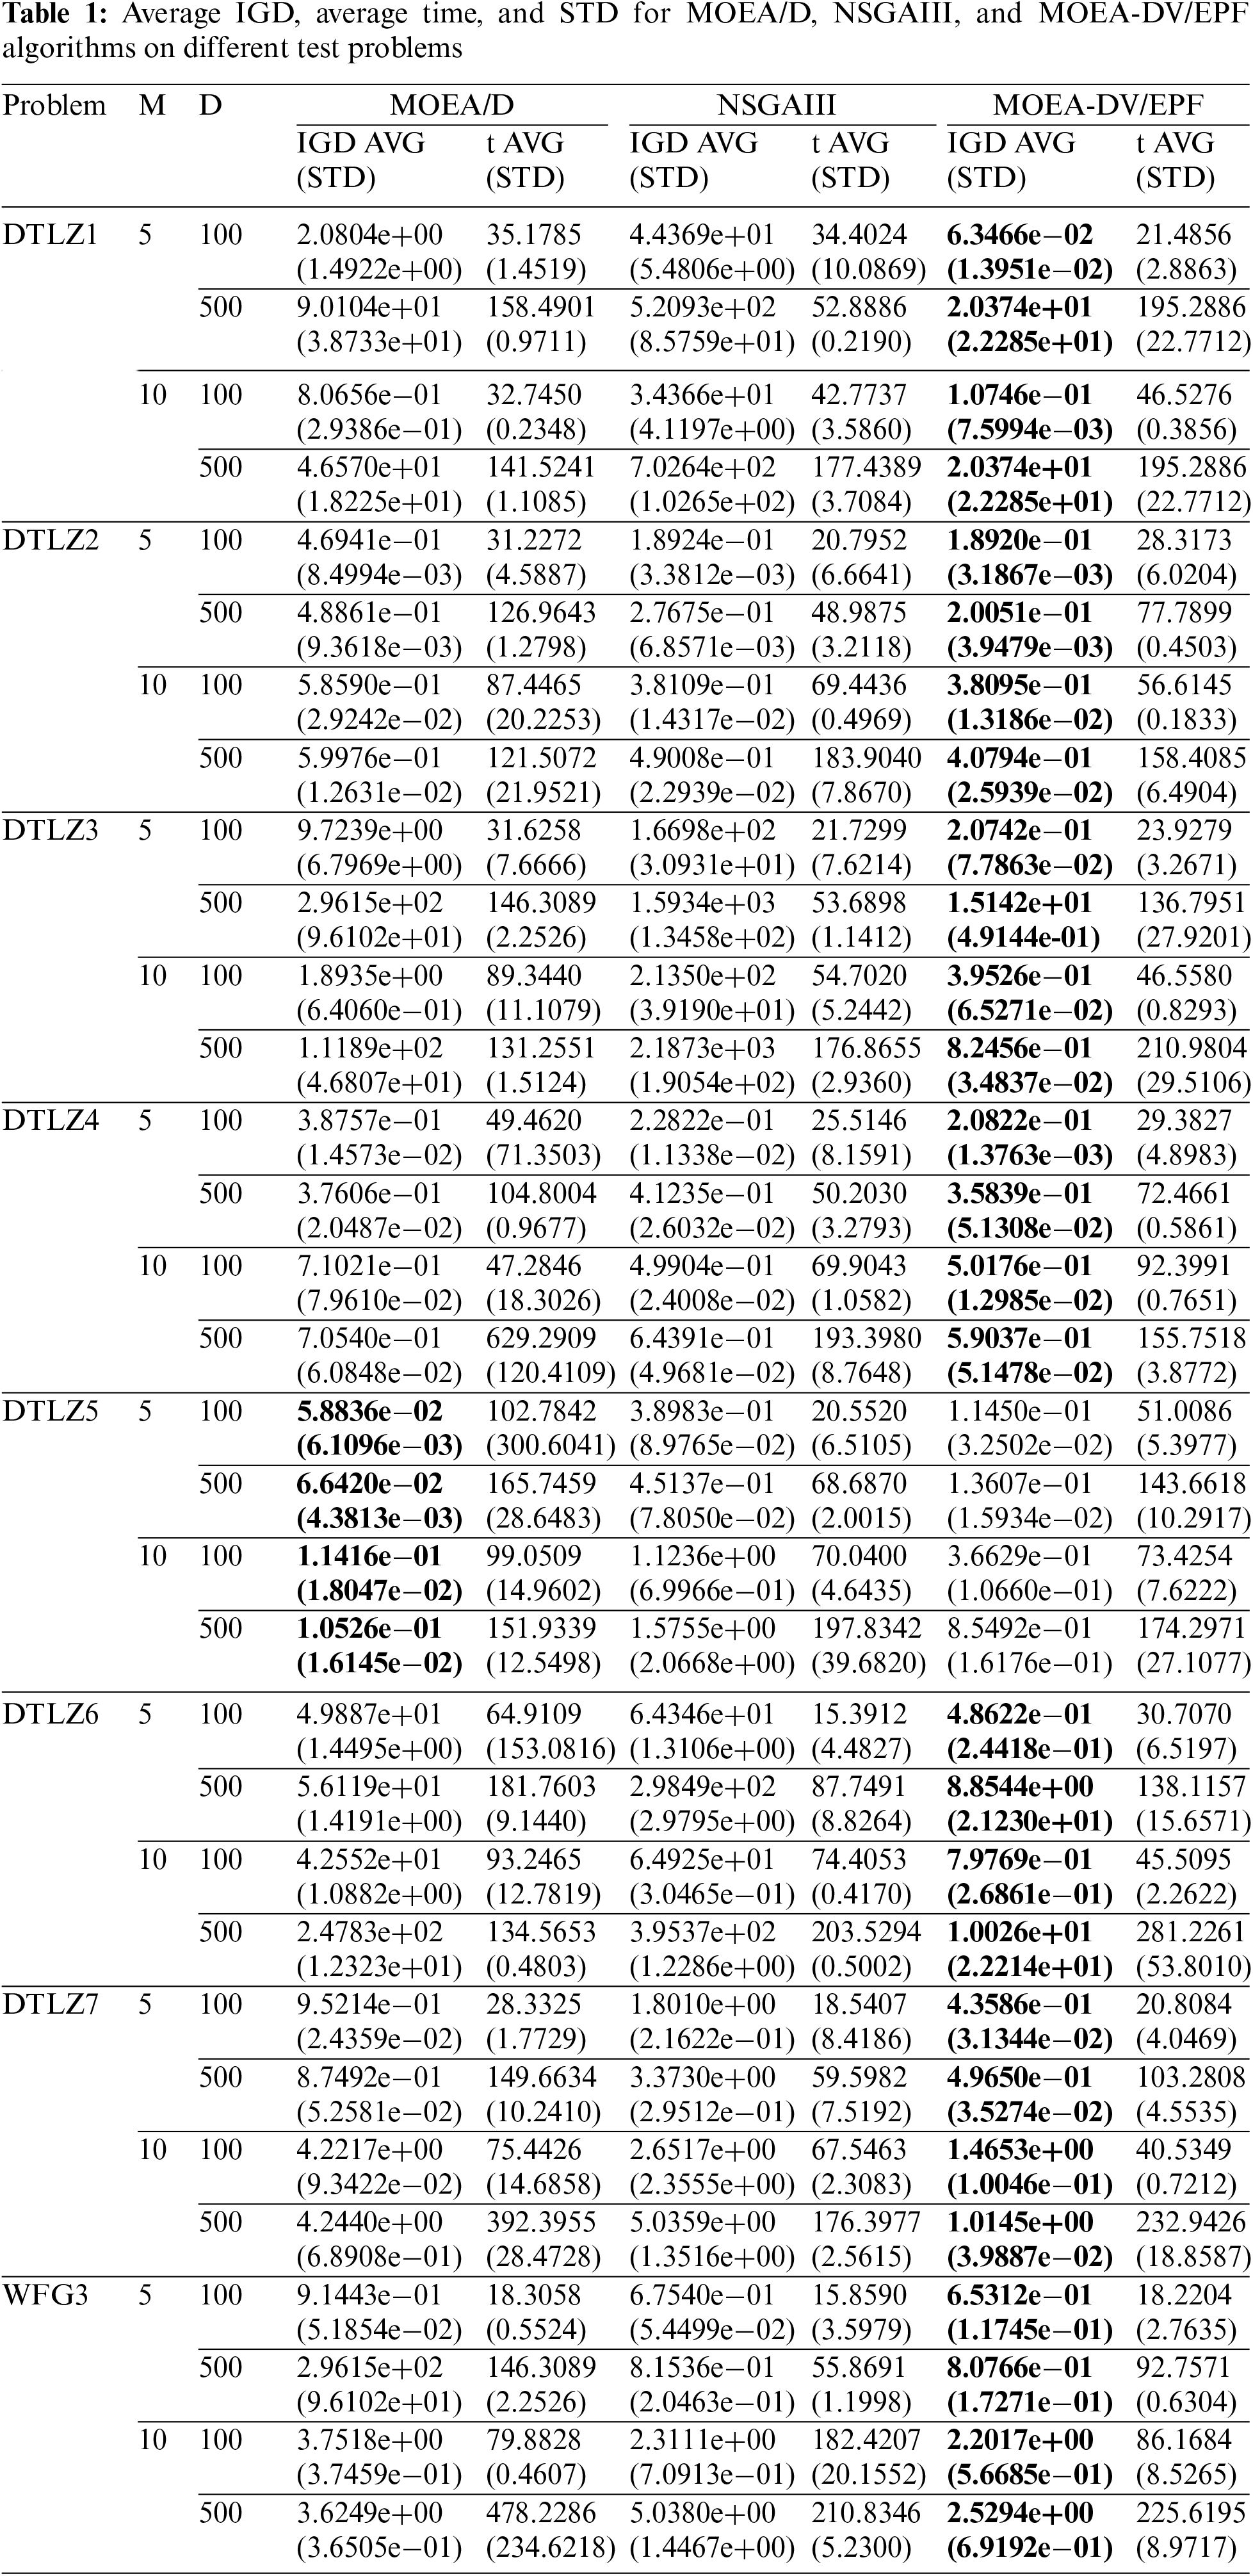
The three algorithms use the same parameters for the DTLZ and WFG testing problems (due to the limited space, only the following eight are listed). For the 5- and 10-objective problems, the maximum numbers of decision variables are set at 100 and 500, and the maximum number of termination runs are set to 6000 and 10000, respectively. Table 1 shows the average IGD values of three algorithms after independently running 20 times on different testing problems. The dark gray background represents the IGD values that are most effective. Where STD represents the standard deviation of 20 independent runs. It is evident that for most test problems, the method of grouping decision variables using preprocessing is the most effective. Moreover, this method results in shorter running time when the IGD values are similar. In the DTLZ5 testing problem, the MOEA/D algorithm has some accuracy compared to the MOEA-DV/EPF algorithm. Because the Pareto frontier of the DTLZ5 test problem is degenerate, this means that in a high-dimensional space, the shape of its Pareto frontier is lower than the spatial dimension. Therefore, the search needs to be focused on a very small range. In order to ensure the fairness of the experiment, the MOEA-DV/EPF algorithm is tested with the same accuracy. The smaller the precision, the larger the preprocessing algebra should be. Therefore, in this experiment, if the pretreatment parameters are adjusted, the experimental results can be improved.
In this article, we use effect diagrams to more intuitively visualize the experimental data described above. Fig. 3 depicts the non-dominated solution set corresponding to the optimal IGD value obtained by independently running 20 times on the DTLZ3 problem when M = 10 and D = 100. Fig. 3a shows the true Pareto frontier of the DTLZ3 problem. Figs. 3b–3d respectively represent the non-dominated solution sets obtained by the MOEA/D, NSGAIII, and MOEA-DV/EPF algorithms on the DTLZ3 testing problem. The horizontal axis of these four images represents the number of targets, and the vertical axis represents their target values. According to the image visualization, the MOEA-DV/EPF algorithm shows good convergence and distribution results, obtaining more non-dominated solutions at the Pareto front than the MOEA/D algorithm. Observation from Fig. 4 reveals that the MOEA-DV/EPF algorithm has initially identified convergence variables after preprocessing, and the convergence effect has been basically determined, indicating that the preprocessing process has played a role in accelerating convergence; the decision variables in the left half of the figure can demonstrate their distribution ability and achieve a good distribution between (0, 1). This algorithm realizes the fast classification of decision variables. Overall, the experiment shows that the decision variable grouping method based on the extreme point Pareto frontier can improve the multi-objective solving performance.
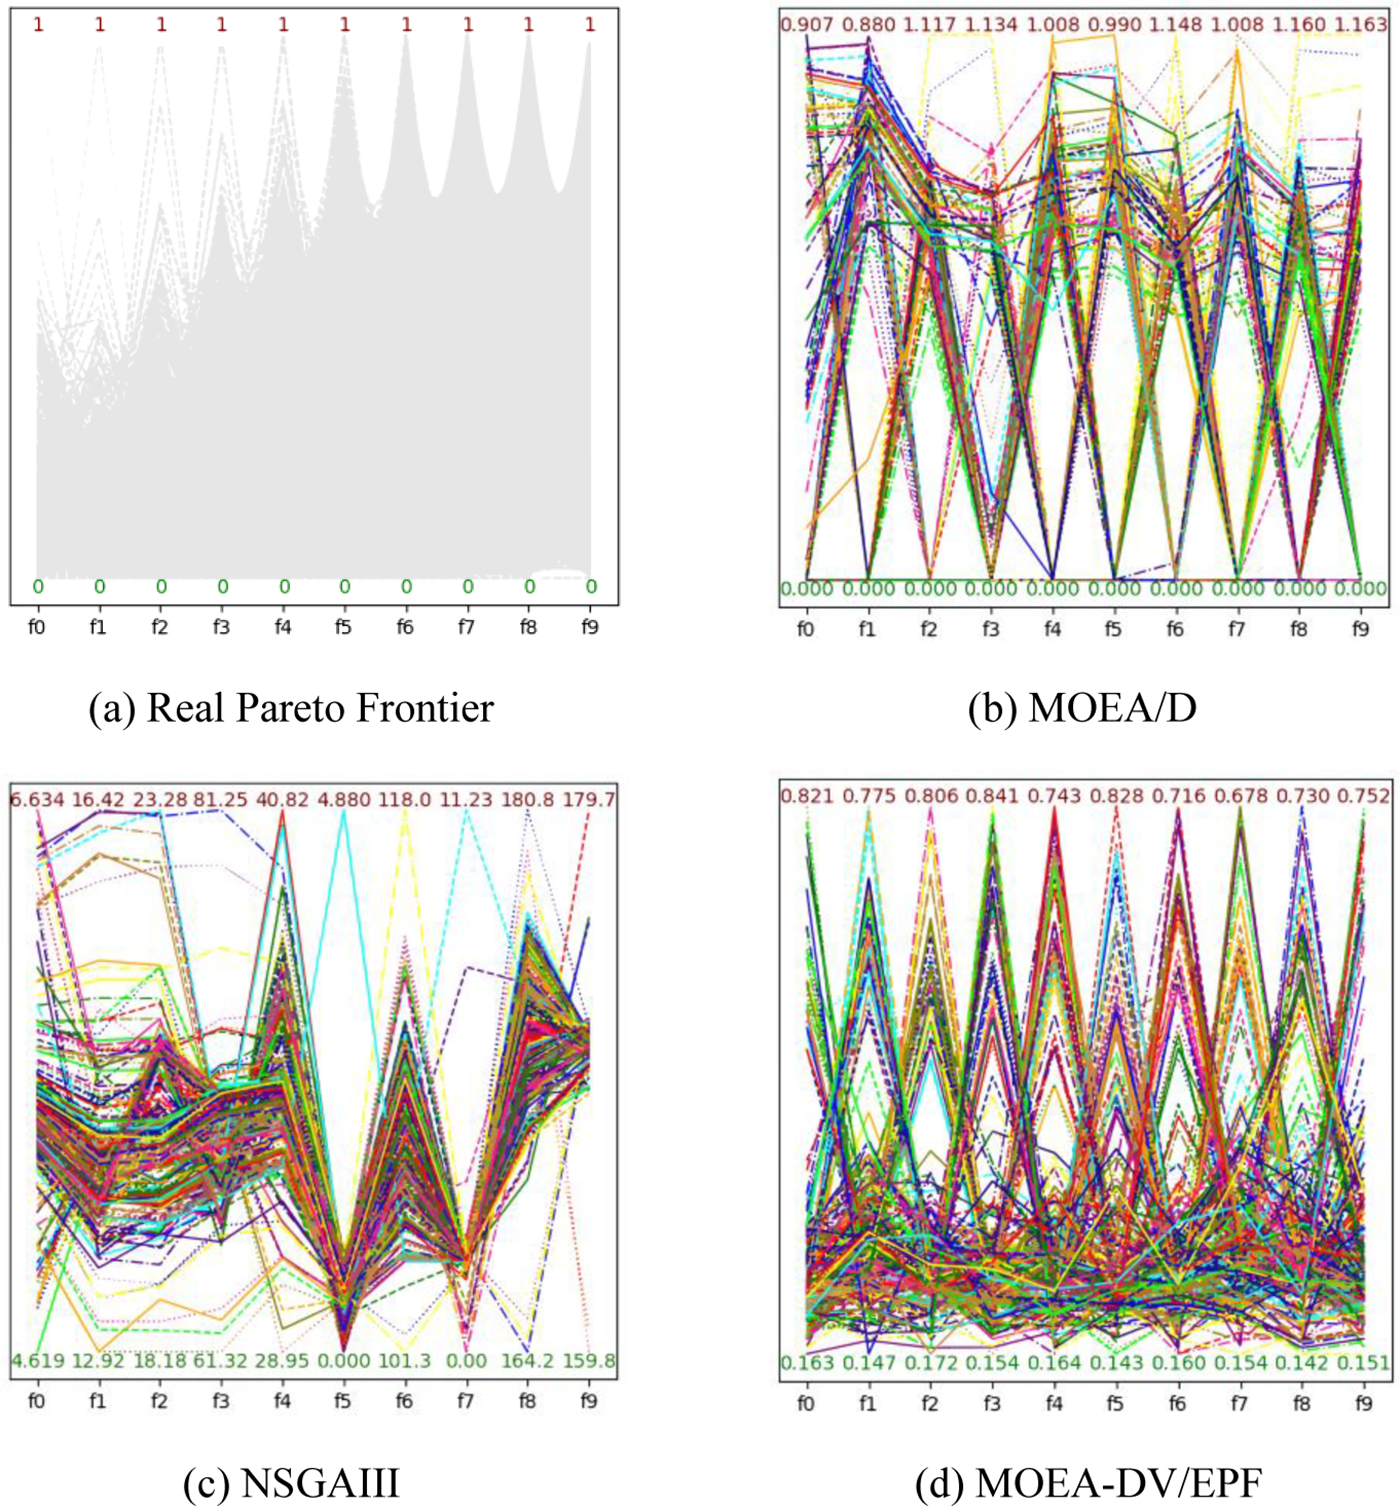
Figure 3: Parallel coordinate graphs of non-dominant solution set for 10 objective DTLZ3 problems with 100 decision variables using three algorithms

Figure 4: MOEA-DV/EPF algorithm in DTLZ3 problem with 10 objectives and 100 decision variables, distribution diagram of decision variables
5.2 Comparison between MOEA-DV/EPF and Other Algorithms
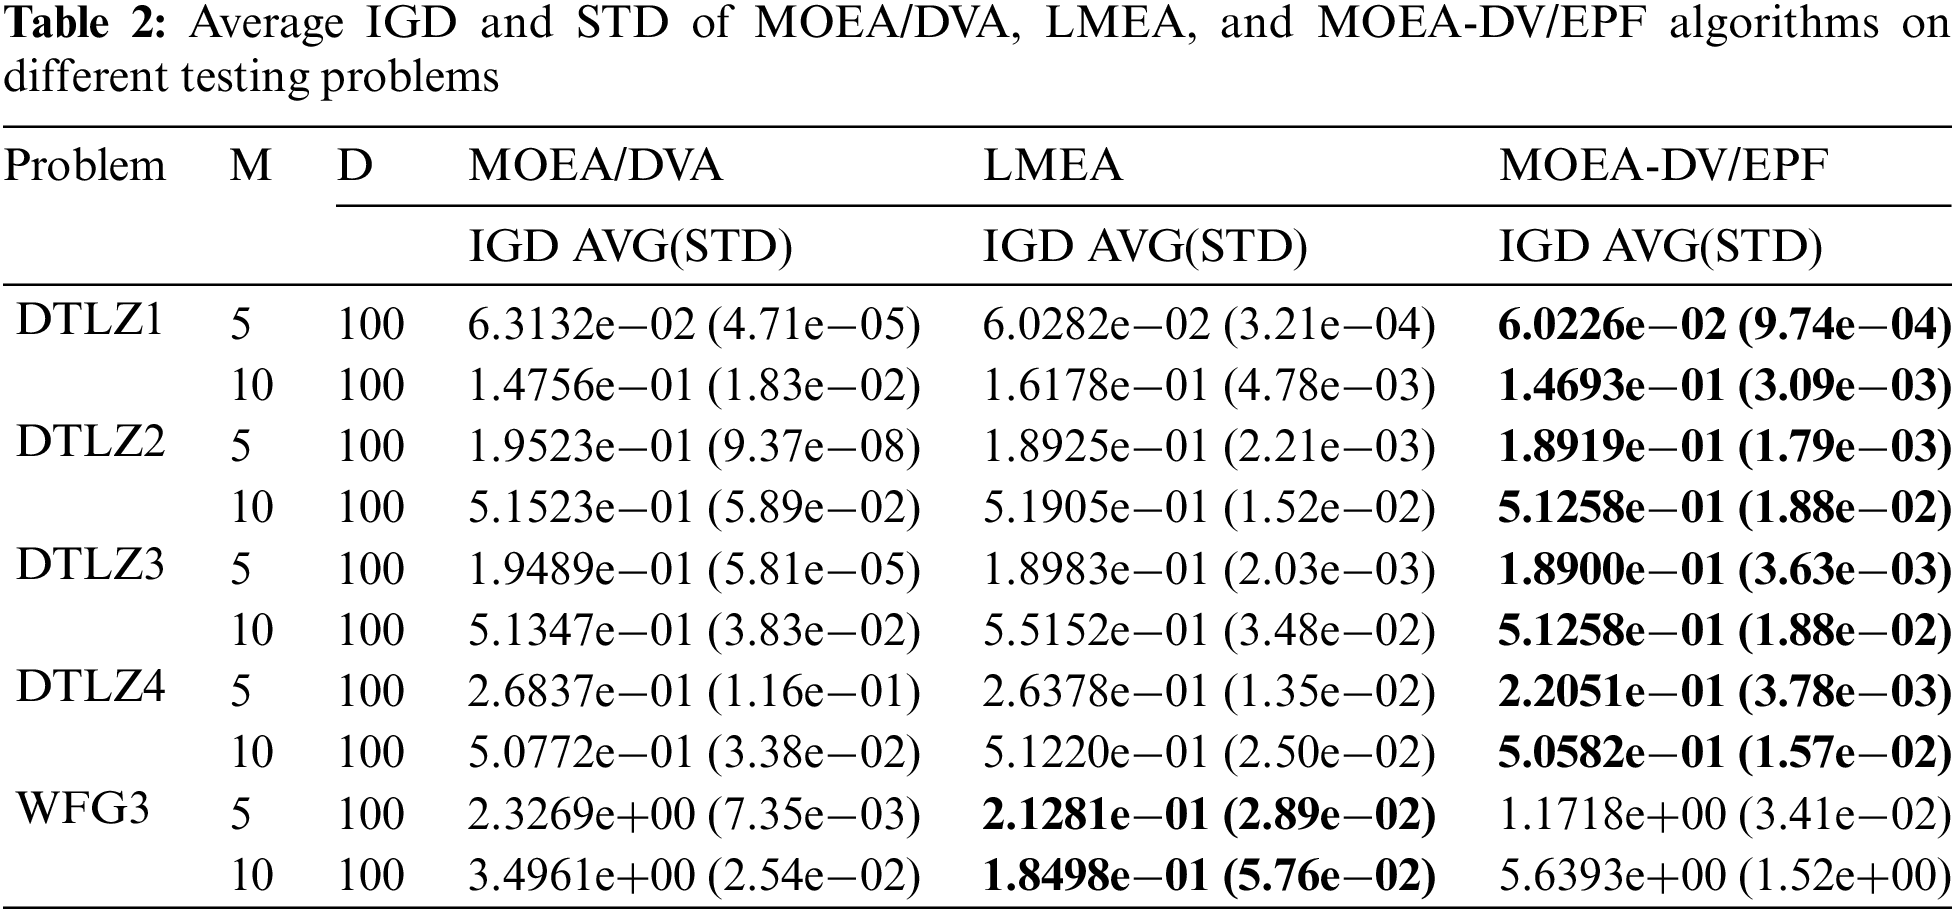
To conduct a fair comparative experiment, we compare the following three algorithms using the same parameters across five test questions. Based on the recommended value [37], this section sets the maximum number of runs for D = 100 and D = 500 to 1000000 and 6800000, respectively. Comparing the average IGD values of 20 independent runs of different algorithms, Table 2 shows the statistical results of IGD measurements under the same parameters. In the table, a dark gray represents the best result of the experiment. The IGD value of the MOEA-DV/EPF algorithm shows better performance in the DTLZ testing problem. The WFG3 test problem is inseparable but unimodal and it has a degenerated Pareto-optimal front. Moreover, this test problem focuses on dealing with decision variable dependence, so the LMEA algorithm is more suitable for this test problem. This algorithm can effectively distinguish between convergence variables and distribution variables, but the issue of correlation between decision variable convergence variables and distribution variables still needs to be solved. Variable dependency also provides ideas for future research on this algorithm. In summary, this algorithm has the potential to solve multi-objective problems and exhibits scalability.
5.3 Timeliness of MOEA-DV/EPF Algorithm
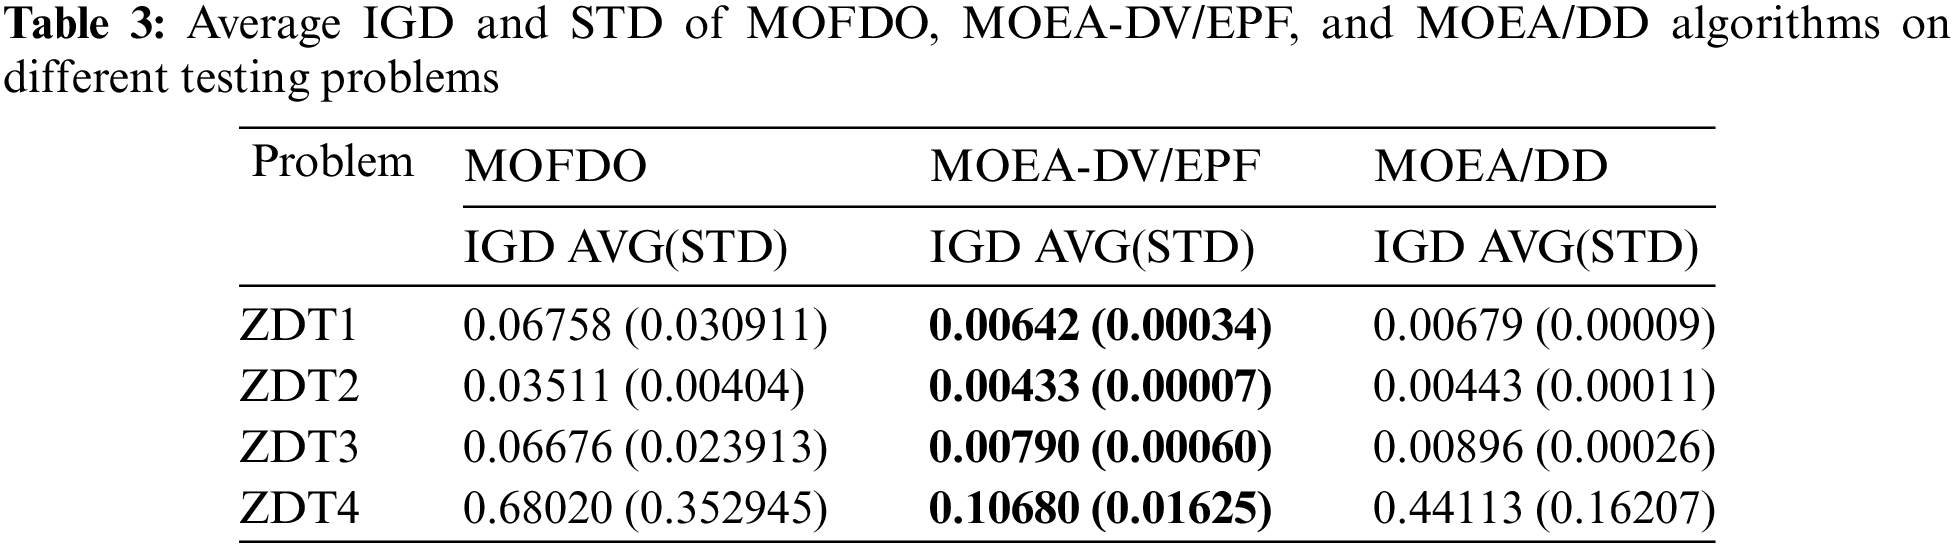
In order to highlight the fairness and reliability of the comparison test, this subsection adopts the same parameters for the comparison analysis of the algorithms on the four test problems. Since the comparison algorithms in this section do not involve the population division imbalance problem, the same parameters are set according to the literature [34], which specifies a population size of 100, a maximum number of runs of 500, and 30 independent runs. The average IGD values of the three algorithms are compared, with dark grey representing the best experimental results. Where STD represents the standard deviation of IGD values for 30 independent runs. According to Table 3, it can be seen that the MOEA-DV/EPF algorithm has better results in the ZDT1-4 test function, which fully proves that this algorithm has some research significance.
5.4 Analysis of MOEA-DV/EPF Algorithm
In order to better show the effect of decision variable grouping in this algorithm, the influence of parameter selection on the algorithm is analyzed and discussed in this section. Fig. 5 depicts the grouping effect of decision variables on ZDT2 for different preprocessing generations, N = 200, D = 30, and convergence width 0.1. The left plot shows P = 1000 and the right plot shows P = 2000. It can be seen that when other parameters are constant, because the convergence width is set too narrow, some convergence variables are not found (for example, the 5th, 14th, and 25th decision variables). Only by increasing the number of preprocessing generations can the convergence variables and distribution variables be accurately distinguished. However, multiple preprocessing loops will increase the running time of the algorithm and affect the overall efficiency of the algorithm. At this time, the convergence width can be appropriately increased to improve the efficiency of the algorithm. However, setting the convergence width too high will misjudge the distribution variable as the convergence variable, which will affect the subsequent optimization of the algorithm. Fig. 6 depicts the distribution effect of the optimal solution set of the proposed algorithm on ZDT2 when the convergence width is 0.3 (left) and 0.1 (right). It can be seen that when the convergence width is set too large, the obtained solution set has less distribution on the Pareto front and does not converge to the front. When the convergence width is set moderately, the obtained set almost coincides with the Pareto true front (blue is the true Pareto front, red is the set of obtained solutions). Therefore, in this paper, the convergence width is selected as 0.1 for all tests, and the preprocessing algebra is appropriately increased during the experiment to make the decision variables be grouped accurately. The design of all parameters has a certain extended research, and the algorithm has a certain competitive ability in the face of multi-objective problems.

Figure 5: The distribution of decision variables when different preprocessing algebras are set in the ZDT2 test problem by MOEA-DV/EPF algorithm

Figure 6: The distribution of solution sets of MOEA-DV/EPF algorithm with different convergence widths in ZDT2 test problems
This article introduces a decision variable grouping multi-objective optimization algorithm based on the extreme point Pareto frontier, adept at handling multi-objective optimization issues well, which is referred to as MOEA-DV/EPF. Unlike other multi-objective optimization algorithms, which treat decision variables as a collective whole focusing solely on optimizing objectives, this algorithm groups the decision variables while performing the objective decomposition optimization. The algorithm’s extreme point-based grouping of decision variables is designed based on the set of Pareto optimal solutions of extreme points, obtained in the preprocessing stage to divide the decision variables into convergent and distributed decision variables. Based on the grouping results, different optimization strategies are adopted for the two groups, i.e., perturbation within the convergence value domain for the converging variables and random perturbation within the original value domain for the distribution variables. Finally, the population selection is then combined with a similar fast sorting strategy and congestion distance selection strategy.
In this regard, the algorithm is evaluated in three aspects in this paper. First, MOEA-DV/EPF achieves a more uniform distribution of solution sets in the 10-objective DTLZ3 test function instances, positions closer to the true frontier, and allows for fast convergence variables to be found during the optimization process. Second, we compare the MOEA-DV/EPF algorithm with several existing MOEA methods (e.g., MOEA/D, NSGAIII, etc., described in the above experiments) on standard test instances DTLZ1-DTLZ7 and WFG1-WFG9, with 5- and 10-objectives and 100 and 500 decision variables, respectively, and the results show that the IGD values of this algorithm and its running time both produce good results. At the same time, the advantages and disadvantages of the latest version of multi-objective improvement algorithm and this algorithm are analyzed; and the result obtained by changing the parameters of MOEA-DV/EPF algorithm. Finally, the MOEA-DV/EPF algorithm is analyzed alongside the large-scale decision variable algorithms MOEA/DVA and LMEA algorithms on benchmarking problems. It is found that the present algorithm has good scalability. However, for large-scale problems, it can be seen in the WFG3 test problem that this algorithm does not pay attention to the influence of associated variables in the process of decision variable grouping, and there is still a gap between this algorithm and LMEA and other algorithms considering associated variables in some test problems, which will be the next problem to be solved.
Acknowledgement: The authors would like to express their gratitude for the valuable feedback and suggestions provided by all the anonymous reviewers and the editorial team. The authors sincerely thank the Liaoning Provincial Nature Foundation Project, the National Foreign Experts Project, the Basic Research Project of the Liaoning Provincial Department of Education, and the researchers of King Saud University for their support.
Funding Statement: This study was supported by the Liaoning Province Nature Fundation Project (2022-MS-291), the National Programme for Foreign Expert Projects (G2022006008L), the Basic Research Projects of Liaoning Provincial Department of Education (LJKMZ20220781, LJKMZ20220783, LJKQZ20222457). King Saud University funded this study through the Researcher Support Program Number (RSPD2023R704), King Saud University, Riyadh, Saudi Arabia.
Author Contributions: Conceptualization, J.W, L.Z, and F.P; methodology, J.W, and L.Z; software, J.W, M.E, and L.Z; validation F.P, and H.Z; investigation, F.P, H.Z, and Q.F; writing—original draft preparation, J.W, and L.Z; writing—review and editing, J.W, L.Z, and M.S. All authors have read and agreed to the published version of the manuscript.
Availability of Data and Materials: The data presented in this study are available on request from the corresponding author. The data are not publicly available due to privacy.
Conflicts of Interest: The authors declare that they have no conflicts of interest to report regarding the present study.
References
1. Y. Tian, C. Lu, X. Zhang, K. C. Tan, and Y. Jin, “Solving large-scalemultiobjective optimization problems with sparse optimal solutions via unsupervised neural networks,” IEEE Trans. Cybern., vol. 51, no. 6, pp. 3115–3128, Jun. 2021. doi: 10.1109/TCYB.2020.2979930. [Google Scholar] [PubMed] [CrossRef]
2. K. Deb and H. Jain, “An evolutionary many-objective optimization algorithm using reference-point-based nondominated sorting approach, Part I: Solving problems with box constraints,” IEEE Trans. Evol. Comput., vol. 18, no. 4, pp. 577–601, Aug. 2014. doi: 10.1109/TEVC.2013.2281535. [Google Scholar] [CrossRef]
3. Z. Liu, D. Jiang, C. Zhang, H. Zhao, Q. Zhao and B. Zhang, “A novel fireworks algorithm for the protein-ligand docking on the autodock,” Mob Netw. Appl., vol. 26, no. 2, pp. 657–668, Dec. 2021. doi: 10.1007/s11036-019-01412-6. [Google Scholar] [CrossRef]
4. Z. Liu, C. Zhang, Q. Zhao, B. Zhang, and W. Sun, “Comparative study of evolutionary algorithms for protein-ligand docking problem on the auto dock,” in Proc. SIMUtools, Chengdu, China, 2019,pp. 598–607. [Google Scholar]
5. H. R. Zhu, “Research on UAV path planning based on evolutionary computation,” M.S. thesis, Dept. AI, Jilin Univ., China, 2023. [Google Scholar]
6. J. L. Yu, “Multi-objective deep neural network architecture search based on an evolutionary algorithm,” M.S. thesis, Dept. Software. Eng., Shandong Normal Univ., China, 2023. [Google Scholar]
7. X. W. Guo et al., “Human-robot collaborative disassembly line balancing problem with stochastic operation time and a solution via multi-objective shuffled frog leaping algorithm,” IEEE Trans. Autom. Sci. Eng., pp. 1–12, Jul. 2023. doi: 10.1109/TASE.2023.3296733. [Google Scholar] [CrossRef]
8. X. W. Guo, T. Wei, J. Wang, S. Liu, S. Qin and L. Qi, “Multi-objective U-shaped disassembly line balancing problem considering human fatigue index and an efficient solution,” IEEE Trans. Comput. Soc. Syst., vol. 10, no. 4, pp. 2061–2073, Aug. 2022. doi: 10.1109/TCSS.2022.3217101. [Google Scholar] [CrossRef]
9. X. W. Guo, Z. W. Zhang, L. Qi, S. X. Liu, Y. Tang and Z. Y. Zhao, “Stochastic hybrid discrete grey wolf optimizer for multi-objective disassembly sequencing and line balancing planning in disassembling multiple products,” IEEE Trans. Autom. Sci. Eng., vol. 19, no. 3, pp. 1744–1756, Jul. 2022. doi: 10.1109/TASE.2021.3133601. [Google Scholar] [CrossRef]
10. X. W. Guo, S. X. Liu, M. C. Zhou, and G. D. Tian, “Dual-objective program and scatter search for the optimization of disassembly sequences subject to multi-resource constraints,” IEEE Trans. Autom. Sci. Eng., vol. 15, no. 3, pp. 1091–1103, Jul. 2018. doi: 10.1109/TASE.2017.2731981. [Google Scholar] [CrossRef]
11. F. Tahernezhad-Javazm, D. Rankin, and D. Coyle, “R2-HMEWO: Hybrid multi-objective evolutionary algorithm based on the equilibrium optimizer and whale optimization algorithm,” in Proc. CEC, Padua, Italy, 2022, pp. 1–8. [Google Scholar]
12. A. Zou, B. Y. Qu, H. Li, S. Z. Zhao, P. N. Suganthan and Q. F. Zhang, “Multiobjective evolutionary algorithms: A survey of the state of the art,” Swarm Evol. Comput., vol. 1, no. 1, pp. 32–49, Mar. 2011. doi: 10.1016/j.swevo.2011.03.001. [Google Scholar] [CrossRef]
13. S. Chand and M. Wagner, “Evolutionary many-objective optimization: A quick-start guide,” Surv. Oper. Res. Manag. Sci., vol. 20, no. 2, pp. 35–42, Dec. 2015. doi: 10.1016/j.sorms.2015.08.001. [Google Scholar] [CrossRef]
14. B. Li, J. Li, K. Tang, and X. Yao, “Many-objective evolutionary algorithms: A survey,” ACM Comput. Surv., vol. 48, no. 1, pp. 1–37, Sep. 2015. doi: 10.1145/2792984. [Google Scholar] [CrossRef]
15. D. Hadka and P. Reed, “Borg: An auto-adaptive many-objective evolutionary computing framework,” Evol. Comput., vol. 21, no. 2, pp. 231–259, May 2013. doi: 10.1162/EVCO_a_00075. [Google Scholar] [PubMed] [CrossRef]
16. F. di Pierro, S. T. Khu, and D. A. Savic, “An investigation on preference order ranking scheme for multiobjective evolutionary optimization,” IEEE Trans. Evol. Comput., vol. 11, no. 1, pp. 17–45, Feb. 2007. doi: 10.1109/TEVC.2006.876362. [Google Scholar] [CrossRef]
17. N. Karimi, M. R. Feylizadeh, K. Govindan, and M. Bagherpour, “Fuzzy multi-objective programming: A systematic literature review,” Expert Syst. Appl., vol. 196, no. 19, pp. 116663, Jun. 2022. doi: 10.1016/j.eswa.2022.116663. [Google Scholar] [CrossRef]
18. T. W. Wu, S. G. An, J. Q. Han, and N. Y. Shentu, “An ε-domination based two-archive 2 algorithm for many-objective optimization,” J. Syst. Eng. Electron., vol. 33, no. 1, pp. 156–196, Feb. 2022. doi: 10.23919/JSEE.2022.000016. [Google Scholar] [CrossRef]
19. K. Li, K. Deb, Q. Zhang, and S. Kwong, “An evolutionary many-objective optimization algorithm based on dominance and decomposition,” IEEE Trans. Evol. Comput., vol. 19, no. 5, pp. 694–716, Oct. 2014. doi: 10.1109/TEVC.2014.2373386. [Google Scholar] [CrossRef]
20. X. Zhang, Y. Tian, and Y. Jin, “A knee point-driven evolutionary algorithm for many-objective optimization,” IEEE Trans. Evol. Comput., vol. 19, no. 6, pp. 761–776, Dec. 2014. doi: 10.1109/TEVC.2014.2378512. [Google Scholar] [CrossRef]
21. Q. Zhang and H. Li, “MOEA/D: A multiobjective evolutionary algorithm based on decomposition,” IEEE Trans. Evol. Comput., vol. 11, no. 6, pp. 712–731, Jan. 2008. doi: 10.1109/TEVC.2007.892759. [Google Scholar] [CrossRef]
22. H. T. Zhao, C. S. Zhang, B. Zhang, P. B. Duan, and Y. Yang, “Decomposition-based sub-problem optimal solution updating direction-guided evolutionary many-objective algorithm,” Inf. Sci., vol. 449, no. 6, pp. 91–111, Jun. 2018. doi: 10.1016/j.ins.2018.03.015. [Google Scholar] [CrossRef]
23. Y. Qi, X. Ma, F. Liu, L. Jiao, J. Sun and J. Wu, “MOEA/D with adaptive weight adjustment,” Evol. Comput., vol. 22, no. 2, pp. 231–264, Jun. 2014. doi: 10.1162/EVCO_a_00109. [Google Scholar] [PubMed] [CrossRef]
24. E. J. Hughes, “Multiple single objective Pareto sampling,” in Proc. CEC, Canberra, ACT, Australia, 2003, pp. 2678–2684. [Google Scholar]
25. X. Cai, Y. Li, Z. Fan, and Q. Zhang, “An external archive guided multiobjective evolutionary algorithm based on decomposition for combinatorial optimization,” IEEE Trans. Evol. Comput., vol. 19, no. 4, pp. 508–523, Aug. 2015. doi: 10.1109/TEVC.2014.2350995. [Google Scholar] [CrossRef]
26. R. Cheng, Y. Jin, M. Olhofer, and B. Sendhoff, “A reference vector guided evolutionary algorithm for many-objective optimization,” IEEE Trans. Evol. Comput., vol. 20, no. 5, pp. 773–791, Oct. 2016. doi: 10.1109/TEVC.2016.2519378. [Google Scholar] [CrossRef]
27. F. Li, R. Cheng, J. C. Liu, and Y. C. Jin, “A two-stage R2 indicator based evolutionary algorithm for many-objective optimization,” Appl. Soft Comput., vol. 67, no. 18, pp. 245–260, Jun. 2018. doi: 10.1016/j.asoc.2018.02.048. [Google Scholar] [CrossRef]
28. H. Trautmann, T. Wagner, and D. Brockhoff, “R2-EMOA: Focused multiobjective search using R2-indicator-based selection,” in Proc. LION, Catania, Italy, 2013, pp. 7–11. [Google Scholar]
29. J. Bader and E. Zitzler, “HypE: An algorithm for fast hypervolume-based many-objective optimization,” Evol. Comput., vol. 19, no. 1, pp. 45–76, Mar. 2011. doi: 10.1162/EVCO_a_00009. [Google Scholar] [PubMed] [CrossRef]
30. Z. Bingul, “Adaptive genetic algorithms applied to dynamic multiobjective problems,” Appl. Soft Comput, vol. 7, no. 3, pp. 791–799, Jun. 2007. doi: 10.1016/j.asoc.2006.03.001. [Google Scholar] [CrossRef]
31. A. Menchaca-Mendez and C. A. C. Coello, “Solving multi-objective optimization problems using differential evolution and a maximin selection criterion,” in Proc. CEC, Brisbane, QLD, Australia, 2012, pp. 10–15. [Google Scholar]
32. H. Wang, L. Jiao, and X. Yao, “Two_Arch2: An improved two-archive algorithm for many-objective optimization,” IEEE Trans. Evol. Comput., vol. 19, no. 4, pp. 524–541, Aug. 2015. doi: 10.1109/TEVC.2014.2350987. [Google Scholar] [CrossRef]
33. G. Rudolph, O. Schütze, C. Grimme, and H. Trautmann, “An aspiration set EMOA based on averaged Hausdorff distances,” in Proc. LION, Gainesville, FL, USA, 2014, pp. 153–156. [Google Scholar]
34. J. M. Abdullah, T. A. Rashid, and B. B. Maaroof, “Multi-objective fitness-dependent optimizer algorithm,” Neural Comput. Appl., vol. 35, no. 16, pp. 11969–11987, Feb. 2023. doi: 10.1007/s00521-023-08332-3. [Google Scholar] [CrossRef]
35. T. Weise, R. Chiong, and K. Tang, “Evolutionary optimization: Pitfalls and booby traps,” J. Comput. Sci. Technol., vol. 27, no. 5, pp. 907–936, Nov. 2012. doi: 10.1007/s11390-012-1274-4. [Google Scholar] [CrossRef]
36. X. Ma et al., “A multiobjective evolutionary algorithm based on decision variable analyses for multiobjective optimization problems with large-scale variables,” IEEE Trans. Evol. Comput., vol. 20, no. 2, pp. 275–298, Apr. 2016. doi: 10.1109/TEVC.2015.2455812. [Google Scholar] [CrossRef]
37. X. Zhang, Y. Tian, R. Cheng, and Y. Jin, “A decision variable clustering-based evolutionary algorithm for large-scale many-objective optimization,” IEEE Trans. Evol. Comput., vol. 21, no. 1, pp. 97–112, Feb. 2018. doi: 10.1109/TEVC.2016.2600642. [Google Scholar] [CrossRef]
38. K. Deb, L. Thiele, M. Laumanns, and E. Zitzler, “Scalable multi-objective optimization test problems,” in Proc. CEC, Honolulu, HI, USA, 2002, pp. 825–830. [Google Scholar]
39. S. Huband, P. Hingston, L. Barone, and L. While, “A review of multiobjective test problems and a scalable test problem toolkit,” IEEE Trans. Evol. Comput., vol. 10, no. 5, pp. 477–506, Oct. 2006. doi: 10.1109/TEVC.2005.861417. [Google Scholar] [CrossRef]
40. R. B. Agrawal, K. Deb, and R. B. Agrawal, “Simulated binary crossover for continuous search space,” Complex Syst., vol. 9, no. 2, pp. 115–148, 1995. [Google Scholar]
41. O. Schutze, X. Esquivel, A. Lara, and C. A. C. Coello, “Using the averaged Hausdorff distance as a performance measure in evolutionary multiobjective optimization,” IEEE Trans. Evol. Comput., vol. 16, no. 4, pp. 504–522, Aug. 2012. doi: 10.1109/TEVC.2011.2161872. [Google Scholar] [CrossRef]
42. E. Zitzler and L. Thiele, “Multiobjective evolutionary algorithms: A comparative case study and the strength Pareto approach,” IEEE Trans. Evol. Comput., vol. 3, no. 4, pp. 257–271, Nov. 1999. doi: 10.1109/4235.797969. [Google Scholar] [CrossRef]
43. S. Bandyopadhyay, S. K. Pal, and B. Aruna, “Multi-objective GAs, quantitative indices, and pattern classification,” IEEE Trans Cybern, vol. 34, no. 5, pp. 2088–2099, Oct. 2004. doi: 10.1109/TSMCB.2004.834438. [Google Scholar] [PubMed] [CrossRef]
44. E. Zitzler, K. Deb, and L. Thiele, “Comparison of multi-objective evolutionary algorithms: Empirical results L,” Evol. Comput., vol. 8, no. 2, pp. 173–195, Jun. 2000. doi: 10.1162/106365600568202. [Google Scholar] [PubMed] [CrossRef]
45. Q. Zhang, A. Zhou, S. Zhao, P. N. Suganthan, and S. Tiwari, “Multiobjective optimization test instances for the CEC, 2009 special session and competition,” in Proc. IEEE CEC, Trondheim, Norway, 2008, pp. 1–29. [Google Scholar]
Cite This Article
 Copyright © 2024 The Author(s). Published by Tech Science Press.
This work is licensed under a Creative Commons Attribution 4.0 International License , which permits unrestricted use, distribution, and reproduction in any medium, provided the original work is properly cited.
 Downloads
 Citation Tools