
 Submit a Paper
 Propose a Special lssue
 Open Access
ARTICLE

Multi-Class Skin Cancer Detection Using Fusion of Textural Features Based CAD Tool
1 Department of Electronics and Communication Engineering, Chandigarh University, Mohali, 140413, India
2 Chitkara University Institute of Engineering and Technology, Chitkara University, Chandigarh, 140401, India
3 Department of Physics & Electronics, School of Sciences, JAIN (Deemed to be University), Bangalore, 560001, India
4 College of Technical Engineering, The Islamic University, Najaf, 54001, Iraq
5 Department of Electronics and Communication Engineering, Uttaranchal Institute of Technology, Uttaranchal University, Dehradun, 248007, India
6 Electrical and Computer Engineering Department, University of Memphis, Memphis, TN 38152, USA
7 Biomedical Sensors & Systems Lab, University of Memphis, Memphis, TN 38152, USA
* Corresponding Author: Manob Jyoti Saikia. Email:
Computers, Materials & Continua 2024, 81(3), 4217-4263. https://doi.org/10.32604/cmc.2024.052548
Received 05 April 2024; Accepted 11 October 2024; Issue published 19 December 2024
 View Full Text
 Download PDF
Abstract
Skin cancer has been recognized as one of the most lethal and complex types of cancer for over a decade. The diagnosis of skin cancer is of paramount importance, yet the process is intricate and challenging. The analysis and modeling of human skin pose significant difficulties due to its asymmetrical nature, the visibility of dense hair, and the presence of various substitute characteristics. The texture of the epidermis is notably different from that of normal skin, and these differences are often evident in cases of unhealthy skin. As a consequence, the development of an effective method for monitoring skin cancer has seen little progress. Moreover, the task of diagnosing skin cancer from dermoscopic images is particularly challenging. It is crucial to diagnose skin cancer at an early stage, despite the high cost associated with the procedure, as it is an expensive process. Unfortunately, the advancement of diagnostic techniques for skin cancer has been limited. To address this issue, there is a need for a more accurate and efficient method for identifying and categorizing skin cancer cases. This involves the evaluation of specific characteristics to distinguish between benign and malignant skin cancer occurrences. We present and evaluate several techniques for segmentation, categorized into three main types: thresholding, edge-based, and region-based. These techniques are applied to a dataset of 200 benign and melanoma lesions from the Hospital Pedro Hispano (PH2) collection. The evaluation is based on twelve distinct metrics, which are designed to measure various types of errors with particular clinical significance. Additionally, we assess the effectiveness of these techniques independently for three different types of lesions: melanocytic nevi, atypical nevi, and melanomas. The first technique is capable of classifying lesions into two categories: atypical nevi and melanoma, achieving the highest accuracy score of 90.00% with the Otsu (3-level) method. The second technique also classifies lesions into two categories: common nevi and melanoma, achieving a score of 90.80% with the Binarized Sauvola method.Keywords
The most common type of cancer and a serious risk to the general public’s health is skin cancer. Skin cancer has the highest chance of spreading to other organs out of all disorders. The dermatologist typically performs physical examinations on patients to identify skin cancer. Clinical assessment reliability is a little ineffective [1]. Melanoma and non-melanoma are the two main classifications used to describe skin cancer. The most deadly of the two is melanoma, which usually begins as a superficial wound that develops into a malignant tumor. Most cases of non-melanoma are classified into two classes: squamous cell carcinoma (SCC) and basal cell carcinoma (BCC). The origins of SCC and BCC are squamous cells and basal cells, respectively.
Several hues are present in pigmented skin lesions (PSLs), which are categorized as serious medical problems brought on by a pigmented area on the skin. Because these lesions include both benign and malignant disorders, they are important from a therapeutic standpoint [2,3].
The conventional method for identifying PSLs is a non-invasive technique known as dermoscopy. To highlight minute details, it is composed of a liquid immersion and a magnifying lens [4]. It highlights the need of a physical examination in healthcare settings [5]. But in an early case of skin cancer, the imaging system might simply take into account a doctor using a standard camera. In this case, pictures of the wound are taken and sent to an expert for assessment. The approach is believed to be efficient as physical identification, albeit much more quickly [6].
Dermatologists are capable of identifying skin cancer prematurely nowadays because of advancements in computational techniques. Establishing robust computational methods for determining skin cancer through images is the primary objective of the emerging domain of research on automated PSL tests. Research demonstrates that in test settings, automated devices could identify skin cancer [7]. CAD strategies have proven to be the ideal alternative for premature detection of skin cancer, which reduces the probability that patients who underwent screening may receive a skin cancer diagnosis without any symptoms. Machine learning (ML) has progressed extensively because of breakthroughs in computing technology and the accessibility of vast image databases.
Deep learning (DL) is eventually substituting traditional ML frameworks in the recognition of skin cancer, primarily owing to the development of deep neural networks (DNN). The traditional method for automatically detecting skin cancer encompasses a number of steps, as illustrated in Fig. 1. The steps are acquiring data, pre-processing, segmenting the data, eradicating the significant attributes, and at last grouping the data through the withdrawn features. The final phase in the procedure computes the trained classifier using the appropriate metrics.
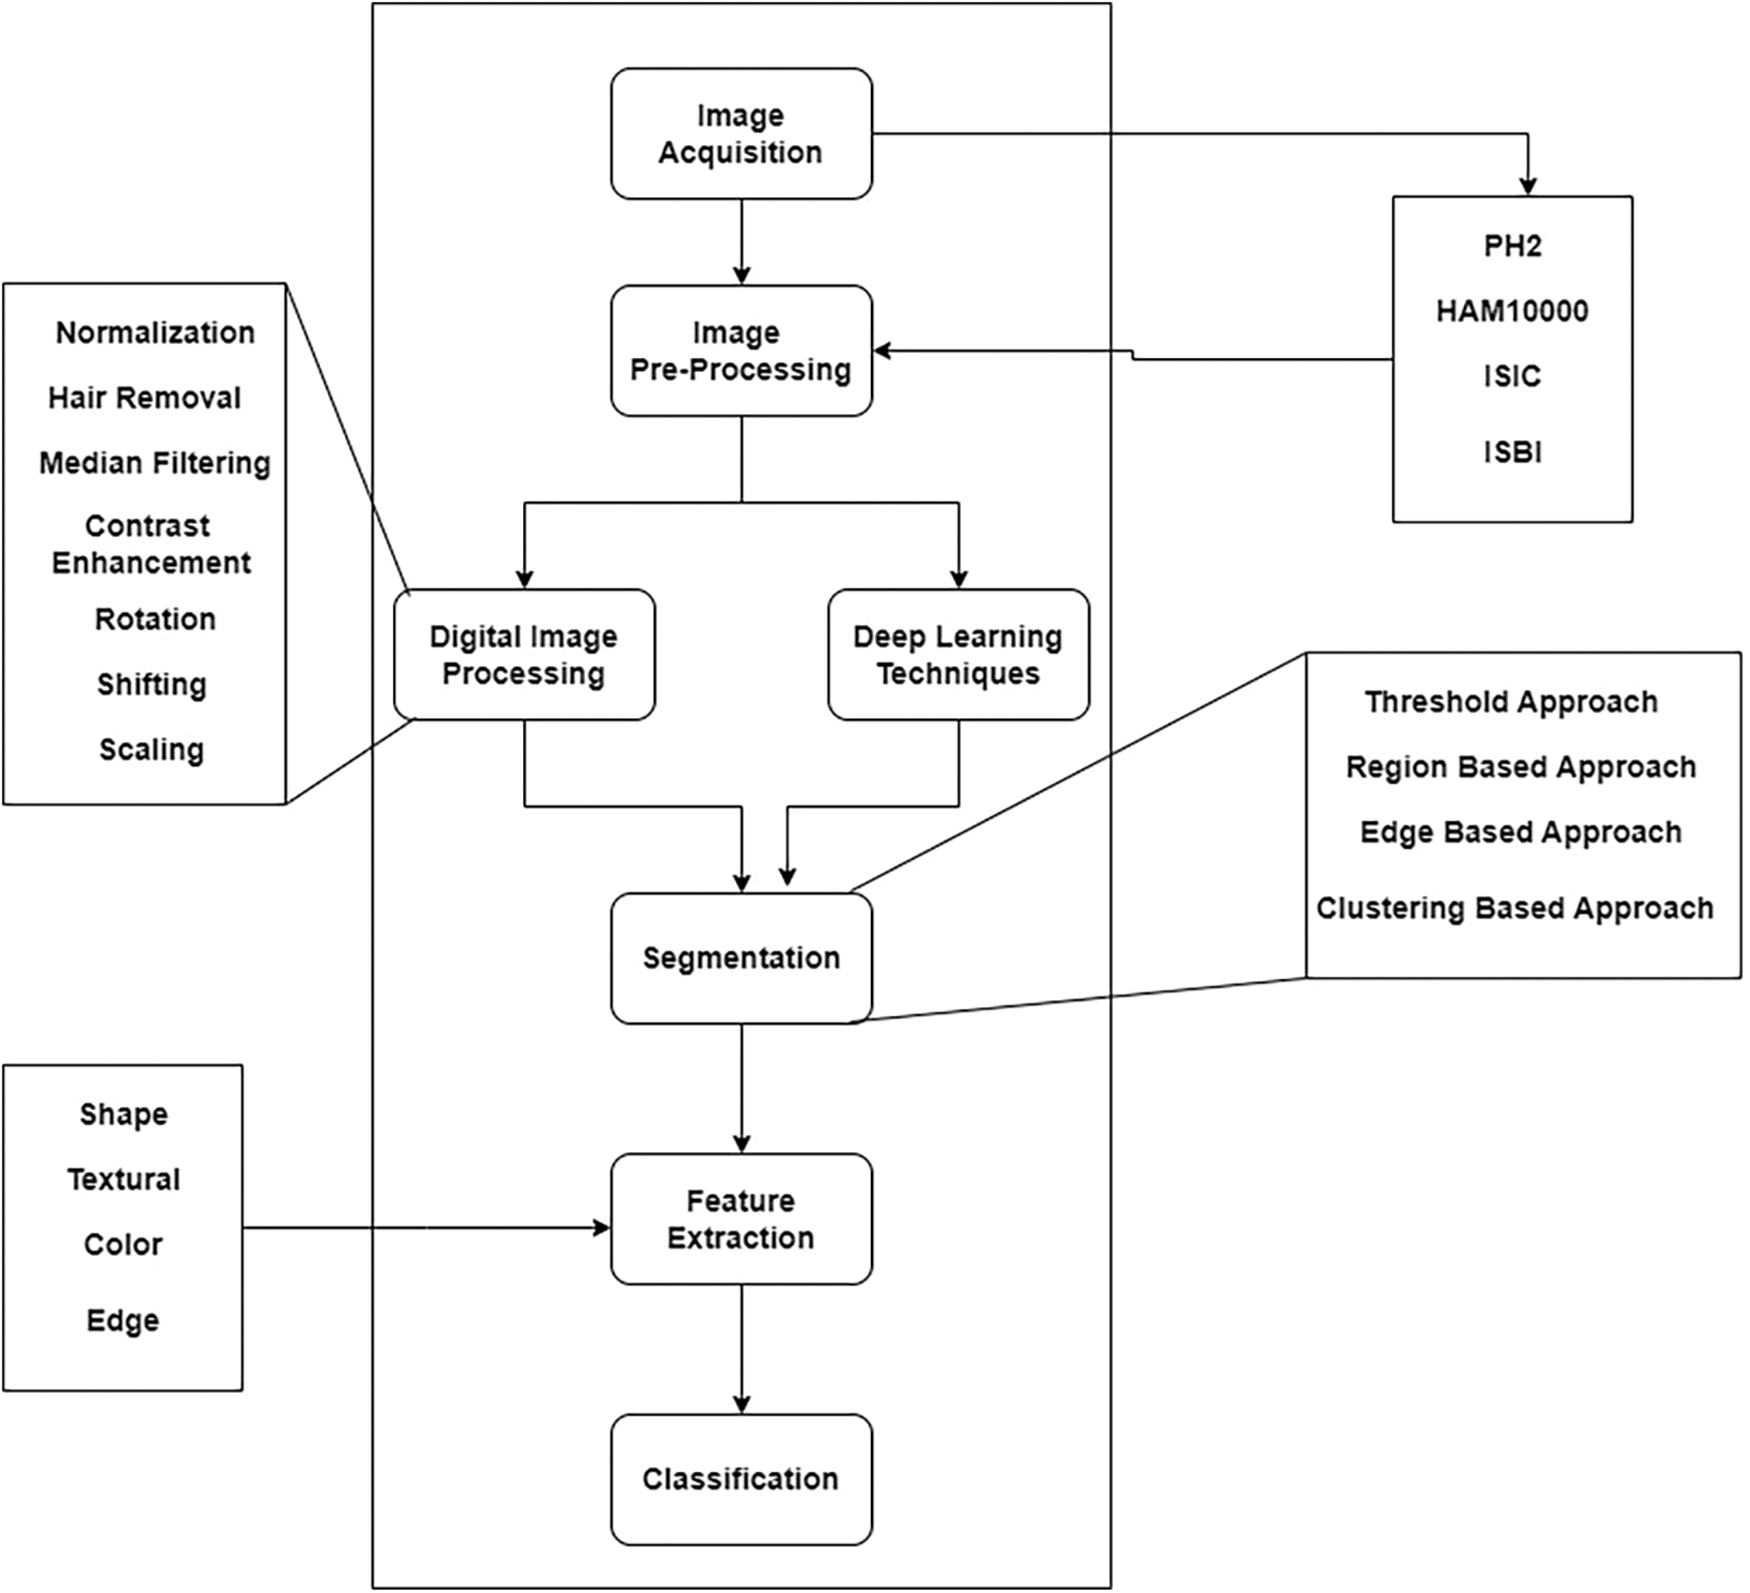
Figure 1: Typical procedure for designing and creating an automated system to detect skin cancer
Skin cancer develops by ultraviolet (UV) radiation from the sun, which is highly intense and damaging [8,9]. It usually surfaces as an unusual or evolving spot on the skin. This spot could have the appearance of an injured area of skin, a mole, or an unhealing blister. The unusual formation of a new lesion or lump is a common warning sign for skin cancer. A mole that evolves in size, color, or shape over time may also be an indication of skin cancer. Melanoma, SCC, and BCC are the three predominant kinds of skin cancer [10]. Depending on where it originates, BCC possesses distinct looks and is the least malignant type.
A small, smooth bulge that appears translucent or pearly will develop on the face, ears, or neck. It is capable of bleeding by itself. On the torso, arms, or legs, it emerges as a flat patch of pink, red, or brown color. The texture of it usually seems harsh or rough. Since it originates from cells in the stratum basale, BCC gets its name. SCC is similar to red, firm nodules. Moreover, the growth might seem scaly, rough, and flat. This might become crusty, bleed, or cause pain. SCC is caused by cells in the stratum spinosum, specifically keratinocytes [11]. SCC is less prevalent than BCC as the cells cannot divide as often as they do in BCC. But when it develops, it can be hazardous because it metastasizes rapidly. It is speculated that UV light from the sun triggers these cancers by traversing skin cells and affecting cells in the stratum spinosum that mutates their DNA, resulting in cancer. Melanoma accounts for 1% of all skin cancers [12]. However, it is among the most fatal forms of skin cancer [13]. It may damage lymph nodes or various organs and spread drastically. Despite its color and shape being irregular, it generally possesses the appearance of a brown patch. Certain melanomas originate from an ordinary mole. Melanoma is a cancer of melanocytes that are located in the basal layer of the stratum basale of the epidermis. Melanoma might develop spontaneously or as a consequence of pre-existing moles. It metastasizes far more rapidly than SCC. Melanoma is generally identified following the ABCD rule. It specifies that A represents asymmetry (i.e., the two sides of the mole are uneven), B specifies an uneven border, C is for color (when the pigmented area has multiple hues), and D specifies diameter (when the spot is larger than 6 mm) [14,15].
Dermoscopy was created to enhance the skin cancer diagnostic process. It is a non-invasive visualization technique that generates a brighter, more intense illustration of a specific area of skin, making skin markings easier to see. The removal of the reflecting skin surface improves the visibility of deeper skin layers and gives additional details about the lesion. Dermoscopy evaluation is a usual way of recognizing melanoma as it is more reliable than visual inspection [16]. Dermoscopic evaluation of images by specialists typically takes a significant amount of time and may result in a range of diagnostic results. As a result, automated identification methods are highly recommended. But for the reasons listed below, it is not a simple task: First, it might be difficult to differentiate between non-melanomas and melanomas owing to the similarities of benign and malignant lesions. Second, the automated identification process is more difficult due to low contrasts and unclear borders between the lesion and normal skin areas. Last but not least, the development of artifacts like hairs or air bubbles may mask the lesions. The difficulties are shown in Fig. 2. The types, causes and diagnosis approaches for skin cancer are shown in Fig. 3.
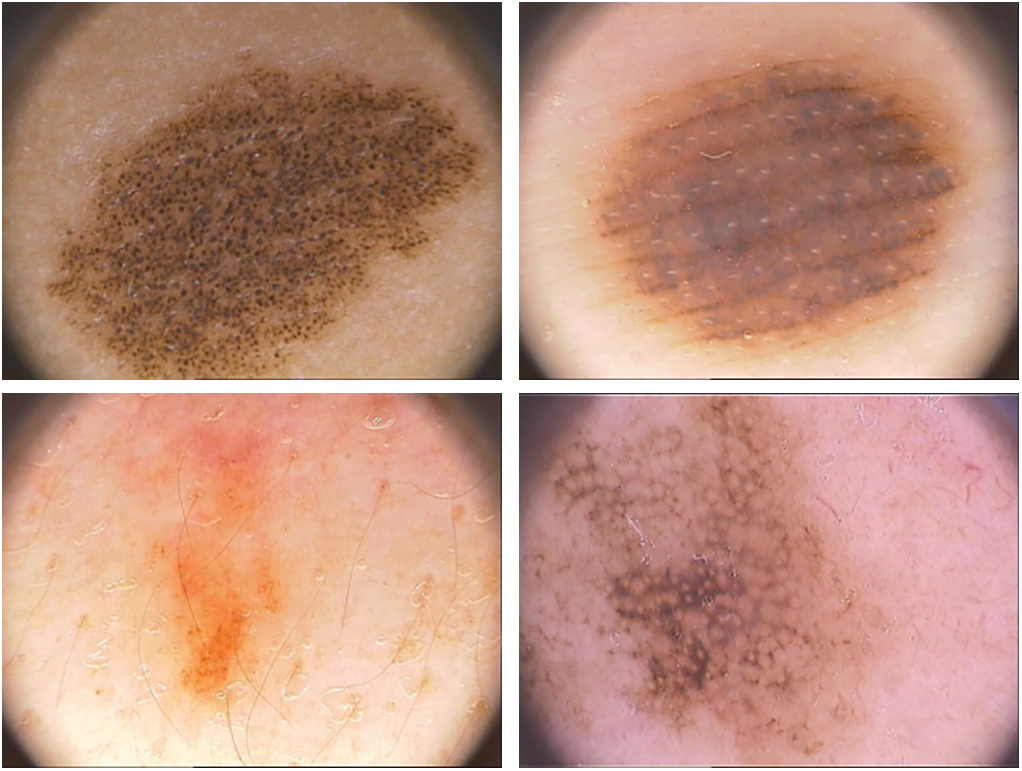
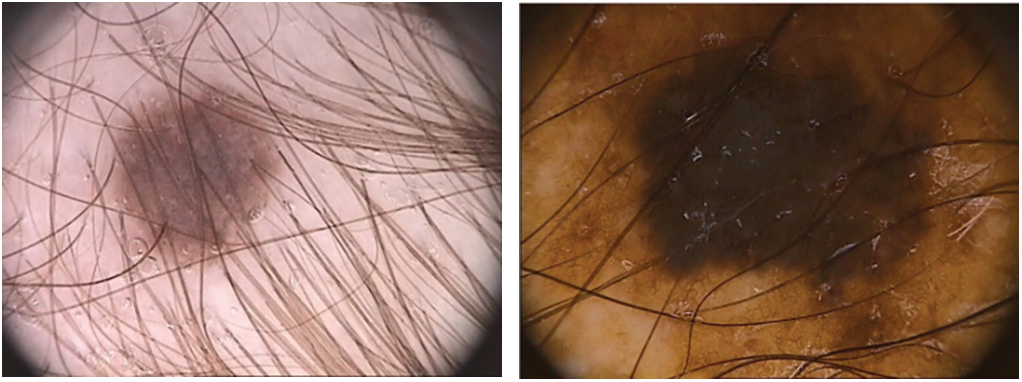
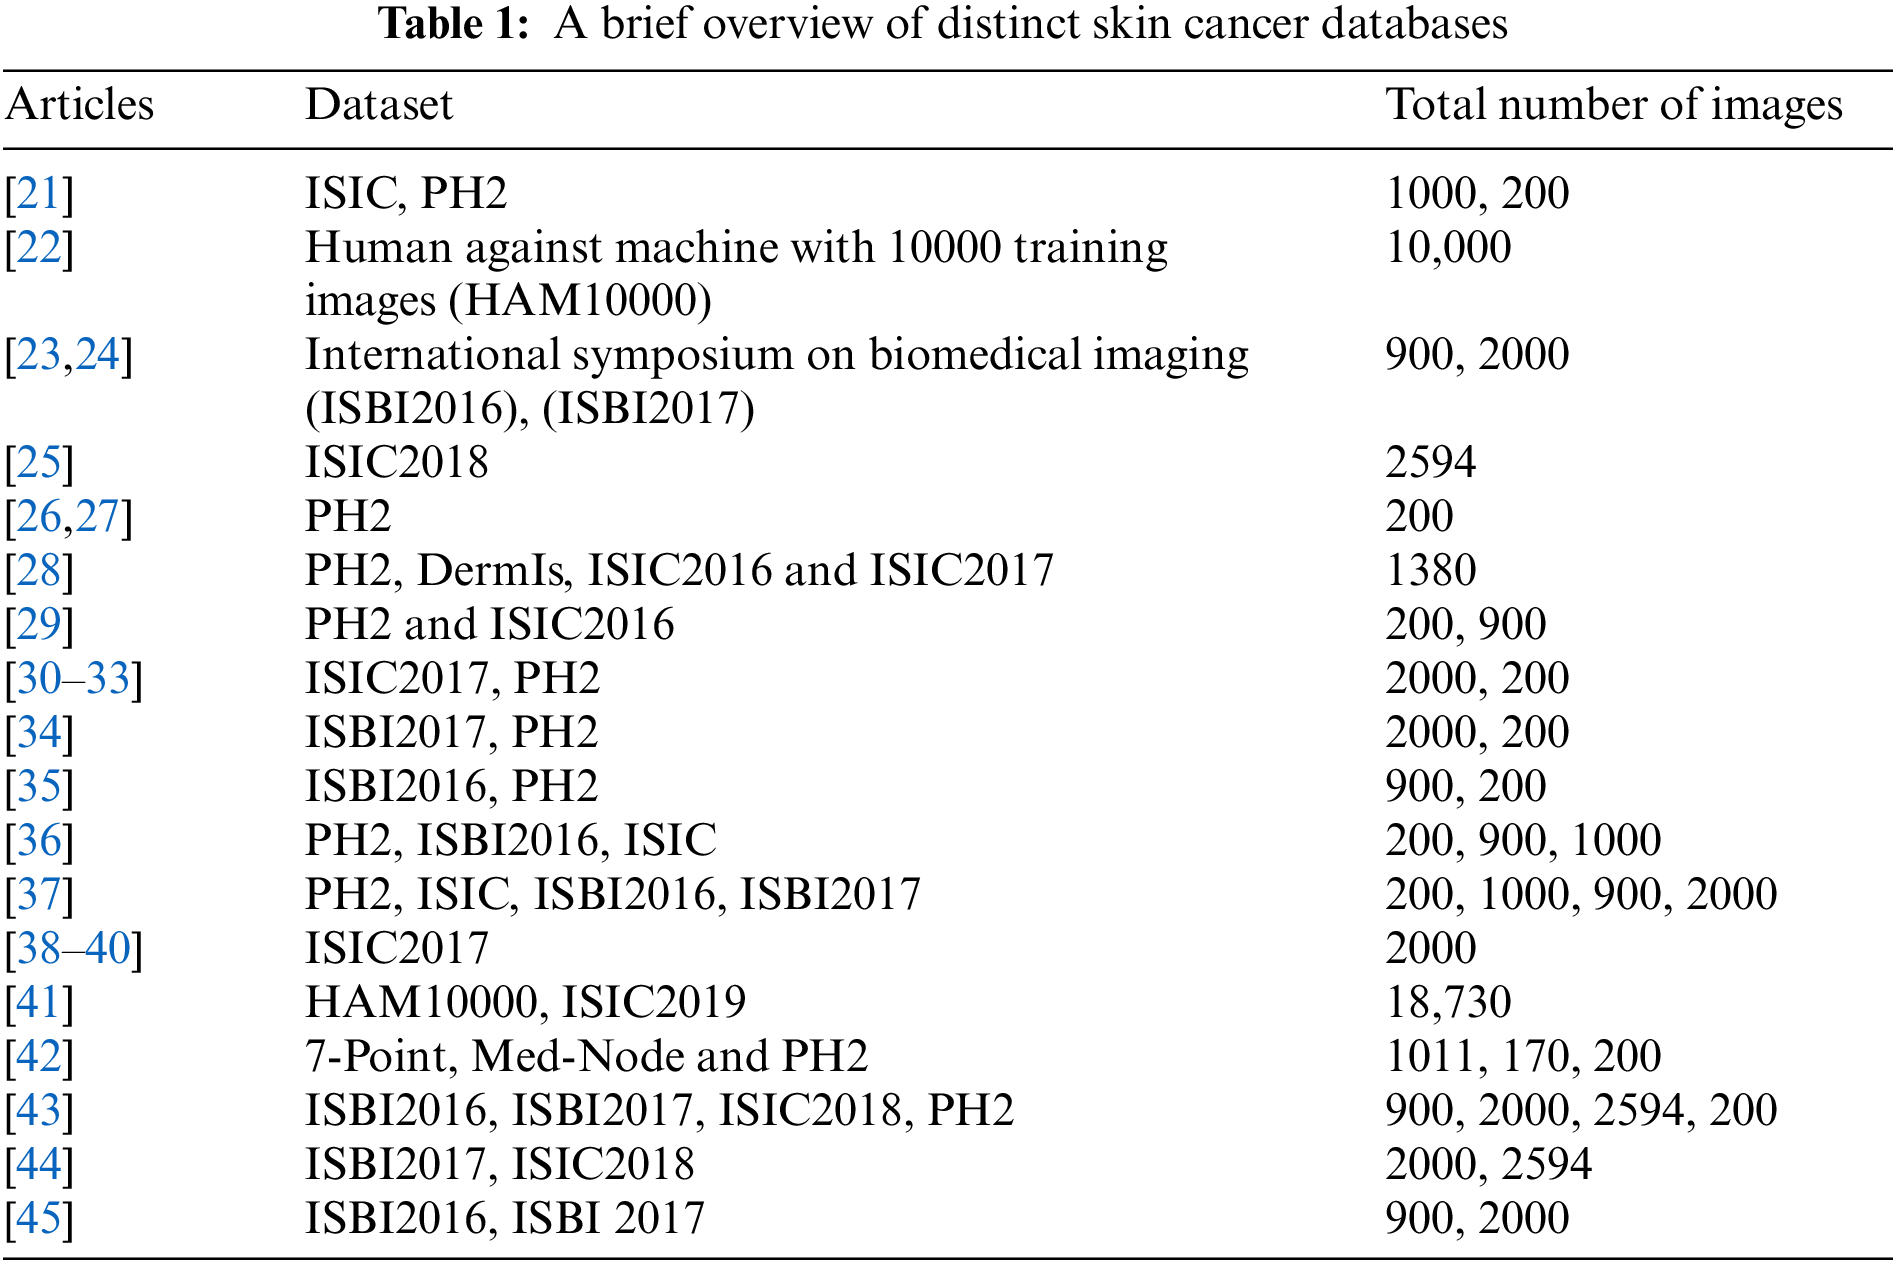
Figure 2: The process of automatically identifying melanoma from dermoscopy images is quite difficult. From top to bottom, the primary difficulties are: a significant level of visual resemblance amongst lesions that are melanoma compared to ones that are not; comparatively little difference among lesions and areas of healthy skin; and picture artifacts. Images in the left column display non-melanomas, whereas those in the right column display melanomas
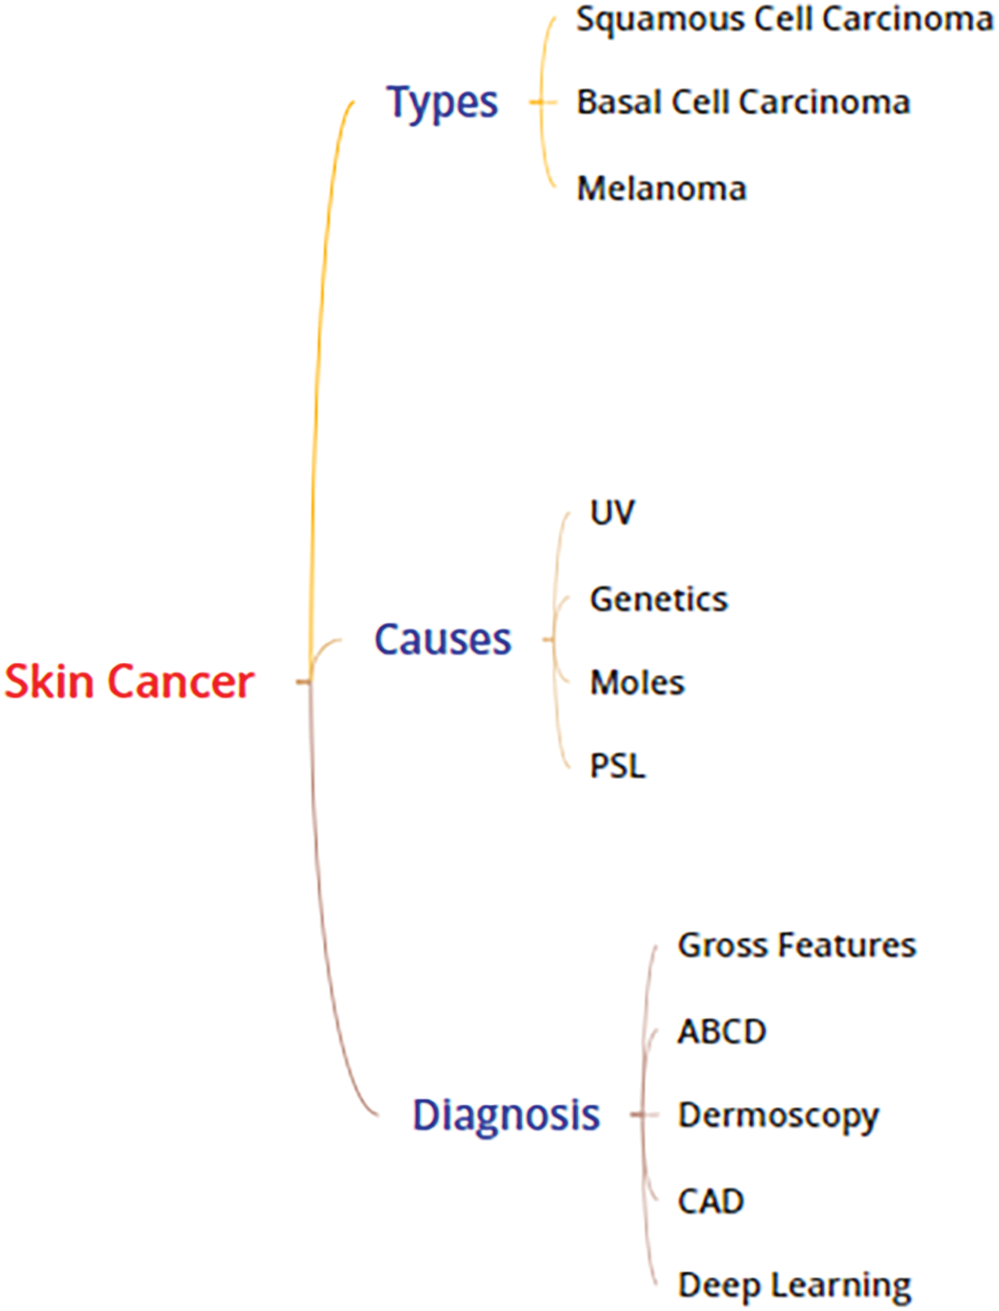
Figure 3: Skin cancer: types, causes and diagnosis
To solve these challenges, numerous algorithms have been advocated that are significantly categorized into thresholding, edge [17] and region-based approaches [18]. For instance, the integration of global thresholding, adaptive thresholding, and clustering thresholding is presented in [19].
In case of a strong variability between the skin and the lesion, thresholding techniques work well; nevertheless, they are ineffective when the modes from the two locations overlap. However, the edge-based approach is not effective when the skin and lesion are growing together naturally and the edges are not visible. Another issue resulting from artifacts is the emergence of artificial edge extremities that do not belong in the lesion periphery. The over-segmentation that occurs when distinct colors are present in lesions and skin presents a problem for the region-based method.
Early identification of skin cancer by image processing techniques may lead to additional therapeutic identification and management. With the advancement of image processing techniques in the field of therapeutic detection, there is a possibility of early diagnosis and prevention of skin cancer. The skin tumor detection application works in several steps on a smartphone. The primary steps in image processing are skin lesion segmentation, feature extraction, and lesion classification into benign, atypical, and malignant lesions [20]. Skin cancer segmentation strategies rely on morphological methods, thresholding, and a number of segmentation procedures. In the majority of applications, the various attributes that are extracted with the goal of identifying skin cancer are color, form, texture, and geometry. Support vector machines (SVMs) and kernel neighborhood network (KNN) classifiers are also widely used for classification in a similar manner. Two of the software applications used to do the skin cancer diagnostic process are Matlab and OpenCV.
In this paper, we present and evaluate numerous segmentation approaches from the three categories: thresholding, edge-based, and region-based. The algorithms are executed on 200 dermoscopic images of benign and melanoma lesions from the Hospital Pedro Hispano (PH2) dataset. The computation is based on 12 distinct metrics that account for various types of errors with unique therapeutic significance. We evaluate the performance of these approaches independently for three different types of lesions: melanomas, atypical nevi, and melanocytic nevi.
Over the past decade, there have been numerous openly accessible datasets of skin images operated by various groups. The commonly used databases are PH2 and International Skin Imaging Collaboration (ISIC). Table 1 brings forth an overview of distinct datasets.
There are some unwanted artifacts in the pictures that cameras take, which complicate the segmentation process. The pre-processing stage works to eliminate anomalies such as hair or bubbles surrounding the lesion and lighting errors that occurred during the picture collecting phase. For the algorithms to function correctly in subsequent analysis, this phase is essential for an accurate evaluation [46]. Various pre-processing approaches such as normalization [30,32], hair removal [47,48], median filtering [28,29,49], contrast enhancement [50,51], rotation [52–54], shifting [55–58] and scaling [59] have been used.
As we previously stated, the generated images may have fluctuations in light, which, if used directly for segmentation data, would lead to blurry lesion boundaries and shading. Previous segmentation has the effect of reducing the shading of the original image. After Cavalcanti et al. [60] proposed an analytical method for decreasing shadowing in the HSV color space, Amelard et al. [61], Cavalcanti et al. [62], and Amelard et al. [63] used it. In a second study [64], artifacts are removed by leveling out the steep slope in the saturation and value channels using HSV color space. The remaining studies [65–68] used a similar approach. A multi-stage artifact enhancement method was suggested by Amelard et al. [69] to remove reflected artifacts from images. For enhancing illumination variability in medical images, the same researchers [70] employed the previous strategy in their follow-up work and also suggested a novel multistage illumination modeling approach (MSIM). In another research project, the authors reduced illuminations using the MSIM approach [71,72]. To get rid of the reflected artifacts, the researchers [73] employed an in-painting method and a thresholding approach that was suggested by Barata et al. [74]. Ramezani et al. proposed employing a median filter with the mask size in combination with a shadow elimination method in HSV color space to attenuate the shading [75].
Several researchers used a tool called DullRazor [76] to eliminate hair artifacts from medical pictures [77]. Hair segmentation and elimination utilizing matching filter and region growth approaches were suggested by Huang et al. [78]. In order to compare and contrast the two, the researcher also employed DullRazor and its recommended technique with their own dataset. Compared to its technique, the DullRazor proved to have a higher percentage of false-hair diagnoses. Dense hair was eliminated from the images by Ramezani et al. [75] using a morphological opening and a morphological transformation in the bottom hat. Oliveira et al. [79] utilized an anisotropic diffusion filter to remove hair. In another research effort, morphological closure techniques were used to interpolate hair pixels with neighboring pixels in order to eliminate hair artifacts [65]. The researchers then found hair intersections using linear discriminant analysis (LDA) [80]. The Gaussian filter has been extensively employed in related studies to eliminate noise from the input pictures [81,82]. In an additional study, guided filtering—an edge-preserving smoothing technique—was used to eliminate the artifacts [83,84].
2.1 Convolution Neural Network (CNN) Based Models
CNN-based classification models must be trained with each source image having the same size. Mechanisms like cropping, resizing, and rescaling can be used to combine the dataset configurations in order to accomplish this. When new and distinct instances are added to the dataset for training, data augmentation makes machine learning models more effective. To ensure that the architecture runs effectively, there needs to be an adequate repository that can deliver more data and has several desirable features. Using data augmentation approaches to incorporate variations that the model typically encounters in practice could strengthen machine learning models and increase the likelihood of issues such as over-fitting. Additionally, the data are unbalanced because the number of instances of various skin disorders is higher than that of melanoma. Data augmentation can be used, for example, to balance a dataset. Several studies have employed widely used methods for augmenting data, including scaling [86–90], flipping, rotation, and cropping [85–90]. To reduce the noise in the dataset, researchers employed a range of methods, including guided filters, Gaussian low-pass filters, blur filters, motion blur, noise addition, and histogram equalization [85,88,91,92]. Adjustments in color and brightness have also been made in [70,91]. After training generative adversarial networks (GANs) on digital images of cutaneous lesions, the researchers presented a DL approach for controlling variable background illumination [93]. These days, researchers are using DL layouts a lot to identify skin lesions from medical imaging. The lighting in images of skin lesions may be adjusted with the use of these deep learning techniques. In order to correct for variable background intensity in dermatological images, the study introduces a novel transform known as IECET [94].
2.2 Role of Segmentation Techniques in Skin Cancer Detection
Segmentation is an approach that partitions the picture into numerous segments or pixels for the purpose of enhancing image analysis [95]. It facilitates identifying tumors from an analyzed picture easier. However, it is essential to recall that image segmentation is a complicated procedure that may necessitate further processing. The 2 leading approaches to segmentation are K-means clustering and Otsu’s approach [75,96,97]. Sagar et al. [65] implied a color channel-based technique that merged an edge detection mechanism with a modified 2D Otsu approach.
The researchers report a 93.7% accuracy rate using their suggested strategy for lesion identification from a source image. A number of researchers used the K-means clustering approach with K = 2 for segmentation [82,83]. Another study suggested combining Otsu thresholding with K-means, which produced accuracy and AUC values of 0.91% and 89.07%, respectively [98]. An improved K-means variation with a 94% accuracy rate has been suggested in a different study [83]. In addition to these methods, image segmentation in [72] was done using Chan Vese’s active contour approach [99]. In [64,100], a novel segmentation technique combining Chan level set border detection with rapid independent component analysis (FastICA) has been demonstrated. A novel method that combines specific morphological analysis with Chan Vese active contour computing was put forth by Roberta et al. [79]. The TDR value outperformed the Otsu technique’s results while using the same set of data [101]. Furthermore, Sabouri et al. segmented photographs using CNN boundary-identification technology, producing an 86.67% Jaccard Index score [102].
Using GAN and a U-Net generator, Udrea et al. identified and suggested pigmented lesions with 91.40% accuracy [103]. Another research effort [104] used a U-Net with four subsampling layers to segment medical images. The method was first proposed in [105], where 92%, 98%, and 95% percent accuracy, specificity, and sensitivity were obtained, respectively. Another research study [106] has demonstrated a fuzzy C-means clustering algorithm with sensitivity, specificity, and accuracy of 90.02%, 99.15%, and 95.69%, respectively. A strategy called interactive object recognition was used in another investigation for the segmentation [107]. A further study has presented a unique segmentation approach that uses edge detection, thresholding, and evaluation of a correlated element of the mask to extract geometric features based on ABCD [108]. For determining the threshold level from medical macro photos, a CNN method called DTP-Net was introduced [109].
2.3 Feature Extraction and Feature Selection
The processes of feature extraction and selection are fundamental components of machine learning. The latest studies on the diagnosis of skin cancer include a variety of attributes, particularly distinct aspects derived from the dermatologist’s ABCD rule. The feature selection approach is usually utilized to limit the feature set’s size. However, a number of research employed DNN and charged CNNs with feature extraction. PSLs are evaluated using the ABCD rule; further assessment by a specialist is required for these lesions [110]. By computing asymmetry, the authors in [101] were able to estimate the lesion’s major and minor axes [111]. The region of the lesion was split into 2 parts, employing an axis derived from the longest diagonal vector corresponding to the Euclidean distance of the affected area [112].
The edges of the lesion, deformity, four features based on the radius [113], asymmetric edge indices [114], compactness index [115], Heywood circularity index, mean curvature [116], best-fit ellipse indices [117], bulkiness index [118], bending energy, area, perimeter of the convex hull, convexity index, indentation and protrusion index, and fractal dimensions were among the features extracted for border irregularity. In the three color channels, the average gradient magnitude and variance in the lesion expanded rim were retrieved in [119]. The gray-level co-occurrence matrix (GLCM) [120,121] has been employed by numerous authors for acquiring textural information [82,98,101,122] and is, therefore, the most frequently employed method. Furthermore, the authors in a distinct study employed the gray-level run length matrix (GLRLM) [123]. For acquiring the textural attributes of cutaneous lesions, the authors employed the local binary pattern (LBP) [124]. In another study, the authors employed a mechanism called Color Image Analysis Learning Vector Quantization (CIA-LVQ) [125].
In another study, the local features were acquired employing the interest points that were identified with the help of the difference of Gaussian (DoG) [126]. Pacheco et al. [86,91] suggested an approach to merging CNN-extracted attributes with medical information and this proposed methodology was called MetaBlock. According to the study’s results, MetaBlock can be a more effective feature combination technique than conventional concatenation approaches. The authors in [127] adopted the same technique on the model they utilized in a recent investigation. A pre-trained ResNet50 had been employed by the authors in their model for withdrawing deep features [128].
The acquired attributes are then used to assess and provide the PSLs’ detailed classification data. A training set of data is used to create a classification method, which is subsequently used by several classifiers. As a result, the features and classifier drive the model’s performance. Furthermore, comparing methods of classification with the same dataset and features is often beneficial [46]. Compared to fully linked networks, CNNs are frequently simpler to train and require fewer hyper-parameter modifications. Custom CNN models have been trained to recognize skin lesion photos in certain investigations [81,88,102]. The researchers in [83] used two convolutional layers in each of two similar CNN frameworks to assess the overall structure and distinct texture of skin pictures. The researchers combined them to create a fully connected layer. CNNs had been employed in a different study to extract features from photographs [92]. CNNs that were initially trained to respond to classification issues had undergone modifications as a result of numerous investigations [129]. A few researchers used ResNet50 [130] and GoogleNet [85,91,131]. ResNet-152 was tuned to function as a classifier in a different study [132]. The same researchers trained a CNN to categorize images into 134 groups in a separate test [133]. The researchers in Reference [123] used a customized artificial neural network (ANN) to achieve the categorization goal. The researchers of a different study [61] proposed a linear soft margin SVM as an alternative to the linear SVM utilized in [67]. In [119], an SVM architecture with a kernel for the histogram’s intersection was employed as the classification strategy. Additionally, the researchers in [129] classified many categories using a weighted SVM and adjusted them according to each category’s degree of complexity. Two machine learning models—KNN and a hybrid classifier created by fusing KNN and Decision Tree (DT)—were employed in a different investigation [60]. The KNN was used for binary classification in a different study [108].
Non-invasive detecting techniques have emerged from using incident light, oil immersion, and magnification. The epiluminescence microscope (ELM) stimulates these mechanisms. Nonetheless, experience as a medical professional is still required for accuracy. Recently, a variety of methods have been used in experiments with automatic skin cancer diagnosis. Computer-Aided Diagnosis (CAD) approaches for dermoscopic pictures have evolved to readily stimulate the diagnosis of worrisome lesions, hence aiding dermatologists in their diagnostic evaluation. Furthermore, inexperienced practitioners may utilize it as a supplementary tool to carry out an initial inquiry [46]. Considering the key elements which are excluded from the dermoscopic pictures, these therapies might be grouped into broadly 2 categories. By automatically eradicating the identical attributes, a subset seeks to resemble therapeutic recognition strategies. Another discipline has its foundation in machine learning and computational pattern recognition utilized for common visual elements. In [134], a depiction of an assessment network affected by therapy aspects is shown.
Gola et al. [135] demonstrated a method for diagnosing melanoma. The globular and reticular patterns are identified by pattern analysis, which is the basis for this automated approach. An additional study that presents automatic melanoma identification is [136]. The dermoscopic rules calculated using the ABCD rule are the foundation of the framework.
The majority of the CAD observed with the ML method has been reported [137–139]. A methodology that uses the K-nearest neighbors (KNN) classifier and removes distinguishing variables including color, texture, and border was given by Ganster et al. [19]. The methodology achieved 92% specificity (SP) and 87% sensitivity (SE). Another study involved Artificial Neural Networks (ANN) utilized as classification entities [138] and the features withdrawn were border and color. In another study, a skin lesion classification formulated on SVM is presented [111]. The features withdrawn include shape, texture, and color; attaining a SE of 93% and a SP of 92%.
Tumpa et al. [140] presented melanoma recognition and classification based on ANN utilizing composite texture features. The procedure employs Otsu’s thresholding segmentation and the features withdrawn are ABCD, LBP, and GLCM, attaining an accuracy of 97.7%.
While each investigating organization chooses a distinct data source, results evaluation becomes complicated regardless of whether the CAD practices offer desirable outcomes. It is therefore prevalent to have to create a dataset of dermoscopic pictures that researchers can employ as ground truth.
Skin cancer assessment and categorization are largely processed through DL algorithms especially CNNs. ML and hybrid methods are utilized as well from time to time.
A procedure of removal of artifacts and noise from the raw data file is referred to as pre-processing. The most important phase in the procedure of segmentation is to discover and describe the area of lesion in the pictures.
Feature extraction is a crucial step in obtaining relevant data from the partitioned area. Domain-specific features are often used in machine learning settings. Thanks to DL, the field of ML has completely changed in the last few decades. It is believed that ANN algorithms represent the most sophisticated area of ML. These frameworks got inspiration from the formation and functioning of the human brain. In many different situations, DL methodologies have demonstrated impressive results contrary to distinct conventional ML techniques. Many DL approaches have been used in computer-based skin cancer screening throughout the last few decades.
Summary: In the latter half of the 20th century, investigators started to investigate the possibility of computers augmenting and analyzing medical images. The primary focus of CAD software was basic pattern recognition in radiographic images. The journey of CAD started as a quest to augment human vision with computing capacity. In recent times, artificial intelligence (AI) and machine learning evolved to an extent where CAD has emerged as an exceptionally developed platform for discerning minute inconsistencies that are largely overlooked by human vision. The advancement was thwarted by certain challenges. Owing to the lack of precision and inability to overtake human experience, early CAD methods were viewed with skepticism But persistent exploration and development in technology made it suitable for CAD to enhance our potential and emerge as an effective testing technique.
CAD is a technique that effectively merges modern innovations in technology and medicinal attributes to offer a rather prudent solution. Optimizing the precision as well as the efficacy of disease observation by means of the utilization of several feasible techniques is a primary goal of the comprehensive architecture. A lot of advantages stem from CAD synthesis in the therapeutic domain. Most specifically it allows for identifying cancers at an early stage and enhances the accuracy of diagnosis while minimizing the duration of time necessary for interpreting. Diagnoses might be conducted more efficiently and precisely attributable to the practical equipment termed computer-aided diagnostic (CAD). However, there are actually plenty of problems with CAD operation. Among the primary issues is the fact that algorithm training relies on reliable information that may prove a limitation for specific circumstances. Furthermore, the integration of CAD into conventional healthcare services implies significant infrastructure and mechanical modifications.
3 Challenges in Detecting Skin Cancer
There are a few complications in detecting skin cancer that are associated with variations in image kinds and sources [141,142]. The distinction in human skin color makes the recognition of skin cancer complicated [143]. The prime complications of skin cancer are the numerous sizes and configurations of the images, which cannot provide a precise outcome of recognition. In this regard, pre-processing is necessary for precise evaluation. Some unnecessary signals are to be adapted, which are actually not part of an image, although they might be interrupted to attain a better outcome. Therefore, every noise has to be removed in the pre-processing stage. Another complication is that low contrast from adjoining tissues extends additional problems, making it difficult for precise analysis of skin cancer. Distinct components of color illumination, for instance, the texture of color, reflections, etc., also cause certain complications. There are certain moles that might never evolve cancer cells, but they produce several complications in identifying skin cancer precisely from cancerous images. In addition to instances involving accessibility and statistical value, DL experiences issues with both over-and under-fitting. If a DNN seeks to establish noise in the input data instead of identifying core patterns, it constitutes over-fitting. On the other side, if the algorithm seems overly basic or unable to identify complicated structures in the data, it may underfit.
For computer vision (CV) and feature extraction procedures, the segmentation of a digital image is a crucial task for the evaluation of the image. It is a procedure for dividing an image into several divisions or sub-divisions separated by gray values that coordinate with distinct real-world entities in the image. Of all the segmentation methods, thresholding is the most fundamental and effective approach for digital image segmentation. The distinct kinds of approaches for segmentation are present in [144,145]. The leading domain in image processing is image segmentation with multi-level thresholding. The analysis of thresholding techniques and their significance is discussed in [146]. Thresholding approaches are typically of 2 classes: (i) bi-level and (ii) multilevel thresholding (MT). It relies upon thresholding magnitude evaluated on the grayscale dimensions. The image in the bi-level thresholding approach is partitioned into 2 divisions on the basis of threshold magnitude, the partitioning factor; thresholding magnitude is specified on the histogram. An extensive histogram-based approach called Otsu’s method of segmentation is an example of bi-level thresholding [96]. A slight transformation to Kittler and Illingworth’s minimum error thresholding is discussed in [147], entropy based MT of grayscale images is discussed in [148], and a novel cluster evaluation based threshold selection approach is discussed in [149]. An innovative fuzzy classification entropy method that lowers the processing time for determining the ideal thresholds for MT is presented in [150]. The ideal threshold is computed by the augmentation of Kapur’s or Otsu’s objective function using the Krill Herd Optimization technique [151]. The criterion of the MT approach is to divide digital images into more than 2 divisions by selecting numerous gray terms on the histogram to accomplish certain conditions [152]. An MT image segmentation approach employing a transformed salp swarm algorithm (SSA) is discussed in [153].
The following segmentation techniques have been utilized and compared belonging to the categories: Thresholding based, cluster based, edge based, and region based.
4.1 Otsu’s Thresholding Based Segmentation
It is utilized for implementing automatic image thresholding in image processing. This method divides a pixel into foreground and background by returning a single intensity threshold. Fig. 4 illustrates skin cancer images after applying Otsu thresholding in the proposed methodology. The method examines the threshold which reduces the intra-class variance, characterized as a weighted aggregate of variances of the 2 categories. The clip limit (CL), as well as block size (BS), are two significant CLAHE parameters. These two factors primarily regulate enhanced image quality. Due to the input image having poor intensity and the large clip limit obtaining histogram flatter, the image becomes brighter when the clip limit is increased. The dynamic range expands along with the block size, which also increases image contrast. When using the entropy of the image, the two factors define at point having the highest entropy curvature and generate inputs with a subjectively high quality [48]. Each contextual region is subjected to histogram equalization using the CLAHE method. The clipped pixels from the original histogram are then distributed among each grey level. The redistribution histogram differs from the regular histogram since each pixel intensity is restricted to the selected maximum. However, enhanced and the input image carry minimal and maximal grey values. The steps of the CLAHE algorithm to enhance an input image are as follows:
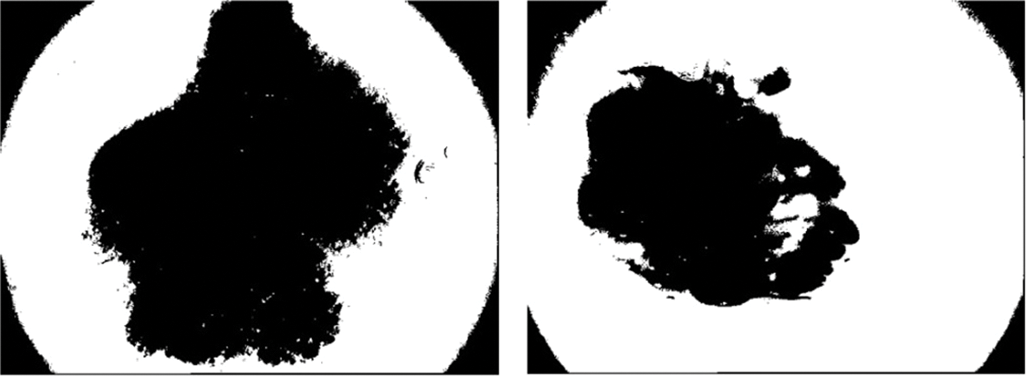
Figure 4: Illustration of skin cancer images after applying Otsu thresholding
Stage 1: Separate an input intensity image into disjoint contextual areas. The overall number of image tiles is equivalent to M × N, and 8 × 8 is a good score to maintain the chromatic information of an image.
Stage 2: Calculate a histogram of each contextual area by grey levels present in the array image.
Stage 3: Compute a contrast limit histogram of the contextual regions by the clip limit value as:
where
The class probability ω((1, 2)) (t) is calculated from N bins of histogram as:
where
4.2 Multilevel Thresholding Using Otsu
According to this approach for MT, the gray levels of the image are divided into groups or divisions. Let R be the whole area of space that an image occupies. The goal of image segmentation is to split the region R up into smaller sections R1, R2, ..., RN.
For this procedure a thresholding level (t) is specified, the rule set for bi-level thresholding can be stated as follows:
Here
In case the pixel value lies below threshold t, it corresponds to Region R1, else it corresponds to Region R2. The rule set for n MT can be stated as:
Else if
Here
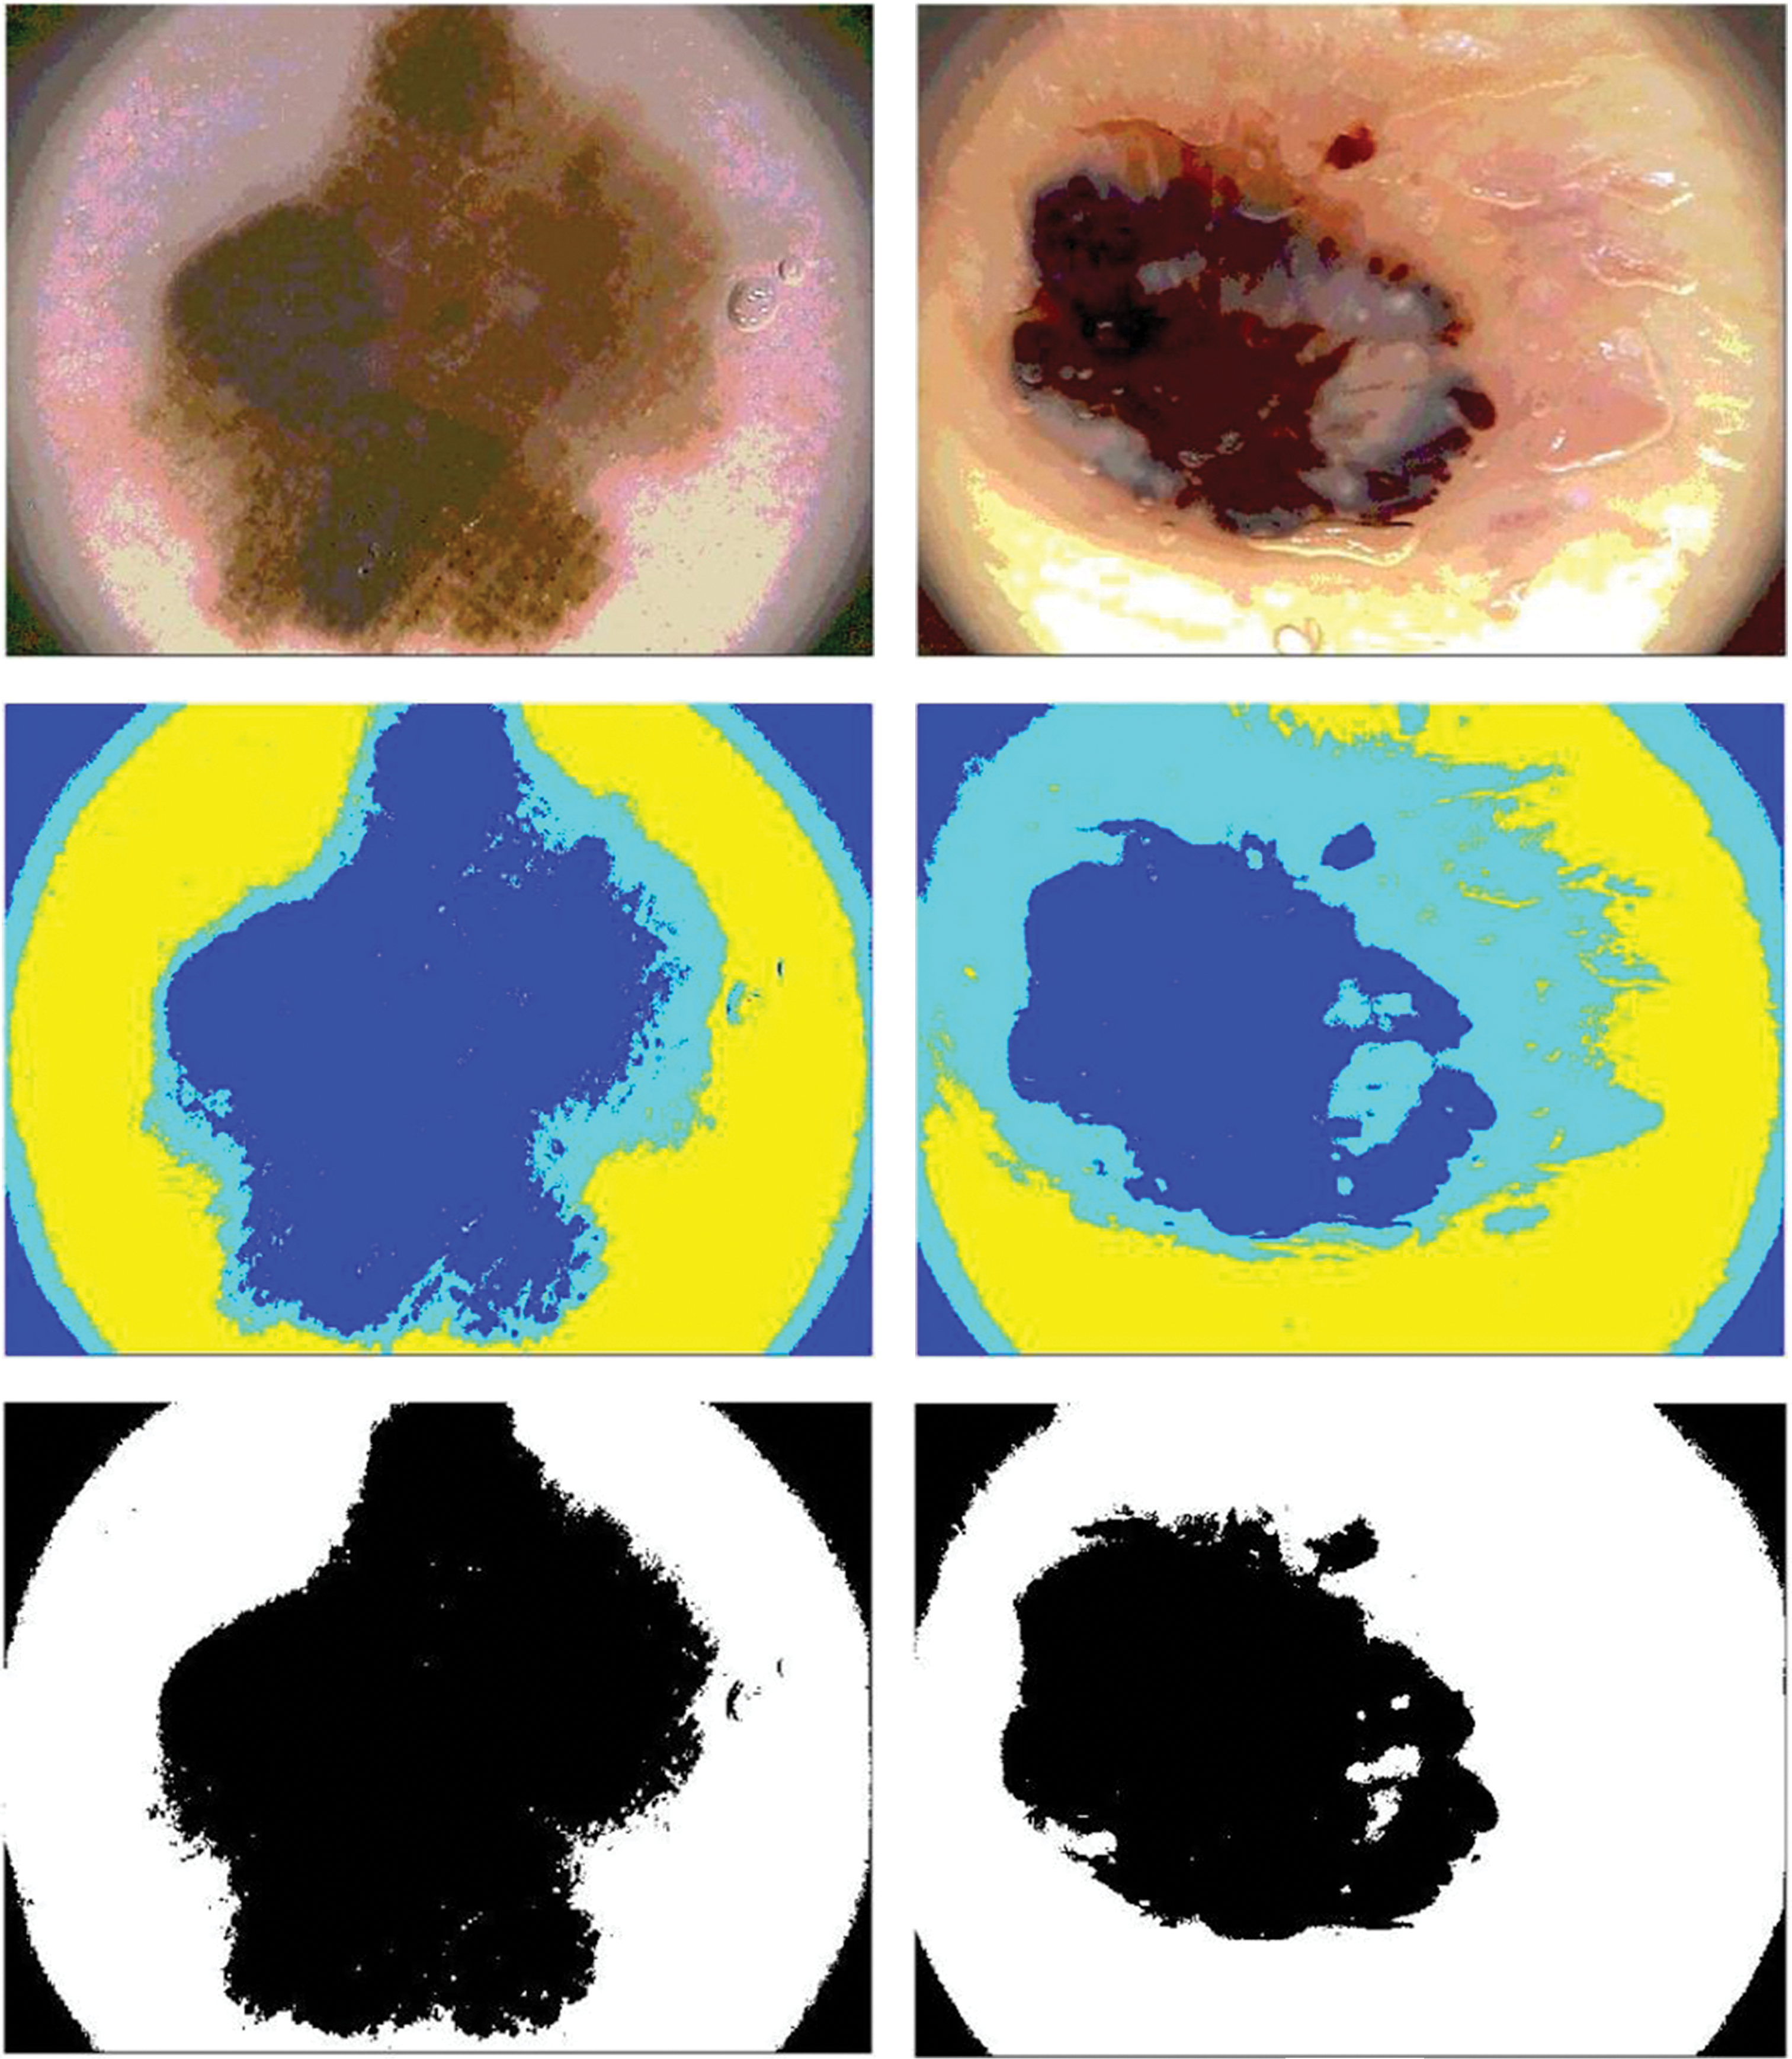
Figure 5: Illustration of skin cancer images after applying Multilevel Otsu thresholding
This is a local thresholding approach where instead of manually defining the threshold value, it is adapted and determined automatically in accordance with image pixels and arrangement for transforming the pixels of the image to grayscale or a binary image. Primarily, this approach advocates selecting threshold values automatically for segmenting the prime entity from its background in a state where there are distinct illumination, colors, or contrast in the image. The pixel intensity upon which the pixels related to the background and foreground are dissociated is termed as threshold value for an image. In other words, the higher intensity image pixels than the threshold will be dissociated from the lower intensity image pixels. For executing adaptive thresholding, as opposed to providing a single threshold value by primitive attempt, it is possible to partition the image foreground and background more effectively by employing a much more precise threshold value.
The segmentation of lesions can be attained by correlating the color of every pixel by a threshold t. In this paper for adaptive segmentation, small blocks are used to adapt the images. Here the function provides a rate Y running on X to evaluate the adapted threshold. Further standard deviation (SD) of X is evaluated. If the rate of SD of the block of pixels is less than 1, it is labeled as a background.
4.4 Niblack Thresholding and Sauvola Thresholding
The Niblack and Sauvola thresholding approach has particularly evolved to enhance the image quality. These are local thresholding techniques that change the threshold in accordance with the local mean and SD for every pixel in a sliding window. The final local pixel value of these thresholding approaches is felicitated by distinct positive parameters also. It is performed to ensure the division between the entity and the background.
where
In this paper, Niblack, Sauvola, and binarized Sauvola techniques are used for classifying skin cancer lesions. Fig. 6 illustrates skin cancer images after applying Niblack and Sauvola thresholding in the proposed methodology.
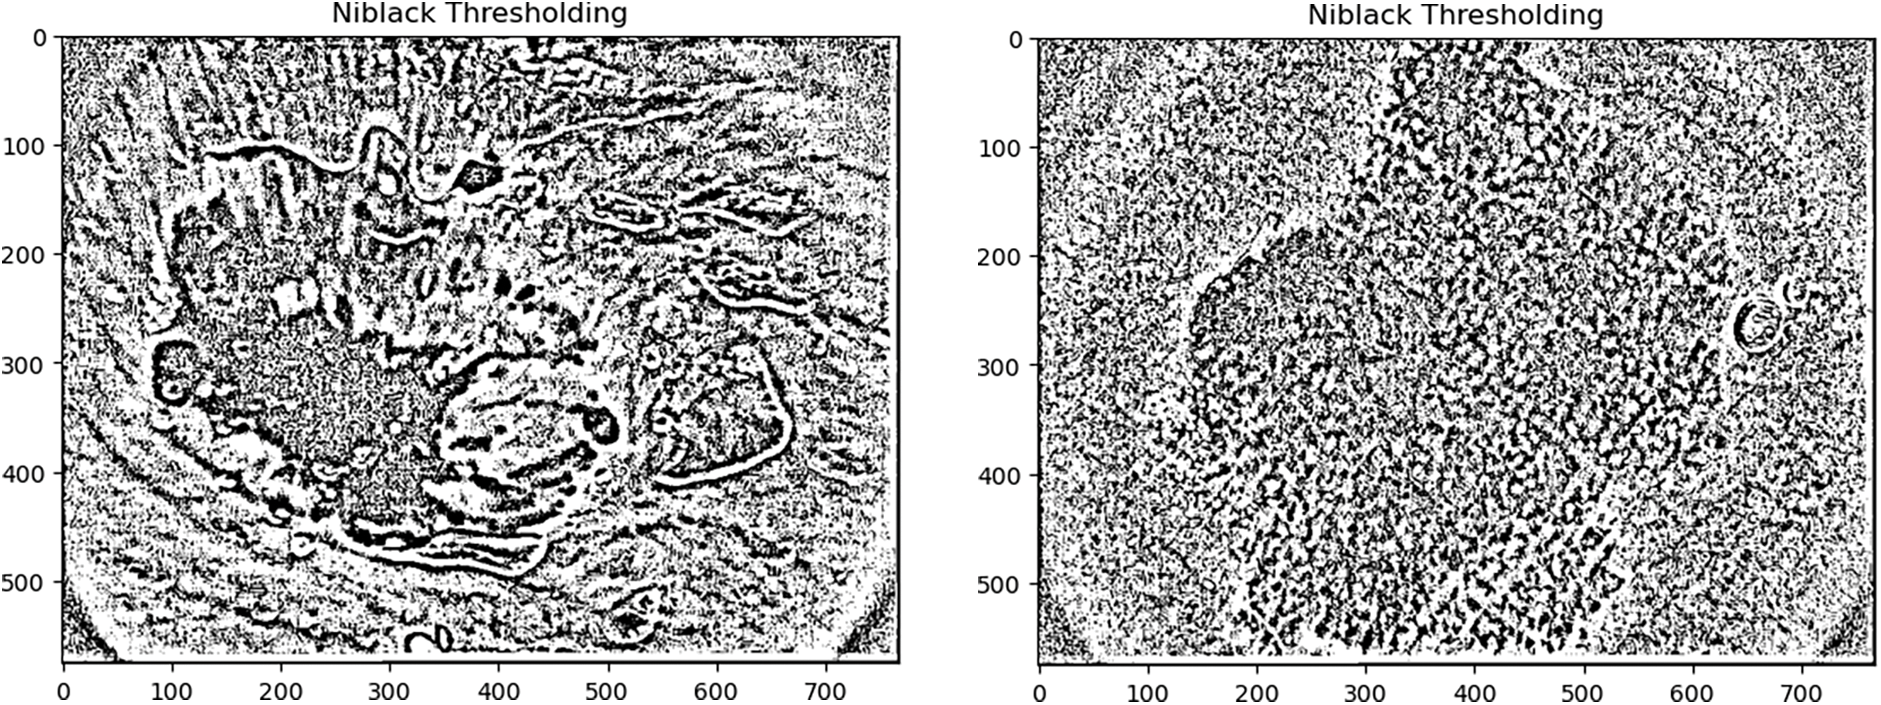
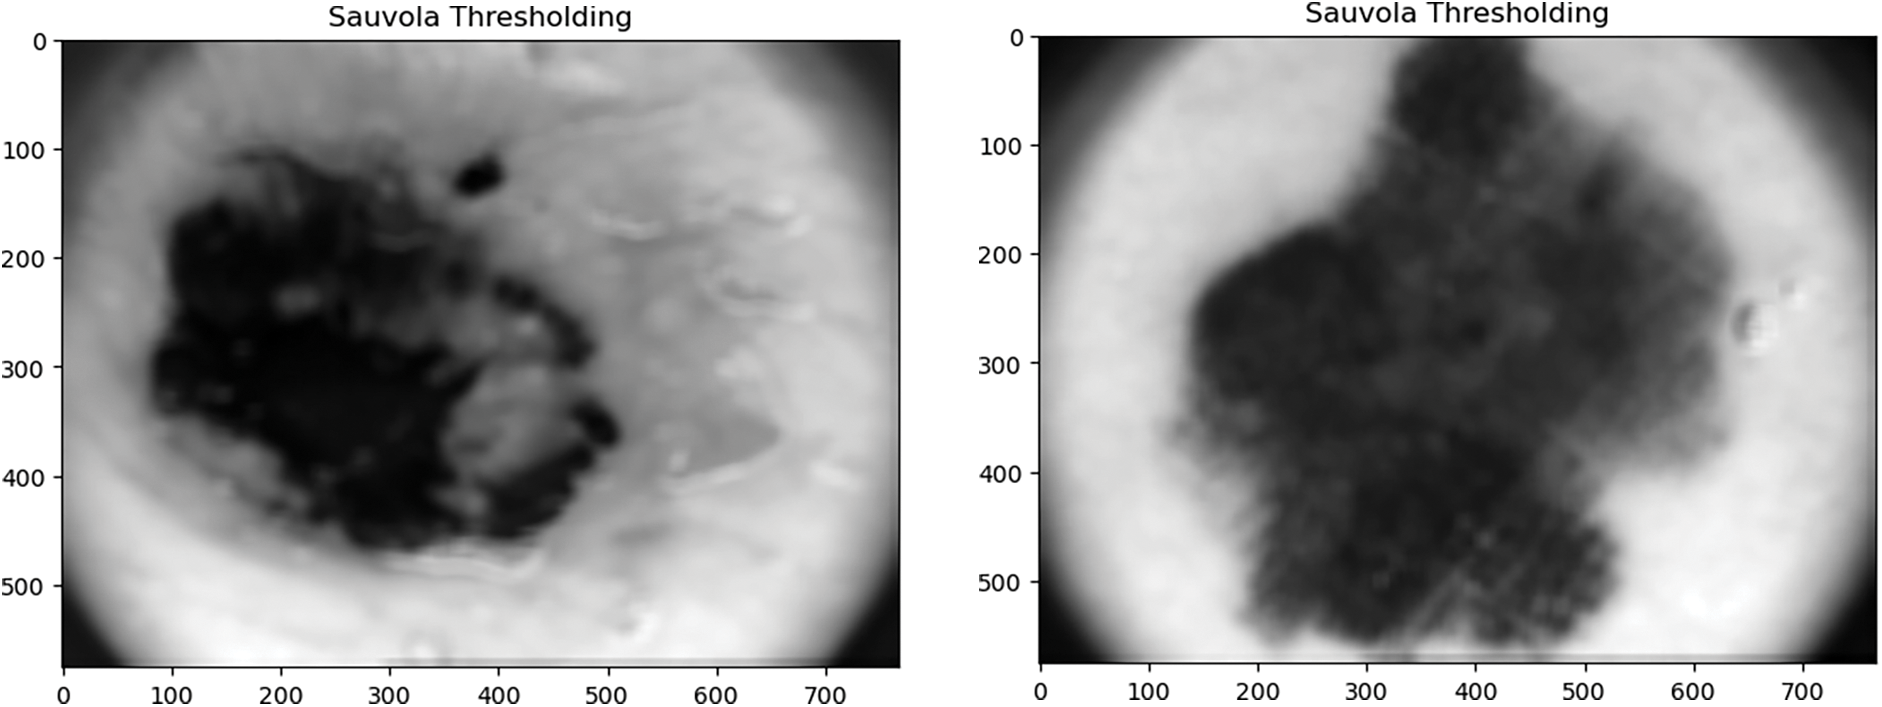
Figure 6: Illustration of skin cancer images after applying Niblack and Sauvola thresholding
4.5 Active Contour Segmentation
This segmentation technique utilizes energy forces and limitations to split up the pixels of interest out of the remainder of the image for additional refining and evaluation. For segmentation, an active contour interprets a particular edge or curvature for the areas of the target entity. The contour relies on certain constraints, and on this basis, it is categorized into distinct types. The approach is used in several image processing applications, especially in therapeutic imaging, by segmenting the regions from distinct therapeutic images [153,154]. The contours are edges formulated for the targeted region required in an image. It is a cluster of points that experience interpolation procedures that might be linear, splines, or polynomials, representing the curve in the image [155]. Distinct models of active contours are implemented for the segmentation approach in image processing, and the prime objective of is to specify a smooth shape and create a closed contour for the region. These models outline the edges of entities or distinct attributes of the image to produce a contour. The curve of the models is ascertained by numerous contour methods by applying external and internal forces. The energy function is related to the curvature specified in the image. The synthesis of forces because of the image that is precisely employed for administering the orientation of the contour on the picture is referred to as external energy, while internal energy regulates the deformable variations. The appropriate contour is attained by determining the minimum of the energy functional. The cluster of points that observe a contour is considered to be contour-deforming. By reducing the energy function this contour fits the preferred image contour defined by minimizing the energy function.
In this paper, the Chan Vese model for active contour is utilized for segmenting skin cancer lesions. It is an effective and flexible approach that can segment distinct types of images, which are relatively difficult to segment through traditional segmentation approaches [155]. The approach is demonstrated by the Mumford-Shah functional that is utilized in the therapeutic imaging domain.
The segmentation is performed using the image segmenter app by evolving 100 iterations. The components connected to the edges of the image are suppressed. The masked illustration is then created through the input, which is the final segmented image. Fig. 7 illustrates skin cancer images after applying the Chan Vese segmentation approach to the proposed methodology.
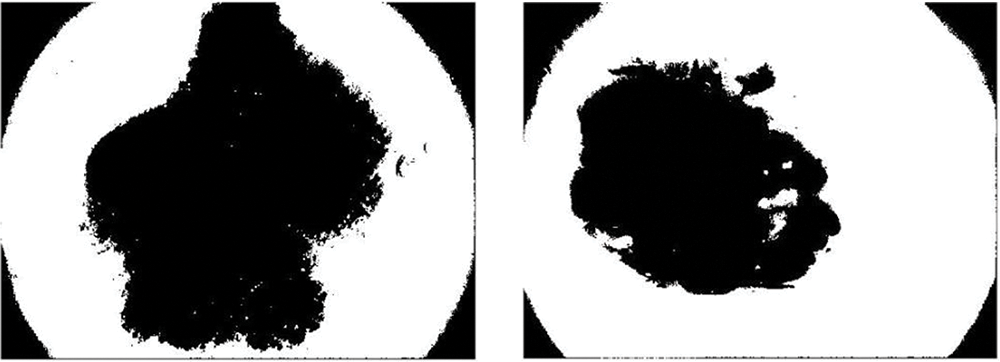
Figure 7: Illustration of skin cancer images after applying the Chan Vese segmentation approach
The watershed algorithm is formulated by withdrawing certain background and foreground and later utilizing markers to create a watershed run and determine the accurate edges. The approach typically helps in determining connected and overlapping entities in an image.
In this paper, the utilization of the watershed algorithm is initiated by modifying the RGB images into grayscale. Consequently, to provide a smooth image, a morphological top-hat filter is utilized. In the next step, the images are transformed into binary format employing grayscale and are later complemented. In the next step, the distance is computed and the watershed transformation is calculated. The segmented regions are displayed by employing distinct colors. Fig. 8 illustrates skin cancer images after applying the watershed segmentation approach.
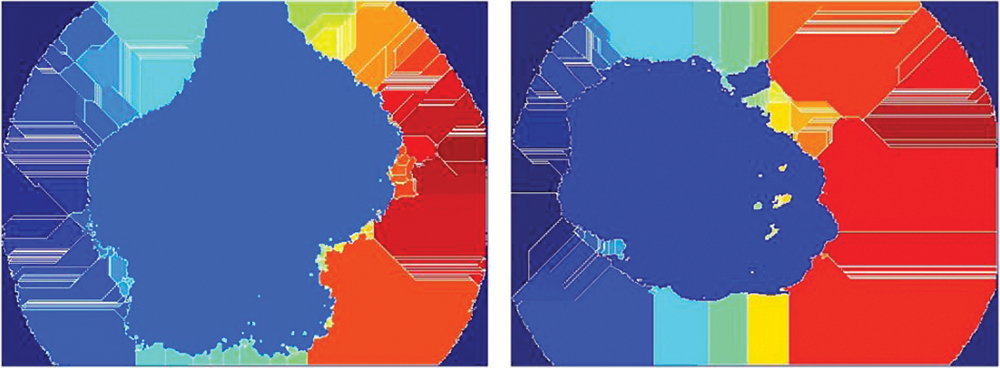
Figure 8: Illustration of skin cancer images after applying the watershed segmentation approach
4.7 Fast Marching Approach (FMM)
It is an arithmetical method that is used to interpret boundary value problems of the Eikonal equation:
The problem generally illustrates the progression of a closed surface as a function of time T and speed v in the usual direction at point y on the propagating area. The speed function is defined, and the time when the contour traverses the point y is attained by solving the equation. The FMM uses this optimal control evaluation of the complication so as to come up with a solution emerging from the boundary values. The FMM works on the fact that data only moves outward from the seeding region.
In this paper, FMM is utilized to segment the ROI of the images on the basis of variations in gray intensity in contrast to the seed locations. A mask is then created by defining seed locations. In the subsequent step, a weighted array is computed on the basis of grayscale intensity variations, and the images are segmented using these weights. Further, by thresholding the geodesic distance matrix by distinct thresholds, different segmentation results are computed. Fig. 9 illustrates skin cancer images after applying FCM.
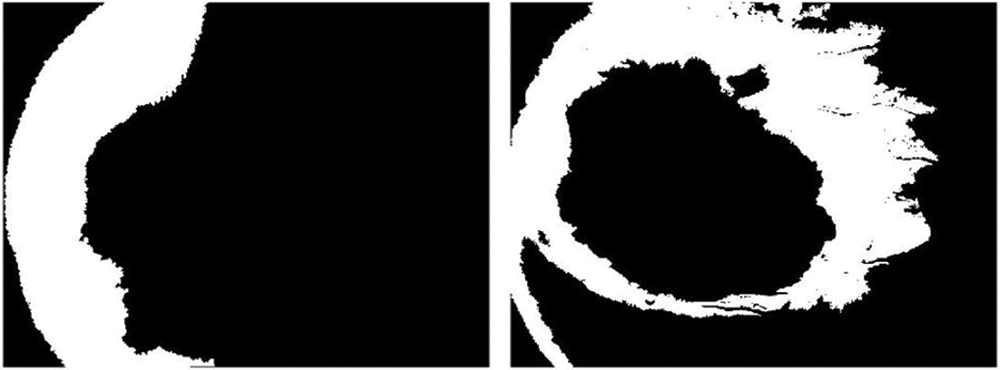
Figure 9: Illustration of skin cancer images after applying FCM
4.8 Simple Linear Iterative Clustering
By synthesizing pixels in the image plane based on their proximity and color homogeneity, this method produces superpixels. It is the most often used method for superpixel segmentation; however, it requires too much processing power. Images of skin cancer after using the simple linear iterative clustering technique are shown in Fig. 10.
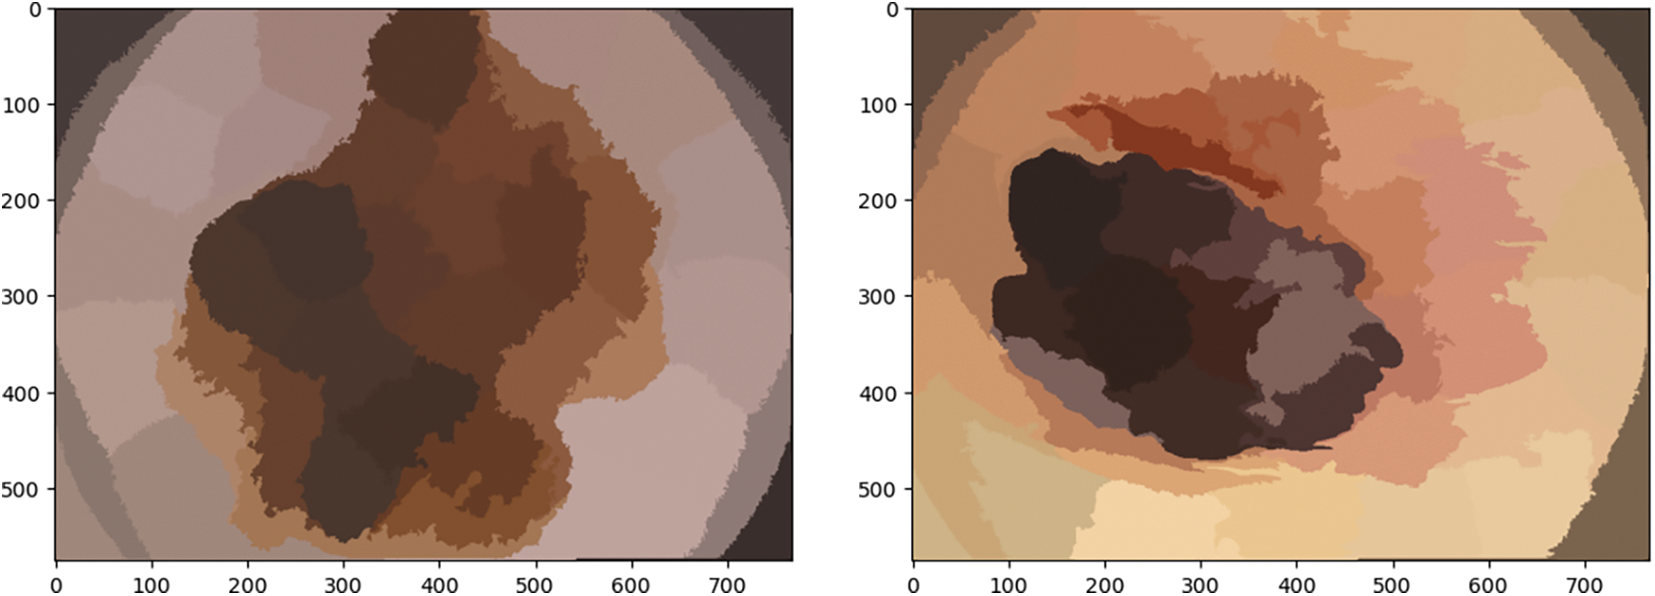
Figure 10: Illustration of skin cancer images after applying the K-means clustering approach
It is utilized for implementing automatic image thresholding in image processing. This method divides a pixel into foreground and background by returning a single intensity threshold. Fig. 11 illustrates skin cancer images after applying K-means clustering in the proposed methodology. The method examines the threshold which reduces the intra-class variance, characterized as a weighted aggregate of variances of the 2 categories. It is an unsupervised clustering algorithm that simply indicates that there is no availability of labeled data. It is employed to ascertain distinct groups or categories in the specified data derived from the similarity of the data. Data points in the same category are indistinguishable from distinct data points in a similar group compared to those in different groups.
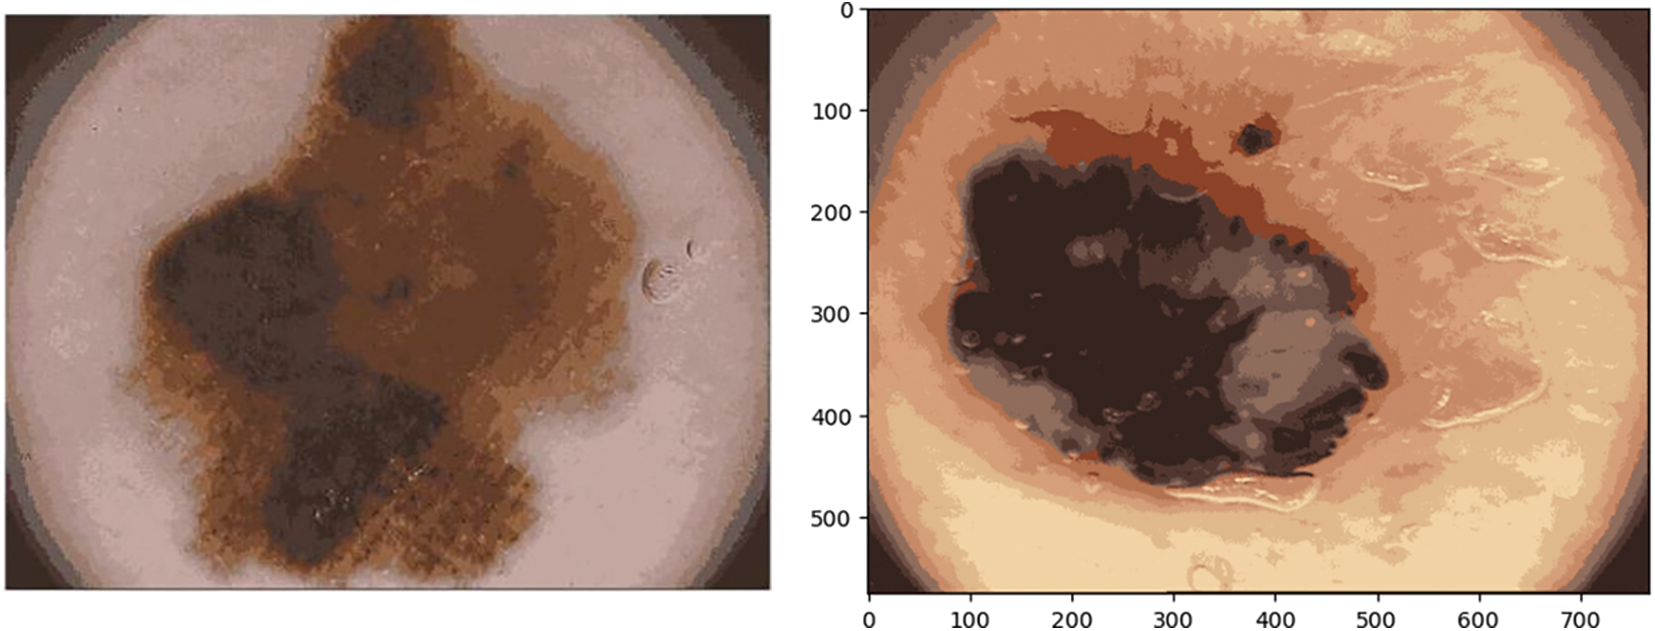
Figure 11: Illustration of skin cancer images after applying the K-means clustering approach
It is one of the most extensively employed clustering approaches, where K denotes the number of clusters.
The algorithm works as follows:
1. Select the number of clusters that is K.
2. Arbitrarily allocate the data points to the K clusters.
3. Evaluate the center of the clusters.
4. Evaluate the length of the data points from the centers of every cluster.
5. Derived from the length of data points from the cluster, redistribute them to the adjacent clusters.
6. Then compute the new cluster center.
7. Reiterate Steps 4, 5 and 6 until data points turn the clusters, or till the specified number of iterations is attained.
4.10 Fuzzy C-Means Clustering (FCM)
It is a particular case of K-means when the probability function applied is merely 1 in case the data point is nearest to a centroid and 0 contrarily.
The algorithm works as follows:
• Presume a certain quantity of clusters, i.e., K.
• Arbitrarily compute the K-means μK related to the clusters and evaluate the probability that every data point x is a component of a specified cluster K.
• Re-compute the centroid of the cluster as the weighted centroid provided the likelihood of components of each data point x:
Reiterate till convergence or till the number of iterations specified by the user has been obtained.
In this paper, fuzzy c-means clustering of images is executed which divides the image into n clusters automatically by random initialization. The counts of clusters and iterations might be controlled and determined by the user. The outcomes of the function are upgraded cluster centers and segmented images illustrated in Fig. 12.
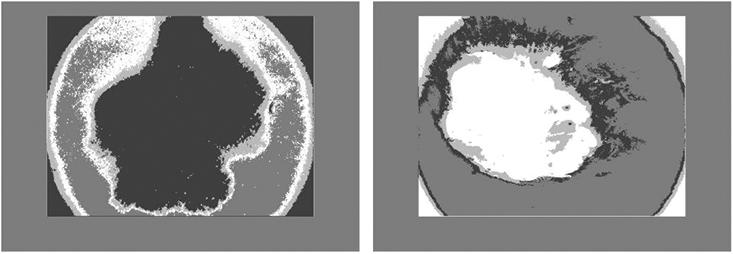
Figure 12: Illustration of skin cancer images after applying FCM
4.11 Edge-Based Segmentation Approaches
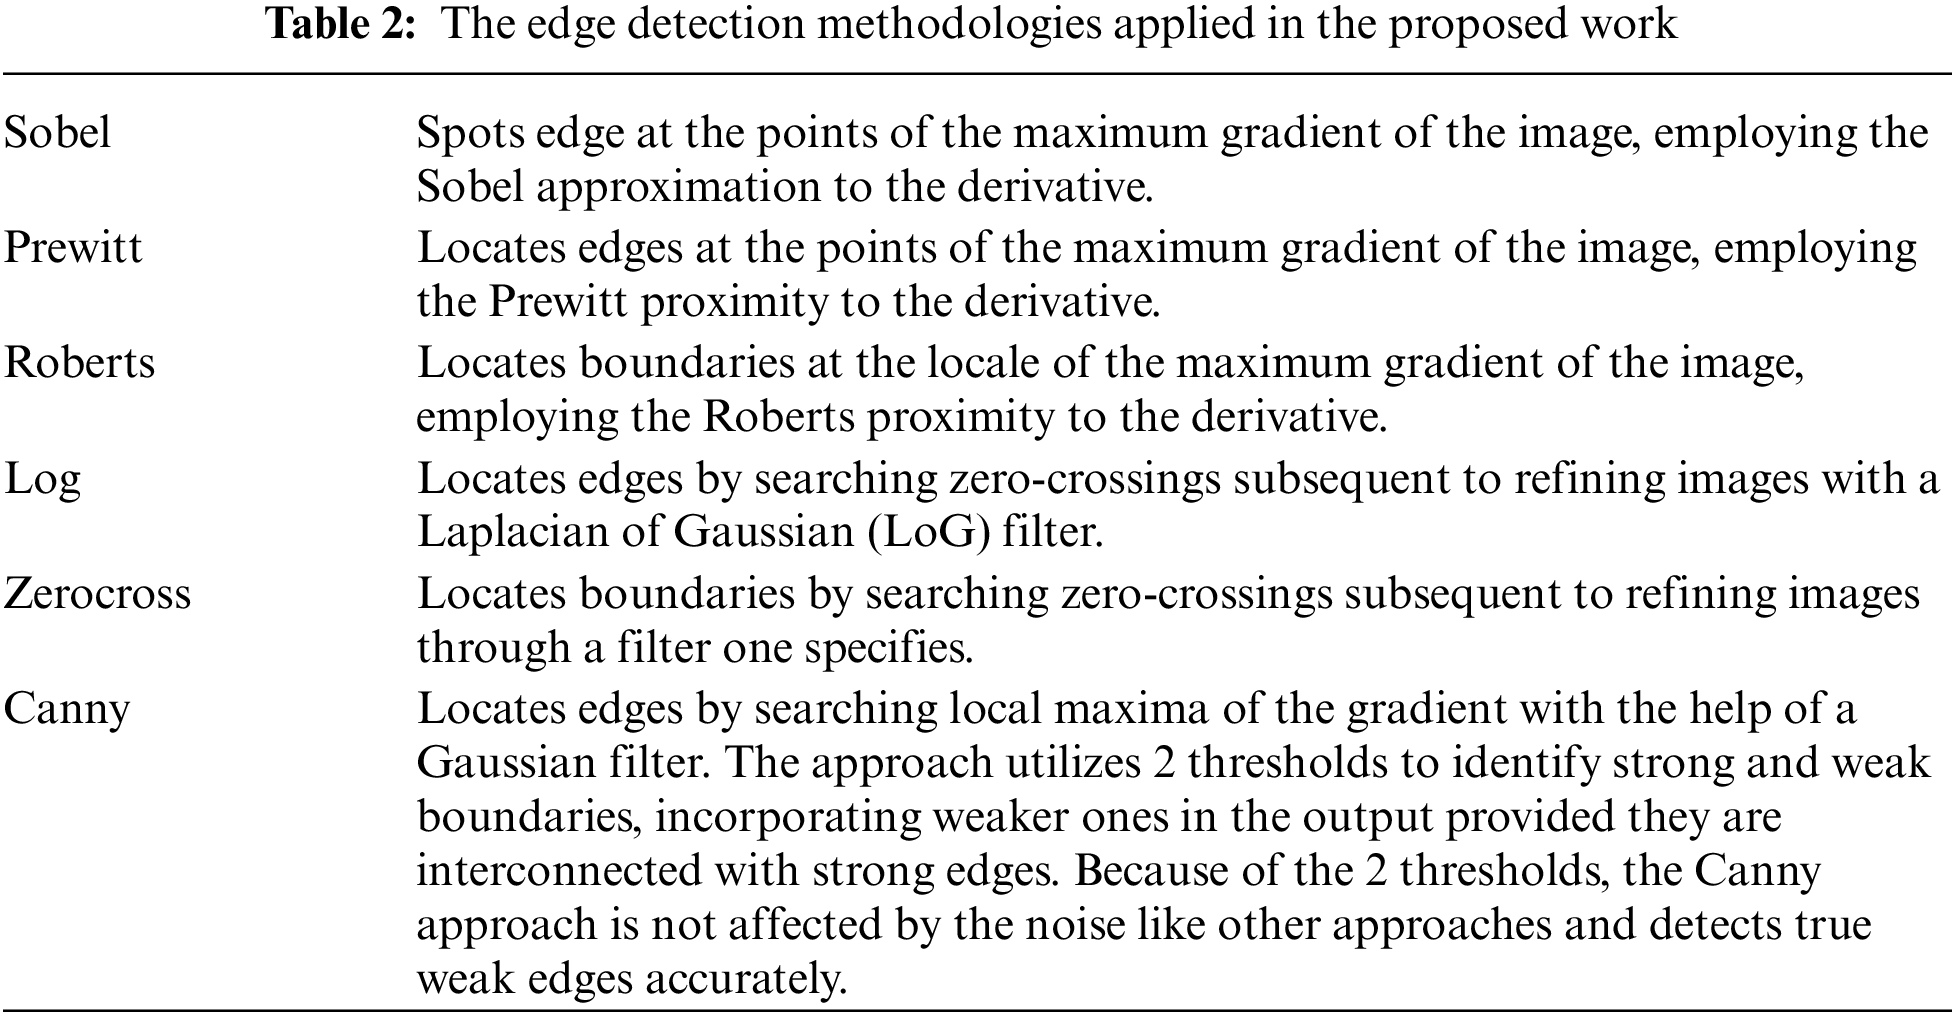
An image processing approach that detects the edges of entities within an image is known as the edge detection technique. It is utilized for segmenting images by identifying discontinuities in brightness. Fig. 13 illustrates skin cancer images after applying (a) Sobel (b) Prewitt (c) Robert (d) Log (e) Zero Crossing (f) Canny. The distinct edge detection approaches used in this paper are discussed in Table 2.
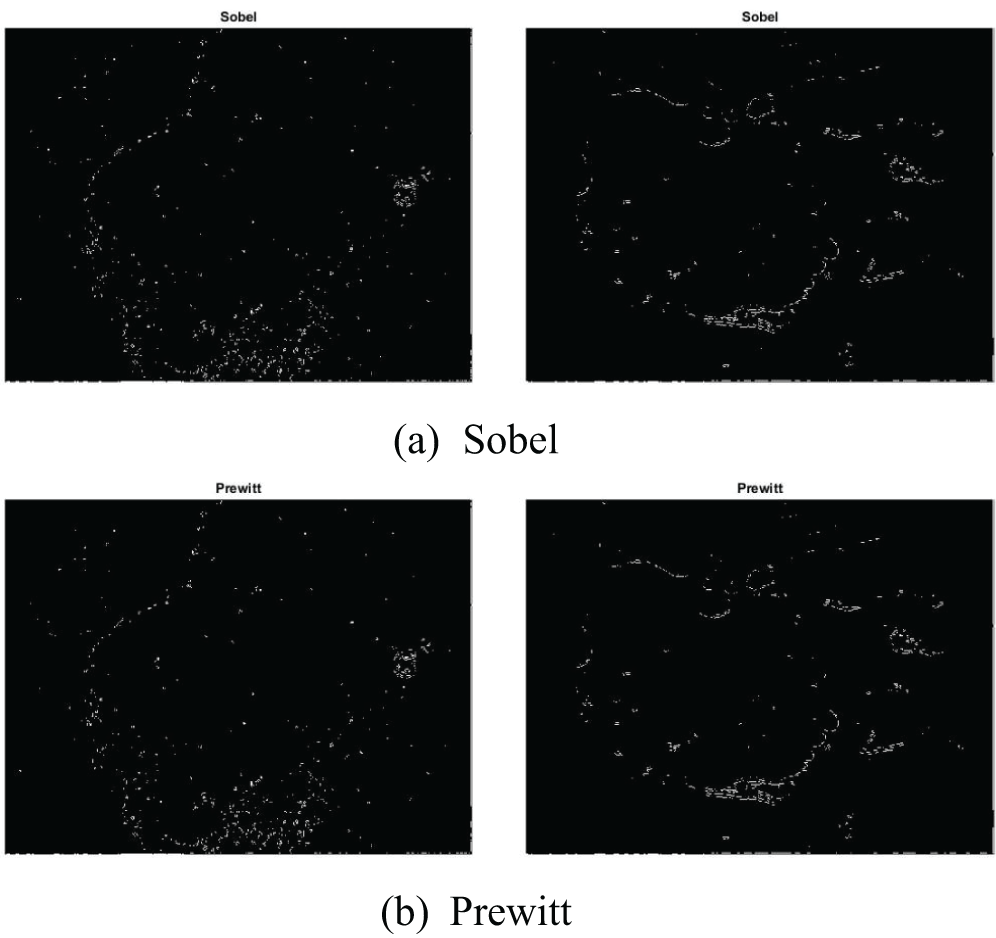
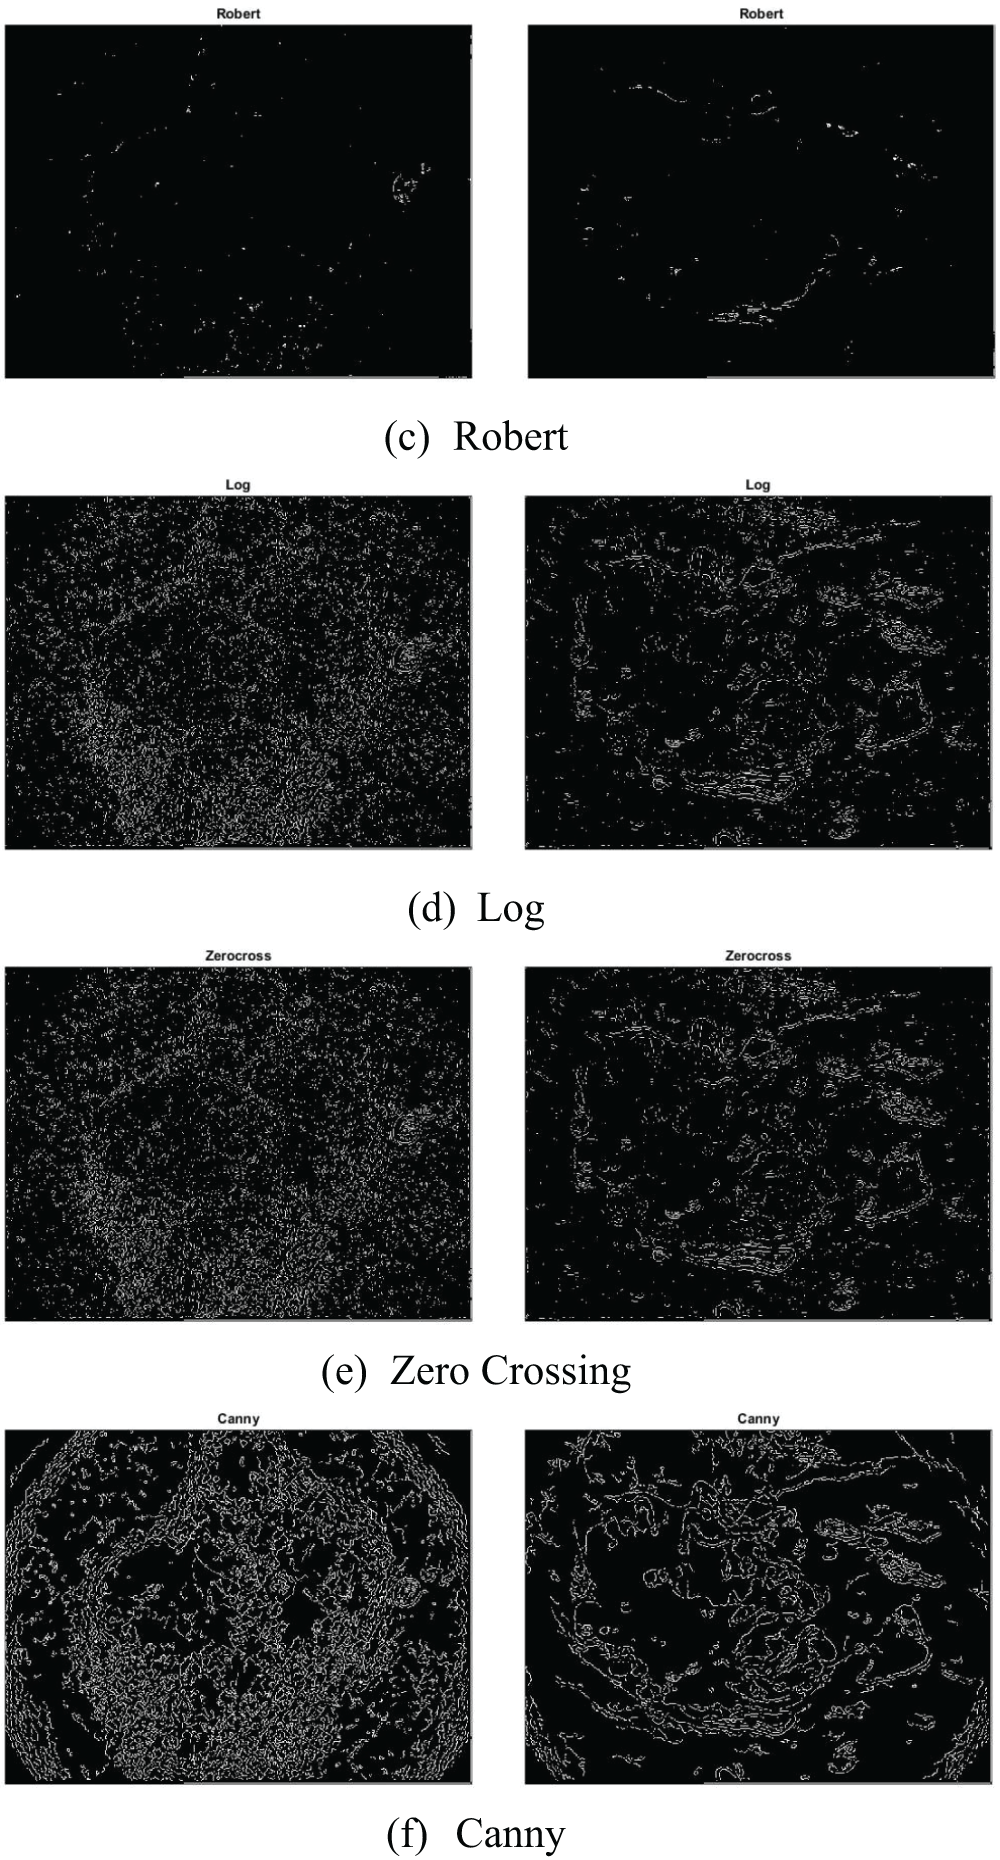
Figure 13: Illustration of skin cancer images after applying (a) Sobel (b) Prewitt (c) Robert (d) Log (e) Zero Crossing (f) Canny
In this paper, we bring forward an image processing established framework to determine, withdraw, and categorize the lesion from the dermoscopy pictures, the method will help in the identification of skin cancer. The block diagram for the proposed methodology is illustrated in Fig. 14.
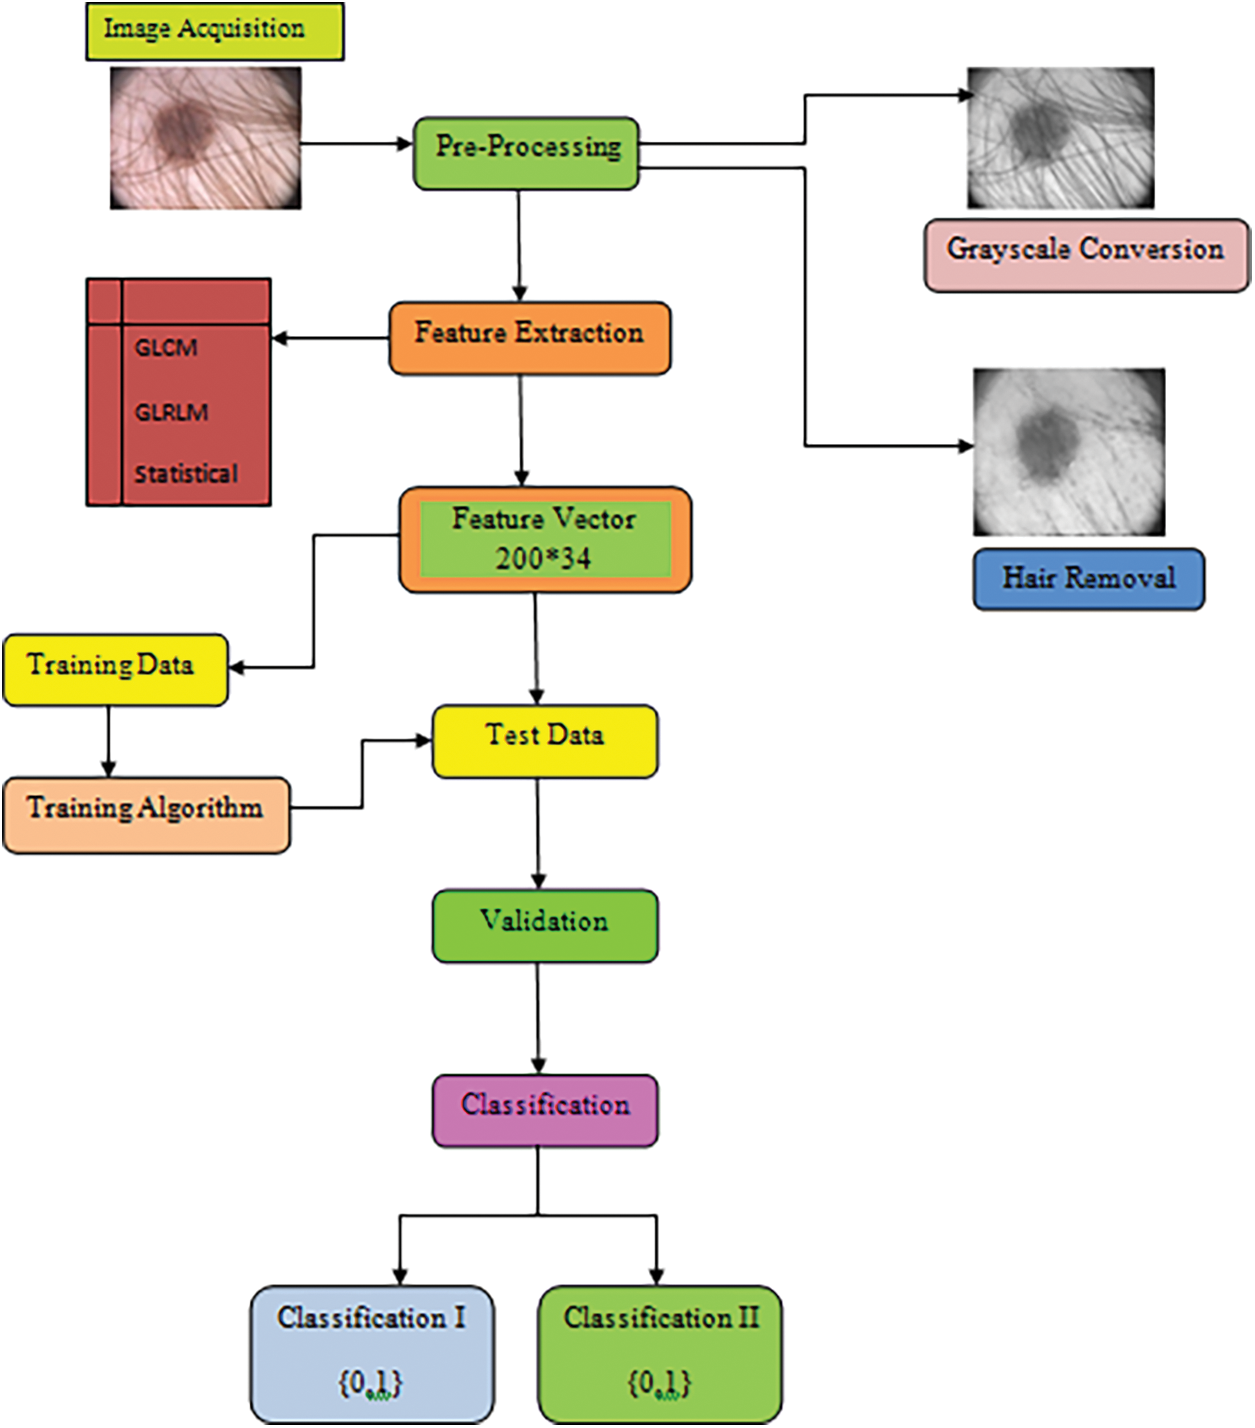
Figure 14: Block diagram of skin cancer diagnosis classified according to the melanocytic nevis and malignant conditions
The PH2 database was developed by a mutual research association among the Universidade do Porto, T’ecnico Lisboa, and the Dermatology service of Hospital Pedro Hispano in Matosinhos, Portugal [156]. This dataset consists of 200 dermoscopic pictures (8 bits RGB pictures) having a resolution of 768 * 560. The pictures are categorized into 80 common nevi, 80 atypical nevi and 40 melanomas.
This step involves transforming the RGB images to grayscale, and noise filtering by using the dullrazor software. It is utilized since some of the acquired images are noisy because of the presence of hair and bubbles around the lesion. So Dullrazor is administered to reduce the consequence of hair being obscured on the skin in the final picture utilized for categorization, making the segmentation more accurate. Fig. 15 illustrates the output image from the pre-processing phase.
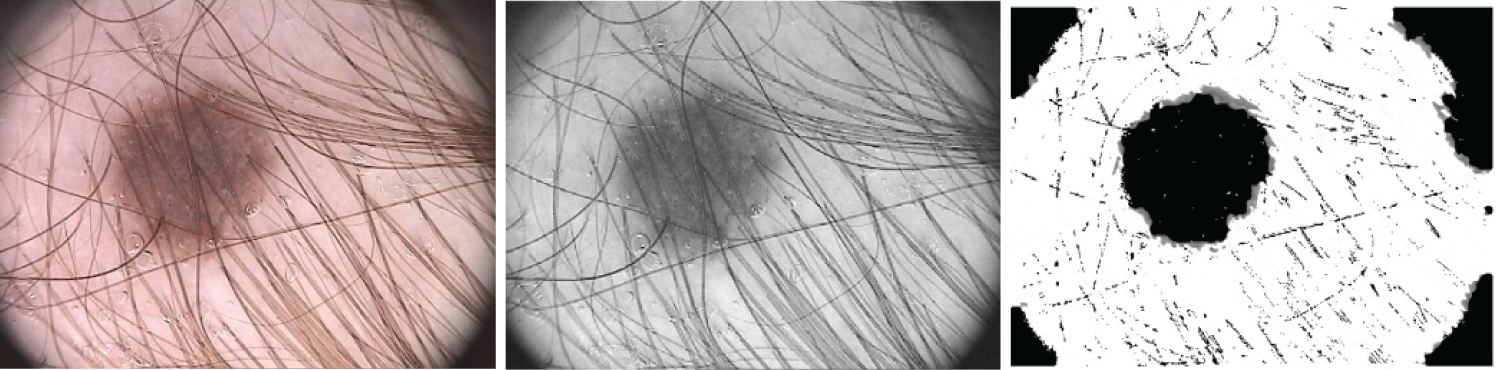
Figure 15: The original picture, the gray picture prior to hair identification and elimination, and the gray image following hair detection, exclusion, and reconstruction are the three samples for hair detection, exclusion, and reconstruction that are illustrated
The subsequent step is identifying and segmenting the region of interest (ROI) that depicts the suspected area. This procedure comprises steps as follows: thresholding, computing the histogram, and conversion to a black-and-white image in the case of global thresholding using OTSU segmentation. For multi-level thresholding using the Otsu approach, for a 2-level approach, a single threshold value is computed and the image is segmented into 2 levels. For the 3-level approach, 2 threshold values are computed, and the image is segmented into 3 levels, which are then converted into a colored image. For the 7-level approach, thresholds for 7 levels from the entire RGB image are generated. The threshold for each plane of the RGB picture is then generated. Process the picture with an array of threshold terms enumerated from the picture. Process each RGB plane separately using the threshold vector computed from the given plane. Quantize every RGB plane through the threshold vector prompted for that plane.
Feature extraction depicts approaches aiming at withdrawing additional value details off the images. The withdrawn elements called features might be statistical, boundary, morphological, and textural characteristics. These features are applied as input data for distinct image processing procedures such as segmentation and classification.
The proposed algorithm extracts textural features of the images in the test phase. Let X represent the feature database, which has 200 images. Let
5.4.1 Grey Level Co-occurrence Matrix (GLCM)
The texture of a picture provides the detail about the spatial positioning of color or hue. 1 dimensional (1-D) histogram is not convenient for exhibiting the texture and therefore a 2-D matrix called GLCM is employed for evaluating the texture. It picks up the numerical textural features that are utilized to illustrate, categorize and compare textures.
Calculation of GLCM:
It comprises size of M * M (M representing gray levels) illustrating the group of possible pixel levels.
It is calculated on the basis of 2 criterions:
R → relative distance amongst the pixel pair
θ → rotational angle
GLCM computes the joint probability of 2 pixels separated by R and across θ comprising co occurring values j and k as shown in Fig. 16.
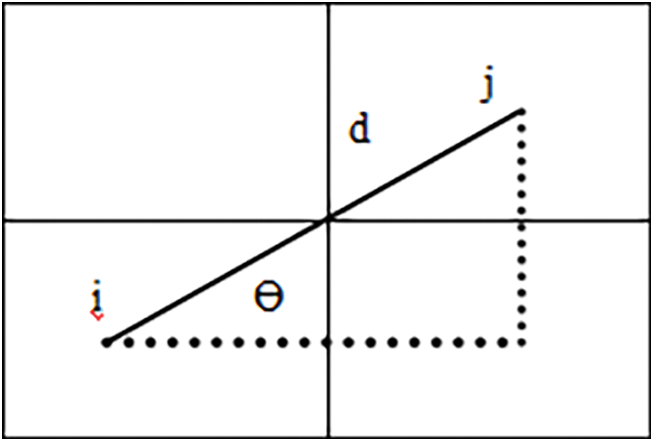
Figure 16: Illustration of GLCM employed for evaluating the texture of an image
Different GLCM textural measures:
This paper includes 8 local texture features that are illustrated below with mathematical interpretation on the evaluation of each texture. Here f(i, j) represents the frequency of components in the GLCM with index i, j.
Energy: It symbolizes the image’s uniformity or stability. The more homogeneous texture is indicated by substantial energy levels.
Entropy: The entropy of grayscale picture I is returned by entropy(I). The source image’s texture can be described using entropy, an empirical metric of randomization.
Correlation: It calculates the linear dependence among two pairs of pixels. A more consistent texture is indicated by high correlation coefficients.
Inverse Difference Moment (IDM): For asymmetrical images, the outcome is a low IDM magnitude, while for uniform pictures, a significantly greater measure. The uniformity of the picture also affects IDM. The weighting factor means that asymmetrical regions will only contribute slightly to IDM.
Contrast: Quantifies the image’s local variances. Significant variations in the brightness of adjacent pixels are indicated by high contrast indices.
Cluster Shade: To minimize the number of computations required for the cluster shade calculations, this texture feature can be expressed in the form of the image pixel values present in a given
Cluster Prominence: The GLCM’s skewness and asymmetry are gauged by this. Greater asymmetry over the mean is implied by values that are greater, whilst less fluctuation over the mean and a peak close to the mean are indicated by values that are lower.
Auto Correlation: An indicator of how fine or coarse a texture is called autocorrelation.
Homogeneity: It represents how closely the GLCM diagonal and the element scatter are related. Elevated homogeneity levels imply a more homogeneous texture since they show that the elements are grouped across the diagonal.
where μ is the weighted pixel average due to matrix symmetry and σ is the weighted pixel variance due to matrix symmetry.
The 10 advanced texture features that are utilized in this paper are illustrated below along with their mathematical expressions.
Mean: It represents the mean intensity of gray levels in the region of interest (ROI).
The Sum of Squares Variance: An estimation of the spread of nearby intensity scale pairs around the GLCM mean intensity level is called sum variance.
Dissimilarity: A linear assessment of an image’s local variances is called dissimilarity.
Sum Average: The association between merging with lower intensity levels and pairings with higher intensity levels is computed by the sum average.
Sum Variance: With a significant correlation to first-order statistical parameters like standard deviation, variance serves as an index of variability. As a gray level score deviates from its mean, variance rises.
Sum Entropy: The variation in adjacent intensity values added together is known as total entropy.
Difference Variance: It is measured by variance, which assigns greater weights to intensity threshold differences across pairings that deviate further from the mean.
Difference Entropy: This quantifies the degree of unpredictability or unpredictability in the variations in adjacent intensity values.
Information Measures of Correlation (IC1): It quantifies the texture’s uncertainty by evaluating the relationship amongst the probability variations of i and j employing mutual information I(x, y):
Information Measures of Correlation (IC2): It measures the texture’s uncertainty by evaluating the relationship amongst the probability distributions of i and j. IMC2 has a range of [0, 1], where 0 denotes the situation where there is no exchange of information between two independent ranges, and the greatest value denotes the situation when there are two fully dependent and homogeneous probabilities.
In this paper, 7 local higher order statistics texture coefficients based on the grey level run-length matrix will be processed that are discussed below with mathematical expressions. Here f(i, j) represents the element in cell i, j of a normalized Run Length Matrix, N represents the total number of runs and NP represents the sum of pixels:
Short Run Emphasis (SRE): A range that represents a measurement of small run lengths; a higher value denotes more fine-grained textural features and shorter run lengths.
Long Run Emphasis (LRE): A metric used to determine the long run length pattern; longer run lengths and coarser structural textures are indicated by higher levels.
Grey-Level Non-uniformity (GLN): A lesser GLN value is correlated with more intensity value coherence. GLN is a metric used to quantify the likeness of gray-level intensity levels in a picture.
Run Length Non-uniformity (RLN): A smaller number of RLN indicates greater homogeneity across the run lengths in the picture. RLN assesses the similarities of run lengths across the picture.
Run Percentage (RP): It evaluates the correlation among the number of runs and voxels in the ROI to ascertain how fine the texture is.
Low Grey-Level Run Emphasis (LGRE): A higher score in LGLRE indicates an increased number of low gray-level frequencies in the picture. LGLRE evaluates the proportion of low gray-level frequencies.
High Grey-Level Run Emphasis (HGRE): A higher score in HGLRE indicates an increased amount of high gray-level frequencies in the picture. HGLRE quantifies the spread of the larger gray-level frequencies.
In this paper, we evaluated 8 statistical features that are discussed below with mathematical expressions.
Contrast: Although it depends on the total grayscale dynamic range, contrast is a representation of a variation in spatial magnitude. A picture with an extensive array of gray levels and significant variations across individual voxels and their surrounding areas is said to have a high contrast when both the dynamic range and the spatial transition rate are substantial.
Correlation: A correlation coefficient ranges from 0 (uncorrelated) to 1 (completely correlated), indicating how linearly the gray level scores rely on the corresponding voxels.
Standard deviation: It specifies how much the mean value deviates or is dissipated.
Entropy: It describes how arbitrary or uncertain the image attributes are. It calculates the mean quantity of data needed to encode the picture elements.
HI represents 3 histogram features.
A detailed explanation of the proposed methodology is illustrated in Fig. 17.
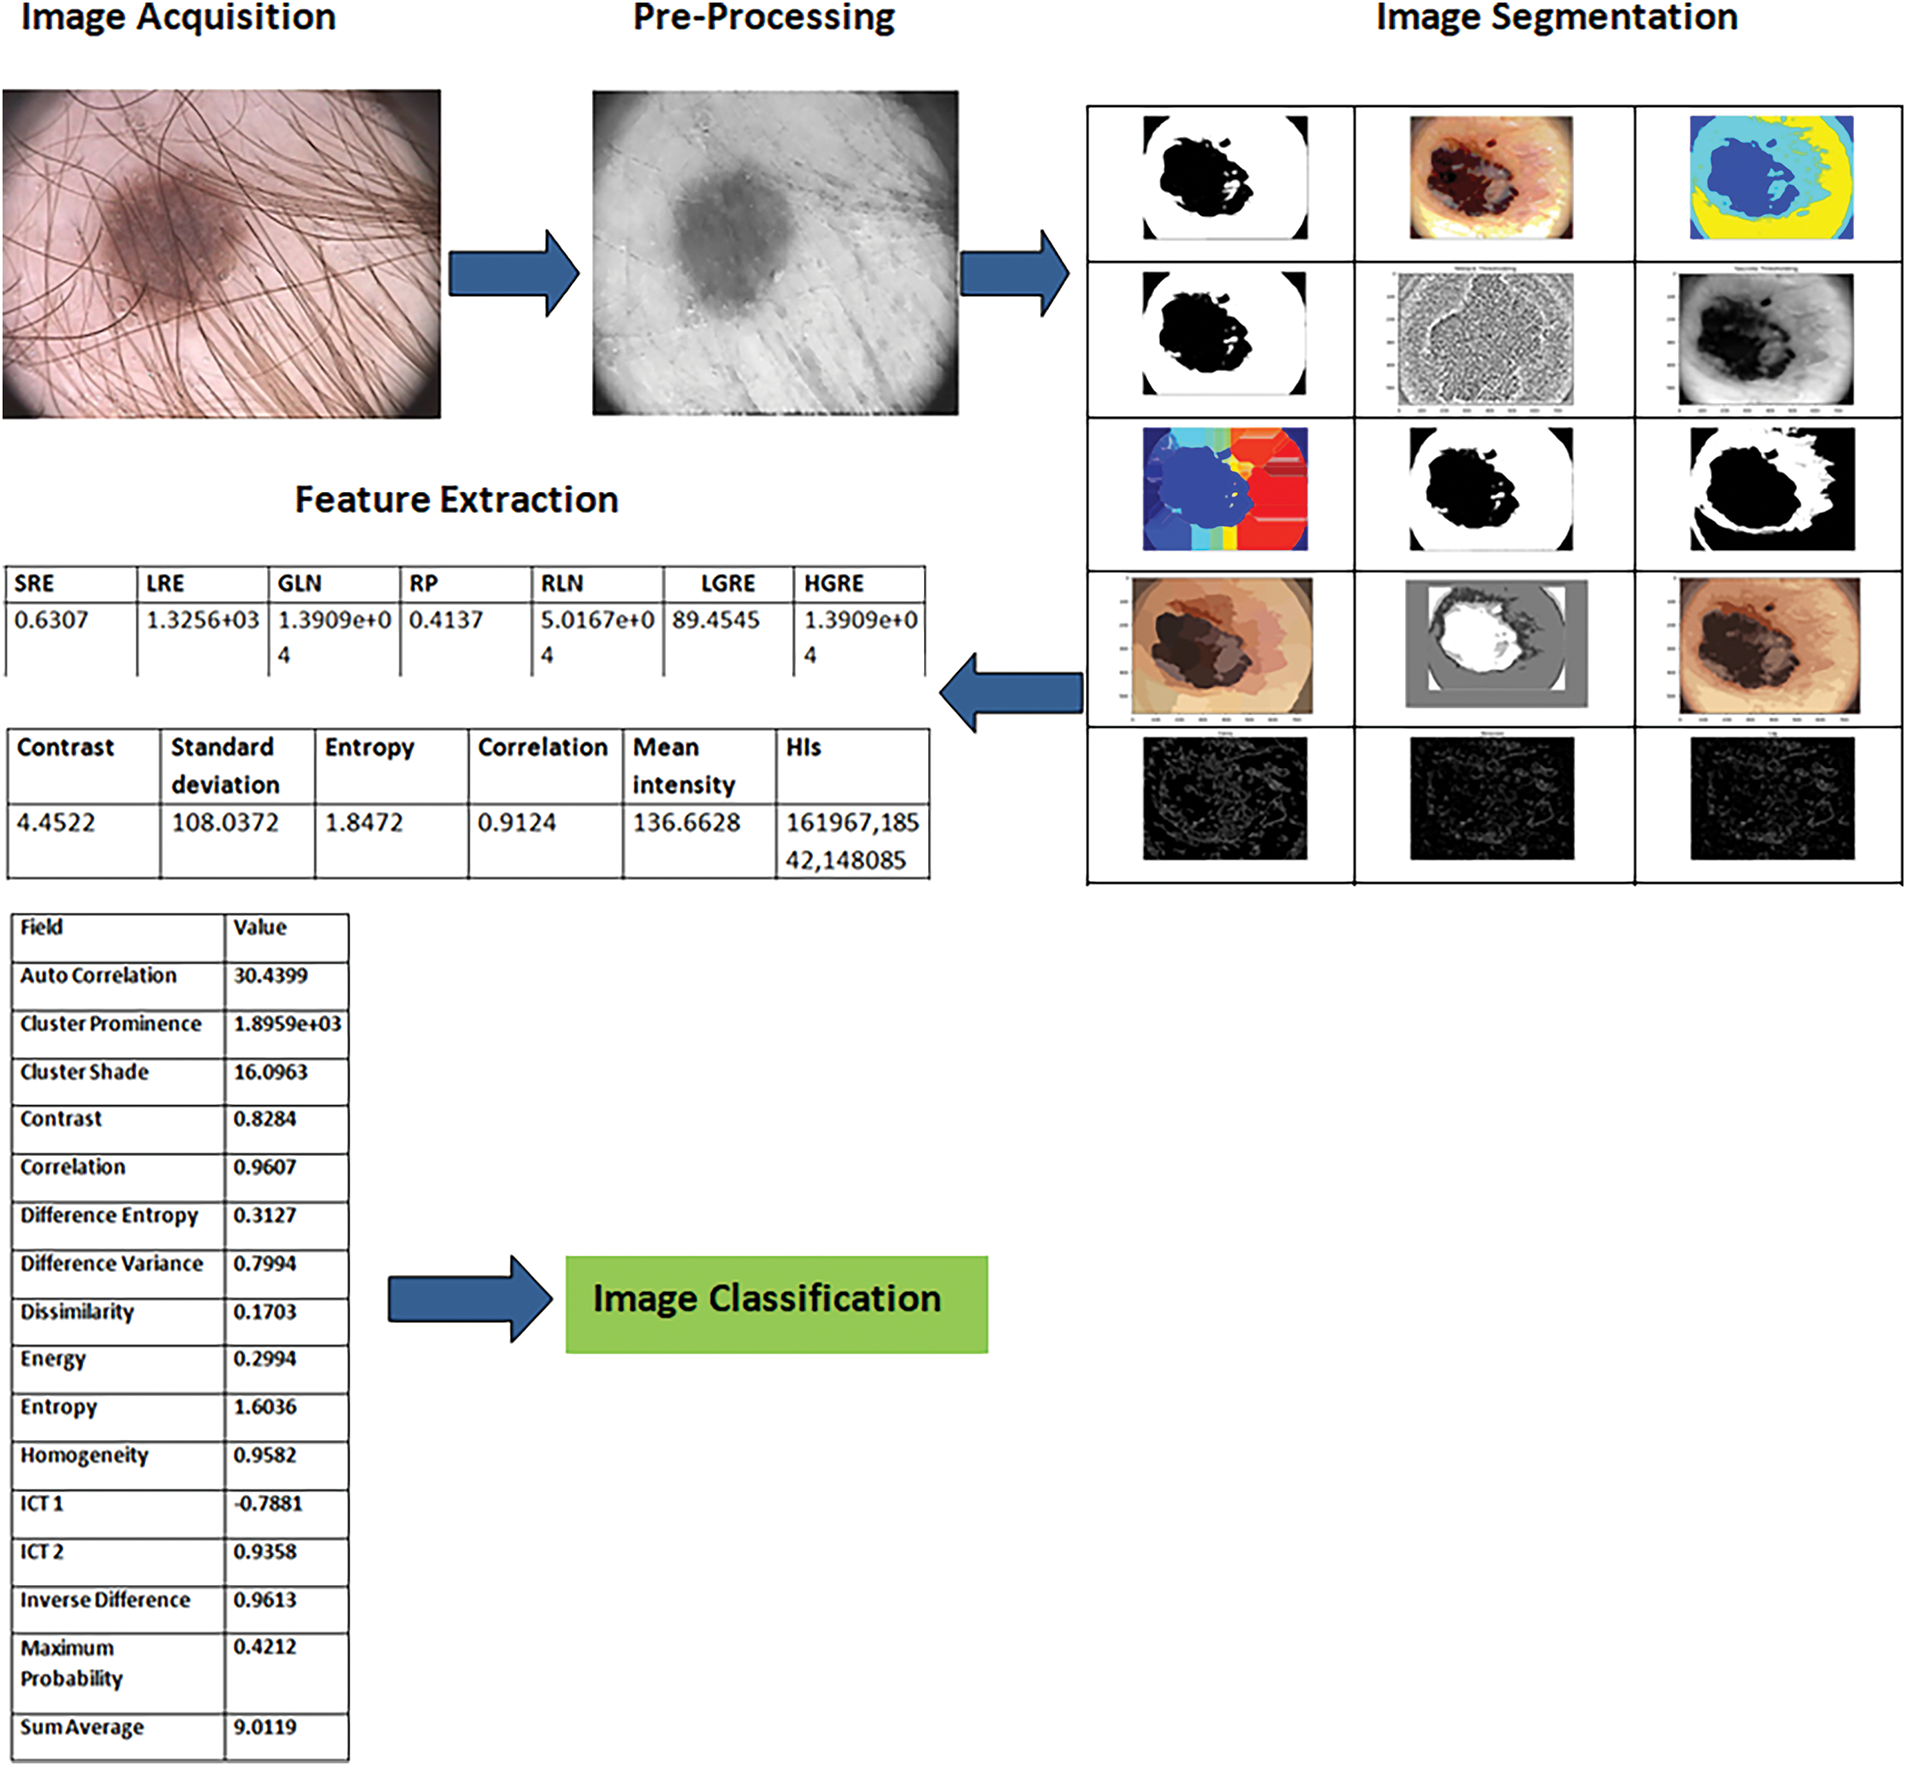
Figure 17: A detailed visual illustration of the proposed methodology
5.5 Quality Evaluation Metrics
Image classification, or deriving information from a picture through CV and ML techniques, is the final phase. The 12 distinct metrics have been utilized to quantify the textural feature extraction.
Sensitivity (SE) represents the exactness of predictions made and expressed mathematically as the number of rightly detected points in the class (true positives; TP) divided by the total number of points in the class (positives; P).
Specificity refers to the likelihood of a negative test result with a condition of the individual actually being negative.
5.5.3 Positive Predictive Value (PPV) and Negative Predictive Value (NPV)
The positive and negative predictive values (PPV and NPV) represent the amount of positive and negative outcomes in statistics and diagnostic tests that are true positive and true negative results, respectively.
5.5.4 False Positive Rate (FPR) and False Negative Rate (FNR)
FPR is the inaccurate exclusion of a null hypothesis that is actually true. FNR is the inadequacy to reject a null hypothesis that is actually false.
5.5.5 False Discovery Rate (FDR)
It is the anticipated proportion of the number of false discoveries to the sum of positive classifications. This summation includes both the number of FP and TP.
F score is an estimate of a test’s accuracy in the analytical study of binary classification.
5.5.7 Matthews Correlation Coefficient (MCC)
It is a measure of association for two binary variables employed as a measure of the quality of binary classifications.
Accuracy is how close a given set of measurements (observations or readings) are to their true value.
AUC illustrates the capability of a model, notwithstanding a specified threshold, to characterize the 2 classes. The higher value indicates the model performs better. It has a value between 1 and 0.
6 Experimental Results and Discussion
The evaluation of various segmentation techniques is covered in Section 6. The measures outlined in Section 6 served as the foundation for the evaluation. There are three sections to the experimental results. Initially, we assess the algorithms using all of the image data. Next, we calculated each of the 200 photos’ textural features. Next, we talk about how well the segmentation techniques work for three different kinds of lesions: melanomas, atypical nevi, and common nevi. As we’ll see, in each of these three scenarios, the segmentation approaches perform differently.
Ablation Study
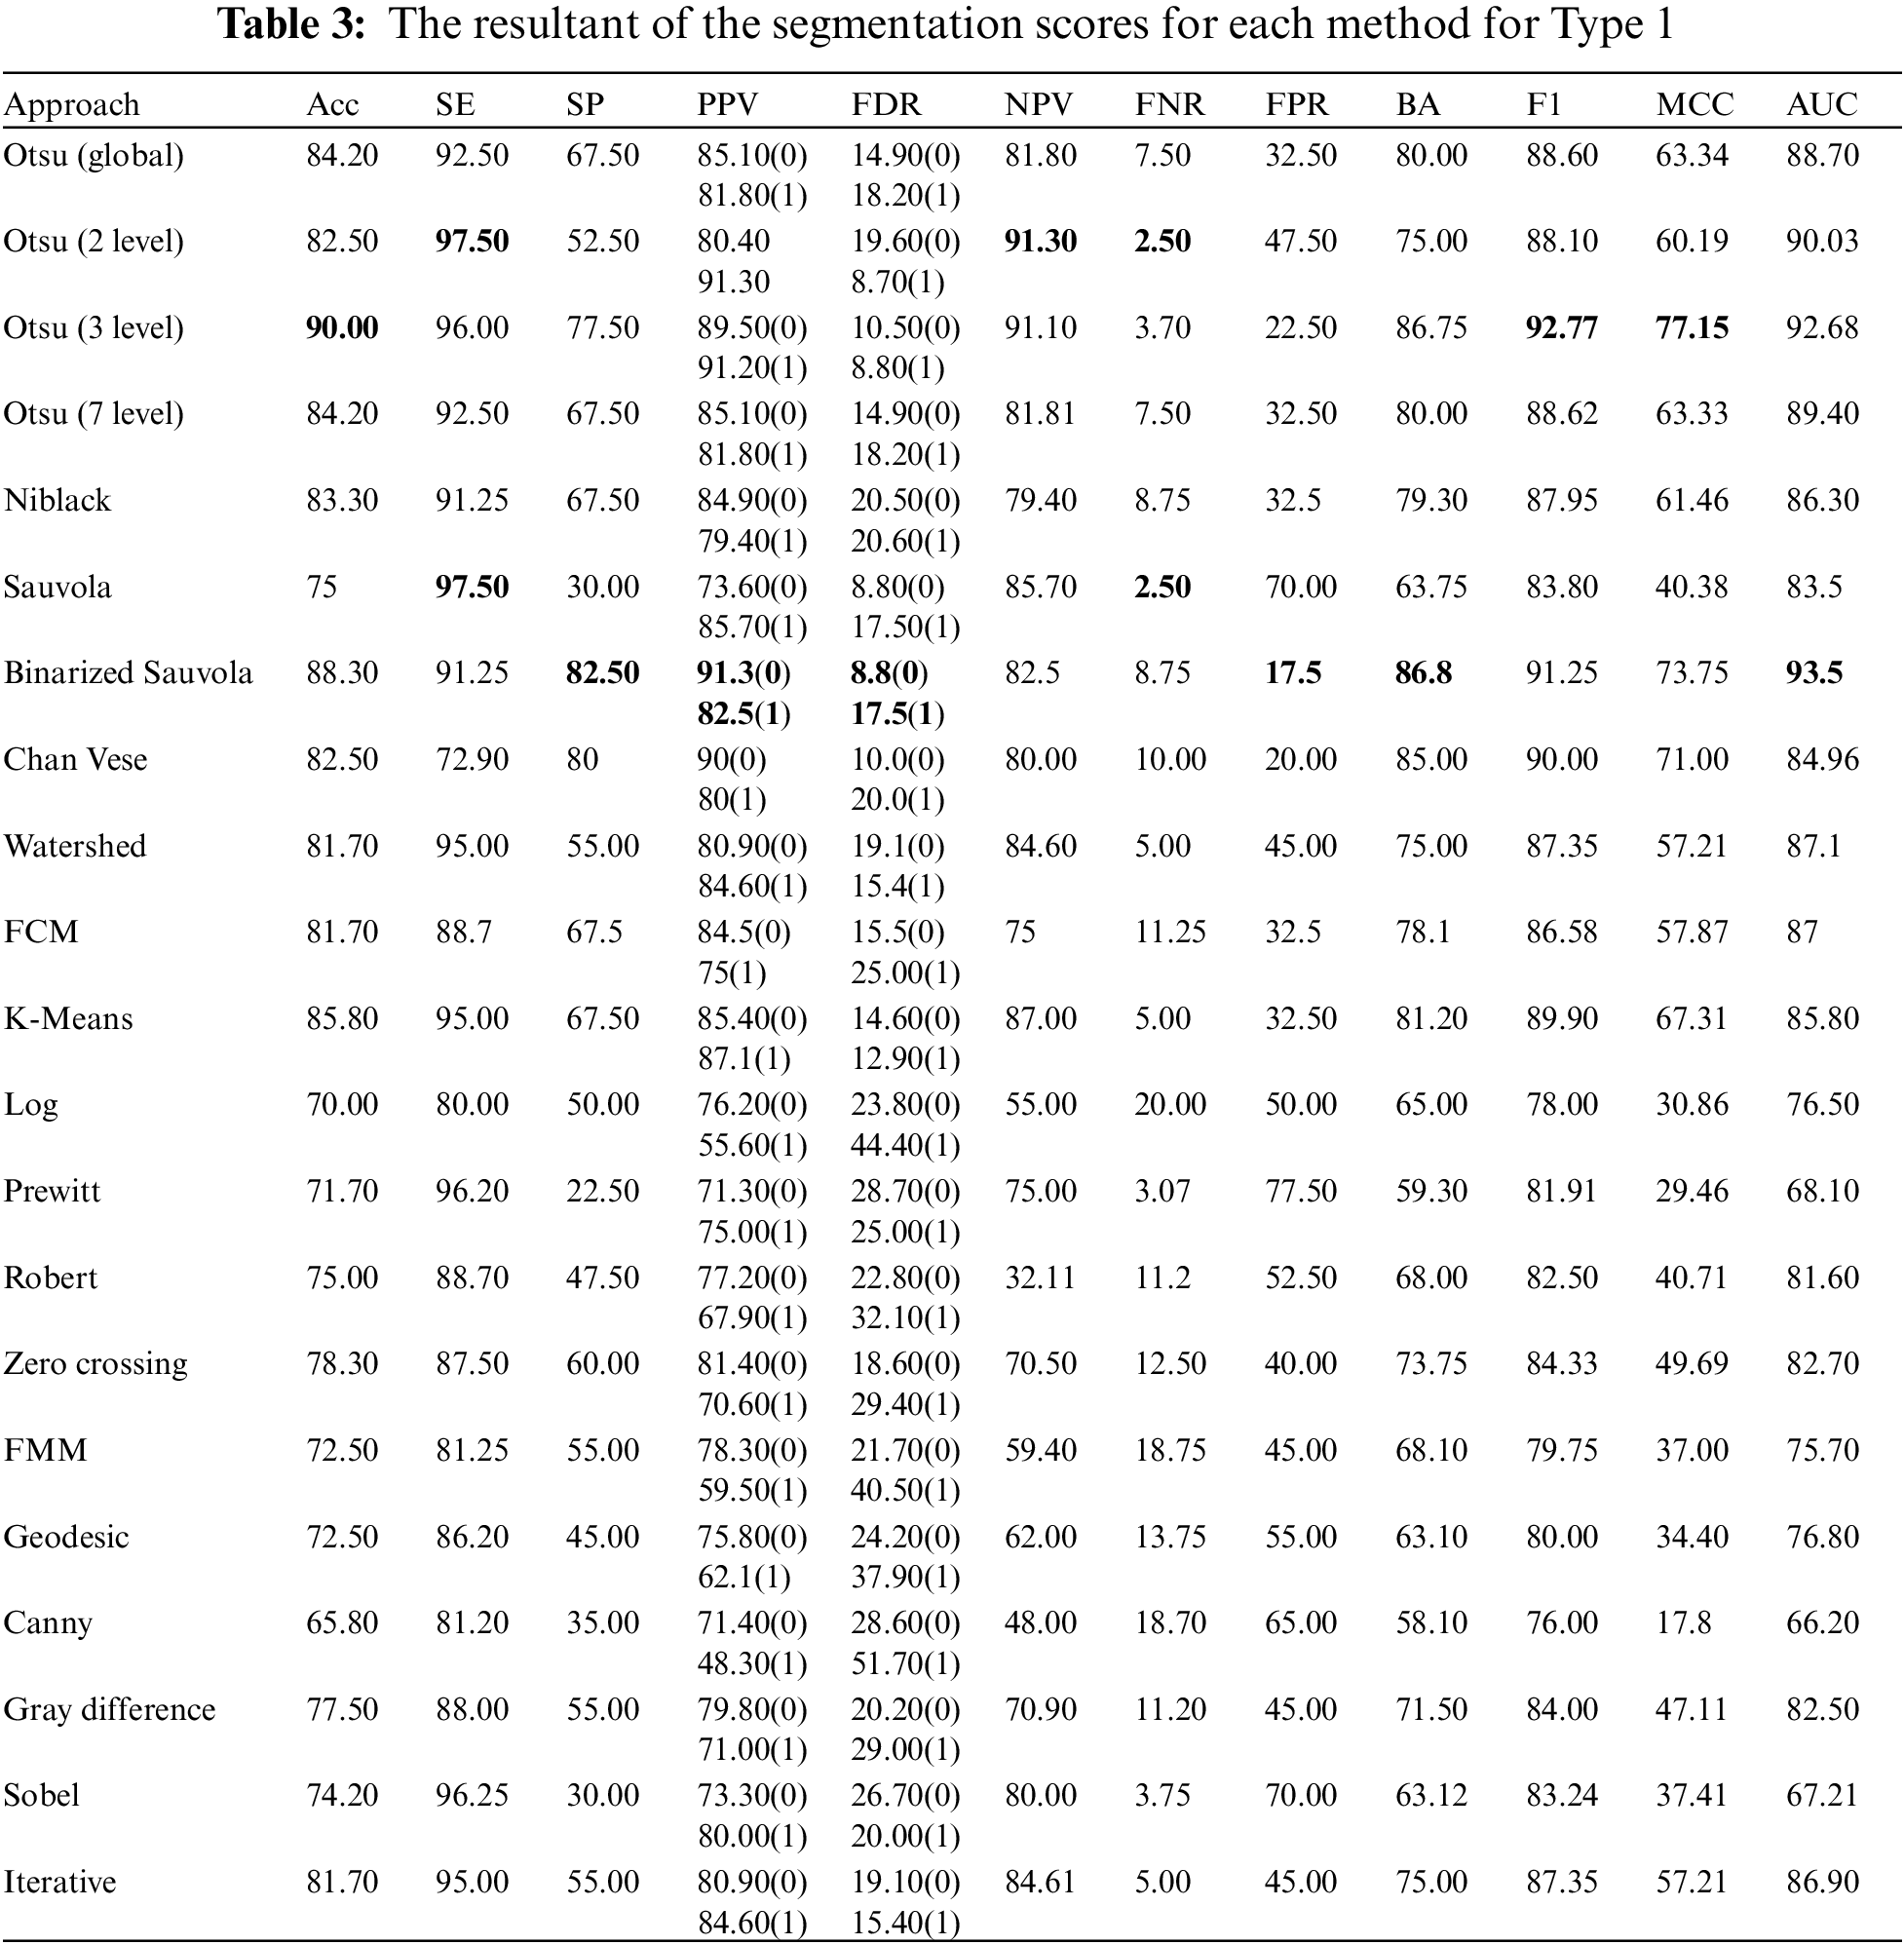
We assembled the skin cancer pictures from the PH2 database. The resolution of pictures is 768 * 560 and is categorized into 3 classes Melanoma, Atypical Nevus, and Common nevi. The number of pictures in every class is 40, 80 and 80, respectively. A few sample pictures from the database are illustrated in Fig. 2. We employ the textural features of skin cancer photos to validate the precision and effectiveness of our suggested method. From GLCM numerous features are deployed for the skin cancer classification namely autocorrelation, Contrast, Correlation, Energy, Entropy, homogeneity, maximum probability, sum of squares, sum average, and sum variance. Each class of skin malignancy is differentiated by certain features. The algorithms for feature extraction withdraw distinctive features out of every class of skin cancer images. The GLCM acquires the RGB image initially and transforms it to a grayscale image, wherein the number of rows and columns matches the number of gray levels. The periodicity of a particular number of gray levels recurring at multiple points within an image is determined by GLCM. GLCM feature extraction exploits the spatial relationship among various combinations of pixels to map the gray level co-occurrence probabilities in distinct angular positions. The GLRLM is also employed to extract textural features. An algorithm for generating higher order statistical texture features is the GLRLM methodology. A line of pixels having an identical intensity value oriented in a particular direction is referred to as a gray level run. The gray level run length is computed by the amount of these pixels, and the run length value is the total number of occurrences. In this case, the number of adjacent pixels in the specified direction that have the same grey intensity can be referred to as the run length. 7 GLRLM features are withdrawn in our proposed method and the parameters are SRE, LRE, GLN, RLN, RP, LGLRE, and HGLRE. Also, we evaluated 8 statistical features. With the combination of 3 types of textural feature extraction, a total of 34 features are used in this work. A feature vector of 200 * 34, i.e., 200 images from the PH2 dataset and 34 textural features is made which is used to classify skin cancer into benign and malignant categories. The different segmentation techniques have been utilized and compared belonging to the categories: Thresholding based, cluster based, edge based, and region based. The segmentation results were compared with the reference images (ground truth) and the segmentation errors were evaluated by the 12 metrics described above. The results are illustrated in Figs. 18–20. Type 1: With an accuracy score of 90.00%, the Otsu (3 level) method is the best approach. The Otsu (2 level) and Sauvola have the best SE rate, which is 97.50%. The Binarized Sauvola achieves the best SP rate of 82.50%. The Binarized Sauvola achieves the best PPV rate of 91.30% (benign) and 82.5% (malignant). The Binarized Sauvola achieves the best FDR rate of 8.8% (benign) and 17.5% (malignant). The Otsu (2 level) yields the best NPV rate of 91.30%. The Otsu (2 level) yields the best FNR rate of 2.50%. The Binarized Sauvola achieves the highest FPR (17.55%). The Binarized Sauvola achieves the best BA rate of 86.80%. The Otsu (3 level) achieves the best F1 rate of 92.70%. The Otsu (3 level) achieves the best MCC rate of 77.15%. The Otsu (2 level) and Sauvola have the best AUC rate, which is 97.50%. The Binarized Sauvola achieves the best SE rate of 93.50% as shown in Table 3. Table 4 shows the median of the segmentation scores for each method.
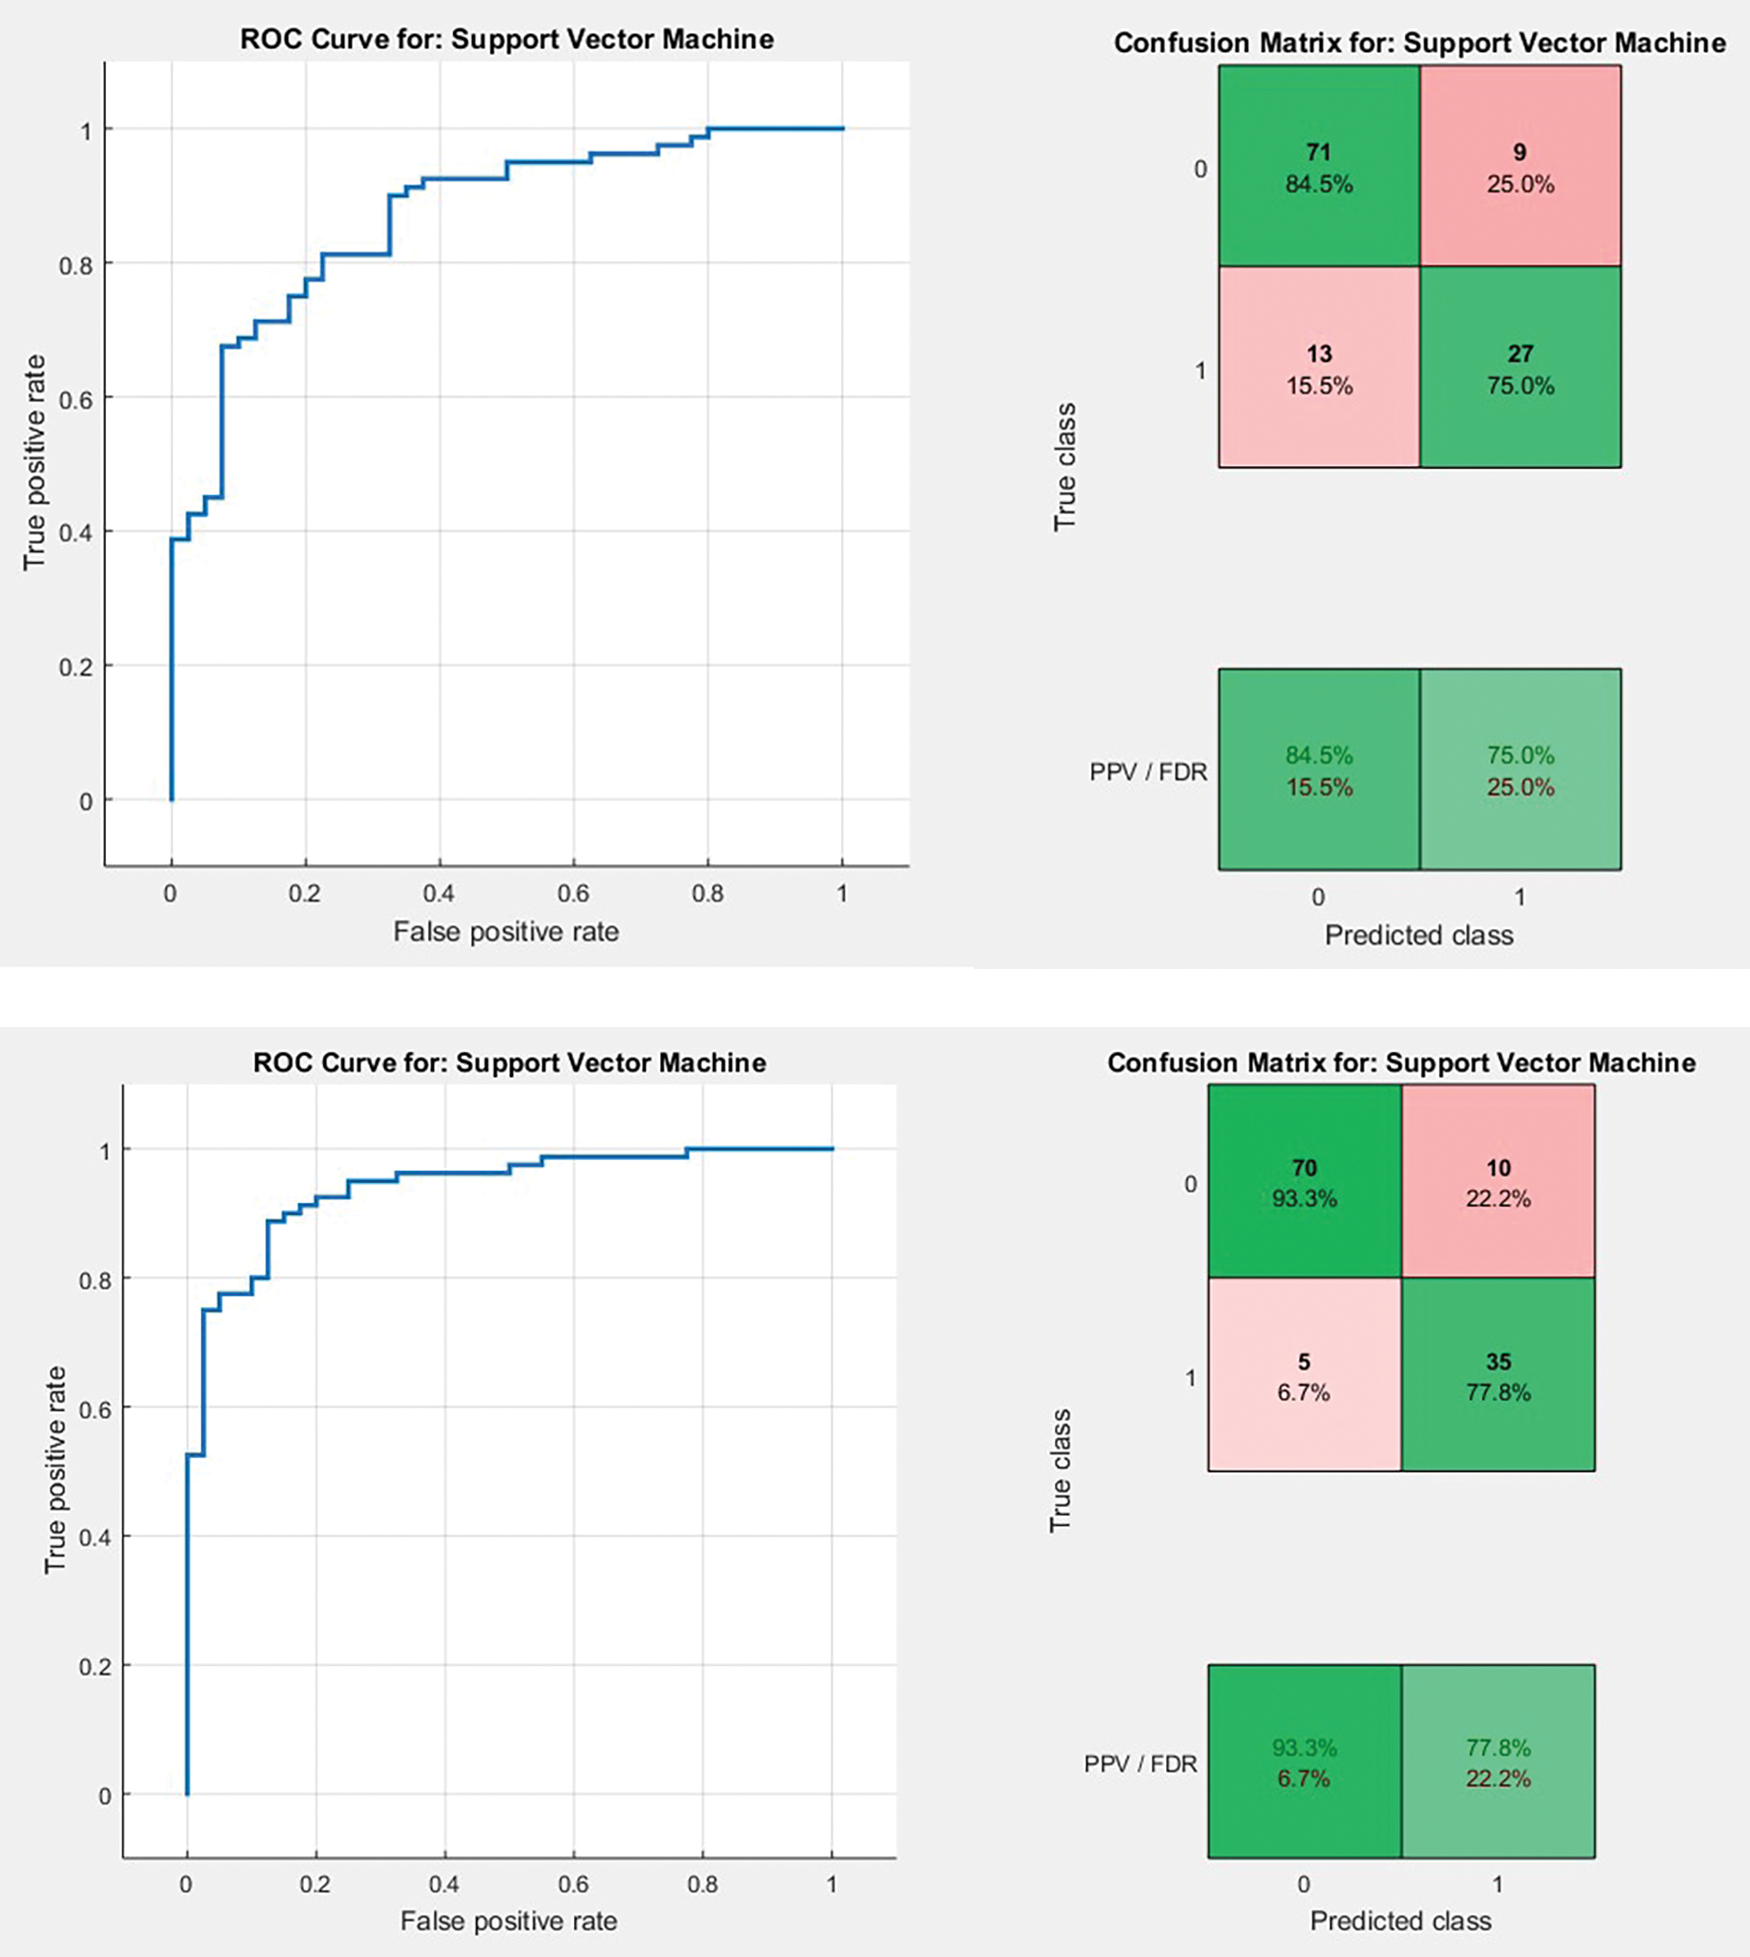
Figure 18: AUC plots and confusion matrix referring to Type 1 and Type 2 approaches for FCM, respectively
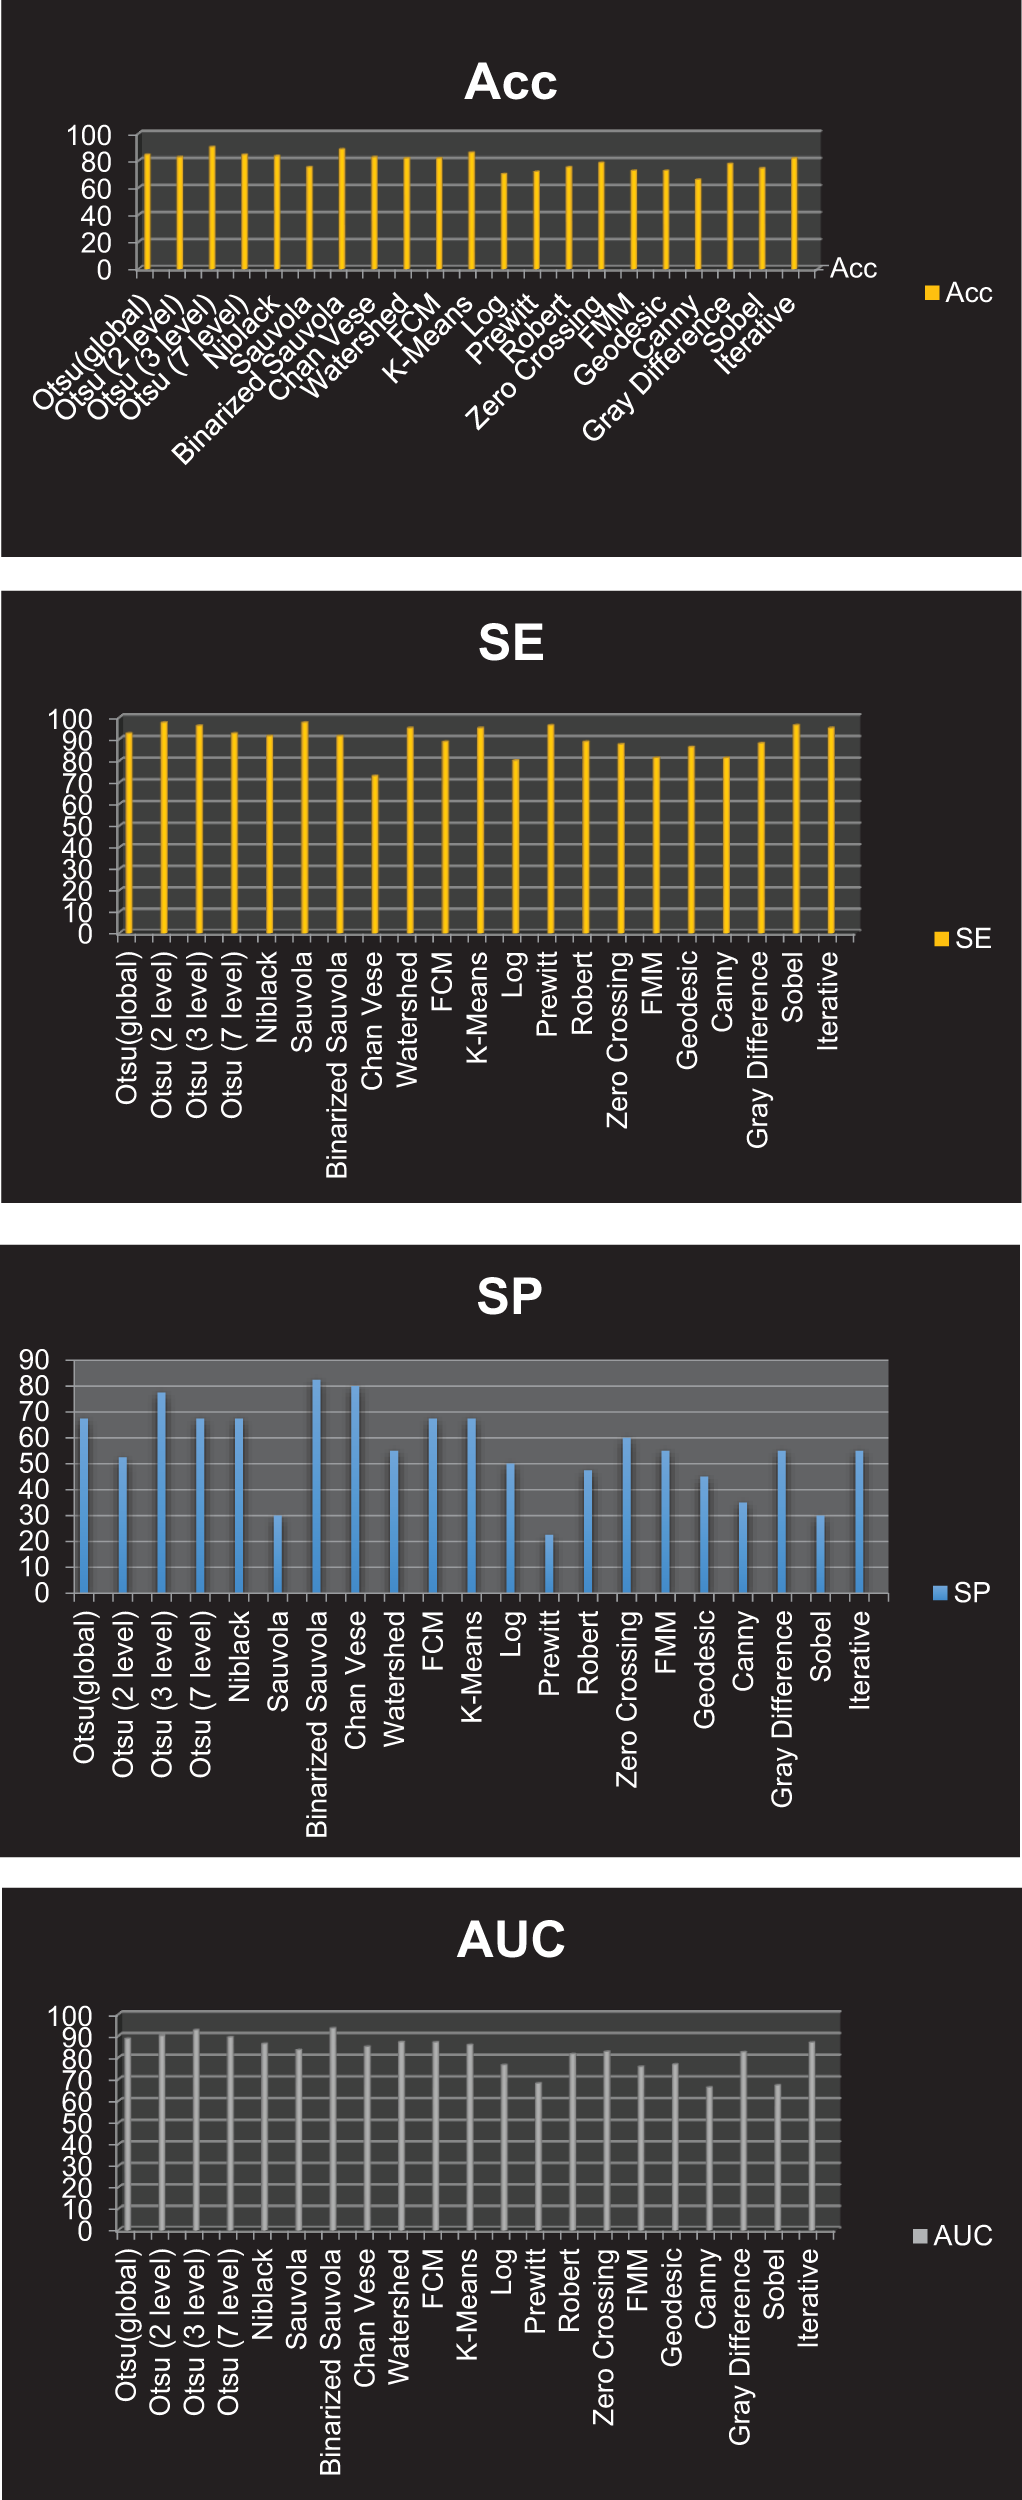
Figure 19: Graphical representation of resultant ACC, SE, SP and AUC for all the segmentation approaches corresponding to Type 1 classification
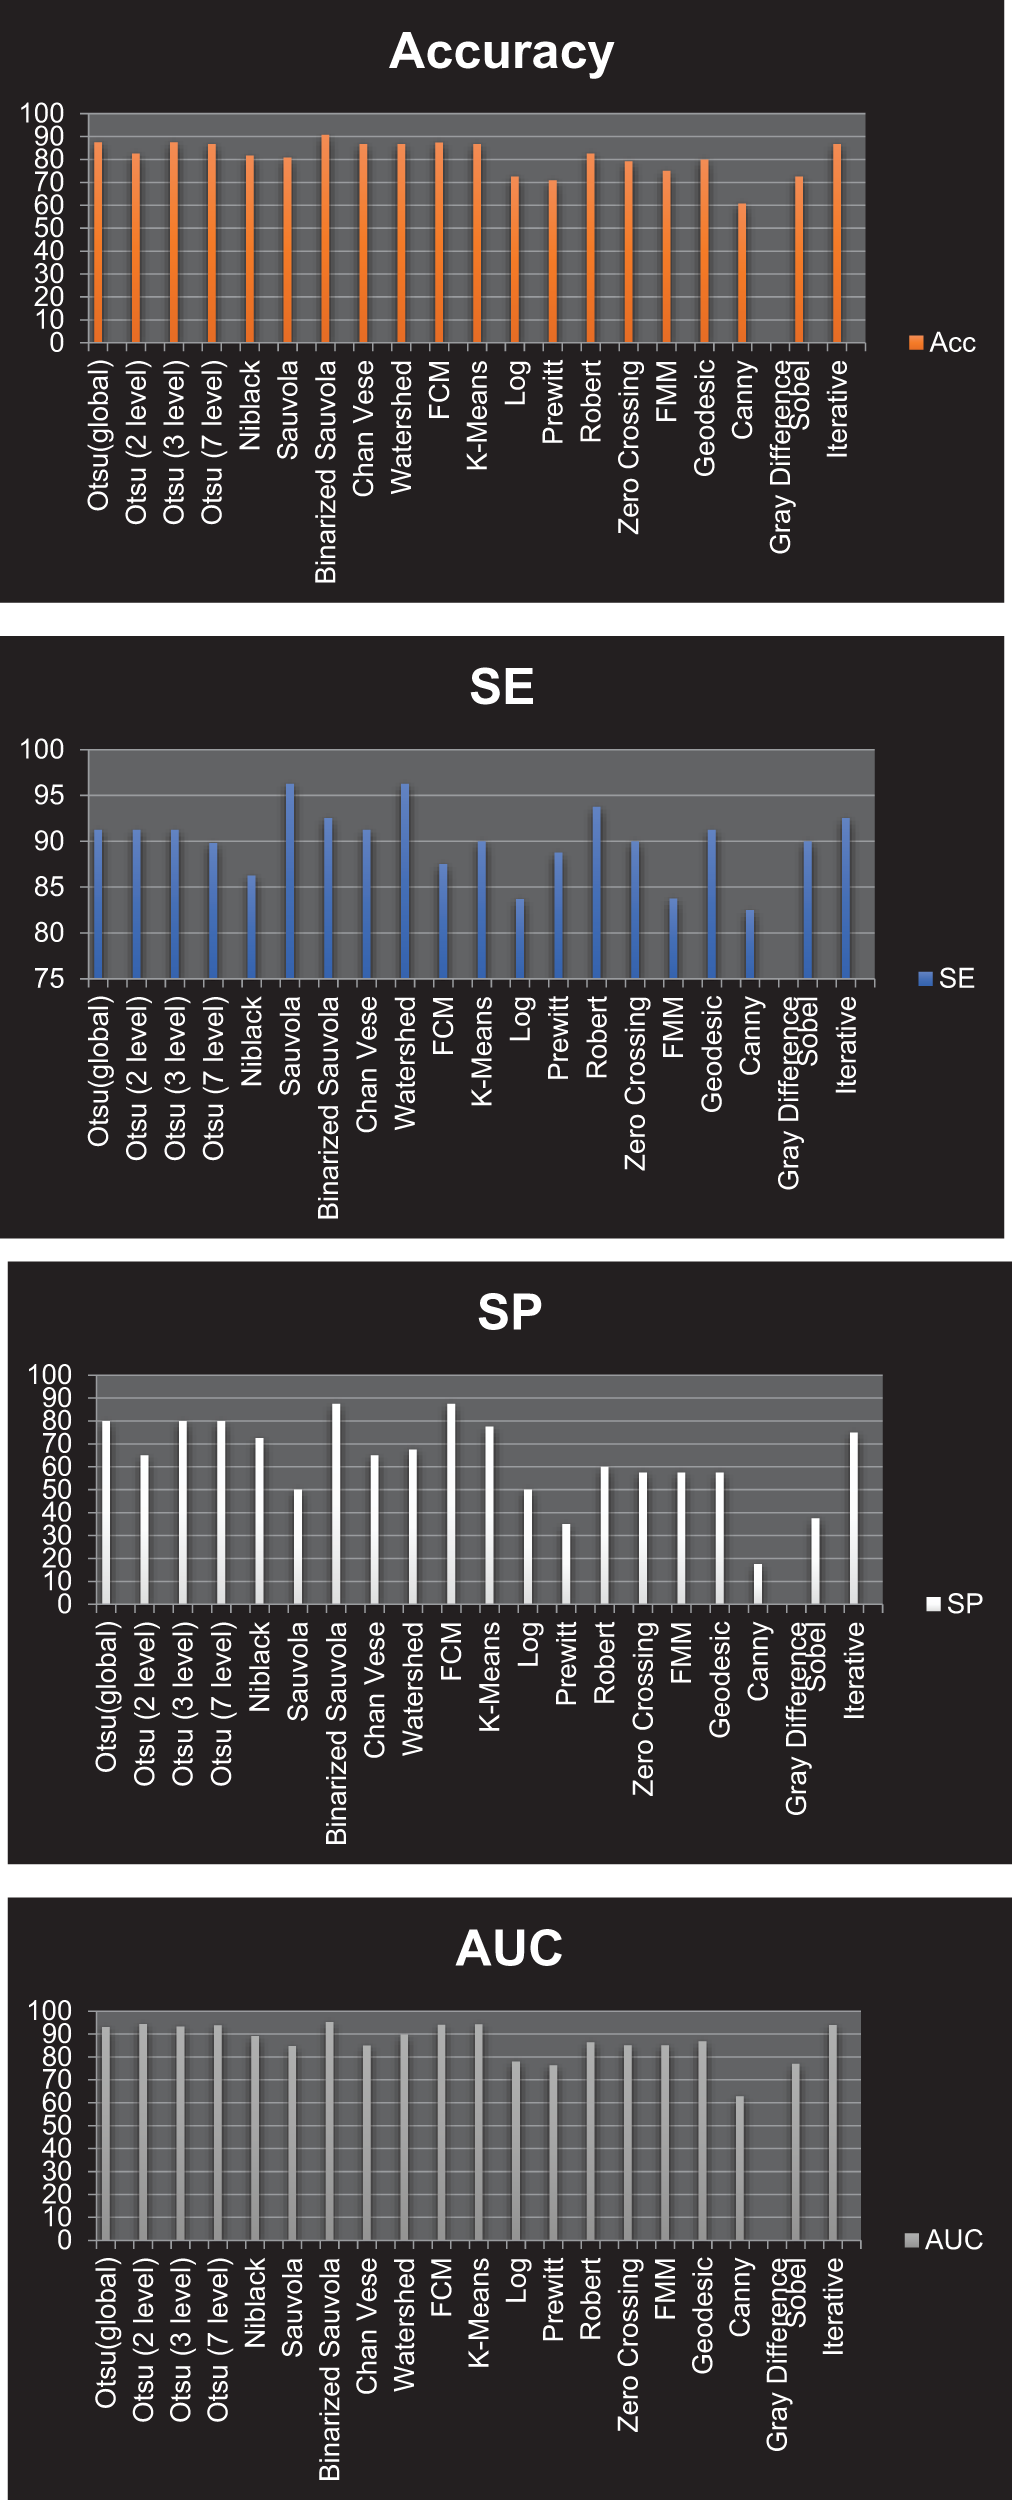
Figure 20: Graphical representation of resultant Accuracy, SE, SP and AUC for all the segmentation approaches corresponding to Type 2 classification
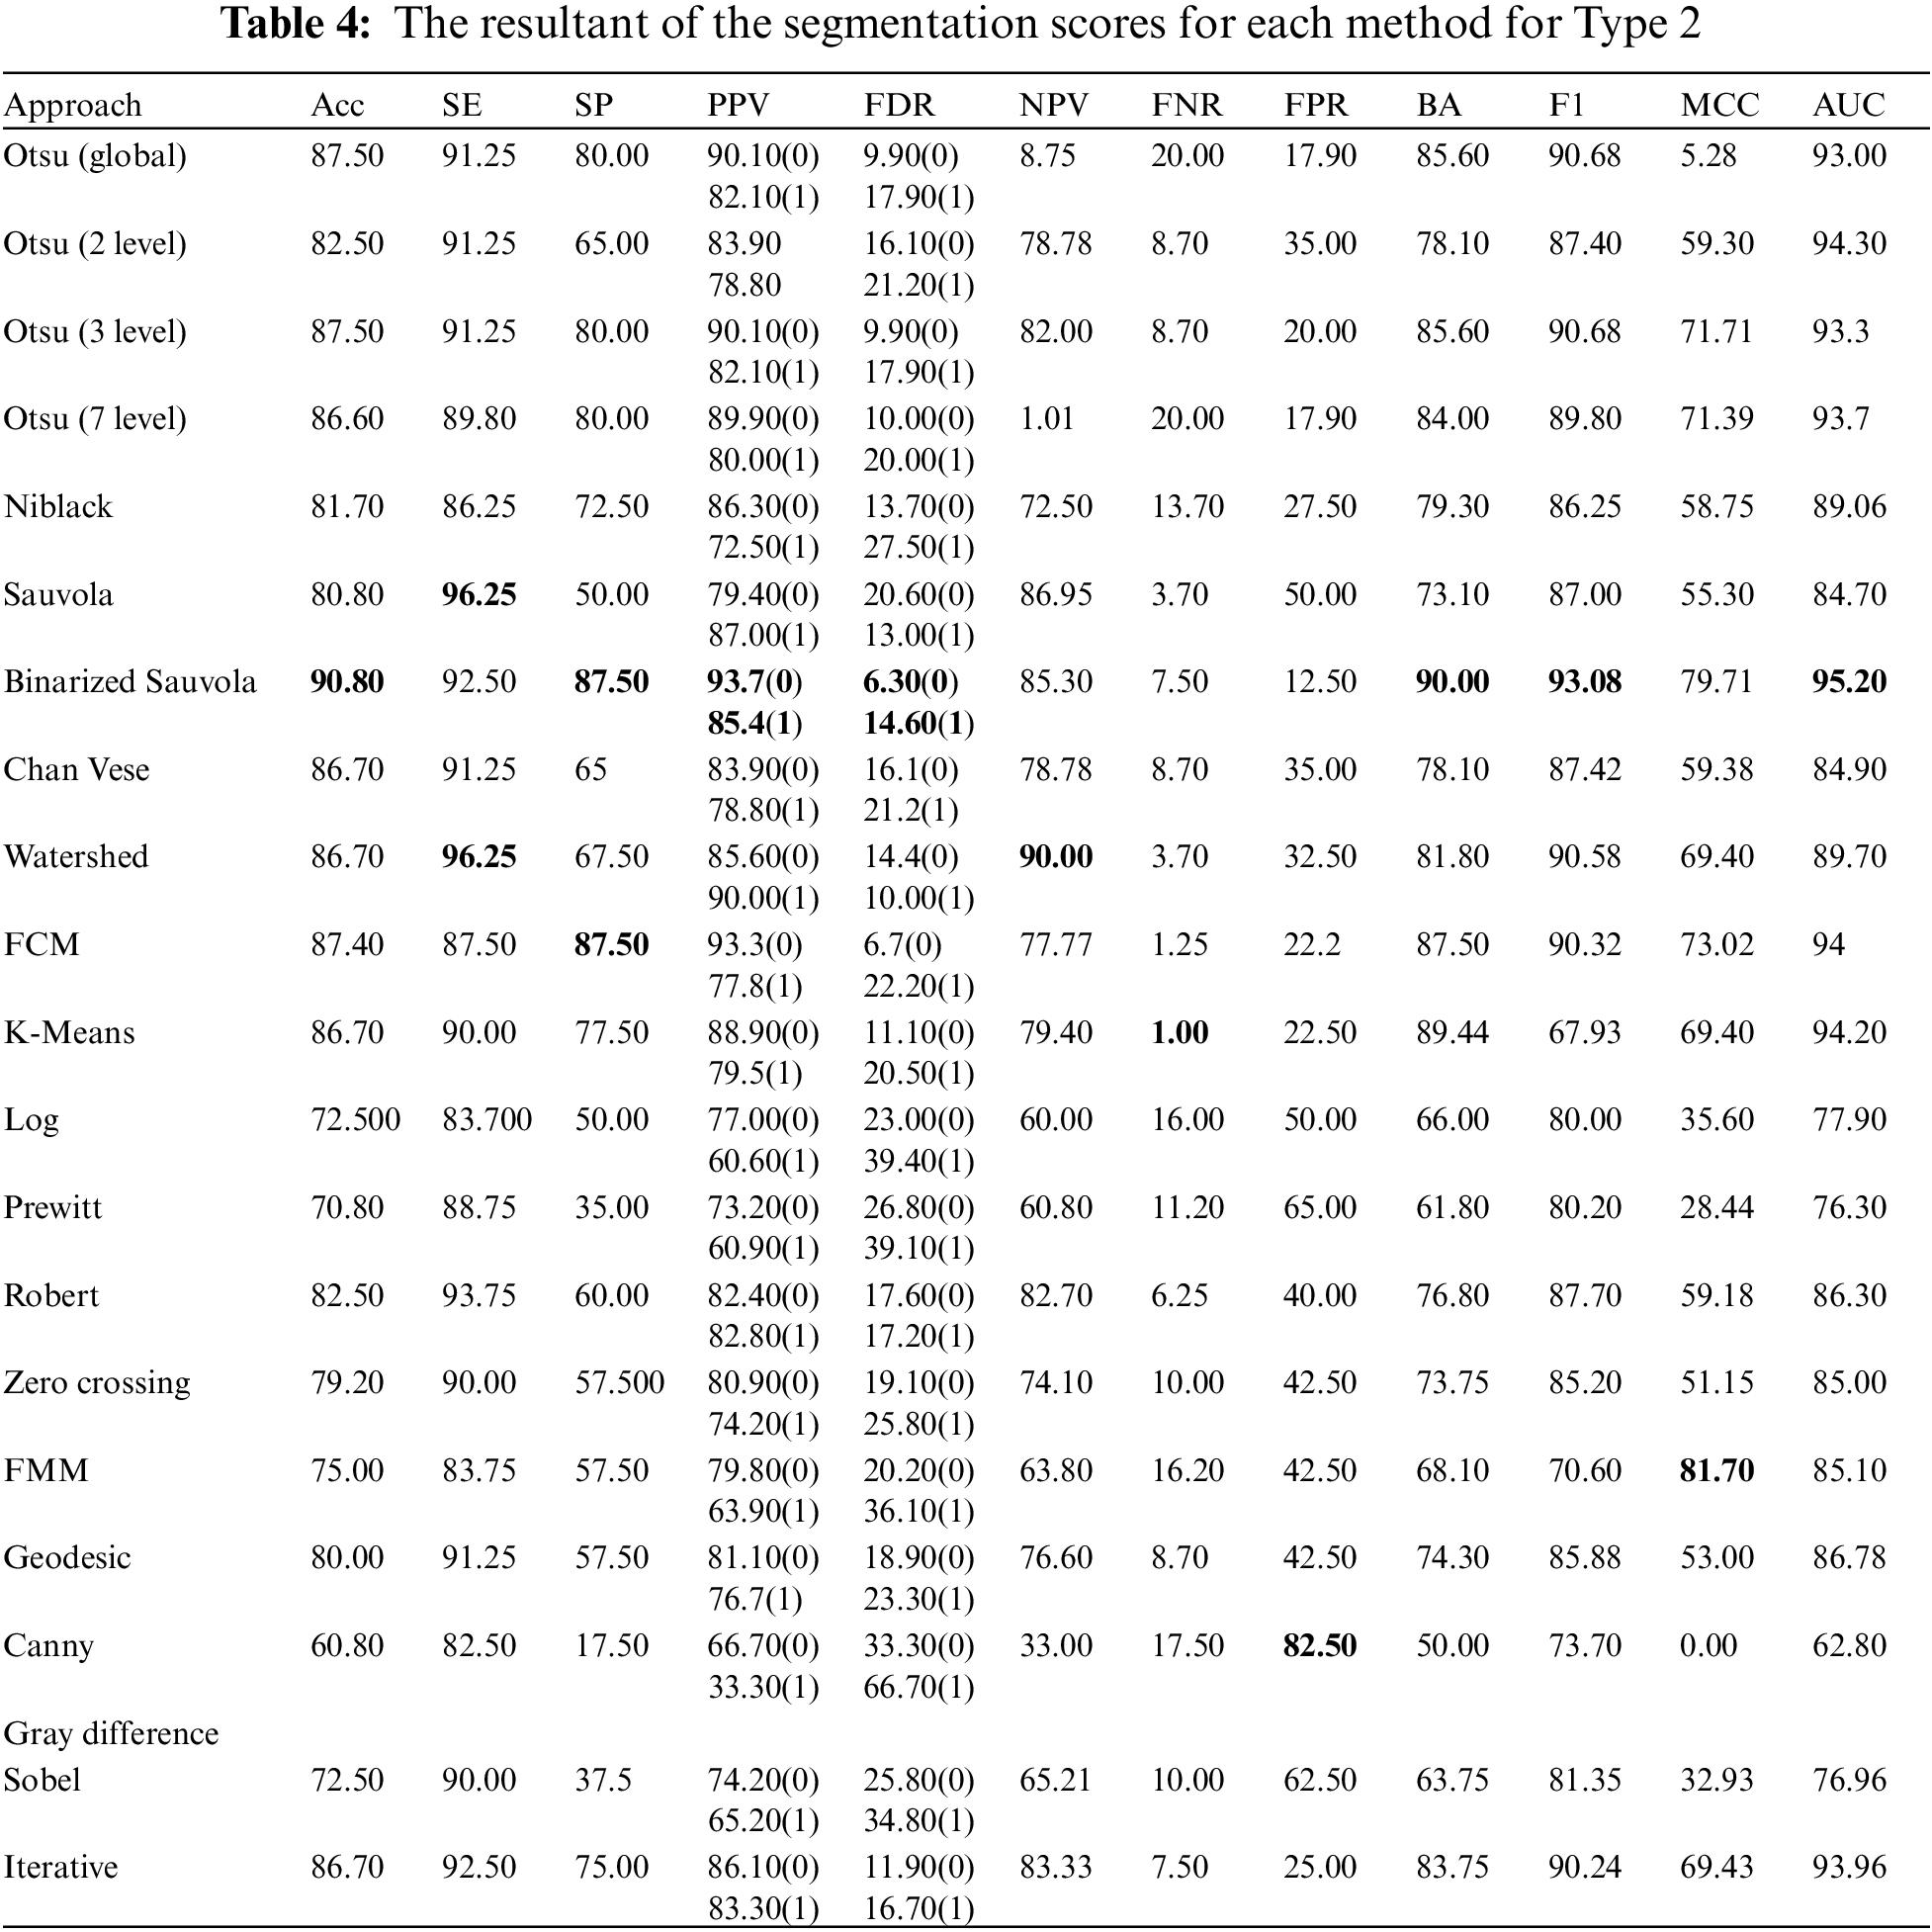
Type 2: With an accuracy score of 90.80%, the Binarized Sauvola is the best approach. The Sauvola and Watershed have the best SE rate, at 96.25%. The Binarized Sauvola and FCM achieve the best SP rate of 87.50%. The Binarized Sauvola achieves the best PPV rate of 85.4% (malignant) and 93.7% (benign). The Binarized Sauvola exhibits the best FDR rate, which varies from 14.60% for instances of cancer to 6.30% for benign cases. The Watershed reaches the highest net present value rate at 90.00%. K-means clustering has the best FNR rate at 1.00%. At 82.50 percent, The Canny records the highest FPR.
The Binarized Sauvola achieves the best BA rate of 90.00%. The Binarized Sauvola achieves the best F1 rate of 93.08%. The FMM achieves the best MCC rate of 81.7%. The Binarized Sauvola achieves the best AUC rate of 95.20% as shown in Table 4.
By recognizing and classifying the lesion from the dermoscopy images, the research offers an image processing method that is crucial for the detection of skin cancer. 200 dermoscopic images (8 bits RGB images) with a 768 * 560 resolution are recovered, segmented, feature extracted, and classed after preprocessing from the PH2 database. Pre-processing techniques include grayscale photo conversion from RGB and noise reduction with dull razor software. Numerous segmentation methodologies, including region-based, edge-based, cluster-based, and threshold-based approaches, have been put into operation and evaluated. Knowing how to distinguish benign from malignant moles is essential because they may initially seem to be the same. An essential tool for therapists with little to no training is automatic identification. In order to aid in the early diagnosis of malignant melanoma and melanocytic nevi lesions, this study implemented a computer-aided technique of categorizing melanoma based on dermoscopy images. Pre-processing mainly improves the images by removing unwanted hair, which facilitates precise feature extraction and helps distinguish between different kinds of lesions. Research has highlighted the combination of statistical, GLCM, and GLRLM features for dermoscopy picture identification. Thirty-two pertinent textural features have been identified from the co-occurrence matrix. In the final stage, the SVM classifier for classification has been recommended in two ways. Different levels of classification accuracy were demonstrated by the classification methodology’s performance. The most effective method for classifying melanoma and atypical nevi, two types of skin cancer, is the Otsu (3 level) technique. At 90.00% accuracy, it received the best possible score. A different method that yields far better results divides melanoma and ordinary nevi into two categories of skin cancer using the Binarized Sauvola. This strategy offers an ideal accuracy score of 90.80%. This study suggests that the combination of textural traits can be useful in efficiently classifying malignant melanoma, common nevi, and atypical nevi in dermoscopy pictures.
In the future, this methodology could be applied for evaluation on larger skin-cancer databases like ISIC and HAM10000. We intend to use more sophisticated techniques in the future, particularly deep learning algorithms, to increase system stability and yield more precise diagnoses on dermatological photos. The aim of implementing these tactics is to identify and differentiate between skin lesions. Subsequent investigations might leverage this unique approach to augment the treatment estimate of the melanoma lesion framework and incorporate temporal visualizations to enhance the algorithm’s capability to detect borders for melanoma lesions.
Acknowledgement: The authors thank the Biomedical Sensors & Systems Lab for supporting this research and the article processing charges.
Funding Statement: The authors received no external funding for this study.
Author Contributions: Study conception and design: Khushmeen Kaur Brar, Bhawna Goyal; methodology: Khushmeen Kaur Brar, Bhawna Goyal, Ayush Dogra; software: Khushmeen Kaur Brar, Bhawna Goyal, Ayush Dogra; formal analysis: Khushmeen Kaur Brar, Bhawna Goyal, Ayush Dogra; data correction: Khushmeen Kaur Brar; writing—original draft preparation: Khushmeen Kaur Brar, Bhawna Goyal, Ayush Dogra, Sampangi Rama Reddy; writing—review and editing: Khushmeen Kaur Brar, Bhawna Goyal, Ahmed Alkhayyat, Manob Jyoti Saikia; supervision, Sampangi Rama Reddy, Ahmed Alkhayyat, Rajesh Singh, Manob Jyoti Saikia. All authors reviewed the results and approved the final version of the manuscript.
Availability of Data and Materials: The data used in the study is openly available at https://www.fc.up.pt/addi/ph2%20database.html, accessed on 19 May 2022.
Ethics Approval: Not applicable.
Conflicts of Interest: The authors declare no conflicts of interest to report regarding the present study.
References
1. Y. Wu, B. Chen, A. Zeng, D. Pan, R. Wang and S. Zhao, “Skin cancer classification with deep learning: A systematic review,” Front. Oncol., vol. 12, pp. 1–20, 2022. doi: 10.3389/fonc.2022.893972. [Google Scholar] [PubMed] [CrossRef]
2. P. Clarke, “Benign pigmented skin lesions,” Royal Austral. Coll. General Practit. 2019, vol. 48, no. 6, pp. 364–367, 2019. doi: 10.31128/AJGP-12-18-4802. [Google Scholar] [PubMed] [CrossRef]
3. R. H. Oza et al., “Role of dermoscopy in hyperpigmented skin disorders: A tertiary care centre experience,” IP Indian J. Clin. Exp. Dermatol., vol. 9, no. 4, pp. 184–193, 2023. doi: 10.18231/j.ijced.2023.036. [Google Scholar] [CrossRef]
4. A. Michalak-Stoma, K. Małkińska, and D. Krasowska, “Usefulness of dermoscopy to provide accurate assessment of skin cancers,” Clin. Cosmet. Investig. Dermatol., vol. 14, pp. 733–746, 2021. doi: 10.2147/CCID.S305924. [Google Scholar] [PubMed] [CrossRef]
5. G. Babino et al., “Melanoma diagnosed on digital dermoscopy monitoring: A side-by-side image comparison is needed to improve early detection,” J. Am. Acad. Dermatol., vol. 85, no. 3, pp. 619–625, 2021. doi: 10.1016/j.jaad.2020.07.013. [Google Scholar] [PubMed] [CrossRef]
6. G. Nikolakis, A. G. Vaiopoulos, I. Georgopoulos, E. Papakonstantinou, G. Gaitanis and C. C. Zouboulis, “Insights, advantages, and barriers of teledermatology vs. face-to-face dermatology for the diagnosis and follow-up of non-melanoma skin cancer: A systematic review,” Cancers, vol. 16, no. 3, 2024, Art. no. 578. doi: 10.3390/cancers16030578. [Google Scholar] [PubMed] [CrossRef]
7. J. Frühauf et al., “Patient acceptance and diagnostic utility of automated digital image analysis of pigmented skin lesions,” J. Eur. Acad. Dermatol. Venereol., vol. 26, no. 3, pp. 368–372, 2012. doi: 10.1111/j.1468-3083.2011.04081.x. [Google Scholar] [PubMed] [CrossRef]
8. G. P. Pfeifer, “Mechanisms of UV-induced mutations and skin cancer,” Genome Instab. Dis., vol. 1, no. 3, pp. 99–113, 2020. doi: 10.1007/s42764-020-00009-8. [Google Scholar] [PubMed] [CrossRef]
9. R. E. Neale et al., The Effects of Exposure to Solar Radiation on Human Health. Australia: Springer International Publishing, 2023, vol. 22, no. 5. doi: 10.1007/s43630-023-00375-8. [Google Scholar] [CrossRef]
10. M. Zafar, M. I. Sharif, M. I. Sharif, S. Kadry, S. A. C. Bukhari and H. T. Rauf, “Skin lesion analysis and cancer detection based on machine/deep learning techniques: A comprehensive survey,” Life, vol. 13, no. 1, pp. 1–18, 2023. doi: 10.3390/life13010146. [Google Scholar] [PubMed] [CrossRef]
11. R. Marrapodi and B. Bellei, “The keratinocyte in the picture cutaneous melanoma microenvironment,” Cancers, vol. 16, no. 5, 2024. doi: 10.3390/cancers16050913. [Google Scholar] [PubMed] [CrossRef]
12. F. Alendar, I. Drljevic, K. Drljevic, and T. Alendar, “Early detection of melanoma skin cancer,” Biomol. Biomed., vol. 9, no. 1, pp. 77–80, 2009. doi: 10.17305/bjbms.2009.2861. [Google Scholar] [PubMed] [CrossRef]
13. P. Riazi Esfahani et al., “Leveraging machine learning for accurate detection and diagnosis of melanoma and nevi: An interdisciplinary study in dermatology,” Cureus, vol. 15, no. 8, 2023, Art. no. e44120. doi: 10.7759/cureus.44120. [Google Scholar] [PubMed] [CrossRef]
14. F. Nachbar et al., “The ABCD rule of dermatoscopy. High prospective value in the diagnosis of doubtful melanocytic skin lesions,” J. Am. Acad. Dermatol., vol. 30, no. 4, pp. 551–559, 1994. doi: 10.1016/S0190-9622(94)70061-3. [Google Scholar] [PubMed] [CrossRef]
15. E. M. Senan and M. E. Jadhav, “Analysis of dermoscopy images by using ABCD rule for early detection of skin cancer,” Glob. Trans. Proc., vol. 2, no. 1, pp. 1–7, 2021. doi: 10.1016/j.gltp.2021.01.001. [Google Scholar] [CrossRef]
16. J. Zhao et al., “The correlation between dermoscopy and clinical and pathological tests in the evaluation of skin photoaging,” Skin Res. Technol., vol. 30, no. 1, pp. 1–7, 2024. doi: 10.1111/srt.13578. [Google Scholar] [PubMed] [CrossRef]
17. Z. Zainal Abidin, S. A. Asmai, Z. Abal Abas, N. A. Zakaria, and S. N. Ibrahim, “Development of edge detection for image segmentation,” IOP Conf. Ser.: Mater. Sci. Eng., vol. 864, no. 1, 2020. doi: 10.1088/1757-899X/864/1/012058. [Google Scholar] [CrossRef]
18. P. Schmid, “Lesion detection in dermatoscopic images using anisotropic diffusion and morphological flooding,” IEEE Int. Conf. Image Process, vol. 3, pp. 449–453, 1999. doi: 10.1109/icip.1999.817154. [Google Scholar] [CrossRef]
19. H. Ganster, A. Pinz, R. Röhrer, E. Wildling, M. Binder and H. Kittler, “Automated melanoma recognition,” IEEE Trans. Med. Imaging., vol. 20, no. 3, pp. 233–239, 2001. doi: 10.1109/42.918473. [Google Scholar] [PubMed] [CrossRef]
20. S. Cacciapuoti et al., “A measurement software for professional training in early detection of melanoma,” Appl. Sci., vol. 10, no. 12, 2020, Art. no. 4351. doi: 10.3390/app10124351. [Google Scholar] [CrossRef]
21. S. Garg and B. Jindal, “Skin lesion segmentation using k-mean and optimized fire fly algorithm,” Multimed. Tools Appl., vol. 80, no. 5, pp. 7397–7410, 2021. doi: 10.1007/s11042-020-10064-8. [Google Scholar] [CrossRef]
22. G. M. Kosgiker, A. Deshpande, and K. Anjum, “Significant of multi-level pre-processing steps and its proper sequence in SegCaps skin lesion segmentation of dermoscopic images,” Mater. Today: Proc., vol. 51, no. 2, pp. 129–141, 2021. doi: 10.1016/j.matpr.2021.05.016. [Google Scholar] [CrossRef]
23. N. Şahin, N. Alpaslan, and D. Hanbay, “Robust optimization of SegNet hyperparameters for skin lesion segmentation,” Multimed. Tools Appl., vol. 81, no. 25, pp. 36031–36051, 2022. doi: 10.1007/s11042-021-11032-6. [Google Scholar] [CrossRef]
24. M. Pezhman Pour and H. Seker, “Transform domain representation-driven convolutional neural networks for skin lesion segmentation,” Expert Syst. Appl., vol. 144, no. 9, 2020, Art. no. 113129. doi: 10.1016/j.eswa.2019.113129. [Google Scholar] [CrossRef]
25. W. Li, A. N. Joseph Raj, T. Tjahjadi, and Z. Zhuang, “Digital hair removal by deep learning for skin lesion segmentation,” Pattern Recognit., vol. 117, 2021, Art. no. 107994. doi: 10.1016/j.patcog.2021.107994. [Google Scholar] [CrossRef]
26. L. Singh, R. R. Janghel, and S. P. Sahu, “SLICACO: An automated novel hybrid approach for dermatoscopic melanocytic skin lesion segmentation,” Int. J. Imaging Syst. Technol., vol. 31, no. 4, pp. 1817–1833, 2021. doi: 10.1002/ima.22591. [Google Scholar] [CrossRef]
27. M. Nasir, M. Attique Khan, M. Sharif, I. U. Lali, T. Saba and T. Iqbal, “An improved strategy for skin lesion detection and classification using uniform segmentation and feature selection based approach,” Microsc. Res. Tech., vol. 81, no. 6, pp. 528–543, 2018. doi: 10.1002/jemt.23009. [Google Scholar] [PubMed] [CrossRef]
28. E. Santos, R. Veras, H. Miguel, K. Aires, M. L. Claro and G. B. Junior, “A skin lesion semi-supervised segmentation method,” Int. Conf. Syst. Signals, Image Process, vol. 2020, pp. 33–38, 2020. doi: 10.1109/IWSSIP48289.2020.9145240. [Google Scholar] [CrossRef]
29. Z. N. Khan, “Frequency and spatial domain based saliency for pigmented skin lesion segmentation,” 2020, arXiv:2010.04022. [Google Scholar]
30. K. Zafar et al., “Skin lesion segmentation from dermoscopic images using convolutional neural network,” Sensors, vol. 20, no. 6, pp. 1–14, 2020. doi: 10.3390/s20061601. [Google Scholar] [PubMed] [CrossRef]
31. S. M. Jaisakthi, P. Mirunalini, and C. Aravindan, “Automated skin lesion segmentation of dermoscopic images using GrabCut and kmeans algorithms,” IET Comput. Vis., vol. 12, no. 8, pp. 1088–1095, 2018. doi: 10.1049/iet-cvi.2018.5289. [Google Scholar] [CrossRef]
32. M. Ammar, S. G. Khawaja, A. Atif, M. U. Akram, and M. Sakeena, “Learning based segmentation of skin lesion from dermoscopic images,” in 2018 IEEE 20th Int. Conf. e-Health Networking Appl. Serv. Heal. 2018, 2018, pp. 1–6. doi: 10.1109/HealthCom.2018.8531156. [Google Scholar] [CrossRef]
33. Y. Jiang, S. Cao, S. Tao, and H. Zhang, “Skin lesion segmentation based on multi-scale attention convolutional neural network,” IEEE Access, vol. 8, pp. 122811–122825, 2020. doi: 10.1109/ACCESS.2020.3007512. [Google Scholar] [CrossRef]
34. H. M. Ünver and E. Ayan, “Skin lesion segmentation in dermoscopic images with combination of yolo and grabcut algorithm,” Diagnostics, vol. 9, no. 3, 2019, Art. no. 72. doi: 10.3390/diagnostics9030072. [Google Scholar] [PubMed] [CrossRef]
35. O. O. Olugbara, T. B. Taiwo, and D. Heukelman, “Segmentation of melanoma skin lesion using perceptual color difference saliency with morphological analysis,” Math. Probl. Eng., vol. 2018, no. 2, 2018, Art. no. 1524286. doi: 10.1155/2018/1524286. [Google Scholar] [CrossRef]
36. T. Akram, M. A. Khan, M. Sharif, and M. Yasmin, “Skin lesion segmentation and recognition using multichannel saliency estimation and M-SVM on selected serially fused features,” J. Ambient Intell. Humaniz. Comput., vol. 15, no. 1, pp. 1083–1102, 2018. doi: 10.1007/s12652-018-1051-5. [Google Scholar] [CrossRef]
37. M. A. Khan et al., “An implementation of normal distribution based segmentation and entropy controlled features selection for skin lesion detection and classification,” BMC Cancer, vol. 18, no. 1, pp. 1–20, 2018. doi: 10.1186/s12885-018-4465-8. [Google Scholar] [PubMed] [CrossRef]
38. S. M. Jaisakthi, A. Chandrabose, and P. Mirunalini, “Automatic skin lesion segmentation using semi-supervised learning technique,” 2017, arXiv:1703.04301. [Google Scholar]
39. X. Jia and L. Shen, “Skin lesion classification using class activation map,” 2017, arXiv:1703.01053. [Google Scholar]
40. F. Jiang, F. Zhou, J. Qin, T. Wang, and B. Lei, “Decision-augmented generative adversarial network for skin lesion segmentation,” Proc. Int. Symp. Biomed. Imaging., vol. 2019, pp. 447–450, 2019. doi: 10.1109/ISBI.2019.8759434. [Google Scholar] [CrossRef]
41. Z. Rahman, M. S. Hossain, M. R. Islam, M. M. Hasan, and R. A. Hridhee, “An approach for multiclass skin lesion classification based on ensemble learning,” Inform. Med. Unlocked, vol. 25, no. 10, 2021, Art. no. 100659. doi: 10.1016/j.imu.2021.100659. [Google Scholar] [CrossRef]
42. S. Moldovanu, F. A. D. Michis, K. C. Biswas, A. Culea-Florescu, and L. Moraru, “Skin lesion classification based on surface fractal dimensions and statistical color cluster features using an ensemble of machine learning techniques,” Cancers, vol. 13, no. 21, 2021, Art. no. 5256. doi: 10.3390/cancers13215256. [Google Scholar] [PubMed] [CrossRef]
43. M. A. Khan, M. Sharif, T. Akram, R. Damaševičius, and R. Maskeliūnas, “Skin lesion segmentation and multiclass classification using deep learning features and improved moth flame optimization,” Diagnostics, vol. 11, no. 5, 2021, Art. no. 811. doi: 10.3390/diagnostics11050811. [Google Scholar] [PubMed] [CrossRef]
44. M. M. K. Sarker et al., “SLSNet: Skin lesion segmentation using a lightweight generative adversarial network,” Expert Syst. Appl., vol. 183, 2021, Art. no. 115433. doi: 10.1016/j.eswa.2021.115433. [Google Scholar] [CrossRef]
45. H. Li et al., “Skin lesion segmentation via dense connected deconvolutional network,” Proc.-Int. Conf. Pattern Recognit., vol. 2018, pp. 671–675, 2018. doi: 10.1109/ICPR.2018.8545136. [Google Scholar] [CrossRef]
46. K. Korotkov and R. Garcia, “Computerized analysis of pigmented skin lesions: A review,” Artif. Intell. Med., vol. 56, no. 2, pp. 69–90, 2012. doi: 10.1016/j.artmed.2012.08.002. [Google Scholar] [PubMed] [CrossRef]
47. D. Bardou, H. Bouaziz, L. Lv, and T. Zhang, “Hair removal in dermoscopy images using variational autoencoders,” Ski. Res. Technol., vol. 28, no. 3, pp. 445–454, 2022. doi: 10.1111/srt.13145. [Google Scholar] [PubMed] [CrossRef]
48. R. Kasmi et al., “SharpRazor: Automatic removal of hair and ruler marks from dermoscopy images,” Ski. Res. Technol., vol. 29, no. 4, pp. 1–12, 2023. doi: 10.1111/srt.13203. [Google Scholar] [PubMed] [CrossRef]
49. H. K. Latif and M. Aljanabi, “Analysing and evaluation of the effectiveness of different filters on segmentation skin tumors images,” IOP Conf. Ser.: Mater. Sci. Eng., vol. 1105, no. 1, 2021, Art. no. 012068. doi: 10.1088/1757-899x/1105/1/012068. [Google Scholar] [CrossRef]
50. P. M. M. Pereira et al., “Dermoscopic skin lesion image segmentation based on local binary pattern clustering: Comparative study,” Biomed Signal Process. Control, vol. 59, no. 3, 2020, Art. no. 101924. doi: 10.1016/j.bspc.2020.101924. [Google Scholar] [CrossRef]
51. S. Malik, T. Akram, I. Ashraf, M. Rafiullah, M. Ullah and J. Tanveer, “A hybrid preprocessor DE-ABC for efficient skin-lesion segmentation with improved contrast,” Diagnostics, vol. 12, no. 11, pp. 1–14, 2022. doi: 10.3390/diagnostics12112625. [Google Scholar] [PubMed] [CrossRef]
52. R. Kaur, H. GholamHosseini, R. Sinha, and M. Lindén, “Automatic lesion segmentation using atrous convolutional deep neural networks in dermoscopic skin cancer images,” BMC Med. Imaging, vol. 22, no. 1, pp. 1–13, 2022. doi: 10.1186/s12880-022-00829-y. [Google Scholar] [PubMed] [CrossRef]
53. P. M. Kazaj, M. Koosheshi, A. Shahedi, and A. V. Sadr, “U-Net-based models for skin lesion segmentation: More attention and augmentation,” 2022, arXiv:2210.16399. [Google Scholar]
54. J. Ruan, S. Xiang, M. Xie, T. Liu, and Y. Fu, “MALUNet: A multi-attention and light-weight UNet for skin lesion segmentation,” Proc. 2022 IEEE Int. Conf. Bioinform. Biomed. (BIBM), vol. 30, no. 1, pp. 1150–1156, 2022. doi: 10.1109/BIBM55620.2022.9995040. [Google Scholar] [CrossRef]
55. H. Xu and T. H. Hwang, “Automatic skin lesion segmentation using deep fully convolutional networks,” 2018, arXiv:1807.06466. [Google Scholar]
56. D. Popescu, L. I. Dan El-khatib, and L. Ichim, “Skin lesion classification using collective intelligence of multiple neural networks,” Sensors, vol. 22, no. 12, pp. 1–22, 2022. [Google Scholar]
57. T. H. H. Aldhyani, A. Verma, M. H. Al-Adhaileh, and D. Koundal, “Multi-class skin lesion classification using a lightweight dynamic kernel deep-learning-based convolutional neural network,” Diagnostics, vol. 12, no. 9, 2022, Art. no. 2048. doi: 10.3390/diagnostics12092048. [Google Scholar] [PubMed] [CrossRef]
58. V. D. Nguyen, N. D. Bui, and H. K. Do, “Skin lesion classification on imbalanced data using deep learning with soft attention,” Sensors, vol. 22, no. 19, pp. 1–24, 2022. doi: 10.3390/s22197530. [Google Scholar] [PubMed] [CrossRef]
59. X. Wang, X. Jiang, H. Ding, Y. Zhao, and J. Liu, “Knowledge-aware deep framework for collaborative skin lesion segmentation and melanoma recognition,” Pattern Recognit., vol. 120, no. 2, 2021, Art. no. 108075. doi: 10.1016/j.patcog.2021.108075. [Google Scholar] [CrossRef]
60. P. G. Cavalcanti and J. Scharcanski, “Automated prescreening of pigmented skin lesions using standard cameras,” Comput. Med. Imaging Graph., vol. 35, no. 6, pp. 481–491, 2011. doi: 10.1016/j.compmedimag.2011.02.007. [Google Scholar] [PubMed] [CrossRef]
61. R. Amelard, A. Wong, and D. A. Clausi, “Extracting morphological high-level intuitive features (HLIF) for enhancing skin lesion classification,” in Proc. Annu. Int. Conf. IEEE Eng. Med. Biol. Soc. (EMBS), 2012, pp. 4458–4461. doi: 10.1109/EMBC.2012.6346956. [Google Scholar] [PubMed] [CrossRef]
62. P. G. Cavalcanti, J. Scharcanski, L. E. Di Persia, and D. H. Milone, “An ICA-based method for the segmentation of pigmented skin lesions in macroscopic images,” in Proc. Annu. Int. Conf. IEEE Eng. Med. Biol. Soc. (EMBS), 2011, pp. 5993–5996. doi: 10.1109/IEMBS.2011.6091481. [Google Scholar] [PubMed] [CrossRef]
63. R. Amelard, A. Wong, and D. A. Clausi, “Extracting high-level intuitive features (HLIF) for classifying skin lesions using standard camera images,” in 2012 Ninth Conf. Comput. Robot Vis., 2012, pp. 396–403. doi: 10.1109/CRV.2012.59. [Google Scholar] [CrossRef]
64. I. Giotis, N. Molders, S. Land, M. Biehl, M. F. Jonkman and N. Petkov, “MED-NODE: A computer-assisted melanoma diagnosis system using non-dermoscopic images,” Expert. Syst. Appl., vol. 42, no. 19, pp. 6578–6585, 2015. doi: 10.1016/j.eswa.2015.04.034. [Google Scholar] [CrossRef]
65. C. Sagar and L. M. Saini, “Color channel based segmentation of skin lesion from clinical images for the detection of melanoma,” in 1st IEEE Int. Conf. Power Electron. Intell. Control Energy Syst., ICPEICES 2016, 2017, pp. 1–5. doi: 10.1109/ICPEICES.2016.7853624. [Google Scholar] [CrossRef]
66. E. Nasr-Esfahani et al., “Melanoma detection by analysis of clinical images using convolutional neural network,” Proc. Annu. Int. Conf. IEEE Eng. Med. Biol. Soc.(EMBS), vol. 2016, pp. 1373–1376, 2016. doi: 10.1109/EMBC.2016.7590963. [Google Scholar] [PubMed] [CrossRef]
67. M. H. Jafari, S. Samavi, N. Karimi, S. M. R. Soroushmehr, K. Ward and K. Najarian, “Automatic detection of melanoma using broad extraction of features from digital images,” in proc. Annu. Int. Conf. IEEE Eng. Med. Biol. Soc. (EMBS), vol. 2016, pp. 1357–1360, 2016. doi: 10.1109/EMBC.2016.7590959. [Google Scholar] [PubMed] [CrossRef]
68. N. Karimi, K. Najarian, H. Jafari, S. Samavi, S. M. R. Soroushmehr, and H. Mohaghegh, “Set of descriptors for skin cancer diagnosis using non-dermoscopic color images,” in 2016 IEEE Int. Conf. Image Process. (ICIP), Phoenix, AZ, USA, 2016, pp. 2638–2642. doi: 10.1109/ICIP.2016.7532837. [Google Scholar] [CrossRef]
69. R. Amelard, J. Glaister, A. Wong, and D. A. Clausi, “Melanoma decision support using lighting-corrected intuitive feature models,” in Comput. Vis. Tech. Diagnos. Skin Cancer Ser. Bioeng., 2014, pp. 193–219. doi: 10.1007/978-3-642-39608-3_7. [Google Scholar] [CrossRef]
70. J. Glaister, R. Amelard, A. Wong, and D. A. Clausi, “Multistage illumination modeling of dermatological photographs for illumination-corrected skin lesion analysis,” IEEE Trans. Biomed. Eng., vol. 60, no. 7, pp. 1873–1883, 2013. doi: 10.1109/TBME.2013.2244596. [Google Scholar] [PubMed] [CrossRef]
71. J. Glaister, S. Member, A. Wong, D. A. Clausi, and S. Member, “Segmentation of skin lesions from digital images using joint statistical texture distinctiveness,” IEEE Trans. Biomed. Eng., vol. 61, no. 4, pp. 1220–1230, 2014. doi: 10.1109/TBME.2013.2297622. [Google Scholar] [PubMed] [CrossRef]
72. R. Amelard, J. Glaister, A. Wong, and D. A. Clausi, “High-level intuitive features (HLIFs) for intuitive skin lesion description,” IEEE Trans. Biomed. Eng., vol. 62, no. 3, pp. 820–831, 2015. doi: 10.1109/TBME.2014.2365518. [Google Scholar] [PubMed] [CrossRef]
73. A. Kamboj, “A color-based approach for melanoma skin cancer detection,” 2018 First Int. Conf. Secur. Cyber Comput. Commun., vol. 181, pp. 508–513, 2018. doi: 10.1109/ICSCCC.2018.8703309. [Google Scholar] [CrossRef]
74. C. Barata, J. S. Marques, and J. Rozeira, “A system for the detection of pigment network in dermoscopy images using directional filters,” IEEE Trans. Biomed. Eng., vol. 59, no. 10, pp. 2744–2754, 2012. doi: 10.1109/TBME.2012.2209423. [Google Scholar] [PubMed] [CrossRef]
75. M. Ramezani, A. Karimian, and P. Moallem, “Automatic detection of malignant melanoma using macroscopic images,” J. Med. Signals Sens., vol. 4, no. 4, pp. 281–290, 2014. doi: 10.4103/2228-7477.144052. [Google Scholar] [CrossRef]
76. T. Lee, V. Ng, R. Gallagher, A. Coldman, and D. McLean, “Dullrazor®: A software approach to hair removal from images,” Comput. Biol. Med., vol. 27, no. 6, pp. 533–543, 1997. doi: 10.1016/S0010-4825(97)00020-6. [Google Scholar] [PubMed] [CrossRef]
77. P. Sabouri, H. Gholamhosseini, T. Larsson, and J. Collins, “A cascade classifier for diagnosis of melanoma in clinical images,” in 2014 36th Annu. Int. Conf. IEEE Eng. Med. Biol. Soc. (EMBC 2014), vol. 42, pp. 6748–6751, 2014. doi: 10.1109/EMBC.2014.6945177. [Google Scholar] [PubMed] [CrossRef]
78. A. Huang, S. Y. Kwan, W. Y. Chang, M. Y. Liu, M. H. Chi and G. S. Chen, “A robust hair segmentation and removal approach for clinical images of skin lesions,” in Proc. Annu. Int. Conf. IEEE Eng. Med. Biol. Soc. (EMBS), 2013, pp. 3315–3318. doi: 10.1109/EMBC.2013.6610250. [Google Scholar] [PubMed] [CrossRef]
79. R. B. Oliveira, N. Marranghello, A. S. Pereira, and J. M. R. S. Tavares, “A computational approach for detecting pigmented skin lesions in macroscopic images,” Expert. Syst. Appl., vol. 61, pp. 53–63, 2016. doi: 10.1016/j.eswa.2016.05.017. [Google Scholar] [CrossRef]
80. A. M. Martinez and A. C. Kak, “PCA versus LDA,” IEEE Trans. Pattern Anal. Mach. Intell., vol. 23, no. 2, pp. 228–233, 2001. doi: 10.1109/34.908974. [Google Scholar] [CrossRef]
81. A. Shihab, H. Salah, and M. Mocanu, “Detection and diagnosis of skin cancer based on K-means cluster and convolutional neural network,” in Proc. 2021 23rd Int. Conf. Control Syst. Comput. Sci. Technol., CSCS 2021, 2021, 143–150. doi: 10.1109/CSCS52396.2021.00031. [Google Scholar] [CrossRef]
82. M. Q. Khan et al., “Classification of melanoma and nevus in digital images for diagnosis of skin cancer,” IEEE Access, vol. 7, pp. 90132–90144, 2019. doi: 10.1109/ACCESS.2019.2926837. [Google Scholar] [CrossRef]
83. M. H. Jafari, E. N. Nader, S. M. R. Soroushmehr, S. Samavi, and K. Najarian, “Extraction of skin lesions from non-dermoscopic images for surgical excision of melanoma,” Int. J. CARS, vol. 12, no. 6, pp. 1021–1030, 2017. doi: 10.1007/s11548-017-1567-8. [Google Scholar] [PubMed] [CrossRef]
84. K. He, J. Sun, and X. Tang, “Guided image filtering,” IEEE Trans. Pattern Anal. Mach. Intell., vol. 35, no. 6, pp. 1397–1409, 2013. doi: 10.1109/TPAMI.2012.213. [Google Scholar] [PubMed] [CrossRef]
85. Y. Fujisawa et al., “Deep-learning-based, computer-aided classifier developed with a small dataset of clinical images surpasses board-certified dermatologists in skin tumour diagnosis,” Br. J. Dermatol., vol. 180, no. 2, pp. 373–381, 2019. doi: 10.1111/bjd.16924. [Google Scholar] [PubMed] [CrossRef]
86. A. G. C. Pacheco and R. A. Krohling, “An attention-based mechanism to combine images and metadata in deep learning models applied to skin cancer classification,” IEEE J. Biomed. Heal. Informatics., vol. 25, no. 9, pp. 3554–3563, 2021. doi: 10.1109/JBHI.2021.3062002. [Google Scholar] [PubMed] [CrossRef]
87. B. Krohling, P. B. C. Castro, A. G. C. Pacheco, and R. A. Krohling, “A smartphone based application for skin cancer classification using deep learning with clinical images and lesion information,” 2021, arXiv:2104.14353. [Google Scholar]
88. S. Mukherjee, A. Adhikari, and M. Roy, “Malignant melanoma classification using cross-platform dataset with deep learning CNN architecture,” in Recent Trends in Signal and Image Processing. Singapore: Springer, 2019, pp. 31–41. doi: 10.1007/978-981-13-6783-0_4. [Google Scholar] [CrossRef]
89. B. A. Albert, “Deep learning from limited training data: Novel segmentation and ensemble algorithms applied to automatic melanoma diagnosis,” IEEE Access, vol. 8, pp. 31254–31269, 2020. doi: 10.1109/ACCESS.2020.2973188. [Google Scholar] [CrossRef]
90. A. R. Jadhav, A. G. Ghontale, and V. K. Shrivastava, “Segmentation and border detection of melanoma lesions using convolutional neural network and SVM,” Springer Singapore, vol. 798, 2019. doi: 10.1007/978-981-13-1132-1. [Google Scholar] [CrossRef]
91. A. G. C. Pacheco and R. A. Krohling, “The impact of patient clinical information on automated skin cancer detection,” Comput. Biol. Med., vol. 116, no. 1, 2020, Art. no. 103545. doi: 10.1016/j.compbiomed.2019.103545. [Google Scholar] [PubMed] [CrossRef]
92. N. -M. C. V. Pomponiu and H. Nejati, “Deepmole: Deep neural networks for skin mole lesion classification,” in 2016 IEEE Int. Conf. Image Process. (ICIP), Phoenix, AZ, USA, 2016, pp. 2623–2627. [Google Scholar]
93. X. Chen, R. Mottaghi, X. Liu, S. Fidler, R. Urtasun and A. Yuille, DermoCC-GAN: A New Approach forStandardizing Dermatological Images Using Generative Adversarial Networks. USA: The Center for Brains, Minds & Machines, 2014, vol. 225, pp. 1979–1986. [Google Scholar]
94. V. Venugopal, M. K. Nath, J. Joseph, and M. V. Das, “A deep learning-based illumination transform for devignetting photographs of dermatological lesions,” Image Vis. Comput., vol. 142, no. 1, 2024, Art. no. 104909. doi: 10.1016/j.imavis.2024.104909. [Google Scholar] [CrossRef]
95. L. S. Shapiro, Computer Vision, Hoboken, NJ, USA: Prentice Hall, 2001, vol. 9. [Google Scholar]
96. N. Otsu et al., “Otsu 1979 Otsu method,” IEEE Trans. Syst. Man. Cybern., vol. C, no. 1, pp. 62–66, 1979. [Google Scholar]
97. S. Mukherjee, A. Adhikari, and M. Roy, “Malignant melanoma detection using multi layer perceptron with optimized network parameter selection by PSO,” in Contemporary Advances in Innovative and Applicable Information Technology Conference paper. Singapore: Springer, 2019, pp. 101–109. doi: 10.1007/978-981-13-1540-4_11. [Google Scholar] [CrossRef]
98. T. Tabassum, K. Munia, N. Alam, J. Neubert, R. Fazel-rezai and S. Member, “Automatic diagnosis of melanoma using linear and nonlinear features from digital image,” IEEE J. Biomed. Heal. Informat., vol. 17, pp. 4281–4284, 2017. [Google Scholar]
99. T. F. Chan, B. Yezrielev Sandberg, and L. A. Vese, “Active contours without edges for vector-valued images,” J. Vis. Commun. Image Represent., vol. 11, no. 2, pp. 130–141, 2000. doi: 10.1006/jvci.1999.0442. [Google Scholar] [CrossRef]
100. A. Hyvarinen, “Family of fixed-point algorithms for independent component analysis,” in 1997 IEEE Int. Conf. Acoust. Speech Signal Process., Munich, Germany, 1997, pp. 3917–3920. doi: 10.1109/ICASSP.1997.604766. [Google Scholar] [CrossRef]
101. T. T. Do et al., “Accessible melanoma detection using smartphones and mobile image analysis,” IEEE Trans. Multimed., vol. 20, no. 10, pp. 2849–2864, 2018. doi: 10.1109/TMM.2018.2814346. [Google Scholar] [CrossRef]
102. P. Sabouri and H. Gholamhosseini, “Lesion border detection using deep learning,” in 2016 IEEE Congr. Evol. Comput. CEC 2016, 2016, pp. 1416–1421. doi: 10.1109/CEC.2016.7743955. [Google Scholar] [CrossRef]
103. A. Udrea and G. D. Mitra, “Generative adversarial neural networks for pigmented and non-pigmented skin lesions detection in clinical images,” in Proc. 2017 21st Int. Conf. Control Syst. Comput. CSCS 2017, 2017, pp. 364–368. doi: 10.1109/CSCS.2017.56. [Google Scholar] [CrossRef]
104. R. L. Ara and R. D. A. L. Rab^, “Automatic segmentation of melanoma skin cancer using deep learning,” in 2020 IEEE Int. Conf. E-health Netw., App. Serv. (HEALTHCOM) Groups, 2021, pp. 1–6. [Google Scholar]
105. O. Ronneberger, P. Fischer, and T. Brox, “U-Net: Convolutional networks for biomedical image segmentation,” in Medical Image Computing and Computer-Assisted Intervention-MICCAI, vol. 2015, vol. 9351, pp. 234–241. [Google Scholar]
106. S. S. Devi, N. H. Singh, and R. H. Laskar, “Fuzzy c-means clustering with histogram based cluster selection for skin lesion segmentation using non-dermoscopic images,” Int. J. Interact. Multimed. Artif. Intell., vol. 6, no. 1, pp. 26–31, 2020. doi: 10.9781/ijimai.2020.01.001. [Google Scholar] [CrossRef]
107. G. Friedland, K. Jantz, and R. Rojas, “SIOX: Simple interactive object extraction in still images,” in Proc.-Seventh IEEE Int. Symp. Multimedia, ISM 2005, 2005, vol. 2005, pp. 253–259. doi: 10.1109/ISM.2005.106. [Google Scholar] [CrossRef]
108. R. Moussa, F. Gerges, C. Salem, R. Akiki, O. Falou and D. Azar, “Computer-aided detection of Melanoma using geometric features,” in 2016 3rd Middle East Conf. Biomed. Eng. (MECBME), Beirut, Lebanon, 2016, pp. 125–128. doi: 10.1109/MECBME.2016.7745423. [Google Scholar] [CrossRef]
109. V. Venugopal, J. Joseph, M. V. Das, and M. K. Nath, “DTP-Net: A convolutional neural network model to predict threshold for localizing the lesions on dermatological macro-images,” Comput. Biol. Med., vol. 148, no. 3, 2022, Art. no. 105852. doi: 10.1016/j.compbiomed.2022.105852. [Google Scholar] [PubMed] [CrossRef]
110. H. M. Shaw, D. S. Rigel, R. J. Friedman, W. H. Mccarthy, and A. W. Kopf, “Early diagnosis of cutaneous melanoma,” JAMA, vol. 292, no. 22, pp. 2771–2776, 2015. doi: 10.1001/jama.292.22.2771. [Google Scholar] [PubMed] [CrossRef]
111. M. E. Celebi et al., “A methodological approach to the classification of dermoscopy images,” Comput. Med. Imaging Graph., vol. 31, no. 6, pp. 362–373, 2007. doi: 10.1016/j.compmedimag.2007.01.003. [Google Scholar] [PubMed] [CrossRef]
112. R. C. Gonzalez and R. E. Woods, Digital Image Processing. India: Pearson, 2018. [Google Scholar]
113. A. G. Manousaki et al., “A simple digital image processing system to aid in melanoma diagnosis in an everyday melanocytic skin lesion unit. A preliminary report,” Int. J. Dermatol., vol. 45, no. 4, pp. 402–410, 2006. doi: 10.1111/j.1365-4632.2006.02726.x. [Google Scholar] [PubMed] [CrossRef]
114. A. Kjoelen, M. J. Thompson, S. E. Umbaugh, R. H. Moss, and W. V. Stoecker, “Performance of Al methods in detecting melanoma,” IEEE Eng. Med. Biol. Mag., vol. 14, no. 4, pp. 411–416, 1995. doi: 10.1109/51.395323. [Google Scholar] [CrossRef]
115. A. Parolin, E. Herzer, and C. R. Jung, “Semi-automated diagnosis of melanoma through the analysis of dermatological images,” in 2010 23rd SIBGRAPI Conf. Graph. Patterns Images, 2010, 71–78. doi: 10.1109/SIBGRAPI.2010.18. [Google Scholar] [CrossRef]
116. J. H. Christensen, M. B. T. Soerensen, Z. Linghui, S. Chen, and M. O. Jensen, “Pre-diagnostic digital imaging prediction model to discriminate between malignant melanoma and benign pigmented skin lesion,” Ski. Res. Technol., vol. 16, no. 1, pp. 98–108, 2010. doi: 10.1111/j.1600-0846.2009.00408.x. [Google Scholar] [PubMed] [CrossRef]
117. Y. Chang, R. J. Stanley, R. H. Moss, and W. Van Stoecker, “A systematic heuristic approach for feature selection for melanoma discrimination using clinical images,” Ski Res. Technol., vol. 11, no. 3, pp. 165–178, 2005. doi: 10.1111/j.1600-0846.2005.00116.x. [Google Scholar] [PubMed] [CrossRef]
118. E. Claridge, P. N. Hall, M. Keefe’, and J. P. Allen, “Shape analysis for classification melanoma,” J. Biomed. Eng. 1992, vol. 14, no. 3, pp. 229–234, 1992. doi: 10.1016/0141-5425(92)90057-R. [Google Scholar] [PubMed] [CrossRef]
119. J. Fernandez Alcón et al., “Automatic imaging system with decision support for inspection of pigmented skin lesions and melanoma diagnosis,” IEEE J. Sel. Top. Signal Process, vol. 3, no. 1, pp. 14–25, 2009. doi: 10.1109/JSTSP.2008.2011156. [Google Scholar] [CrossRef]
120. S. K. Haralick RM, “Textural features for image classification,” IEEE Trans. Syst., Man, Cybernet., vol. 3, pp. 610–621, 1973. [Google Scholar]
121. D. A. Clausi, “An analysis of co-occurrence texture statistics as a function of grey level quantization,” Can J. Remote Sens., vol. 28, no. 1, pp. 45–62, 2002. doi: 10.5589/m02-004. [Google Scholar] [PubMed] [CrossRef]
122. C. Marín, G. H. Alférez, J. Córdova, and V. González, “Detection of melanoma through image recognition and artificial neural networks,” in World Cong. Med. Phys. Biomed. Eng., Toronto, Canada, 2015, pp. 832–835. doi: 10.1007/978-3-319-19387-8. [Google Scholar] [CrossRef]
123. X. Tang, “Texture information in run-length matrices,” IEEE Trans. Image Process, vol. 7, no. 11, pp. 1602–1609, 1998. doi: 10.1109/83.725367. [Google Scholar] [PubMed] [CrossRef]
124. Z. Guo, L. Zhang, and D. Zhang, “A completed modeling of local binary pattern operator for texture classification,” IEEE Trans. Image Process, vol. 19, no. 6, pp. 1657–1663, 2010. doi: 10.1109/TIP.2010.2044957. [Google Scholar] [PubMed] [CrossRef]
125. I. Giotis, K. Bunte, N. Petkov, and M. Biehl, “Adaptive matrices and filters for color texture classification,” J. Math. Imaging Vis., vol. 47, no. 1–2, pp. 79–92, 2013. doi: 10.1007/s10851-012-0356-9. [Google Scholar] [CrossRef]
126. D. G. Lowe, “Object recognition from local scale-invariant features,” Seventh IEEE Int. Conf. Comput. Vis., Kerkyra, Greece, vol. 2, no. 4, pp. 1150–1157, 1999. doi: 10.1016/0262-5075(81)90042-7. [Google Scholar] [CrossRef]
127. L. M. De Lima and R. A. Krohling, “Exploring advances in transformers and CNN for skin lesion diagnosis on small datasets,” Intell. Syst. Springer Int. Publ. Berlin/Heidelberg, Ger., vol. 13654, pp. 282–296, 2022. [Google Scholar]
128. J. Yang et al., “Self-paced balance learning for clinical skin disease recognition,” IEEE Trans. Neural Netw. Learn. Syst., vol. 31, no. 8, pp. 2832–2846, 2020. doi: 10.1109/TNNLS.2019.2917524. [Google Scholar] [PubMed] [CrossRef]
129. J. Deng, W. Dong, R. Socher, L. Li, K. Li and L. Fei-Fei, “ImageNet: A large-scale hierarchical image database,” in IEEE Comput. Soc. Conf. Comput. Vis. Pattern Recognit., 2009, pp. 248–255. [Google Scholar]
130. S. R. Christian Szegedy, W. Liu, Y. Jia, and P. Sermanet, “Going deeper with convolutions,” in Proc. IEEE Conf. Comput. Vis. Pattern Recognit., 2015, pp. 1–9. doi: 10.4324/9781410605337-29. [Google Scholar] [CrossRef]
131. K. He, X. Zhang, S. Ren, and J. Sun, “Deep residual learning for image recognition,” in Proc. IEEE Comput. Soc. Conf. Comput. Vis. Pattern Recognit., vol. 2016, pp. 770–778, 2016. doi: 10.1109/CVPR.2016.90. [Google Scholar] [CrossRef]
132. S. S. Han, M. S. Kim, W. Lim, G. H. Park, and I. Park, “Classification of the clinical images for benign and malignant cutaneous tumors using a deep learning algorithm,” J. Invest. Dermatol., vol. 138, no. 7, pp. 1529–1538, 2018. doi: 10.1016/j.jid.2018.01.028. [Google Scholar] [PubMed] [CrossRef]
133. S. S. Han, I. Park, S. E. Chang, W. Lim, and M. S. Kim, “Augmented intelligence dermatology: deep neural networks empower medical professionals in diagnosing skin cancer and predicting treatment options for 134 skin disorders,” J. Invest. Dermatol., vol. 140, no. 9, pp. 1753–1761, 2020. doi: 10.1016/j.jid.2020.01.019. [Google Scholar] [PubMed] [CrossRef]
134. G. Di Leo, A. Paolillo, P. Sommella, G. Fabbrocini, and O. Rescigno, “A software tool for the diagnosis of melanomas,” in 2010 IEEE Instrument. Measurem. Technol. Conf. Proc., 2010, pp. 886–891. doi: 10.1109/imtc.2010.5488165. [Google Scholar] [CrossRef]
135. A. I. Gola, B. G. Zapirain, A. M. Zorrilla, and I. R. Oleagordia, “Automated diagnosis of melanomas based on globular and reticular pattern recognition algorithms for epiluminiscence images,” in Eur. Signal Process. Conf., 2010, pp. 264–268. [Google Scholar]
136. J. Jaworek-Korjakowska, “Automatic detection of melanomas: An application based on the ABCD criteria,” in Information Technologies in Biomedicine. Berlin, Heidelberg: Springer, 2012, pp. 67–76. doi: 10.1007/978-3-642-31196-3_7. [Google Scholar] [CrossRef]
137. R. P. Braun, H. S. Rabinovitz, M. Oliviero, A. W. Kopf, and J. H. Saurat, “Dermoscopy of pigmented skin lesions,” J. Am. Acad. Dermatol., vol. 52, no. 1, pp. 109–121, 2005. doi: 10.1016/j.jaad.2001.11.001. [Google Scholar] [PubMed] [CrossRef]
138. I. Maglogiannis, S. Pavlopoulos, and D. Koutsouris, “An integrated computer supported acquisition, handling, and characterization system for pigmented skin lesions in dermatological images,” IEEE Trans. Inf. Technol. Biomed., vol. 9, no. 1, pp. 86–98, 2005. doi: 10.1109/TITB.2004.837859. [Google Scholar] [PubMed] [CrossRef]
139. H. Iyatomi et al., “An improved Internet-based melanoma screening system with dermatologist-like tumor area extraction algorithm,” Comput. Med. Imaging Graph., vol. 32, no. 7, pp. 566–579, 2008. doi: 10.1016/j.compmedimag.2008.06.005. [Google Scholar] [PubMed] [CrossRef]
140. P. P. Tumpa and A. Kabir, “An artificial neural network based detection and classification of melanoma skin cancer using hybrid texture features,” Sens. Int., vol. 2, no. 1, 2021, Art. no. 100128. doi: 10.1016/j.sintl.2021.100128. [Google Scholar] [CrossRef]
141. A. R. F. Santos, K. R. T. Aires, and R. M. S. Veras, “Aspects of lighting and color in classifying malignant skin cancer with deep learning,” Appl. Sci., vol. 14, no. 8, 2024, Art. no. 3297. doi: 10.3390/app14083297. [Google Scholar] [CrossRef]
142. L. Rey-Barroso, S. Peña-Gutiérrez, C. Yáñez, F. J. Burgos-Fernández, M. Vilaseca and S. Royo, “Optical technologies for the improvement of skin cancer diagnosis: A review,” Sensors, vol. 21, no. 1, pp. 1–31, 2021. doi: 10.3390/s21010252. [Google Scholar] [PubMed] [CrossRef]
143. S. Naji, H. A. Jalab, and S. A. Kareem, “A survey on skin detection in colored images,” Artif. Intell. Rev., vol. 52, no. 2, pp. 1041–1087, 2019. doi: 10.1007/s10462-018-9664-9. [Google Scholar] [CrossRef]
144. S. Hao et al., “Salp swarm algorithm with iterative mapping and local escaping for multi-level threshold image segmentation: A skin cancer dermoscopic case study,” J. Comput. Des. Eng., vol. 10, no. 2, pp. 655–693, 2023. doi: 10.1093/jcde/qwad006. [Google Scholar] [CrossRef]
145. Y. Olmez, G. O. Koca, A. Sengur, U. R. Acharya, and H. Mir, “Improved PSO with visit table and multiple direction search strategies for skin cancer image segmentation,” IEEE Access, vol. 12, no. 1, pp. 840–867, 2024. doi: 10.1109/ACCESS.2023.3347587. [Google Scholar] [CrossRef]
146. S. Cho, R. Haralick, and S. Yi, “Improvement of kittler and illingworth’s minimum error thresholding,” Pattern Recognit., vol. 22, no. 5, pp. 609–617, 1989. doi: 10.1016/0031-3203(89)90029-0. [Google Scholar] [CrossRef]
147. J. N. Kapur, P. K. Sahoo, and A. K. C. Wong, “A new method for gray-level picture thresholding using the entropy of the histogram,” Comput. Vision, Graph. Image Process, vol. 29, no. 3, pp. 273–285, 1985. doi: 10.1016/0734-189X(85)90125-2. [Google Scholar] [CrossRef]
148. S. H. Kwon, “Threshold selection based on cluster analysis,” Pattern Recognit. Lett., vol. 25, no. 9, pp. 1045–1050, 2004. doi: 10.1016/j.patrec.2004.03.001. [Google Scholar] [CrossRef]
149. D. Liu, Z. Jiang, and H. Feng, “A novel fuzzy classification entropy approach to image thresholding,” Pattern Recognit. Lett., vol. 27, no. 16, pp. 1968–1975, 2006. doi: 10.1016/j.patrec.2006.05.006. [Google Scholar] [CrossRef]
150. K. P. Baby Resma, M. S. Nair, “Multilevel thresholding for image segmentation using Krill Herd Optimization algorithm,” J. King Saud Univ.-Comput. Inf. Sci., vol. 33, no. 5, pp. 528–541, 2021. doi: 10.1016/j.jksuci.2018.04.007. [Google Scholar] [CrossRef]
151. Q. Huang, W. Gao, and W. Cai, “Thresholding technique with adaptive window selection for uneven lighting image,” Pattern Recognit. Lett., vol. 26, no. 6, pp. 801–808, 2005. doi: 10.1016/j.patrec.2004.09.035. [Google Scholar] [CrossRef]
152. H. S. N. Alwerfali et al., “A multilevel image thresholding based on hybrid salp swarm algorithm and fuzzy entropy,” IEEE Access, vol. 7, pp. 181405–181422, 2019. doi: 10.1109/ACCESS.2019.2959325. [Google Scholar] [CrossRef]
153. A. Niaz, E. Iqbal, A. A. Memon, A. Munir, J. Kim and K. N. Choi, “Edge-based local and global energy active contour model driven by signed pressure force for image segmentation,” IEEE Trans. Instrum. Meas., vol. 72, pp. 1–14, 2023. doi: 10.1109/TIM.2023.3317481. [Google Scholar] [CrossRef]
154. Y. Chen, P. Ge, G. Wang, G. Weng, and H. Chen, “An overview of intelligent image segmentation using active contour models,” Intell. Robot., vol. 3, no. 1, pp. 23–55, 2023. doi: 10.20517/ir.2023.02. [Google Scholar] [CrossRef]
155. Y. Yuan and C. He, “Adaptive active contours without edges,” Math. Comput. Model., vol. 55, no. 5–6, pp. 1705–1721, 2012. doi: 10.1016/j.mcm.2011.11.014. [Google Scholar] [CrossRef]
156. T. Mendonca, P. M. Ferreira, J. Marques, A. Marcal, and J. Rozeira, “PH2—A dermoscopic image database for research and benchmarking,” in 2013 35th Annu. Int. Conf. IEEE Eng. Med. Biol. Soc. (EMBC), Osaka, Japan, 1967, pp. 5437–5440. doi: 10.1109/EMBC.2013.6610779. [Google Scholar] [PubMed] [CrossRef]
Cite This Article
 Copyright © 2024 The Author(s). Published by Tech Science Press.
This work is licensed under a Creative Commons Attribution 4.0 International License , which permits unrestricted use, distribution, and reproduction in any medium, provided the original work is properly cited.
 Downloads
 Citation Tools