
 Submit a Paper
 Propose a Special lssue
 Open Access
ARTICLE

Fake News Detection on Social Media Using Ensemble Methods
1 Department of Computer Science, COMSATS University, Islamabad, 45550, Pakistan
2 School of Computer Science and Engineering, Kyungpook National University, Daegu, 41566, Republic of Korea
3 Department of Computer Science and Engineering, Korea University, Seoul, 02841, Republic of Korea
4 Department of Electronic Engineering, Yeungnam University, Gyeongsan-si, 38541, Republic of Korea
5 Department of Computer Science, College of Computer Science and Information Technology, Imam Abdulrahman Bin Faisal University, Dammam, 34223, Saudi Arabia
* Corresponding Authors: Dongsun Kim. Email: ; Muhammad Tahir Naseem. Email:
(This article belongs to the Special Issue: Recent Advances in Ensemble Framework of Meta-heuristics and Machine Learning: Methods and Applications)
Computers, Materials & Continua 2024, 81(3), 4525-4549. https://doi.org/10.32604/cmc.2024.056291
Received 19 July 2024; Accepted 25 October 2024; Issue published 19 December 2024
 View Full Text
 Download PDF
Abstract
In an era dominated by information dissemination through various channels like newspapers, social media, radio, and television, the surge in content production, especially on social platforms, has amplified the challenge of distinguishing between truthful and deceptive information. Fake news, a prevalent issue, particularly on social media, complicates the assessment of news credibility. The pervasive spread of fake news not only misleads the public but also erodes trust in legitimate news sources, creating confusion and polarizing opinions. As the volume of information grows, individuals increasingly struggle to discern credible content from false narratives, leading to widespread misinformation and potentially harmful consequences. Despite numerous methodologies proposed for fake news detection, including knowledge-based, language-based, and machine-learning approaches, their efficacy often diminishes when confronted with high-dimensional datasets and data riddled with noise or inconsistencies. Our study addresses this challenge by evaluating the synergistic benefits of combining feature extraction and feature selection techniques in fake news detection. We employ multiple feature extraction methods, including Count Vectorizer, Bag of Words, Global Vectors for Word Representation (GloVe), Word to Vector (Word2Vec), and Term Frequency-Inverse Document Frequency (TF-IDF), alongside feature selection techniques such as Information Gain, Chi-Square, Principal Component Analysis (PCA), and Document Frequency. This comprehensive approach enhances the model’s ability to identify and analyze relevant features, leading to more accurate and effective fake news detection. Our findings highlight the importance of a multi-faceted approach, offering a significant improvement in model accuracy and reliability. Moreover, the study emphasizes the adaptability of the proposed ensemble model across diverse datasets, reinforcing its potential for broader application in real-world scenarios. We introduce a pioneering ensemble technique that leverages both machine-learning and deep-learning classifiers. To identify the optimal ensemble configuration, we systematically tested various combinations. Experimental evaluations conducted on three diverse datasets related to fake news demonstrate the exceptional performance of our proposed ensemble model. Achieving remarkable accuracy levels of 97%, 99%, and 98% on Dataset 1, Dataset 2, and Dataset 3, respectively, our approach showcases robustness and effectiveness in discerning fake news amidst the complexities of contemporary information landscapes. This research contributes to the advancement of fake news detection methodologies and underscores the significance of integrating feature extraction and feature selection strategies for enhanced performance, especially in the context of intricate, high-dimensional datasets.Keywords
The internet has become a primary source of news and information, especially through social media platforms and news websites. Platforms like Facebook and Twitter offer a quick and convenient way to stay updated on any topic of interest. They are among the top sources of information and news [1]. People use social media for various purposes, such as entertainment, political updates, learning about diverse topics, health tips, online shopping, weather forecasts, trending news, and more. These characteristics make these platforms an alternative to search engines [1]. Many find searching for information on these platforms more convenient than using search engines [2]. However, the authenticity of news on these platforms remains questionable, as individuals, groups, or even organizations may spread fake news to gain popularity, attract viewers to their pages, or discredit competitors. Likewise, individuals can spread fake news for biased opinions, to mislead others, or for monetary gain [3,4]. The 2016 U.S. election is prominent example of the manipulation of information through fake news [5]. Despite the advantages of social media, the quality of news on these platforms is generally lower than that of traditional news organizations. However, since it is cheaper and faster to provide news online and much easier to disseminate via social media, large volumes of fake news articles with intentionally false information are produced for purposes, such as financial and political gain. It was estimated that by the end of the 2016 presidential election, over 1 million tweets were related to the fake news “story Pizzagate”. Given the rise of this phenomenon, “Fake news” was named the Macquarie Dictionary’s word of the year in 2016. Fake news can influence people’s perceptions, leading them to think or act in ways that may be misguided.
The spread of false information, such as fake news, can have far-reaching effects, impacting stock prices, consumer behavior, and investment decisions. Fake news is often designed to influence public opinion and deceive readers, causing confusion and diverting attention from accurate information [6]. Detecting fake news is challenging, as it requires critical thinking. While fact-checking websites can help counter misinformation, they can be time-consuming and may require specialized knowledge, making it difficult to assess the accuracy of such content.
There is increasing evidence that consumers have reacted absurdly to news that later proved to be fake [7,8]. One recent case is the spread of novel corona virus, where fake reports spread over the Internet about the origin, nature, and behavior of the virus [9]. The situation worsened as more people read about the fake contents online. Identifying such news online is a daunting task. Fortunately, there are a number of computational techniques that can be used to mark certain articles as fake on the basis of their textual content. Fake news detection methods primarily focus on Natural Language Processing (NLP). NLP is a branch of Artificial Intelligence that is essential in various areas, such as linguistic analysis, text pre-processing, information extraction, speech recognition, robotics, sentence analysis, and artificial intelligence [10]. It can identify false news from various online sources. Researchers have proposed different methods to address the challenge of identifying fake news. These approaches use machine learning and deep learning techniques to distinguish between authentic and false information. Some methods use feature extraction to classify news as real or fake, but the classification performance depends on the dataset size and quality contain short and limited messages, making it difficult to extract features. Additionally, the classification of fake news that is not text-based, such as images with a description, also poses a problem [11,12].
Previous studies in fake news detection have encountered several significant research gaps. Many methods struggle with high-dimensional datasets, where performance often deteriorates due to the complexity and volume of the data. Additionally, handling noisy and inconsistent data remains a persistent challenge, affecting the accuracy and reliability of detection systems. Traditional approaches typically rely on a limited range of feature extraction techniques, failing to capture the diverse aspects of news content fully. Feature selection methods also vary in effectiveness, and many existing models do not fully utilize the available data to refine feature relevance. Moreover, model adaptability across different datasets is a concern, as many models perform well on specific datasets but struggle on others. The integration of multiple feature extraction and selection techniques is not always explored in depth, leaving a gap in understanding the synergistic benefits of combining these methods. Finally, there is often a discrepancy between theoretical performance and practical application, with many models lacking real-world applicability. This research aims to enhance the previous work of Adiba et al. [11]. Using an ensemble classifier combining Support Vector Machine (SVM) and Random Forest for fake news detection. The study uses the Natural Language Processing Toolkit (NLTK) for text pre-processing, for example removing stop words, punctuation, and stemming. The research focuses on enhancing the proposed approach’s accuracy through feature extraction and feature selection techniques. The study implemented feature extraction techniques such as Count Vectorizer, Word2Vec, and TF-IDF to extract relevant features from the data. Feature selection methods like Information Gain and Chi-Square were utilized to enhance the accuracy. Different models were tested, including Decision Tree, Naive Bayes, Random Forest, Convolutional Neural Network, and additional models. The study compares these models to determine the optimal combination of methods for the best results.
The contributions of the paper are as follows:
• We propose machine learning and deep learning-based ensemble classifiers for accurately detecting fake news.
• We employ feature selection and extraction techniques to reduce the high dimensionality of data.
• Extensive experimentation is performed on three different datasets, and the model is evaluated through comparison with the state-of-the-art studies.
The paper is organized as follows: Related works are summarized in Section 2. Section 3 outlines the fundamental concepts of the proposed ensemble methodology, while the proposed approach is presented in Section 4. The experimental results are analyzed in Section 5, and finally, the paper concludes in Section 6.
In this section, we discuss various techniques proposed by researchers for detecting fake news across multiple forms of data. Communication plays a crucial role in informing people about events and developments, both locally and globally. With the rise of digital platforms like social media and web search engines, accessing news has become much easier and more convenient. While the prevalence of technology and the internet has facilitated the spread of information, it has also led to an increase in fake news. False information can easily be disseminated, misleading the public and being used for malicious purposes to deceive others. This has become a major concern, as it can harm individuals and society as a whole. To address these issues, researchers have presented several methodologies and techniques. A study conducted by Granik et al. [12] introduced a method for identifying fake news using the Naive Bayes technique. This method was put into practice through the creation of a software system and evaluated using a collection of news posts from Facebook. The detection of fake news is performed using a combination of two techniques: (i) The first technique is term frequency-inverse document frequency (TF-IDF) of bi-grams, which analyzes the frequency of word combinations in a given document. (ii) The second technique is probabilistic context-free grammar (PCFG) detection, which identifies patterns in language to determine if a piece of text is likely to be fake. These two techniques work together to provide a comprehensive solution for detecting fake news. Different models were employed in the analysis including stochastic gradient descent and gradient boosting. Using TF-IDF of bi-grams in conjunction with a stochastic gradient descent model resulted in an accuracy rate of 77.2% in identifying fake news [13].
Adiba et al. [11] introduced a model that relied on feature extraction techniques to detect fake news. The features extracted through this process were then utilized in the identification of false news. The authors in [14] employed multiple feature extraction techniques to extract relevant features for the detection of fake news. However, simply utilizing feature extraction alone was not sufficient to produce effective results. Therefore, their approach combined feature extraction with feature selection to better identify fake news. Chen et al. [15] proposed a deep attention model that utilized a recurrent neural network (RNN). The model aimed to identify rumors by analyzing the unique features and changing contexts of posts over time. However, the results indicated that the model did not provide effective performance. Kaur et al. [16] developed a technique that leverages three feature extraction methods to detect fake news. The features extracted through these techniques are then input into machine learning classifiers for the identification of false news.
In their work, Kaliyar et al. [17] explored various machine learning and deep learning methods to detect fake news using the Convolutional Neural Network classifier. The features were extracted using the term frequency (TF) and term frequency-inverse document frequency (TF-IDF) techniques. However, the approach only relied on feature extraction, which could limit its accuracy. The Hierarchical Discourse Level Structure for Fake News Detection (HDSF) model [18] was introduced to detect fake news by considering the structural properties related to the topic, providing a better understanding of false news. Singh et al. [19] proposed a text analysis method for fake news detection that utilized the LWIC package to identify linguistic features in different articles, followed by a support vector machine classifier to determine the truthfulness of the news.
According to a study by Jain et al. [20], a model was introduced for classifying news as real or fake. The model consisted of two variations, where the first variation utilized the news title as the source for constructing the vocabulary and using the count vectorizer. On the other hand, the second variation used the news text as the source. Both models were implemented to classify the news as real or fake. Both models employed a Naive Bayes classifier for classification. The second model performed well whether or not N-gram was used. However, this approach did not include any feature extraction or selection techniques which could enhance its performance. In [21], the authors introduced a deep learning architecture to identify fake news. Jain et al. [20] used feature extraction techniques such as GloVe, Word2Vec, and TF-IDF in combination with a deep neural network to predict the relationship between the headlines and the body of an article. Lakshmanarao et al. [22] proposed a machine learning-based approach for classifying news articles in a separate study. They constructed four models using a Random Forest, Support Vector Machine (SVM), K-Nearest Neighbor (KNN), and Decision Tree. The authors evaluated the performance of each model and found that the Random Forest model had the highest accuracy, while the SVM model had the lowest accuracy.
The authors in study [6] utilized an ensemble machine learning model that was able to achieve optimal accuracy through adjustments in hyperparameters and the selective use of features. Similarly, the authors in [23] created a fake news detection system referred to as the Fake Detector. They framed the task of detecting fake news as a credit score prediction problem, and their proposed model aimed to learn and predict this score through the use of both latent and explicit features. Oshikawa et al. [24] recognized the existing efforts in fake news detection that utilized various techniques and proposed the use of the Rhetorical Structure Theory (RST) for identifying fake news based on its coherence and structure.
Aldwairi et al. [25] presented a logistic regression model to detect fake posts. Their tool was designed to identify fake news based on certain characteristics, including the syntactical structure, which was analyzed to determine the presence of words with misleading effects. The excessive use of punctuation and exclamation marks were also recognized as red flags for fake news, and it was noted that the sentiment analysis (SA) feature significantly impacted fake news detection. Stahl [26] used a combination of Linguistic Cue and Network Analysis to detect false information in news. The study employed three methods, namely Naive Bayes Classifier, Support Vector Machines (SVM), and Semantic Analysis, to identify false news on social media. These methods were used in conjunction to provide a comprehensive solution for detecting false information in news. da Silva et al. [27] put forth machine learning classifiers and techniques for identifying fake news. Their approach relied on a neural network that combined a classical classification algorithm with a primary focus on linguistic analysis as the main feature and prediction mechanism. Additionally, sentiment analysis was utilized to extract content-based features, such as whether a word belonged to a lexicon sentiment or was the result of a machine learning-based sentiment analysis. Girgis et al. [28] presented a classifier for predicting fake news using Recurrent Neural Network (RNN) techniques, such as vanilla RNN, GRU (Gated Recurrent Unit), and LSTMs (Long Short-Term Memories). The study utilized the LIAR dataset, which consists of 12,836 short statements that have been labeled with factors such as truthfulness, subject, context, venue, speaker, state, party, and prior history. The results of this study showed that the RNN-based classifier was effective in predicting fake news.
The authors proposed [29] a CNN model with margin loss and dynamic embeddings for fake news detection, achieving 7.9% and 2.1% improvement over state-of-the-art on ISOT and LIAR datasets, respectively. However, its effectiveness may be limited by the quality and size of the training data, impacting generalization. Kaliyar et al. [30] proposed EchoFakeD, a deep learning model combined with coupled matrix-tensor factorization to integrate news content and social context for fake news detection, achieving 92.30% accuracy on BuzzFeed and PolitiFact datasets. However, its complexity may lead to overfitting, potentially affecting generalizability. Wotaifi et al. [31] proposed a Hybrid Deep Neural Network combining Text-CNN and LSTM for Arabic fake news detection, achieving 0.914 accuracy, surpassing individual models and previous approaches on the AraNews dataset. However, its reliance on a single dataset may limit generalizability across different contexts and languages. Mohapatra et al. [32] proposed a Bi-LSTM model enhanced with self-attention for improved fake news detection, addressing the limitations of unidirectional analysis. However, its high accuracy may be dataset-specific, raising concerns about scalability and real-world performance.
In the approaches discussed above, it can be observed that the majority of researchers used only feature extraction or feature selection techniques before the classification of fake news. Utilizing feature extraction alone does not effectively reduce the high dimensionality of the data. Conversely, feature selection helps reduce dimensions but may overlook important features. Therefore, this research proposes an approach that simultaneously employs feature extraction and feature selection techniques. Furthermore, multiple ensemble classifiers are proposed, combining machine learning and deep learning models to achieve high accuracy.
3 Basic Concept of Proposed Methodology
• Before applying the ensemble classifiers to the data, we pre-processed the data. Pre-processing is a technique used to transform inconsistent, incomplete, and raw data into a machine-understandable format for data mining. All actual data indices contain various issues that require resolution through refreshing and rectifying the problems in the data. In this step, prior to passing the data to classifiers, which will further process the data, we organized the collected data into a legitimate format. These datasets are primarily in the English language. We selected only English words for pre-processing by applying NLP techniques, which increases the accuracy of our model. After applying the NLP techniques, further conversion of binaries and transformation within the dataset becomes easier. We employed multiple pre-processing methods on the dataset. Details of the pre-processing are shown below:
• Tokenization: The tokenization method is split into small pieces (or tokens) and removes special characters such as periods and commas.
o Before: “The quick brown fox jumps over the lazy dog.”
o After: [“The”, “quick”, “brown”, “fox”, “jumps”, “over”, “the”, “lazy”, “dog”]
• Lowercase: It helps consistent flow during the NLP text mining and tasks. The data is in lowercase and straightforward; it works through the lower () function.
o Before: “The Quick Brown Fox.”
o After: “the quick brown fox.”
• Remove Punctuation: One other common pre-processing technique is removing punctuation from the dataset. Again, this normalization process will help treat ‘Good’ and ‘Good!’ similarly. We discarded all the punctuation symbols like:! “ \# \$ \% \& \’() * + , - ./ : ; < = > ? @ from the data.
o Before: “Hello! How are you today?”
o After: “Hello How are you today”
• Stop-Words: In any language (like pronouns and prepositions), these are the most common words that provide little context information. Some stopword examples are “the”, “an”, and “so”. Removing these terms does not affect our text and focuses more on vital information.
o Before: “The quick brown fox jumps over the lazy dog.”
o After: “quick brown fox jumps lazy dog”
• Lemmatization: Lemmatization is a text standardization technique in Natural Language Processing (NLP) that transforms similar words into their base root form. This process groups different inflected forms of a word into a single root form while preserving the meaning of the word. Lemmatization aims to reduce words to their core meaning, making it easier to analyze and process large amounts of text data.
o Before: “running, ran, runs”
o After: “run, run, run”
We applied the data pre-processing steps in our experiments to eliminate the noise. After cleaning the text data, we used multiple techniques to extract and select the features.
3.2 Feature Extraction Techniques
Feature extraction involves transforming raw data into numerical features for further processing, improving machine learning results compared to using raw data directly. Different techniques are employed for feature extraction.
CountVectorizer is utilized to extract unique words and construct their list. The frequency of words in the entire corpus is calculated as per Eq. (1). In our implementation, the CountVectorizer is configured with the following parameters:
• analyzer = ‘word’: Analyzing words individually.
• nram_range = (1, 1): Considering unigrams, representing single-word tokens.
Example: For the documents [“I love AI”, “AI is amazing”], the CountVectorizer will produce a matrix where each row represents a document and each column represents a word from the vocabulary.
TF-IDF (Term Frequency-Inverse Document Frequency) is a technique employed in Natural Language Processing (NLP) to assess the importance of a word within a document relative to a set of documents. The score is calculated by multiplying the word’s frequency in the document by the inverse of its frequency across all documents in the set. Here, term frequency (tf) represents how often the word appears in the document, while inverse document frequency (idf) reflects the logarithmic count of documents containing the word in the set. This combination identifies distinctive words for each document, indicating their potential significance in content analysis. The TF-IDF score is determined using the formula presented in Eq. (2).
Example: For a word “AI” in a document about technology, if “AI” is rare in other documents, its TF-IDF score will be higher.
Word2Vec is a widely used tool in Natural Language Processing (NLP) that transforms words into numerical vectors. It consists of a two-layer neural network that processes text by analyzing the relationships between words. The input to the system is a text corpus, and the output is a set of vectors that represent the words in the corpus. Word2Vec has proven to be effective in tasks such as text classification, sentiment analysis, and machine translation, among others, due to its ability to capture the semantic meaning of words in the text. Example: In a Word2Vec model, the word “AI” might be represented by a vector such as [0.1, 0.2, −0.3, ...], reflecting its meaning based on its usage in context.
GloVe (Global Vectors for Word Representation) is a method for encoding words as vectors in a continuous vector space. It uses a statistical approach to create vector representations of words that reflect their semantic similarity. GloVe is an unsupervised learning algorithm that generates a vector representation for each word in a corpus based on its co-occurrence statistics. The vectors produced by GloVe can be used for various Natural Language Processing (NLP) tasks, such as text classification, word analogy, and word clustering, among others, due to its ability to capture the meaning of words in the context of the corpus. Example: The word “AI” in a GloVe model might be represented as a vector in a high-dimensional space where similar words like “machine learning” are close to it.
The Bag of Words (BoW) model is a text representation that summarizes the presence of words within a document while ignoring grammar and the sequence of words. The term “bag” of words refers to the fact that the model discards information about the arrangement of words in the document and focuses solely on the frequency of words. This model emphasizes only the number of times each word appears in the document, without considering their order or context. This technique is widely used in Natural Language Processing (NLP) for text classification, sentiment analysis, and topic modeling, among other tasks, due to its simplicity and efficiency in summarizing large amounts of text data. Example: For “AIi is amazing” and “I love AIi”, BoW will focus on word frequency without considering order, resulting in vectors like [1,1,1,1] for “AIi” and “amazing”, and [1,1,0,1] for “love”.
3.2.6 Strength and Weakness of Feature Extraction
CountVectorizer offers a straightforward implementation by capturing raw word counts, however, it lacks the ability to account for word importance and context. TF-IDF improves upon this by weighing terms based on their relevance, reducing the impact of common words and helping to distinguishing important terms, although it may still overlook word relationships and result in high-dimensional vectors. Word2Vec effectively captures semantic meaning and word relationships but demands significant computational resources and may miss nuanced meanings. GloVe provides effective word vectors through global statistical information but also requires substantial computational power and may not adapt well to specific contexts. The Bag-of-Words (BoW) model is simple and effective for basic text representation but disregards word order and context, potentially leading to large, sparse matrices that are computationally expensive.
3.3 Feature Selection Techniques
To build an accurate predictive model, it is esential to consider the quality and relevance of the input variables. Feature selection involves identifying the most relevant and informative features that contribute to the prediction task while discarding those that are redundant or irrelevant. This can improve the model’s performance, reduce overfitting, and increase interpretability by reducing the complexity of the model. It can also accelerate the training process and make the model more scalable, which is especially important when working with large datasets. The following techniques that have been used for feature selection in this paper are illustrated below.
The Chi-Square feature selection technique aims to identify features significantly related to the target variable, particularly in the context of categorical variables. This technique utilizes the Chi-Square test to measure the association between two categorical variables. The Chi-Square value (x2) is calculated using the formula in Eq. (3), where Oi represents the observed count, Ei is the expected count, and the summation is carried out over all categories. In this equation, Oi is the observed count for a specific category, and Ei is the expected count for the corresponding category under the independent assumption. A lower Chi-Square value implies independence between features, while a higher value suggests a significant relationship between the examined variables.
3.3.2 Principal Component Analysis
A feature selection technique is suggested to choose a set of variables in Principal Component Analysis (PCA) that maintains the complete data and as much information as possible. The amount of information is assessed using the percentage of agreement in the Generalized Procrustes Analysis. The objective is to preserve as much information as possible while selecting a subset of variables in PCA.
Information Gain (IG) is a metric that quantifies the reduction in uncertainty or entropy resulting from dividing a dataset based on a specific value of a random variable. The formula in Eq. (4) calculates IG by considering the counts and entropy of different groups (Group1 and Group2) after the dataset is split. Count (Group1) and Count (Group2) represent the counts of instances in each group, while Count (Dataset) is the total count of instances in the dataset. Entropy (Group1) and Entropy (Group2) denote the entropy of each group. The IG score reflects the information gained by making such splits in the dataset.
Document Frequency (DF) is a feature selection method in text classification that counts the number of documents in a collection that contain a specific feature. The feature can be a word, phrase, n-gram, or custom attribute. The DF measure has been found to be effective in selecting features for text classification tasks.
3.4 Machine Learning Classification Models
A classifier is a type of algorithm that categorizes input data into labeled classes or specific groups of information. The following machine learning classifiers were utilized in this research.
Naive Bayes is a family of algorithms for text classification that are based on Bayes’ theorem and operate under the assumption of independence among predictors. This probabilistic machine learning model has proven to be effective for text classification and is known for its computational efficiency, sometimes outperforming more advanced classification methods.
A Decision Tree is a machine-learning algorithm that creates a tree-like structure for making predictions or classifications. It’s a supervised learning method used mostly for classification tasks. The tree-like structure is built by dividing the data into smaller subgroups based on certain criteria until the data within each subgroup is homogeneous. The end result is a visual representation of the decision-making process, which can be easily understood and explained to others.
The Random Forest is an ensemble model that employs multiple decision trees to make predictions. It is a type of ensemble learning combining multiple tree results to produce more accurate and robust predictions. In a classification task, the model trains multiple decision trees and combines their predictions by selecting the class that receives the most votes. This approach provides a collective prediction from multiple models, resulting in more reliable results compared to using a single decision tree.
Support Vector Machines (SVM) are supervised learning algorithms used for classification tasks. They are designed to work well with both structured and unstructured data, making them useful tools for various applications. The algorithm works by finding the hyperplane that separates the data into two categories, with the largest margin possible, to accurately classify new data points. SVMs are effective in solving complex classification problems and have proven reliable and efficient in many real-world applications.
Linear Regression is a popular statistical technique that models the linear relationship between a dependent variable and one or more independent variables. Linear regression aims to identify the line that most accurately describes the relationship between the dependent and independent variables. This line is represented by a linear equation, where the coefficients indicate the impact and direction of each independent variable on the dependent variable. Linear Regression is commonly used for forecasting and determining the significance of each predictor variable in influencing the dependent variable.
Gradient Boosting is a type of boosting ensemble model that improves upon Adaboosting by directly learning from the residual error of mistakes. It operates by constructing a set of trees, where each tree in the set tries to correct the mistakes made by the trees that came before it. The result is a more accurate model than Adaboosting, also referred to as gradient tree boosting.
3.5 Creating an Ensemble Regression Model
The ensemble classifier was enhanced using diverse boosting techniques, employing a weighted sampling approach to combine machine learning classifiers. This technique incorporates a weight column in the data frame, initialized with values against each record. The initial weight, as calculated by Eq. (5), assigns equal weights (1/n) to each record, where n represents the total number of records in the dataset.
The weight xi is computed for each instance in the training set D1 using Eq. (6). Subsequently, this training set is input to the base classifier for classification. Following this, predictions are made on the same training set D1, where the classifier correctly predicts some values, and a few are misclassified. The misclassified instances in the data D1 used for predictions are identified, and the weights are updated in the weight column. The weight updating process, detailed in [33], begins with the calculation of the misclassification rate using Eq. (6):
In Eq. (6), Σerror represents the misclassification rate in D1, and Σweight represents the sum of the initial weights of all instances in D1. The initial weight of each instance, Weight(xi), calculated in Eq. (6), contributes to the computation of the Stage value. The Stage value, determined by Eq. (7), uses the misclassification error to provide weights for predictions [33]. The computation of Stage involves the natural logarithm, as shown in Eq. (7).
This Stage is the weight prediction. Here in Eq. (7), In represents the natural logarithm. Afterward, the weight predictions are used to calculate the updated weight for each instance. Hence, through this process, more weights are assigned to the misclassified, and fewer weights are assigned to correctly classified instances. Eq. (8) is used to calculate the updated weights as described below:
The exponential values of the stage are used to calculate the revised weight for each instance in D1. This means that misclassified instances will receive higher weights, and those correctly classified will receive lower weights, increasing the likelihood of the misclassified instances being selected in the next iteration through weighted sampling. The process of weighted sampling in Boosting algorithms is used to update the training data for each iteration. The current iteration’s data is represented as D2, which undergoes a weighting process. During this process, instances with higher weights are given a higher probability of being selected for classification in the next iteration. This allows the algorithm to focus on the most misclassified instances and improve the model’s overall accuracy. This process is repeated with each classifier, resulting in an ensemble classifier combining the results of multiple classifiers and enhancing overall performance.
3.6 Effectiveness of Our Model
Our model demonstrates a balanced approach to handling both overfitting and underfitting. By combining advanced feature extraction techniques with robust feature selection methods, we achieve a well-tuned model that performs efficiently on a range of datasets. The use of ensemble classifiers, particularly the combination of Random Forest and Support Vector Machine, has proven effective in leveraging both the strength of feature extraction and the precision of feature selection. This combination results in high accuracy, precision, recall, and F1-Score across different datasets, indicating that our model maintains a good balance between complexity and simplicity.
In this research, a Fake News Detector model is proposed based on ML/DL ensemble classifiers, which are various combinations of regression models. Additionally, the Fake News Detector utilizes several Natural Language Processing (NLP) techniques to perform preprocessing on selected datasets. Generally, the proposed work is divided into three parts. In the first part, NLP tools are used for preprocessing. The Fake News Detector performs five types of preprocessing (Tokenization, Stemming, Stop Words removal, Punctuation removal, Lowercasing, and Lemmatization) on the selected dataset. In the second part, the Fake News Detector extracts features and then selects relevant ones from the extracted set. This research uses Word2Vec, Count Vectorizer, TF-IDF, Bag of Words, and GloVe techniques for feature extraction, while Information Gain, Chi-Square, Document Frequency, and PCA are employed for feature selection. In the final part, ensemble classifiers are proposed to detect fake or real news in a binary classification based on the resultant features. The diagram of the proposed model is shown in Fig. 1.
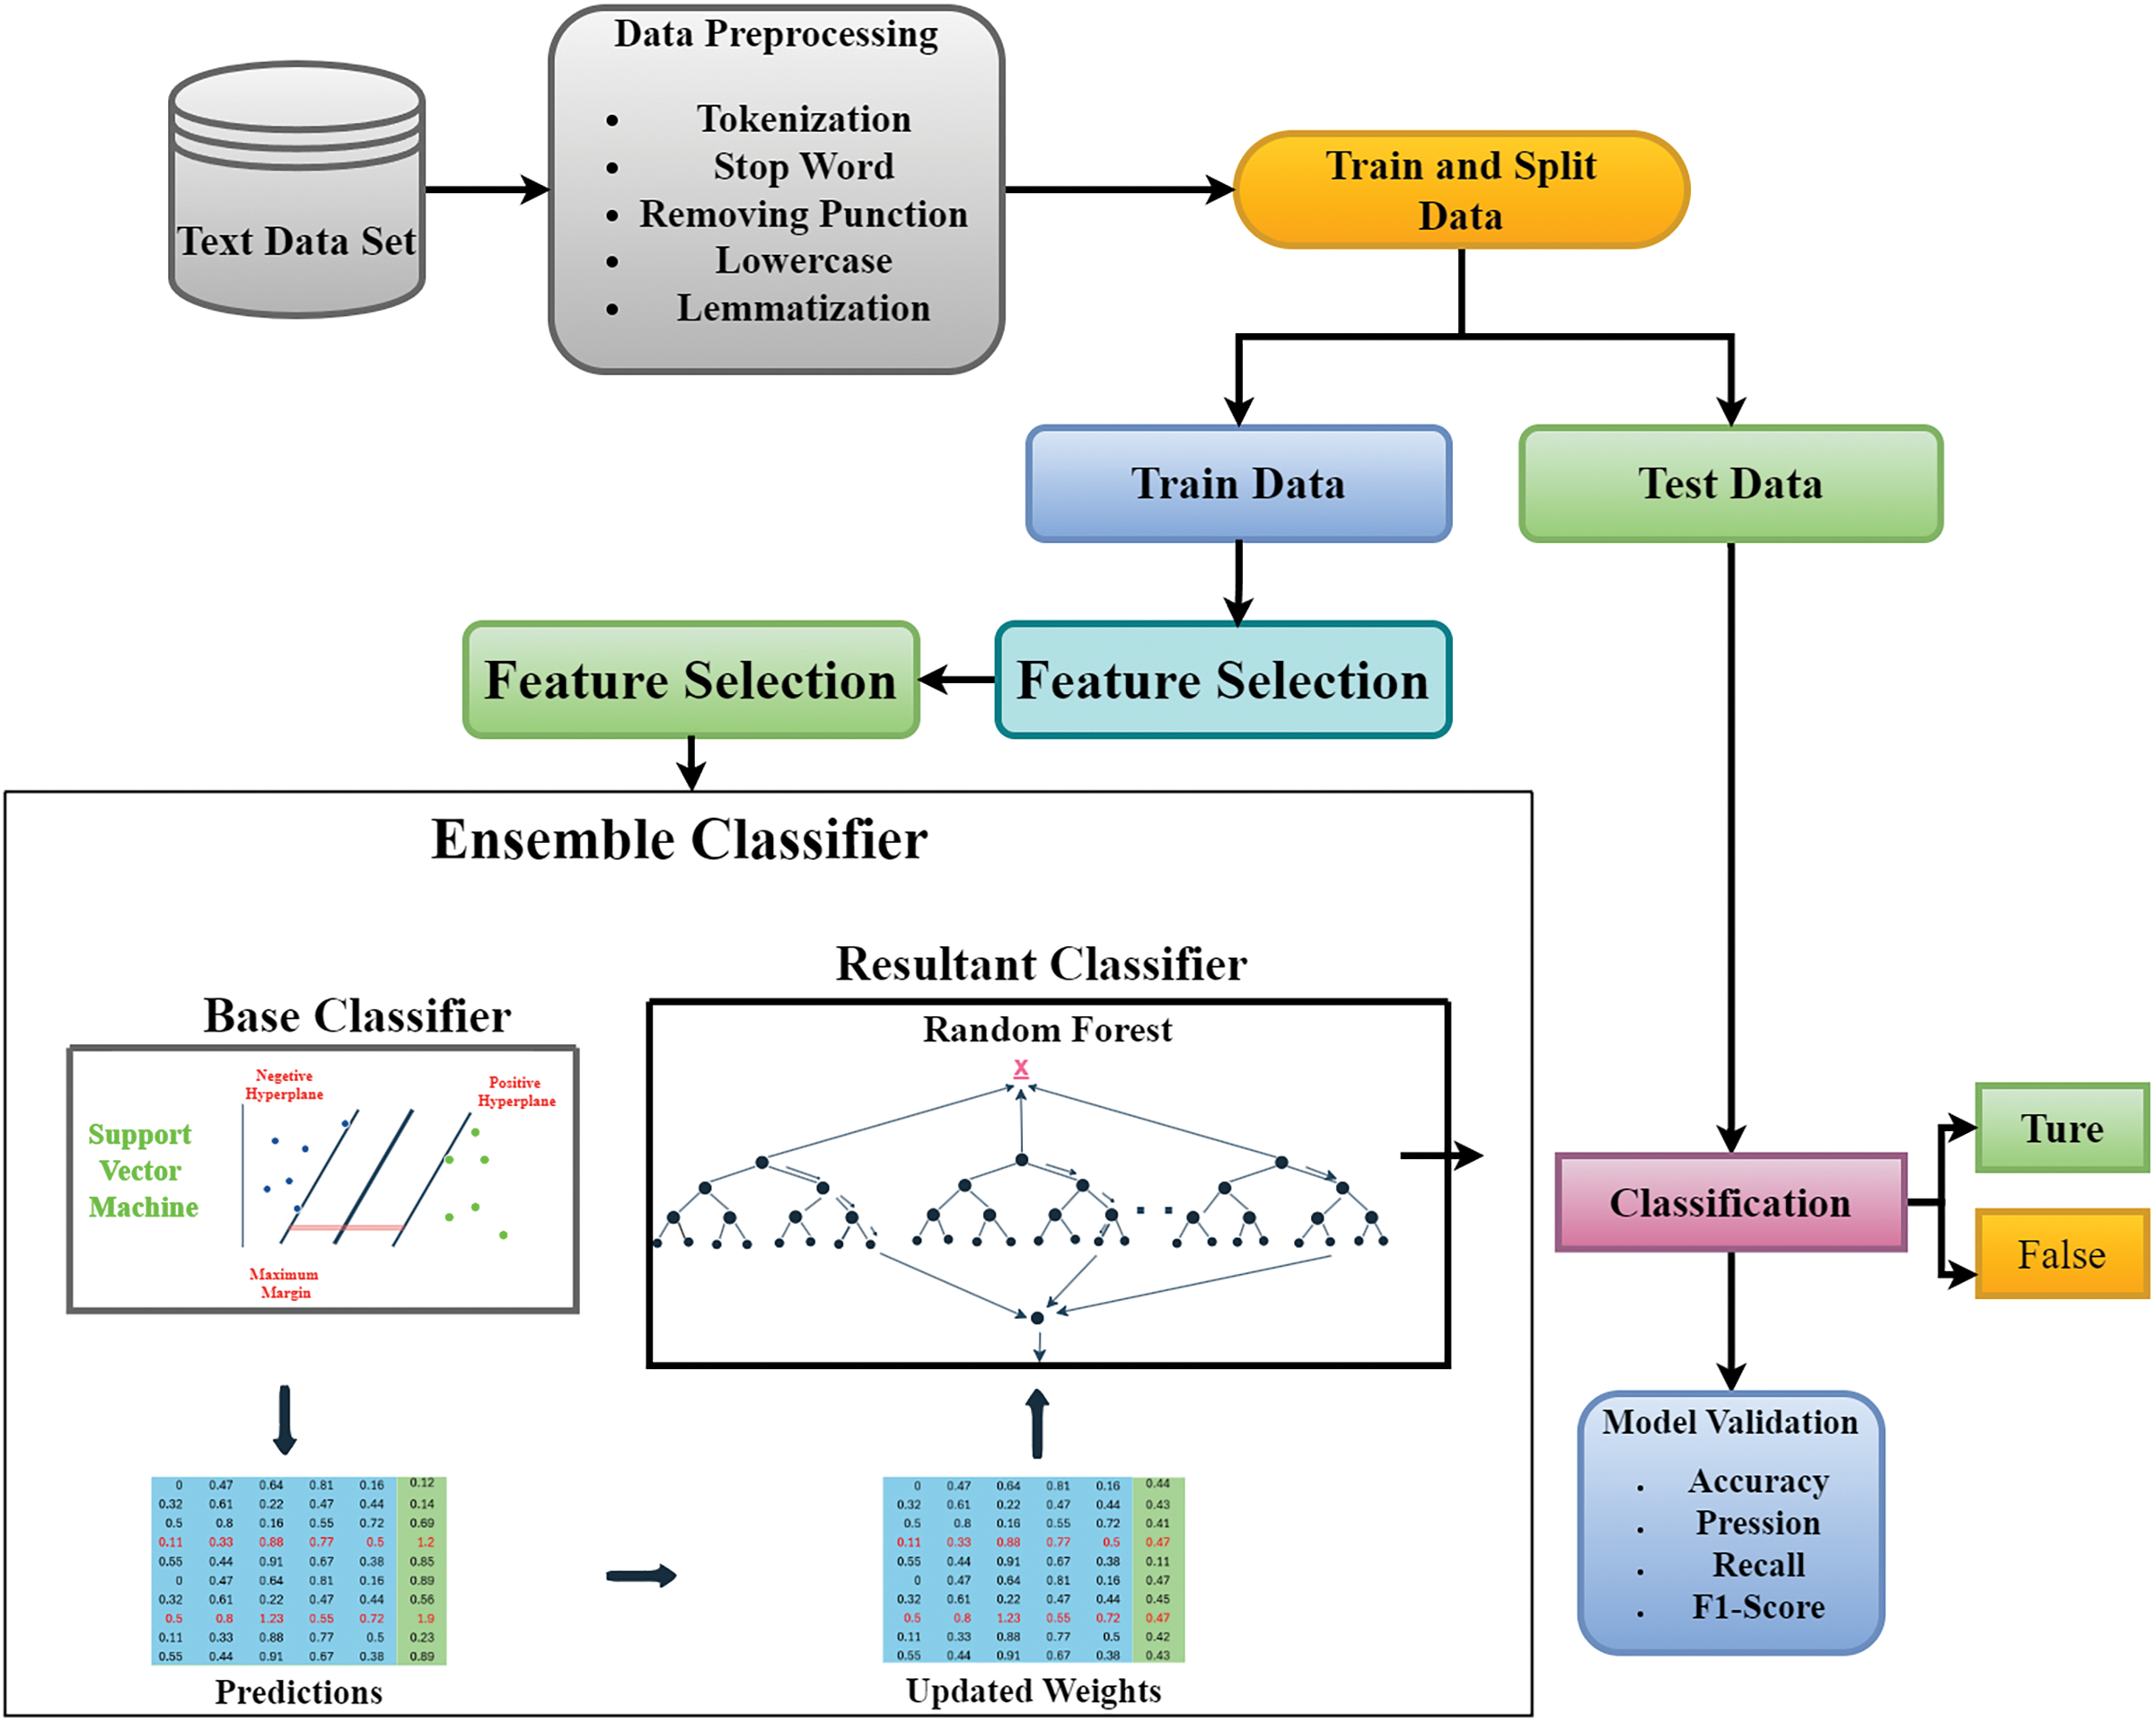
Figure 1: Proposed model
The dataset was collected from various online sources. The preprocessing step involved applying Natural Language Processing (NLP) to include only English words for increased accuracy while removing noise and inconsistencies. The dataset was transformed and converted into a binary format for easier processing. The text underwent a series of preprocessing steps, including sentence splitting, word tokenization, stop word removal, punctuation stripping, and lemmatization. The aim was to reduce the text to its core meaning, represented by meaningful words, by eliminating unnecessary elements such as stop words and punctuation. The final result was a set of words that had been given dictionary meanings through lemmatization.
After preprocessing, various feature extraction methods were applied to convert the text into numerical representations. These techniques included Count Vectorization, which represents text as a vector based on the frequency of each word in the document. TF-IDF was applied to weigh the importance of words in a document, considering their frequency and the number of documents in which they appear. The Bag-of-Words model was also used, which is a common approach for clustering, classification, and topic modeling, counting the number of times a word appears in a document. Word2Vec, a shallow neural network, was utilized to predict words based on their context or to predict the context given a specific word. Finally, GloVe was employed for unsupervised learning, mapping words into a semantic space where the distance between words reflects their similarity.
This research utilized various feature selection techniques to identify the most crucial features from the extracted data. Not all features hold equal significance and weight in creating a consistent and effective statistical model; some contribute more to model prediction and are crucial for improving accuracy. This study employed four feature selection methods—Chi-Square, PCA, Information Gain, and Document Frequency—to reduce the feature space and select the most important features. Subsequently, the data with the best-selected features were fed into base classifiers, consisting of both machine learning and deep learning models for prediction. These classifiers provide a binary output, with 0 representing true and 1 representing false.
Following feature selection, the predictions from the base classifiers are consolidated into a matrix. Any misclassified instances are assigned updated weights, and this matrix is then used as a training set for the resultant classifiers to determine whether the news is true or false. The resultant classifiers then make predictions on the test dataset.
5 Experimental Results and Discussion
The experiments were carried out on Google Colaboratory using a Windows 10 operating system. The system was equipped with 8 GB RAM and an Intel(R) Core(TM) i5-7200U CPU @ 2.50 GHz 2.71 GHz processor. The Deep Learning library Keras, with TensorFlow as its backend, was utilized for DL models, while the machine learning models were implemented using the Scikit-learn library. The data was split into training and testing sets, with 70% and 30% of the data used for training and testing purposes.
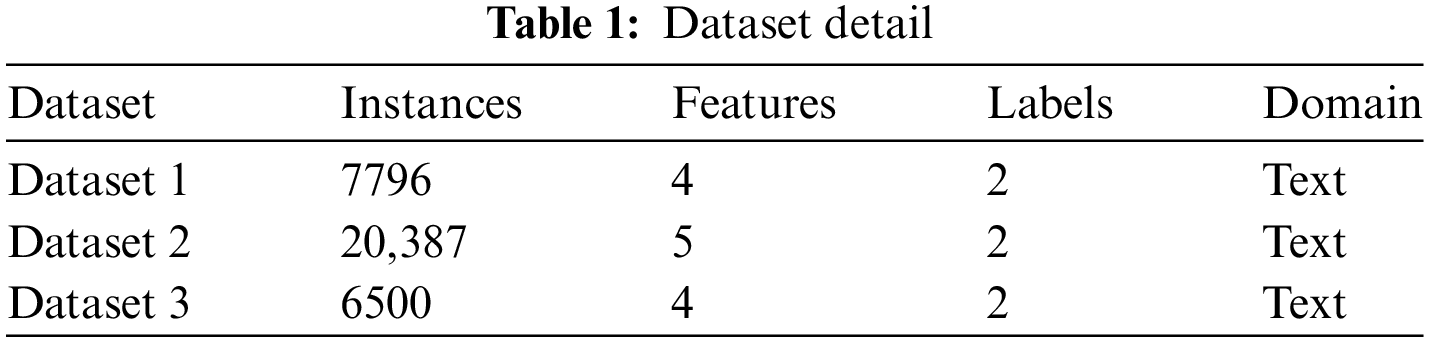
Three publicly available datasets were used in the experiments. Table 1 provides details of the datasets. Two datasets were obtained from the Kaggle repository, a large community of data scientists [34], while the third dataset was obtained from the GitHub repository.
5.2 Performance Evaluation Metrics
The effectiveness of the suggested approach is assessed using accuracy, precision, recall, and F1-Score as evaluation metrics. These measures are described below.
The performance of the method can be evaluated by determining the proportion of accurate predictions made by the method out of the total number of input samples. This can be expressed as a ratio and can be represented mathematically as Eq. (9).
In this equation, the numerator represents the number of correct predictions made by the method, while the denominator represents the total number of input samples used for evaluation. The resulting value gives us the accuracy of the method, which is a measure of how well it is able to make predictions.
Precision can be defined as the ability of a classifier to correctly identify positive samples out of all the samples it has classified as positive. This can be expressed mathematically as Eq. (10).
In this equation, the numerator represents the number of correct positive predictions made by the classifier, while the denominator represents the total number of positive predictions made by the classifier. The resulting value gives us the classifier’s precision, which measures its ability to accurately identify positive samples.
Recall can be defined as the ability of a classifier to correctly identify all positive samples in a dataset. It is calculated as the ratio of the number of true positive predictions made by the classifier to the sum of true positive and false negative predictions. This can be expressed mathematically as Eq. (11).
In this equation, the numerator represents the number of true positive predictions made by the classifier, while the denominator represents the sum of true positive predictions and false negative predictions. The resulting value gives us the recall of the classifier, which is a measure of its ability to correctly identify all positive samples in a dataset.
The performance of the model is measured using the F1-Score, which is a combination of precision and recall. It ranges from 0 to 1, and the higher the value, the better the performance of the model. It is calculated as shown in Eq. (12).
5.3 Experimental Design and Model Selection
In this study, we conducted a systematic experimental evaluation using a variety of machine learning and deep learning models, including Support Vector Machines (SVM), Random Forest, and Convolutional Neural Networks (CNN). The experimental design was carefully structured to ensure a comprehensive analysis of these models.
Before model training, we performed detailed data preprocessing, which included steps such as data normalization, handling missing values, and feature selection. These preprocessing steps were crucial to ensure the quality and consistency of the data used for training the models. The specific steps involved in data preprocessing were:
1. Data Normalization: Ensuring that all features were scaled to a uniform range to improve model performance.
2. Handling Missing Values: Imputing missing data points using statistical methods such as mean imputation or by using model-based imputation techniques.
3. Feature Selection: Employing techniques such as Principal Component Analysis (PCA) to reduce dimensionality and select the most relevant features for the models.
5.3.2 Model Parameter Adjustment
The adjustment of model parameters was done through hyperparameter tuning, using grid search and cross-validation techniques. This process allowed us to identify the optimal set of parameters for each model, maximizing their predictive accuracy.
5.3.3 Selection of Ensemble Learning Algorithms
We selected ensemble learning algorithms for their capacity to leverage the strengths of multiple models, enhancing both performance and robustness. Our experiments involved testing various machine learning and deep learning algorithms. Among these, Random Forest and Support Vector Machines (SVM) demonstrated superior effectiveness, particularly in handling high-dimensional data and minimizing overfitting through techniques like model averaging and margin maximization. Based on the experimental results, we opted to retain these models due to their superior performance, while discarding others that did not perform as well. The reasons for selecting these specific algorithms are as follows:
1. Random Forest: Selected for its robustness in handling a large number of features and its ability to mitigate overfitting by averaging multiple decision trees.
2. SVM: Chosen for its capability to find the optimal hyperplane that maximizes the margin between different classes, which is particularly effective in high-dimensional spaces and when the classes are not linearly separable.
By integrating these ensemble methods, we aimed to create a model that not only performs well on the training data but also generalizes effectively to unseen data, ensuring the reliability and applicability of our findings.
A classifier is an algorithm that sorts input data into labeled classes or specific categories of information. Below we discuss some classifiers that we have used in this paper.
5.4.1 Convolutional Neural Network
Convolutional Neural Networks (CNNs) are a widely used type of Artificial Neural Network (ANN) architecture that is specifically designed to tackle complex image recognition tasks. The simple yet precise design of CNNs makes it easier to get started with ANNs. ANNs are inspired by the structure and function of the biological nervous system, such as the human brain. They consist of a large number of interconnected computational nodes, referred to as neurons, which receive input in the form of a multidimensional vector. The hidden layers within the network weigh the impact of random changes on the final output, allowing the network to learn and optimize its predictions. CNNs are a multi-layer feedforward-ANN architecture with multiple hidden layers and are commonly referred to as deep learning. The neurons within the network self-optimize through learning, where they receive input, perform calculations, and produce an output. This process continues through the multiple hidden layers until the final layer produces the output based on the previous layer’s output. The entire CNN represents a single perceptual score function, where raw image vectors are transformed into a final class score output. This process involves a series of computations within the hidden layers, where the neurons weigh the impact of random changes on the final output.
Long-Short Terms Memory (LSTM) is a type of recurrent neural network that is specifically designed to excel in memorizing patterns compared to traditional recurrent neural networks. Like other neural networks, LSTMs can have multiple hidden layers that retain relevant information and discard irrelevant information in each cell. The LSTM architecture is unique in that it has three gates: the forget gate, the input gate, and the output gate. The forget gate plays a critical role in determining which information is kept and used to calculate the cell state and which information should be discarded. The input gate updates the cell state and assigns importance to new information, while the output gate decides the value of the next hidden state, which holds information about previous inputs. By utilizing these gates, LSTMs can effectively manage and preserve the flow of information through the network over extended periods, making it particularly useful for tasks that require remembering and utilizing long-term dependencies.
5.4.3 Recurrent Neural Network
The Recurrent Neural Network (RNN) is a type of fully connected neural network that uses a loop structure in some of its layers. This loop structure allows the RNN to handle sequence-based data, such as text or time-series predictions, with higher accuracy. The RNN uses a combination of inputs, matrix multiplication, and a non-linear function to make predictions. Although RNNs are primarily known for their ability to perform text classification, they are also effective in image classification and other tasks that involve sequence-based predictions.
In this research, the boosting technique was carried out using Machine Learning and Deep Learning classifiers. Table 2 shows the different matrices that were calculated for the ensemble classifiers. Data from Dataset 1 was divided into 50% for training and 50% for validation. Several feature extraction and selection methods were compared, but the best results were obtained using five extraction techniques and one feature selection method, Chi-Square.

Moreover, this research also used the boosting ensembling approach and performed experiments. This research only highlights the results of the best performances among all of them. As seen in Table 2, ensemble classifiers with the feature selection did not perform well compared to feature extraction techniques. However, when both feature extraction and feature selection were used with the ensembling approach, we observed significant improvement in terms of accuracy. The weights of these classifiers are utilized in the ensembling approach to achieve 97% accuracy, 99% precision, 99% recall, and 98% F1-Score, which outperforms the approaches in the literature. However, the logistic regression and gradient boosting regression ensemble classifier demonstrated the lowest accuracy, 82%, as illustrated in Table 3.

The performance results on Dataset 2 for detecting fake news are depicted in Tables 4 and 5.


We split data with 10,387 instances for training and 10,000 for validation. The proposed model also achieved efficient detection of fake news in this dataset. Ensemble classifiers of Random Forest and Support Vector Machine achieved 99% accuracy with 99% precision, 100% recall, and 99% F1-Score when combining the feature extraction and Chi-Square feature selection technique. However, the CNN and LSTM ensemble classifiers achieved the lowest accuracy, 88%.
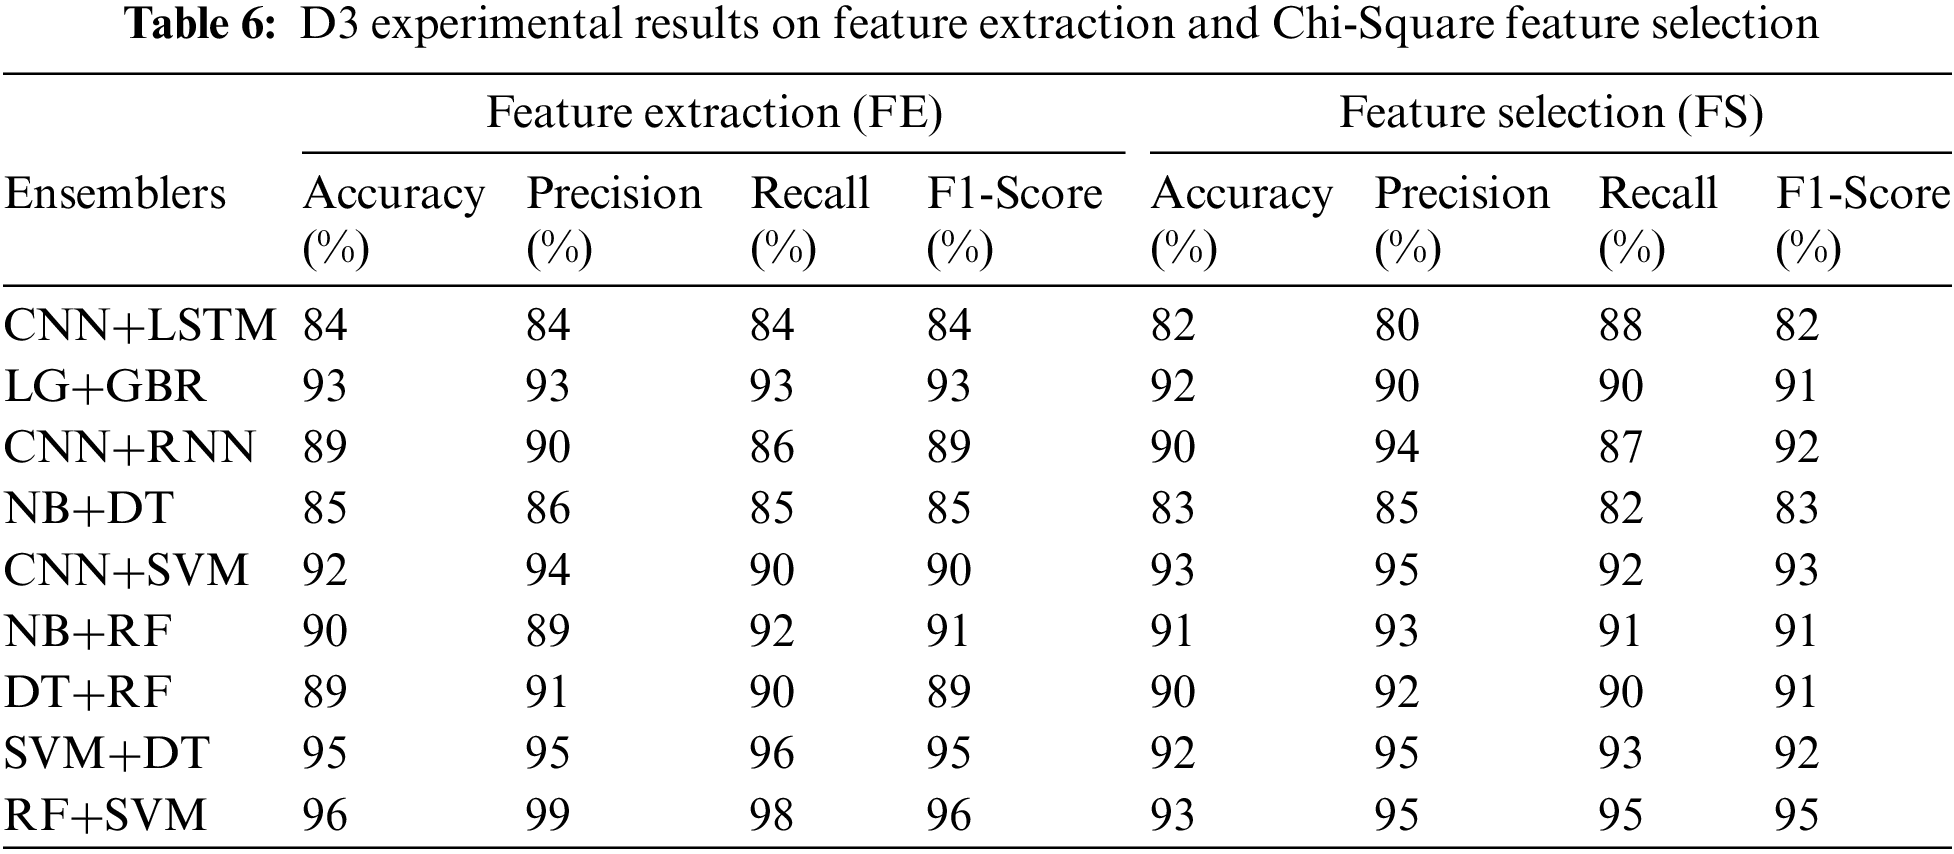
The performance results on Dataset 3 for detecting fake news are depicted in Tables 6 and 7. We split data and used 5405 instances for training, whereas 1352 instances were used for validation. On dataset 3, our proposed model achieves efficient results. Ensemble classifiers of Random Forest and Support Vector Machine achieved 98% accuracy with 100% precision, 99% recall, and 98% F1-Score when combining the feature extraction and Chi-Square feature selection technique. However, the NB and DT ensemble classifiers achieved the lowest accuracy of 90% on Dataset 3. In this research, only the ensembles that performed better were discussed.

This research utilized both machine learning and deep learning ensembling methods. However, the machine learning approaches yielded better results than deep learning classifiers, as the latter tends to work better with larger datasets. The ensemble classifiers of Random Forest and Support Vector Machine showed high accuracy when feature extraction and feature selection techniques were combined across all datasets.
The study’s results on using different ensemble classifiers on three datasets showed that the ensemble classifier using Random Forest and Support Vector Machine (SVM) with various feature extraction techniques and the Chi-Square feature selection method produced better results on all three datasets. The evaluation of this ensemble method on the three datasets was done with different data sizes, and the results were plotted in graphs, as seen in Fig. 2a–c. In all three graphs, the green bar represents the accuracy of a model based on different data sizes. The red bar represents precision, which is a measure of the ratio of correctly predicted positive identifications to the total number of positive observations. The blue bar represents recall, which measures the proportion of correctly identified positive examples. The maroon bar represents the F1-Score, which is a weighted average of precision and recall. The results showed that the model improved when the dataset size increased and produced more efficient results on all datasets.
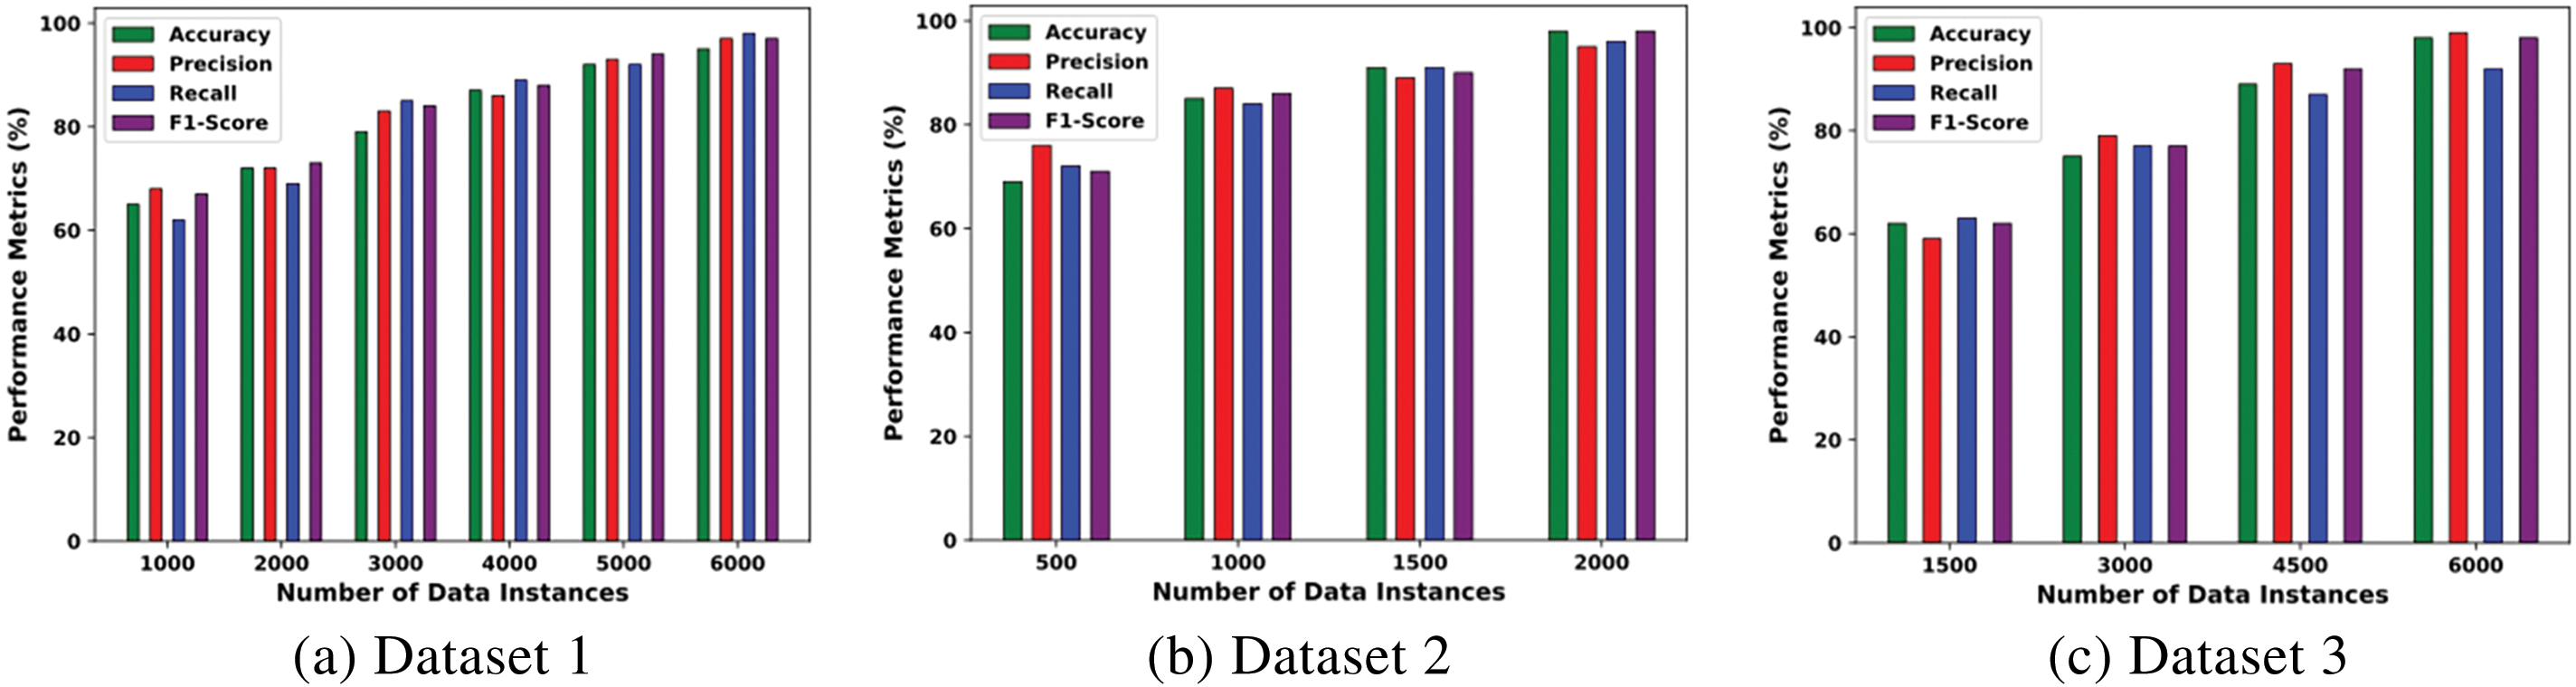
Figure 2: Results of the best ensemble on different instances of all three datasets
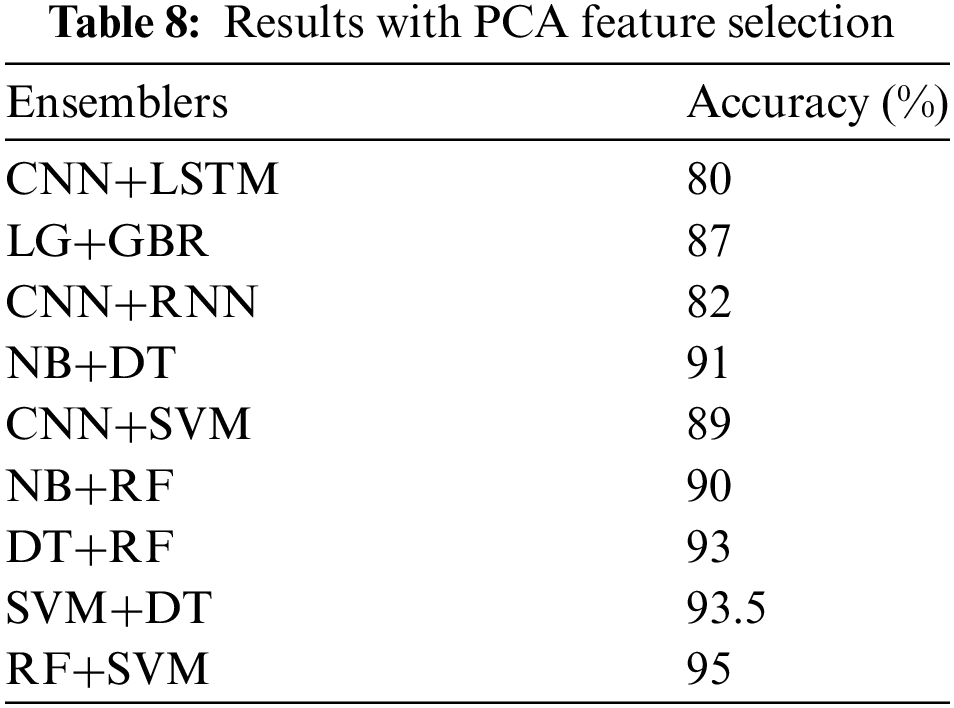
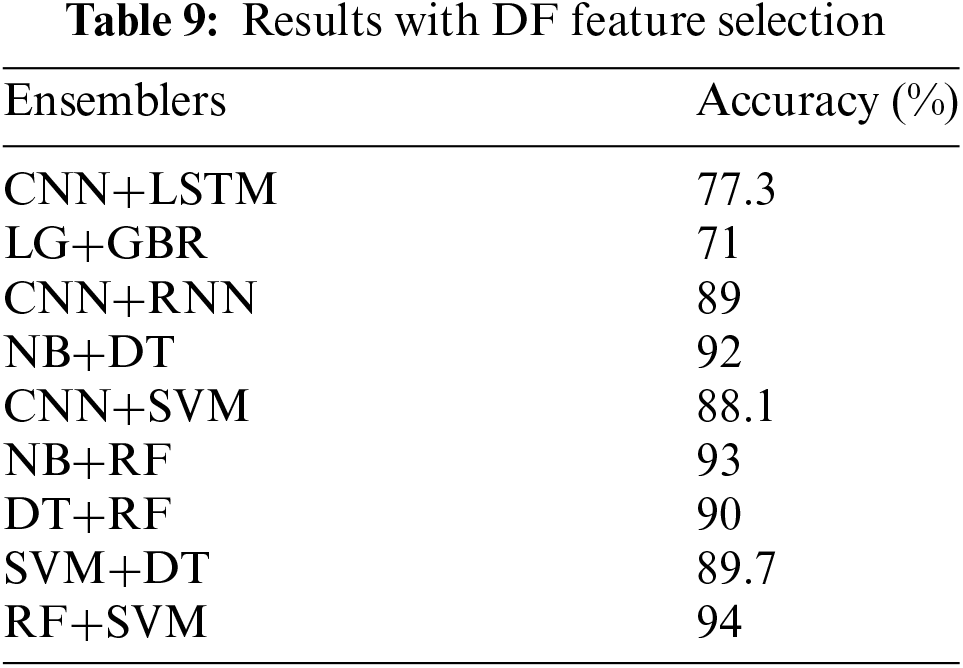
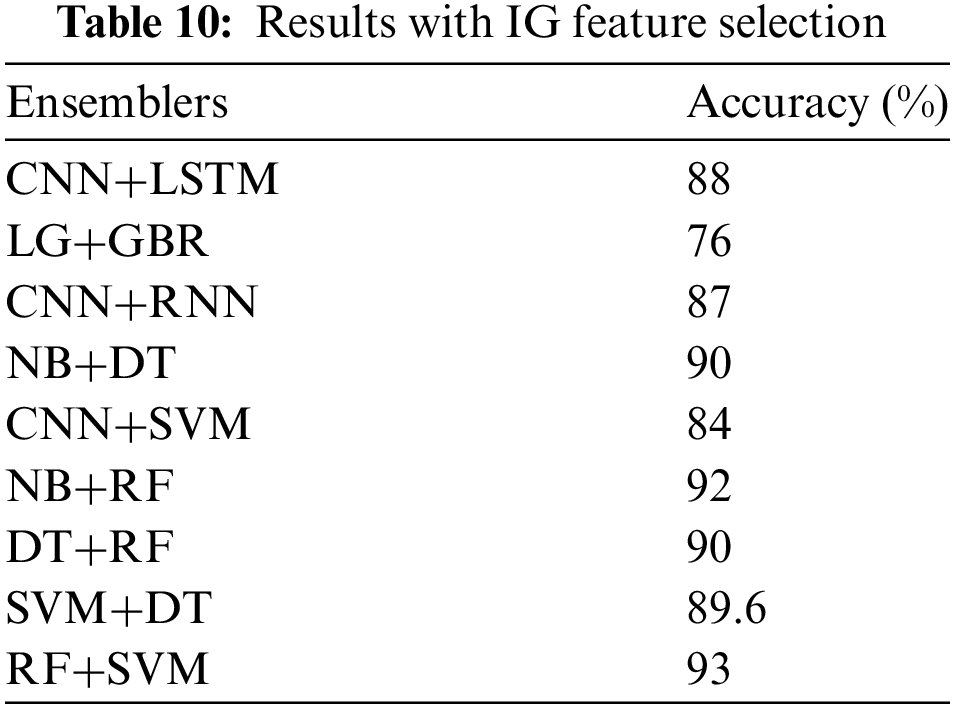
We also evaluated the performance using additional feature selection methods. Table 8 shows the results of PCA feature selection with the ensemble methods. The method exhibited an accuracy of 95% on random forest and support vector machines. On the other hand, the document frequency technique, as shown in Table 9, achieved an accuracy of 94% on the RF and SVM. Finally, Table 10 shows the results of the Information Gain technique, which has 94% accuracy on RF and SVM.
In our experiment, we divided three datasets of Fake News into training and testing sets and applied the ensemble classifier. The base classifier was first applied to the training set to produce results. Then, an ensembling technique was utilized to combine the results of the base classifier. This technique assigns higher weights to the instances misclassified by the base classifier so that they can be reclassified in the next iteration. Finally, the updated weighted training set was given to the resultant classifier for further training. Moreover, testing the model gives 99% accuracy. Hence, this new ensemble algorithm produces more effective results than past studies. The results are reproduced from the past study [11] for comparison, as shown in Table 11.

The comparison between the results of previous studies and the ensemble classifier based on SVM and RF is depicted in Fig. 3. The score on the dataset is on the x-axis, and the various evaluation measures are on the y-axis. The graph shows that the proposed model outperforms significantly in all evaluation measures compared to the existing studies.
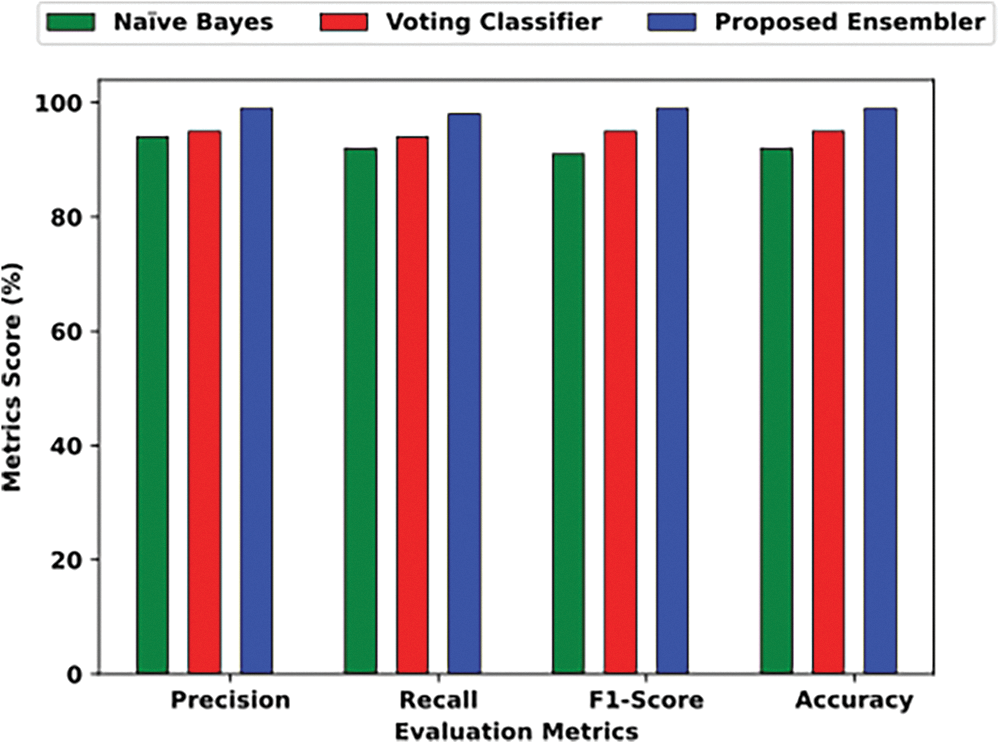
Figure 3: Results of the best ensemble on different instances of Dataset 3
5.6 Elaboration on Algorithm Selection
In our study, the selection of machine learning and deep learning algorithms was a crucial aspect of the research design, directly influencing the outcome of our proposed approach for fake news detection. Each algorithm was carefully chosen based on its unique strengths and suitability for addressing the research questions.
5.6.1 Convolutional Neural Networks (CNN)
CNNs are well-known for their effectiveness in image classification tasks, but their application to sequential data, such as text, has shown promising results due to their ability to capture hierarchical features.
5.6.2 Long Short-Term Memory Networks (LSTM)
LSTMs, a type of recurrent neural network, were chosen for their capability to model sequential dependencies in data, making them particularly adept at capturing context and temporal patterns in language, which is crucial for discerning fake news.
5.6.3 Random Forest (RF) and Support Vector Machine (SVM)
Ensemble methods like RF, combining multiple decision trees, and SVM, known for their robustness in high-dimensional spaces, were included to leverage the complementary strengths of these classifiers.
5.6.4 Logistic Regression (LG), Gradient Boosting (GBR), Naive Bayes (NB), and Decision Trees (DT)
These traditional machine learning algorithms provide a baseline for comparison, ensuring a comprehensive evaluation of our proposed approach across various learning paradigms.
By employing this diverse set of algorithms, we aimed to achieve a holistic understanding of the dataset and enhance the robustness of our fake news detection model. The rationale behind each selection was driven by the need to address specific challenges posed by the nature of textual data on social media platforms.
In conclusion, this study addresses the complex challenge of fake news detection through an advanced Stack Ensemble approach that integrates both machine learning and deep learning techniques. By analyzing insights from three distinct datasets, our method outperforms previous studies. We systematically applied six feature extraction techniques to the fake news data, ensuring a comprehensive representation of linguistic features. This was followed by the implementation of four feature selection methods—Chi-Square, PCA, Document Frequency, and Information Gain—to refine the feature set and enhance the model’s ability to differentiate between genuine and fake news. Our ensemble classifiers, rigorously tested on all features, demonstrated superior performance in fake news classification, achieving higher accuracy than established models. This underscores the efficacy of our Stack Ensemble approach and confirms its capability in identifying intricate patterns within fake news datasets.
Future Direction: To better align with the current research landscape, future work should consider the following advancements in fake news detection: Integration of multi-modal data, explainability and Transparency. We also plan to further improve the model’s resilience by incorporating more sophisticated adversarial training techniques and developing robust detection mechanisms to identify and mitigate emerging attack strategies. Additionally, integrating real-time monitoring and adaptive defenses will help maintain high performance and security as new threats evolve.
Acknowledgement: We extend our heartfelt gratitude to the faculty and staff at Kyungpook National University, Daegu, South Korea and COMSATS University, Islamabad, Pakistan for their invaluable assistance and resources throughout this project. Their encouragement and support have been instrumental in completing this study.
Funding Statement: This research was supported by the MSIT (Ministry of Science and ICT), Korea, under the ICT Creative Consilience Program (IITP-2024-2020-0-01819) supervised by the IITP (Institute for Information & Communications Technology Planning & Evaluation).
Author Contributions: Muhammad Ali Ilyas and Abdul Rehman equally contributed to this article. Muhammad Ali Ilyas selected the experimental data, conducted all the experiments, and reviewed the relevant literature. Abdul Rehman provided comments and suggestions, performed experiments, created graphical visualizations, and assisted with proofreading and editing of the English text. Muhammad Tahir Naseem reviewed and improved the manuscript. Assad Abbas and Dongsun Kim supervised the research. Nasro Min Allah contributed to data acquisition and model evaluation. All authors reviewed the results and approved the final version of the manuscript.
Availability of Data and Materials: The data used in this research can be requested from the corresponding author on request.
Ethics Approval: Not applicable.
Conflicts of Interest: The authors declare no conflicts of interest to report regarding the present study.
References
1. H. Ledford, “How Facebook, Twitter and other data troves are revolutionizing social science,” Nature, vol. 582, no. 7812, pp. 328–331, 2020. doi: 10.1038/d41586-020-01747-1. [Google Scholar] [PubMed] [CrossRef]
2. A. Archambault and J. Grudin, “A longitudinal study of Facebook, LinkedIn, & Twitter use,” in Proc. SIGCHI Conf. Human Fact. Comput. Syst., Austin, TX, USA, 2012, pp. 2741–2750. [Google Scholar]
3. D. M. Lazer et al., “The science of fake news,” Science, vol. 359, no. 6380, pp. 1094–1096, 2018. doi: 10.1126/science.aao2998. [Google Scholar] [PubMed] [CrossRef]
4. S. Alonso García, G. Gómez García, M. Sanz Prieto, A. J. MorenoGuerrero, and C. Rodríguez Jiménez, “The impact of term fake news on the scientific community. Scientific performance and mapping in web of science,” Soc. Sci., vol. 9, no. 5, 2020, Art. no. 73. [Google Scholar]
5. J. Brummette, M. DiStaso, M. Vafeiadis, and M. Messner, “Read all about it: The politicization of ‘fake news’ on Twitter,” J. Mass Commun. Quart., vol. 95, no. 2, pp. 497–517, 2018. doi: 10.1177/1077699018769906. [Google Scholar] [CrossRef]
6. S. Hakak, M. Alazab, S. Khan, T. R. Gadekallu, P. K. R. Maddikunta and W. Z. Khan, “An ensemble machine learning approach through effective feature extraction to classify fake news,” Future Gener. Comput. Syst., vol. 117, no. 6, pp. 47–58, 2021. doi: 10.1016/j.future.2020.11.022. [Google Scholar] [CrossRef]
7. A. Khan, K. Brohman, and S. Addas, “The anatomy of ‘fake news’: Studying false messages as digital objects,” J. Inf. Technol., vol. 37, no. 2, pp. 122–143, 2022. doi: 10.1177/02683962211037693. [Google Scholar] [CrossRef]
8. P. M. Napoli, “What if more speech is no longer the solution: First Amendment theory meets fake news and the filter bubble,” Fed. Commun. Law J., vol. 70, no. 1, pp. 55–104, 2018. [Google Scholar]
9. J. Hua and R. Shaw, “Corona virus (COVID-19) ‘infodemic’ and emerging issues through a data lens: The case of china,” Int. J. Environ. Res. Public Health, vol. 17, no. 7, pp. 1–12, 2020. doi: 10.3390/ijerph17072309. [Google Scholar] [PubMed] [CrossRef]
10. E. D. Liddy, “Natural language processing,” in Encyclopedia of Library and Information Science, New York, NY, USA: Marcel Decker Inc., 2001, pp. 1–14. [Google Scholar]
11. F. I. Adiba, T. Islam, M. S. Kaiser, M. Mahmud, and M. A. Rahman, “Effect of corpora on classification of fake news using naive Bayes classifier,” Int. J. Automat., Artif. Intell. Mach. Learn., vol. 1, no. 1, pp. 80–92, 2020. doi: 10.61797/ijaaiml.v1i1.45. [Google Scholar] [CrossRef]
12. M. Granik and V. Mesyura, “Fake news detection using naive Bayes classifier,” in Proc. of IEEE First Ukraine Conf. Elect. Comput. Eng., Kyiv, Ukraine, 2017, pp. 900–903. [Google Scholar]
13. J. Ramos, “Using TF-IDF to determine word relevance in document queries,” in Proc. First Instruct. Conf. Mach. Learn., 2003, vol. 242, no. 1, pp. 29–48. [Google Scholar]
14. P. Bharadwaj and Z. Shao, “Fake news detection with semantic features and text mining,” Int. J. Nat. Lang. Comput., vol. 8, no. 1, pp. 80–92, 2019. doi: 10.5121/ijnlc.2019.8302. [Google Scholar] [CrossRef]
15. T. Chen, X. Li, H. Yin, and J. Zhang, “Call attention to rumors: Deep attention based recurrent neural networks for early rumor detection,” in Proc. Pacific-Asia Conf. Know. Disc. Data Min., Melbourne, VIC, Australia, 2018, pp. 40–52. [Google Scholar]
16. S. Kaur, P. Kumar, and P. Kumaraguru, “Automating fake news detection system using multi-level voting model,” Soft Comput., vol. 24, no. 12, pp. 9049–9069, 2020. doi: 10.1007/s00500-019-04436-y. [Google Scholar] [CrossRef]
17. R. K. Kaliyar, “Fake news detection using a deep neural network,” in Proc. 4th Int. Conf. Comput. Commun. Automat., Greater Noida, India, 2018, pp. 1–7. [Google Scholar]
18. H. Karimi and J. Tang, “Learning hierarchical discourse-level structure for fake news detection,” in Proc. North America Chapter Assoc. Comput. Linguist.: Human Lang. Technol., Minneapolis, MN, USA, 2019, pp. 3432–3442. [Google Scholar]
19. V. Singh, R. Dasgupta, D. Sonagra, K. Raman, and I. Ghosh, “Automated fake news detection using linguistic analysis and machine learning,” in Int. Conf. Soc. Comput., Behav.-Cult. Model. Predict. Behav. Represent. Model. Simul., Washington, DC, USA, 2017, pp. 1–3. [Google Scholar]
20. A. Jain and A. Kasbe, “Fake news detection,” in Proc. IEEE Int. Students’ Conf. Elect., Electr. Comput. Sci., Students, Bhopal, India, 2018, pp. 1–5. [Google Scholar]
21. A. Thota, P. Tilak, S. Ahluwalia, and N. Lohia, “Fake news detection: A deep learning approach,” SMU Data Sci. Rev., vol. 1, no. 3, pp. 1–20, 2018. [Google Scholar]
22. A. Lakshmanarao, Y. Swathi, and T. S. R. Kiran, “An efficient fake news detection system using machine learning,” Int. J. Innov. Technol. Explor. Eng., vol. 8, no. 10, pp. 3125–3129, 2019. doi: 10.35940/ijitee.J9453.0881019. [Google Scholar] [CrossRef]
23. H. Ali, M. S. Khan, A. Alghadhban, M. Alazmi, A. Alzamil and K. Al-Utaibi, “All your fake detector are belong to us: Evaluating adversarial robustness of fake-news detectors under black-box settings,” IEEE Access, vol. 9, pp. 81678–81692, 2021. doi: 10.1109/ACCESS.2021.3085875. [Google Scholar] [CrossRef]
24. R. Oshikawa, J. Qian, and W. Y. Wang, “A survey on natural language processing for fake news detection,” 2018, arXiv:1811.00770. [Google Scholar]
25. M. Aldwairi and A. Alwahedi, “Detecting fake news in social media networks,” Procedia Comput. Sci., vol. 141, no. 1, pp. 215–222, 2018. doi: 10.1016/j.procs.2018.10.171. [Google Scholar] [CrossRef]
26. K. Stahl, “Fake news detection in social media,” Calif. State Univ. Stanislaus, vol. 6, no. 1, pp. 4–15, 2018. [Google Scholar]
27. F. da Silva, R. Vieira, and A. C. B. Garcia, “Can machines learn to detect fake news? a survey focused on social media,” in Proc. 52nd Hawaii Int. Conf. Syst. Sci., Grand Wailea, HI, USA, 2019, pp. 2763–2770. [Google Scholar]
28. S. Girgis, E. Amer, and M. Gadallah, “Deep learning algorithms for detecting fake news in online text,” in Proc. 13th Int. Conf. Comput. Eng. Syst., Cairo, Egypt, 2018, pp. 93–97. [Google Scholar]
29. M. H. Goldani, R. Safabakhsh, and S. Momtazi, “Convolutional neural network with margin loss for fake news detection,” Inform. Process. Manag., vol. 58, no. 1, pp. 1–12, 2021. doi: 10.1016/j.ipm.2020.102418. [Google Scholar] [CrossRef]
30. R. K. Kaliyar, A. Goswami, and P. Narang, “EchoFakeD: Improving fake news detection in social media with an efficient deep neural network,” Neural Comput. Appl., vol. 33, no. 14, pp. 8597–8613, 2021. doi: 10.1007/s00521-020-05611-1. [Google Scholar] [PubMed] [CrossRef]
31. T. A. Wotaifi and B. N. Dhannoon, “An effective hybrid deep neural network for Arabic fake news detection,” Baghdad Sci. J., vol. 20, no. 4, pp. 1392–1401, 2023. doi: 10.21123/bsj.2023.7427. [Google Scholar] [CrossRef]
32. A. Mohapatra, N. Thota, and P. Prakasam, “Fake news detection and classification using hybrid BiLSTM and self-attention model,” Multimed. Tools Appl., vol. 81, no. 1, pp. 18503–18519, 2022. doi: 10.1007/s11042-022-12764-9. [Google Scholar] [CrossRef]
33. Y. Yu, X. Si, C. Hu, and J. Zhang, “A review of recurrent neural networks: LSTM cells and network architectures,” Neural Comput., vol. 31, no. 7, pp. 1235–1270, 2019. doi: 10.1162/neco_a_01199. [Google Scholar] [PubMed] [CrossRef]
34. B. Jikadara, “Fake news detection,” Kaggle Datasets, 2023. Accessed: Apr. 01, 2024. [Online]. Available: https://www.kaggle.com/datasets/bhavikjikadara/fake-news-detection [Google Scholar]
Cite This Article
 Copyright © 2024 The Author(s). Published by Tech Science Press.
This work is licensed under a Creative Commons Attribution 4.0 International License , which permits unrestricted use, distribution, and reproduction in any medium, provided the original work is properly cited.
 Downloads
 Citation Tools