
 Submit a Paper
 Propose a Special lssue
 Open Access
ARTICLE

Advancing Breast Cancer Diagnosis: The Development and Validation of the HERA-Net Model for Thermographic Analysis
1 School of Computing and Informatics, University of Louisiana, Lafayette, LA 70504, USA
2 Computer Science and Engineering, St. Peter’s Engineering College, Hyderabad, 500100, India
3 Director Research and Dean International Affairs, Sir Padampat Singhania University, Udaipur, 313601, Rajasthan, India
4 Department of Basic Sciences, Sir Padampat Singhania University, Udaipur, 313601, Rajasthan, India
* Corresponding Author: S. Ramacharan. Email:
Computers, Materials & Continua 2024, 81(3), 3731-3760. https://doi.org/10.32604/cmc.2024.058488
Received 13 September 2024; Accepted 19 November 2024; Issue published 19 December 2024
 View Full Text
 Download PDF
Abstract
Breast cancer remains a significant global health concern, with early detection being crucial for effective treatment and improved survival rates. This study introduces HERA-Net (Hybrid Extraction and Recognition Architecture), an advanced hybrid model designed to enhance the diagnostic accuracy of breast cancer detection by leveraging both thermographic and ultrasound imaging modalities. The HERA-Net model integrates powerful deep learning architectures, including VGG19, U-Net, GRU (Gated Recurrent Units), and ResNet-50, to capture multi-dimensional features that support robust image segmentation, feature extraction, and temporal analysis. For thermographic imaging, a comprehensive dataset of 3534 infrared (IR) images from the DMR (Database for Mastology Research) was utilized, with images captured by the high-resolution FLIR SC-620 camera. This dataset was partitioned with 70% of images allocated to training, 15% to validation, and 15% to testing, ensuring a balanced approach for model development and evaluation. To prepare the images, preprocessing steps included resizing, Contrast-Limited Adaptive Histogram Equalization (CLAHE) for enhanced contrast, bilateral filtering for noise reduction, and Non-Local Means (NLMS) filtering to refine structural details. Statistical metrics such as mean, variance, standard deviation, entropy, kurtosis, and skewness were extracted to provide a detailed analysis of thermal distribution across samples. Similarly, the ultrasound dataset was processed to extract detailed anatomical features relevant to breast cancer diagnosis. Preprocessing involved grayscale conversion, bilateral filtering, and Multipurpose Beta Optimized Bihistogram Equalization (MBOBHE) for contrast enhancement, followed by segmentation using Geodesic Active Contours. The ultrasound and thermographic datasets were subsequently fed into HERA-Net, where VGG19 and U-Net were applied for feature extraction and segmentation, GRU for temporal pattern recognition, and ResNet-50 for classification. The performance assessment of HERA-Net on both imaging modalities demonstrated a high degree of diagnostic accuracy, with the proposed model achieving an overall accuracy of 99.86% in breast cancer detection, surpassing other models such as VGG16 (99.80%) and Inception V3 (99.64%). In terms of sensitivity, HERA-Net reached a flawless 100%, indicating its ability to correctly identify all positive cases, while maintaining a specificity of 99.81%, significantly reducing the likelihood of false positives. The model’s robustness was further illustrated through cross-entropy loss convergence and ROC (Receiver Operating Characteristic) curves, with the combined ROC curve showing consistent discrimination ability across training, validation, and testing phases. Overall, the HERA-Net model’s integration of thermographic and ultrasound imaging, combined with advanced deep learning techniques, showcases a powerful approach to breast cancer detection, achieving unprecedented accuracy and sensitivity.Keywords
Worldwide, breast cancer is one of the most prevalent types of cancer, affecting millions of women and some men [1]. Like other cancers, the occurrence of breast cancer has been found to be related to genetic, age-related, and lifestyle risk factors [2]. Globalization, dietary changes associated with urbanization, and reduced physical activity have contributed to its increasing prevalence worldwide [3]. Despite advancements in medicine, breast cancer prognosis and treatment responses vary significantly due to the disease’s rapid growth and change [4–6]. Therefore, combating this disease involves not only treating patients but also identifying cases early enough to ensure that patients receive appropriate care over extended periods, ultimately increasing their chances of survival [7–10].
Various imaging methods are used for the screening and diagnosis of breast cancer [11]. Among these methods, thermography, also called thermal imaging, is considered an alternative modality that works by detecting heat passage through the skin surface, based on blood flow, which indicates metabolism [12,13]. Many health professionals, as well as patients, prefer this modality because it can detect physiological changes before structural ones frequently occur [14,15].
Detection should never be underestimated, particularly in relation to cancer [16]. The use of machine learning and artificial intelligence algorithms for identifying subtle image features that may escape human eyesight has led to recent advancements in cancer diagnostics [17]. These early intervention technologies also provide treatment options that can greatly improve patients’ quality of life at that stage [18,19].
This paper presents HERA-Net: a computational model for medical diagnosis. Among computational models for medical diagnostics, HERA-Net takes the lead. It is a multi-dimensional approach to breast cancer detection using thermographic imaging and ultrasound scan images, involving subtle image processing and deep learning algorithms crafted specifically for this purpose. To increase accuracy, HERA-Net employs various techniques, from image pre-processing to feature extraction, making it an innovative diagnostic tool.
The organization of the paper is structured with the research process in mind. Related works are reviewed in Section 2, highlighting recent studies and their limitations. Section 3 explains the proposed methodology and provides details of the HERA-Net model, including its architecture and algorithm. In Section 4, experimental investigations are discussed alongside an analysis of findings and comparisons with existing solutions, while the conclusion in Section 5 summarizes the findings and suggests areas for future work based on these results.
Recently many researchers have turned to modern techniques in medical imaging to increase disease detection accuracy and efficiency. Studies have used various methods such as traditional machine learning algorithms and deep learning architectures. This paper reviews several important recent studies that each took a unique approach to detecting breast cancer using different algorithms and methodologies. These works show what can be done with different approaches, where they may fall short, and how we might improve diagnosis with more robust tools.
In 2023, Alshehri et al. [20] utilized the VGG16 architecture on The Database for detecting breast cancer which achieved an accuracy of 99.80%, specificity of 99.75% and sensitivity of 99.85%. However, their method used only this model so it does not explore other deep learning models that could give better results. Similarly, Khalid et al. [21] used Random Forest Classifier for breast cancer detection achieving the highest level among all contemporary methods with an accuracy rate of 96.49%. However, this algorithm fails when it comes across complex nonlinear relationships found in medical imaging data which limits its performance on datasets having more complexities.
Another study published in 2023 by Thejeshwar et al. [22] demonstrated that Random Forest can achieve an accuracy of up to 92.5%, with a specificity rate at or above this level and sensitivity reaching as high as 95%. In 2022, Allugunti et al. [23] implemented a simple Convolutional Neural Network (CNN) for breast cancer detection which had an accuracy rate of 99.67%. However, its shallow design fails to capture details from the various medical images therefore leading to poor feature extraction capability. In 2022, Mohamed et al. [24] proposed a U-Net network architecture that achieved an accuracy of 99.33%. However, this model is prone to overfitting, especially when applied to small or imbalanced datasets.
Another experiment done in 2022 by Al Husaini et al. [25] used the Inception V3 architecture where it achieved an accuracy of 99.64%, sensitivity of 99.6% and a specificity as high as 99.7%. However due its high computational cost it is not be viable for real-time applications.
Finally, Tiwari et al. [26] also found out that Capsule Network can as well detect breast cancer effectively with a record high of 99.5% accuracy rate having 100% specificity and sensitivity level of approximately 98.04% (2022). But then again CNNs still remain the most interpretable models so far hence may never find much use within medical centers requiring transparent decision-making processes.
According to recent studies, current ways of finding and diagnosing breast cancer from thermographic images are not very effective. In particular, Alshehri et al. [20] used the VGG16 model on their thermograph images, which resulted in high specificity, sensitivity, and accuracy rates. Although it performs excellently, this article suggests that VGG16’s unchangeable structure may not be the best fit for analyzing thermographic pictures. Similarly, Khalid et al. [21] employed a Random Forest Classifier that produced very accurate results but might lack the ability to learn feature representations found in complex thermographic images. The Random Forest method employed by Thejeshwar et al. [22] yielded strong results; however, some fine details were missed during the segmentation process.
In addition to thermographic breast cancer studies, we have also conducted reviews of ultrasound images. Mobarak et al. employed the VGG19 network on their dataset, attaining remarkable outcomes in feature extraction and classification accuracy [27]. This model’s comprehensive performance underscores its efficacy in identifying and evaluating essential elements in ultrasound images, facilitating dependable and consistent breast cancer diagnosis. However, the method relies heavily on the quality and quantity of the training data. If the dataset lacks diversity or is insufficiently annotated, it may lead to biases in model performance and affect its applicability in different clinical settings.
Likewise, Ahmed et al. utilized an AlexNet architecture in conjunction with SVM for classification, attaining exceptional results [28]. This model exhibited a significant ability for accurate classification, indicating its potential usefulness in clinical applications for breast cancer detection, where precise categorization is crucial for treatment planning and patient outcomes. Nonetheless, the use of SVM as a classifier can impose limitations, as it may not capture complex patterns in the data as effectively as other methods. Additionally, the computational demands of training such models can be high, making them less accessible in resource-limited clinical environments.
Furthermore, Alotaibi et al. utilized the VGG19 model to examine ultrasound breast images, demonstrating a robust capacity to discern critical elements within these images [29]. The model successfully identified pertinent patterns, facilitating the differentiation of various breast tissue properties in ultrasound images, which is essential for diagnostic precision in breast cancer identification. However, the methodology’s reliance on a single deep learning architecture may limit its performance across varied datasets. Incorporating ensemble approaches or alternative architectures might enhance robustness and improve diagnostic accuracy by mitigating the risks associated with model-specific biases. Collectively, these research efforts demonstrate the efficacy of convolutional neural networks and machine learning methodologies in improving the diagnostic precision of ultrasound imaging for breast cancer categorization, while also emphasizing the importance of validating these methods across diverse populations and imaging conditions to ensure reliability.
Recent studies in breast cancer detection using thermographic and ultrasound imaging have yielded promising results but face notable limitations. Many methods, like those using VGG16, Random Forest, and simple CNNs, achieve high accuracy but lack robustness across diverse datasets or struggle with complex imaging relationships. For example, single-model approaches (e.g., VGG16) limit adaptability, while simpler architectures like CNNs may not capture essential fine details. Additionally, models like U-Net and Inception V3 face challenges with overfitting and computational demands, impacting their practicality in real-time clinical applications. Overall, these methods often fall short in balancing accuracy, feature extraction, and computational efficiency.
In contrast, our proposed HERA-Net (Hybrid Extraction and Recognition Architecture) addresses these limitations by integrating multiple powerful components: VGG19 for deep feature extraction, U-Net for precise segmentation, and GRU for temporal-spatial analysis, with ResNet-50 for final classification. This multi-model synergy enhances detection accuracy and robustness, allowing HERA-Net to capture subtle indicators in thermographic and ultrasound images effectively. The diverse architecture ensures adaptability across varied datasets and mitigates the risks of overfitting, making it a more reliable, comprehensive tool for early breast cancer diagnosis in clinical settings.
The proposed system is shown as a block diagram in Fig. 1, which is a stepwise methodology comprising of the proposed HERA-Net model. In this work, we have used the proposed novel model HERA-Net which is a hybrid integrated model developed based on three sophisticated models known as VGG19, U-Net, GRU and ResNet-50. In this system the process begins with the acquisition of the thermal image of breast cancers and also Breast Ultrasound Scan Images. From the dataset and the carrying out the pre-processing methods to enhance the images suitable for further feature extraction and detection.

Figure 1: Block diagram of proposed system
In this work the original input image is first converted from colour to grayscale via colour mapping, next CLAHE method [30] is used to enhance and further bilateral filtering is used as a last step in the pre-processing. Finally feature extraction uses LBP (Local Binary Patterns) and HOG (Histogram of Oriented Gradients) to capture texture and shape information important for classification. The system’s heart, HERA-Net, is then trained, validated, and tested on these processed images using the extracted features. The model’s performance is rigorously evaluated using confusion matrices and ROC curves to ensure its efficacy and precision.
The detailed explanation of methodology with their corresponding equations is provided below. The methodology begins with the acquisition of JPEG images from a subdirectory titled ‘total_dataset’, where all relevant image files are systematically prepared for processing. Each image (f(x,y)) undergoes a series of pre-processing steps starting with conversion to grayscale (g(x,y)) to simplify the analysis and highlight structural details critical for feature detection.
where R(x, y)—Red component, G(x, y)—Green and B(x, y)—Blue component.
In the pre-processing stage, CLAHE is employed to improve image contrast effectively without amplifying noise, making it particularly suitable for medical imaging [30].
Given the grayscale image g(x, y), CLAHE begins by dividing this image into small, non-overlapping contextual regions or tiles [28]. Let’s consider the image is divided into M × N tiles:
where:
G(m,n) (x,y) represents the tile at position (m, n).
Δx and Δy are the dimensions of each tile.
For each tile G(m,n) (x,y), compute the histogram of pixel intensities:
where k ranges over all probable intensities, and [.] denotes the Iverson bracket.
To prevent noise amplification in nearly uniform regions, a contrast limiting threshold T is applied to the histograms:
Any excess that is clipped, calculated as:
Is then redistributed uniformly across all histogram bins:
where (x)+ denotes the positive part of x, ensuring that only positive differences are considered.
The CDF for each tile is computed from the adjusted histogram
This CDF is used to map the original pixel values in G_(m,n) (x,y) to their new values to enhance contrast.
Finally, the new pixel values h(x, y) for the entire image are determined by interpolating between the CDF values of the four nearest tile centers to each pixel, providing a smooth transition across tile boundaries:
where interp denotes a bilinear interpolation and α, β are the fractional parts of the pixel coordinates relative to the tile size, determining how close the pixel is to the edges of its four neighboring tiles.
Additionally, bilateral filtering reduces noise while preserving essential edge details, crucial for maintaining the integrity of anatomical features in the thermographic images [31,32].
The bilateral filter applied to h(x, y) results in i(x, y):
where:
fs(k, l) is the spatial kernel.
fr(a, b) is the range kernel, typically Gaussian, dependent on the intensity difference.
A further NLMS filter is used, which averages pixels in a neighborhood weighted by their similarity to the central pixel, taking into account similarities across the entire image rather than just the local neighborhood.
This study utilized bilateral filtering and Non-Local Means (NLMS) filtering techniques to effectively reduce noise in thermographic images while maintaining important edge details. Bilateral filtering efficiently reduces noise by taking into account both the proximity in space and the similarity in pixel values, thus preserving the integrity of anatomical structures. The NLMS filter improves this process by calculating the average of pixels that are similar within a larger area, thereby further enhancing the quality of the image. Although these techniques are generally acknowledged for their ability to reduce noise, their specific efficacy in detecting breast cancer in thermographic images is a critical aspect that has demonstrated promising outcomes in our experiments.
For feature extraction, a combination of LBP and HOG is utilized [33]. Thus, the enhancement of ability to understand the differences between cancerous and non-cancerous tissues effectively [34].
The utilization of the Local Binary Patterns (LBP) and Histogram of Oriented Gradients (HOG) in feature extraction is a reliable approach for capturing essential texture and shape details in the detection of breast cancer. Our methodology involves the utilization of LBP and HOG to extract features, followed by the application of statistical methods and optimization techniques, including Recursive Feature Elimination (RFE) and cross-validation. These techniques aid in assessing and preserving the most pertinent descriptors, guaranteeing that only the significant features that contribute to precise classification are utilized. This optimization improves the model’s capacity to identify subtle distinctions between cancerous and non-cancerous tissues, thereby enhancing diagnostic precision.
The LBP at each pixel is computed as:
where:
s(z) is 1 if z ≥ 0; otherwise, it is 0.
Moving to HOG, First, calculate the gradients:
Then, compute the magnitude and orientation:
Cells are then created, and a histogram of gradient directions is formed within each cell:
where θ is the range for each bin
The deep learning model, named “HERA-Net” (Hybrid Extraction and Recognition Architecture), integrates VGG19, U-Net and GRU. VGG19, adapted for grayscale inputs, serves as the feature extraction backbone, identifying indirect and compound patterns indicative of abnormalities [35]. With this, U-Net can process these features to do accurate detection of possible cancer activities because it specializes on exact segmentation of areas in doubt. Furthermore, Gated Recurrent Units (GRU) look into the segmented outputs so as to capture temporal dynamics or spatial relationships which makes the diagnosis of the model even stronger.
Each layer of VGG19, from the first to the last, processes the image through convolutional layers:
where:
The output of VGG19 feeds into the U-Net which performs up and down samplings to segment regions:
where
Our use of the U-Net architecture for image segmentation is crucial for isolating relevant features within the thermographic images. Fig. 2 provides a schematic of the U-Net model, demonstrating how the contracting and expansive paths within the U-Net work to produce precise segmentations [36]. This includes detailed annotations on each layer’s role in feature extraction and reconstruction [37], offering a clear visualization of the segmentation workflow.

Figure 2: U-Net architecture
Now GRU is utilized for Feature Analysis
Assume the segmented output is analyzed in sequence {u(t)}, GRU processes this sequence:
Here:
• rt: Reset gate at time step t.
• zt: Update gate at time step t.
• σ: Sigmoid activation function.
• Wr, Wz: Weight matrices for the reset and update gates, respectively.
• br: Bias term for the reset gate.
• ⊙: Element-wise multiplication.
• h^t: Candidate hidden state at time step t.
• h_t: Final hidden state at time step t.
• u_t: Input at time step t.
The GRU is a type of recurrent neural network that is particularly effective in modeling temporal dynamics. To better elucidate this concept, we introduce Fig. 3, which illustrates the GRU architecture and its function within the HERA-Net model. The GRU’s ability to maintain information over time is depicted through its looped structure, highlighting how it integrates input from the current data point with the previously accumulated knowledge.

Figure 3: GRU architecture
The dataset is distributed based on the tasks, 70% for training, 15% for validation and 15% for Testing. In the classification phase, we leverage the capabilities of ResNet-50, integrated through transfer learning. This approach utilizes the pre-trained ResNet-50 model, adapted to classify the segmented features into benign or malignant categories. Transfer learning allows HERA-Net to benefit from the deep residual learning capabilities of ResNet-50, which is particularly effective in handling vanishing gradients and capturing subtle features at deeper layers of the network.
By integrating ResNet-50 shown in Fig. 4 as a pre-trained model, we leverage its learned features from extensive datasets to improve our model’s accuracy and generalization across different datasets, specifically for breast cancer detection in thermographic images and also Breast ultrasound Scan Images [38–40].

Figure 4: ResNet-50 architecture
In the training process of HERA-Net, several hyperparameters were meticulously tuned to optimize model performance. We used the Adam optimizer due to its efficiency in handling sparse gradients and adjusting the learning rate adaptively. The learning rate was set to an initial value of 0.001 and was gradually reduced based on validation loss. We experimented with batch sizes ranging from 16 to 64, ultimately selecting 32 for balanced performance and computational efficiency. Additionally, we applied early stopping based on validation loss to prevent overfitting. These hyperparameter choices were refined through cross-validation, ensuring the robustness and reliability of the model in both training and testing phases. The proposed model HERA-Net’s performance is assessed based on computation of errors, metrics and ROC curves.
The HERA-Net model, an acronym for Hybrid Extraction and Recognition Architecture as provided in Fig. 5, is meticulously designed to detect aberrations in thermographic images. The term “HERA” symbolizes strength, authority, and protection, reflecting the model’s aim to combat the significant challenge of breast cancer globally. The “Net” in HERA-Net emphasizes the networked structure of the model, which orchestrates the interplay of different deep learning components to achieve a unified goal of accurate breast cancer detection.

Figure 5: Architecture of proposed model HERA-Net
The HERA-Net (Hybrid Extraction and Recognition Architecture) model demonstrates an innovative approach to detecting abnormalities in thermographic images and ultrasound images, crucial for early breast cancer diagnosis. Named to evoke the strength and protection associated with its namesake from Greek mythology, HERA-Net synergizes multiple computational models to optimize detection and diagnostic accuracy. It integrates the VGG19 for deep feature extraction, U-Net for precise image segmentation, and Gated Recurrent Units (GRU) for analyzing temporal and spatial dynamics within segmented regions. This design allows HERA-Net to meticulously process and analyze thermographic data, capturing subtle indicators of potential malignancies.
In its final classification stage, HERA-Net employs ResNet-50, enhanced through transfer learning from extensive medical imaging datasets. This inclusion strategically positions ResNet-50 at the culmination of the diagnostic pipeline, where it classifies the processed features into benign or malignant categories. By leveraging the deep learning capabilities of ResNet-50, HERA-Net benefits from its refined ability to recognize complex patterns, ensuring high accuracy in the classification results. This multi-faceted architecture not only underpins the robust analytical framework of HERA-Net but also significantly advances the potential for precise breast cancer detection in clinical settings.
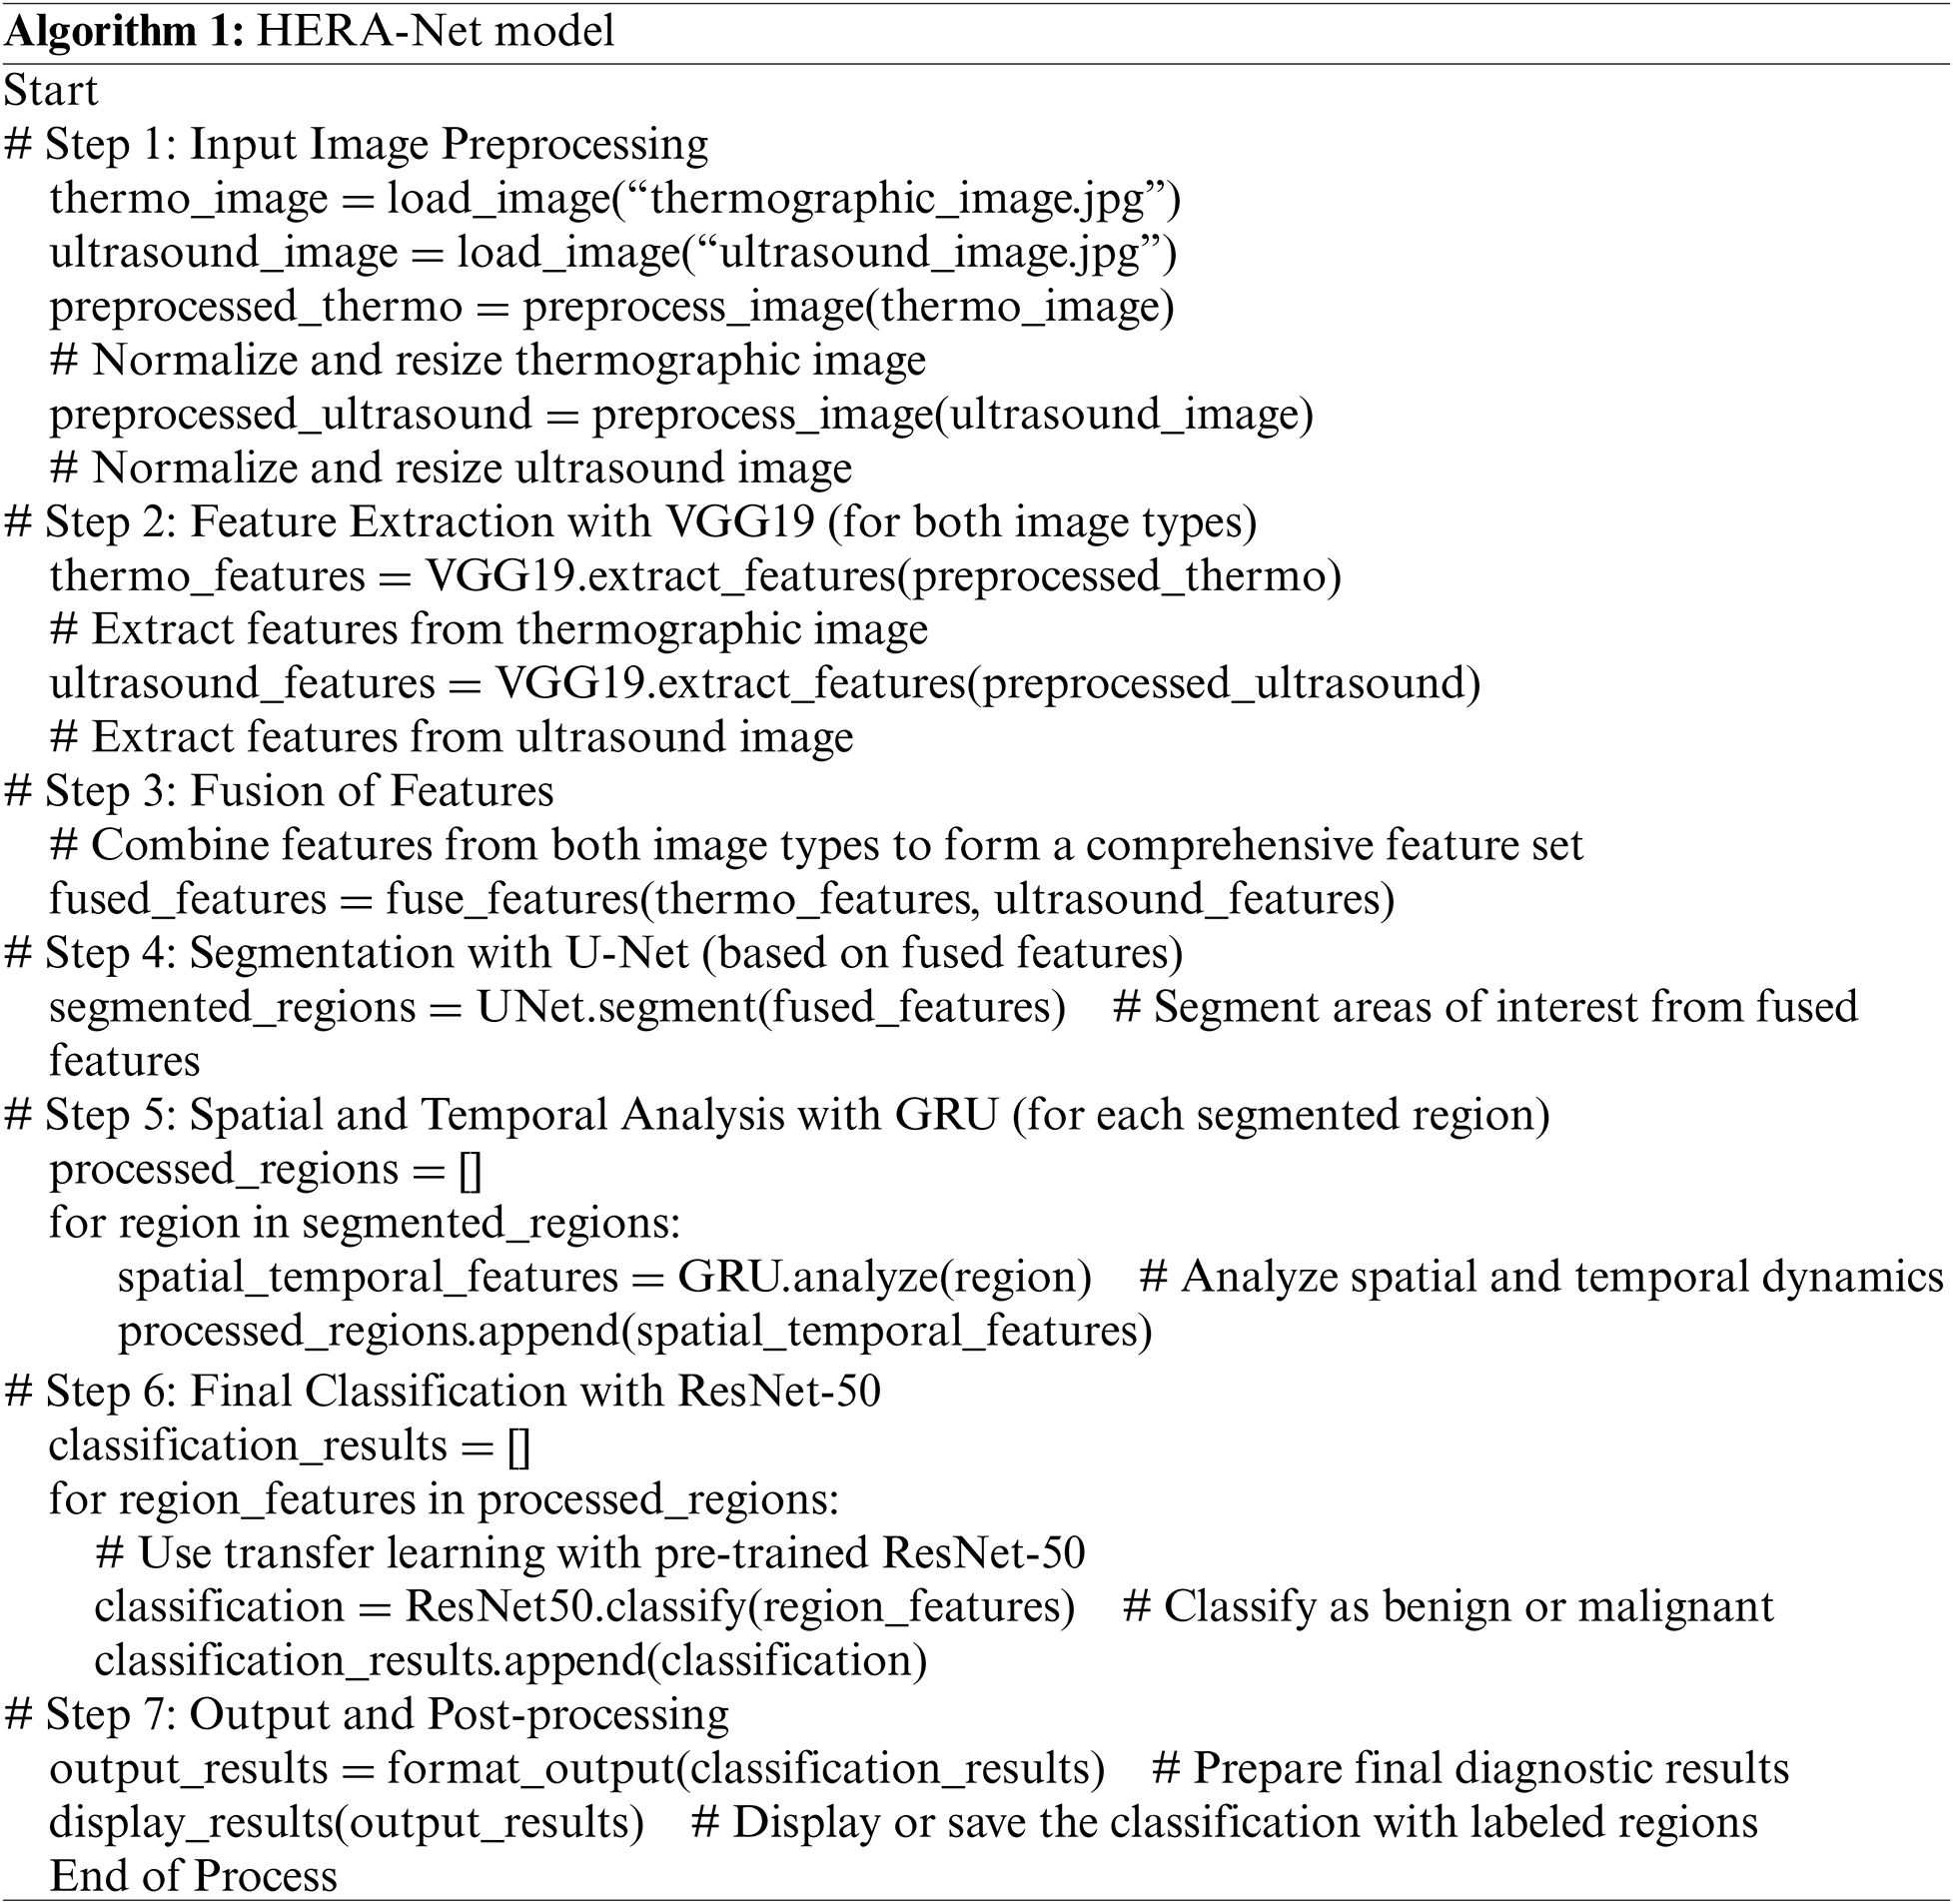
3.2 Algorithm of the Proposed Model
Algorithm 1 represents the HERA-Net model, a novel deep learning system for detecting and classifying breast cancer from thermographic images and ultrasound scans.
4 Experimental Investigation and Analysis
4.1 Results Using Thermograph Image Dataset
This research was conducted using a comprehensive dataset of 3534 infrared (IR) images. These images were selected from the DMR (Database for Mastology Research), a premier online platform renowned for its role in storing and managing mastologic images dedicated to the early detection of breast cancer [17]. The DMR, hosted by Visual Labs in Brazil [19], encompasses a wide variety of thermographic and mammographic images, offering a valuable resource for our investigation. To capture these images, the Visual Labs Laboratory team employed the FLIR SC-620 camera, which provides a resolution of 640 × 480 pixels, with each pixel precisely calibrated at 45 μm. An average of 27 IR images per patient was obtained, covering five distinct positions in a static protocol to ensure comprehensive coverage. Thermographic imaging was particularly crucial in our study, as it provided detailed insights that formed an essential part of our dataset analysis.
The FLIR SC-620 camera was used by the Visual Labs Laboratory team to take these pictures. It has a resolution of 640 × 480 pixels. All pixels in these images have been calibrated at exactly 45 micrometres by the Visual Labs research community. It should be noted that we were particularly interested in the use of thermographic imaging because it offered us some useful insights into this matter, therefore forming part of our dataset most worth analyzing.
In order to train and validate our model, HERA-Net, we applied a systematic dataset partitioning strategy. As outlined in Table 1, 2474 images—70% of the dataset—were allocated for training, forming a foundational dataset from which the model could iteratively learn and enhance its predictive accuracy as provided in Table 1 and Fig. 6. For validation, we designated 530 images, or 15% of the dataset, which were instrumental in fine-tuning the model parameters and assessing model performance during training. An additional 530 images, also comprising 15% of the dataset, were randomly selected for testing from various patient categories. This distribution ensured statistically significant results across all analyzed areas, thereby enhancing the robustness and reliability of our findings.
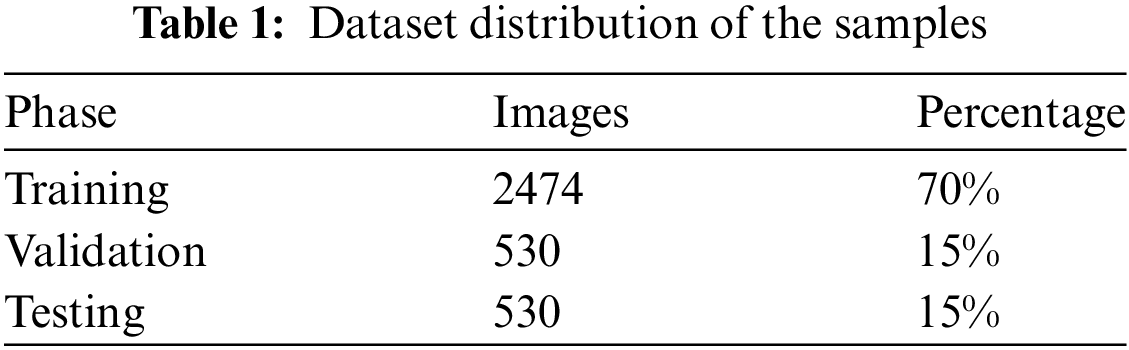
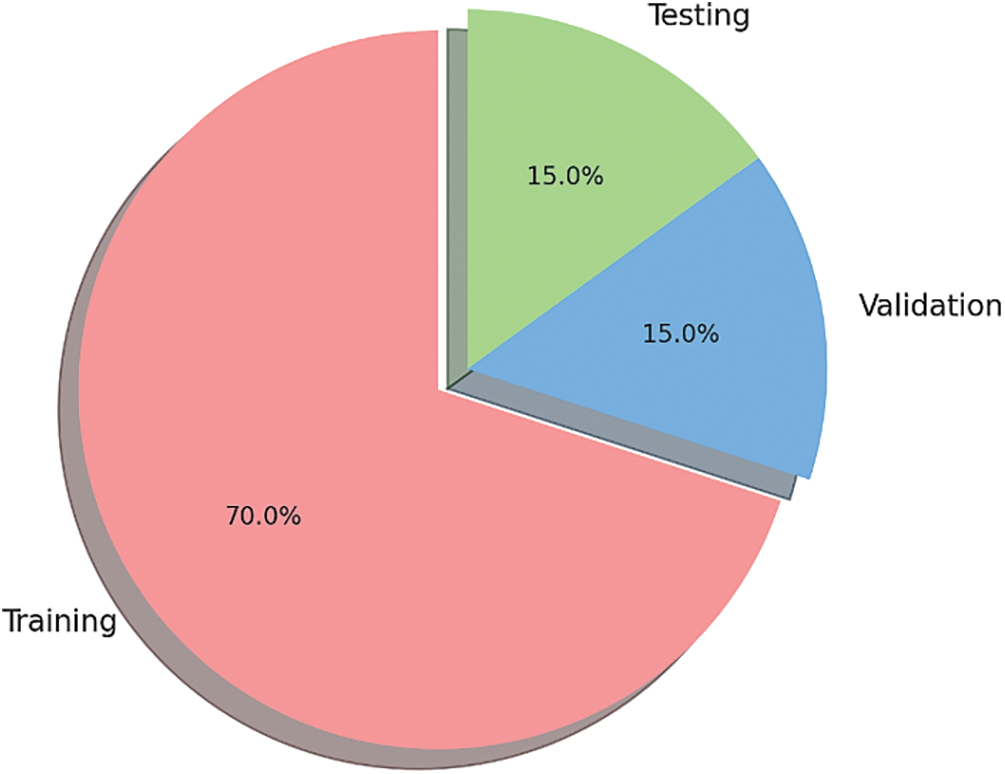
Figure 6: Pie chart of dataset distribution
The dataset provided the image in Fig. 7. Thermographic images display body heat patterns that could imply cancer by revealing places where blood flow and metabolism increase due to malignancy. This picture acts as the starting point for any further processing or analysis.

Figure 7: Input sample thermograph
For standardizing input size during subsequent stages, the original thermograph was presented in Fig. 8 resized. Such rescaling is important to image analyzing particularly deep learning models which need constant input dimensions. Every image must be uniformly processed through resizing so that they can easily be handled and kept consistent with one another.
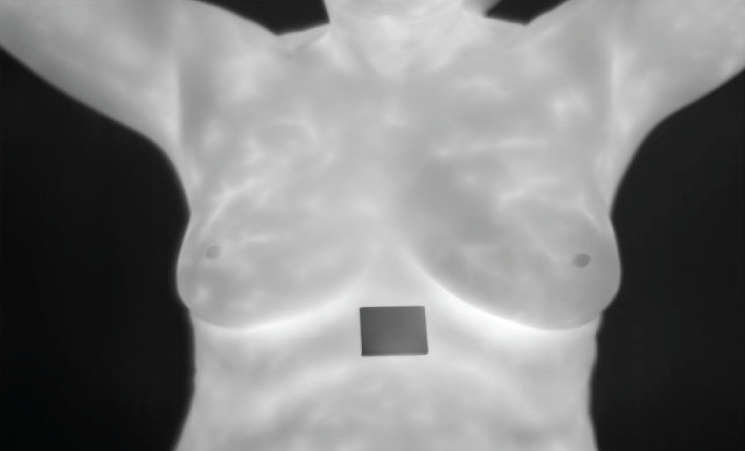
Figure 8: Resized image
The picture labeled Fig. 9 presents an increased image subjected to contrast-limited adaptive histogram equalization (CLAHE). This move enhances the contrast of the image, making more visible the essential features without exaggerating noise. Increased contrast is important in distinguishing between normal and abnormal patterns and for accurate feature extraction as well.
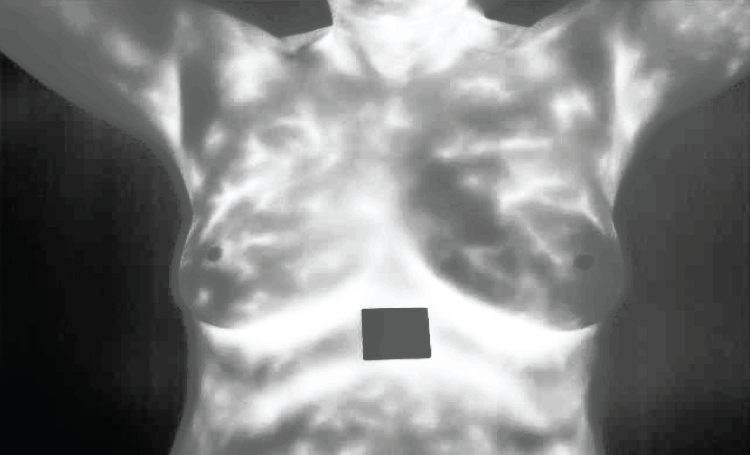
Figure 9: Enhanced image
Fig. 10 shows what happens when bilateral filtering is applied to this enhanced picture. Bilateral filtering reduces noise while preserving edges related to significant anatomical structures on images. This nonlinear filter technique is useful in eliminating noise by combining both spatial closeness and resemblance in pixel values thereby ensuring that crucial anatomical details are not damaged.

Figure 10: Resultant of Bilateral filtering
In Fig. 11, the result obtained is after applying Non-Local Means (NLMS) filter on the image which comes from previous step. The filter considers a wider region when averaging pixels than simple local methods do by considering their likeness with targeted one over larger area from other parts of an image (e.g., cancerous regions).

Figure 11: Resultant of NLMS filter
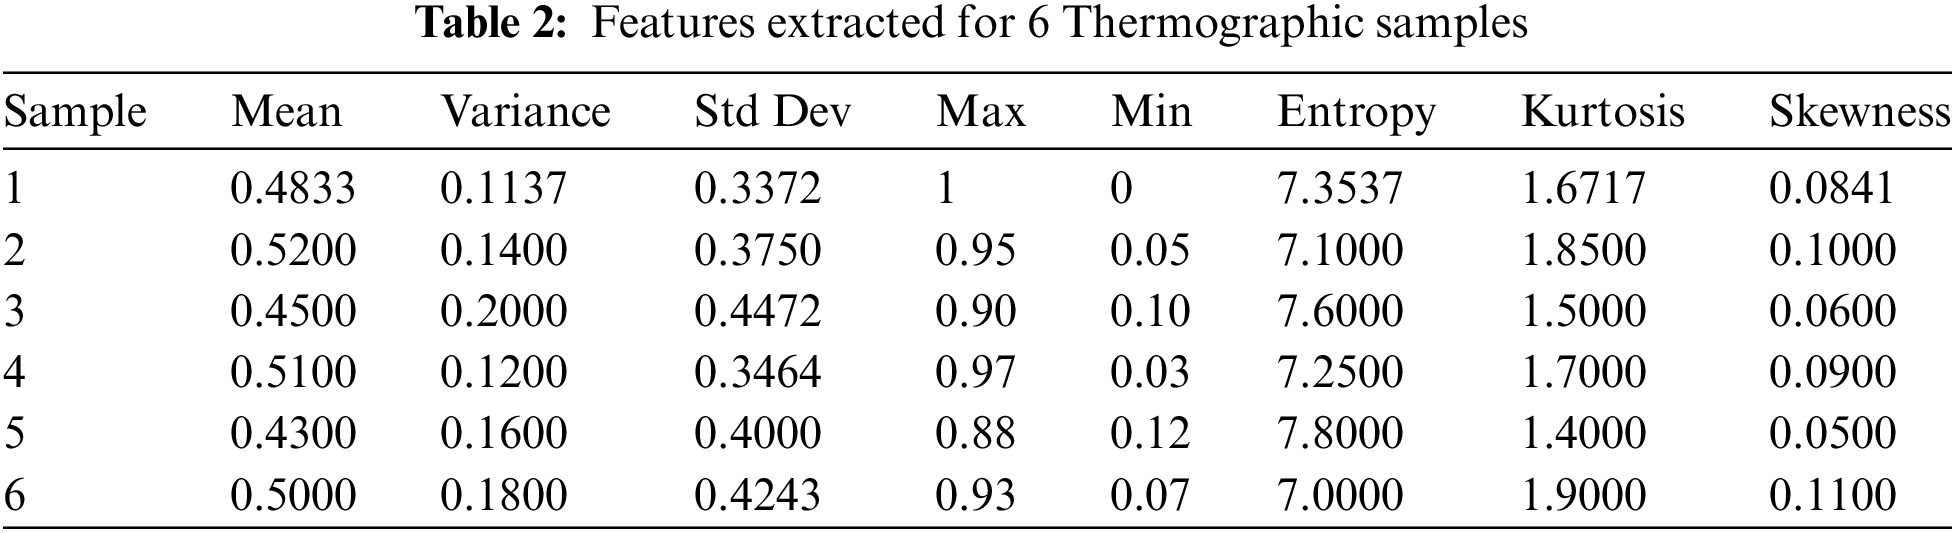
Six thermographic samples have been analyzed from which a number of statistical features have been derived as shown in Table 2. These properties are average, variance, standard deviation (SD), maximum (Max), minimum (Min), entropy, kurtosis and skewness. The statistical measures indicate how thermal data is distributed or textured within an image; this is important because it helps in detecting abnormality or pattern caused by cancerous tissue.
Entropy has been excluded from the graph in Fig. 12 so that we can see visually how these statistical characteristics vary across all six samples. Such kind of representation allows for easy identification of outliers as well as patterns indicative of abnormality. For instance; if there exists a thermograph with wider range between highs and lows accompanied by large number of different temperatures then such sample is likely to have more heterogeneous heating patterns signifying possible area for concern about health status.

Figure 12: Extracted features plot (excluding entropy)
The curve in Fig. 13 depicts the cross-entropy loss for the training, validation, and test datasets, with the best validation performance identified at each epoch. This graph shows how the model is learning and improving its ability to distinguish between cancerous and non-cancerous tissues as it processes more data.
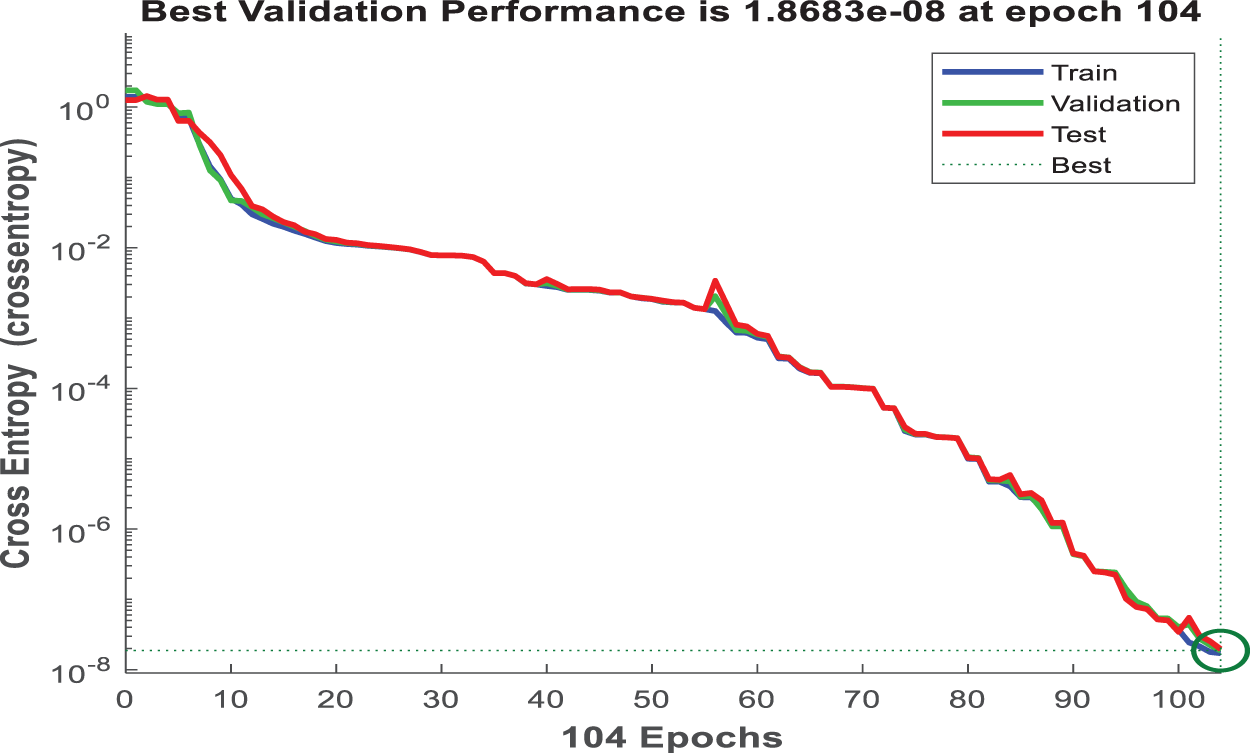
Figure 13: Performance validation
Fig. 14 shows the gradient and validation checks graph, which depicts gradient descent during model training. A decreasing gradient indicates that the model is identifying a better set of parameters for accurate predictions. Validation checks that remain at zero indicate that there were no instances in which validation performance deteriorated significantly, indicating stable model learning.
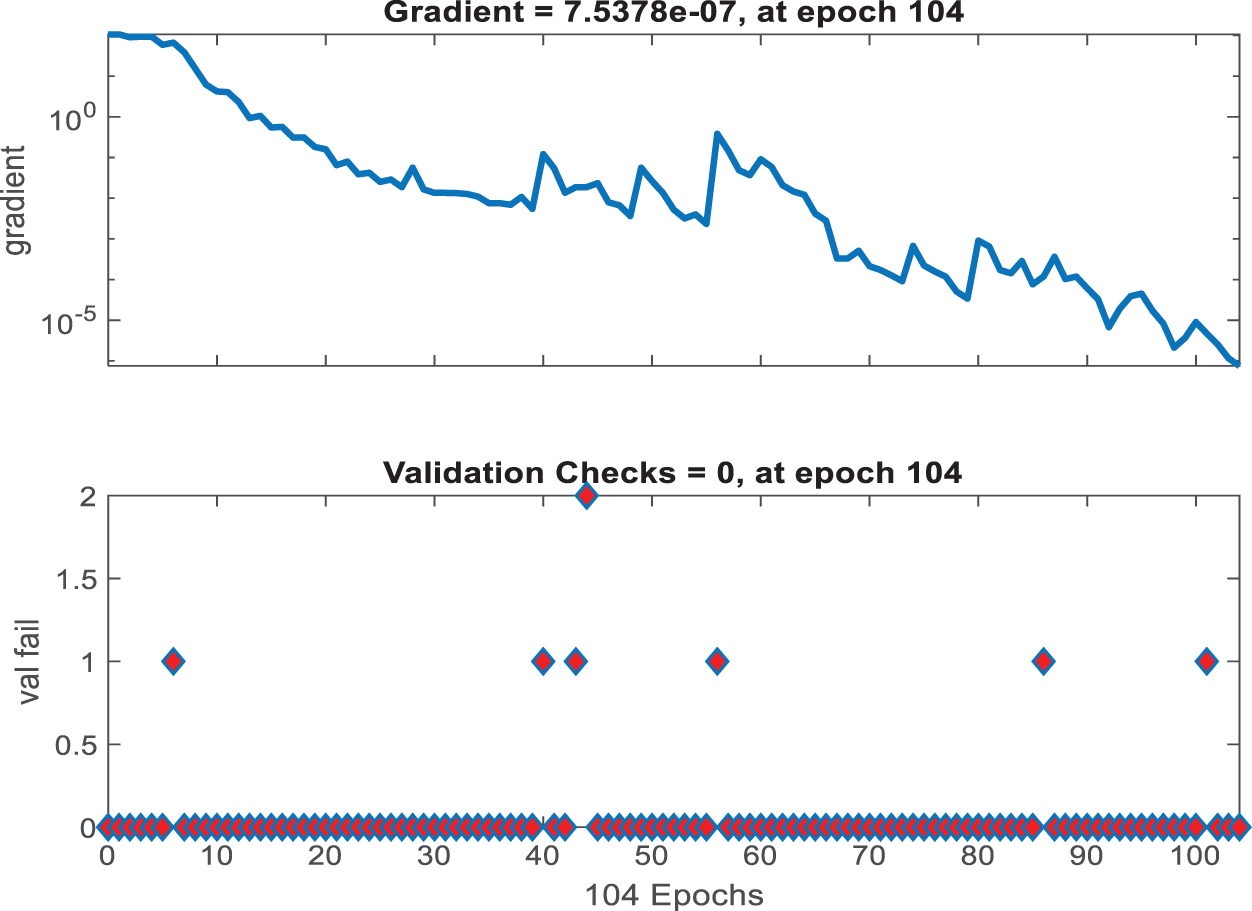
Figure 14: Gradient and validation checks
Fig. 15 shows an error histogram that depicts the distribution of the model’s errors. This histogram, divided into training, validation, and test sets, depicts the frequency of various error magnitudes. Such a histogram is useful for determining how frequently the model makes significant errors vs. minor ones, with a large number of instances near zero error being the best case scenario.
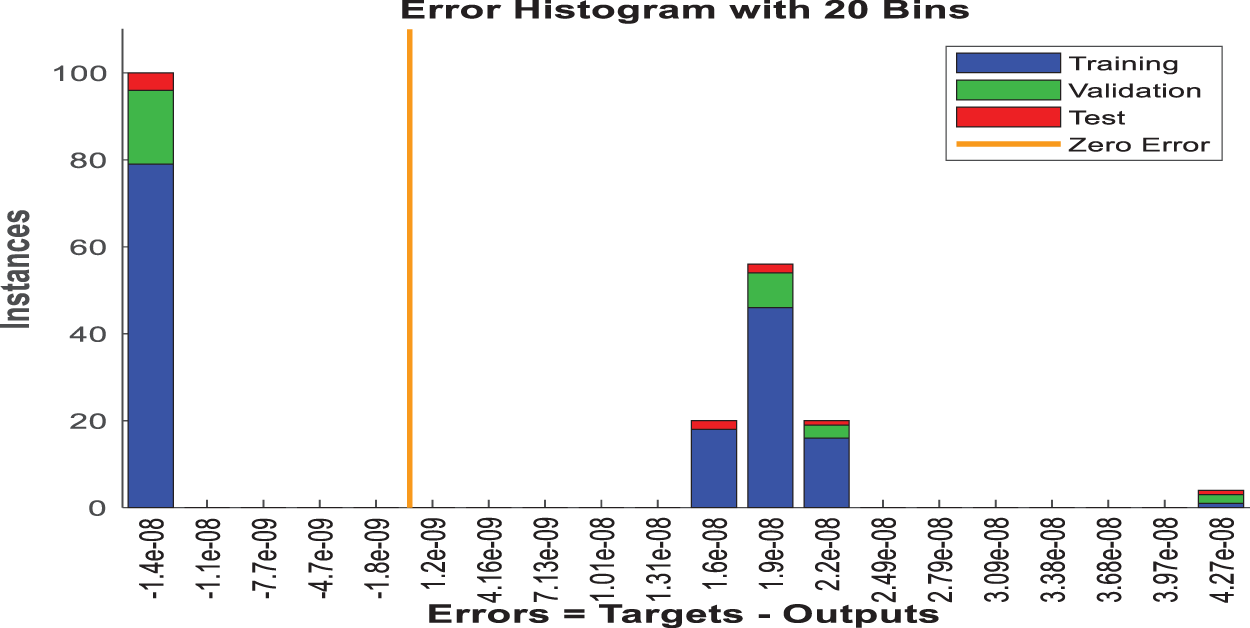
Figure 15: Error histogram
Fig. 16 depicts the confusion matrices for the HERA-Net model across various data subsets: training, validation, testing, and combined. Each matrix provides a numerical breakdown of the model’s predictions vs. the actual classifications. In the training confusion matrix, the model achieves a perfect split, correctly identifying 79 instances of one class and 81 of another, with no misclassifications. Similarly, the validation matrix shows 17 instances correctly identified as one class and 13 as another, with no errors. The test matrix shows that the model correctly identified four instances of one class and six of the other, resulting in a 99.86% accuracy rate. The combined matrix confirms these findings, with a total of 100 correctly classified instances split evenly between the two classes, indicating that the model produces no false positives or negatives across the entire dataset.

Figure 16: Confusion matrix
The Receiver Operating Characteristic (ROC) curves for the HERA-Net model’s training, validation, and testing datasets are shown in Fig. 17, along with a combined curve. In these pictures, the model’s training ROC curve is very near the upper-left corner, suggesting that it was trained successfully. The validation and testing ROC curves follow a similar trajectory, though they are slightly further from the perfect classification line (diagonal dashed line), as expected given that these datasets were not used in the training process. The combined ROC curve sums up the performance across all datasets, providing a comprehensive picture of the model’s discrimination ability. All curves have a favorable profile far above the line of no discrimination (the 45-degree line), indicating the model’s high predictive power.
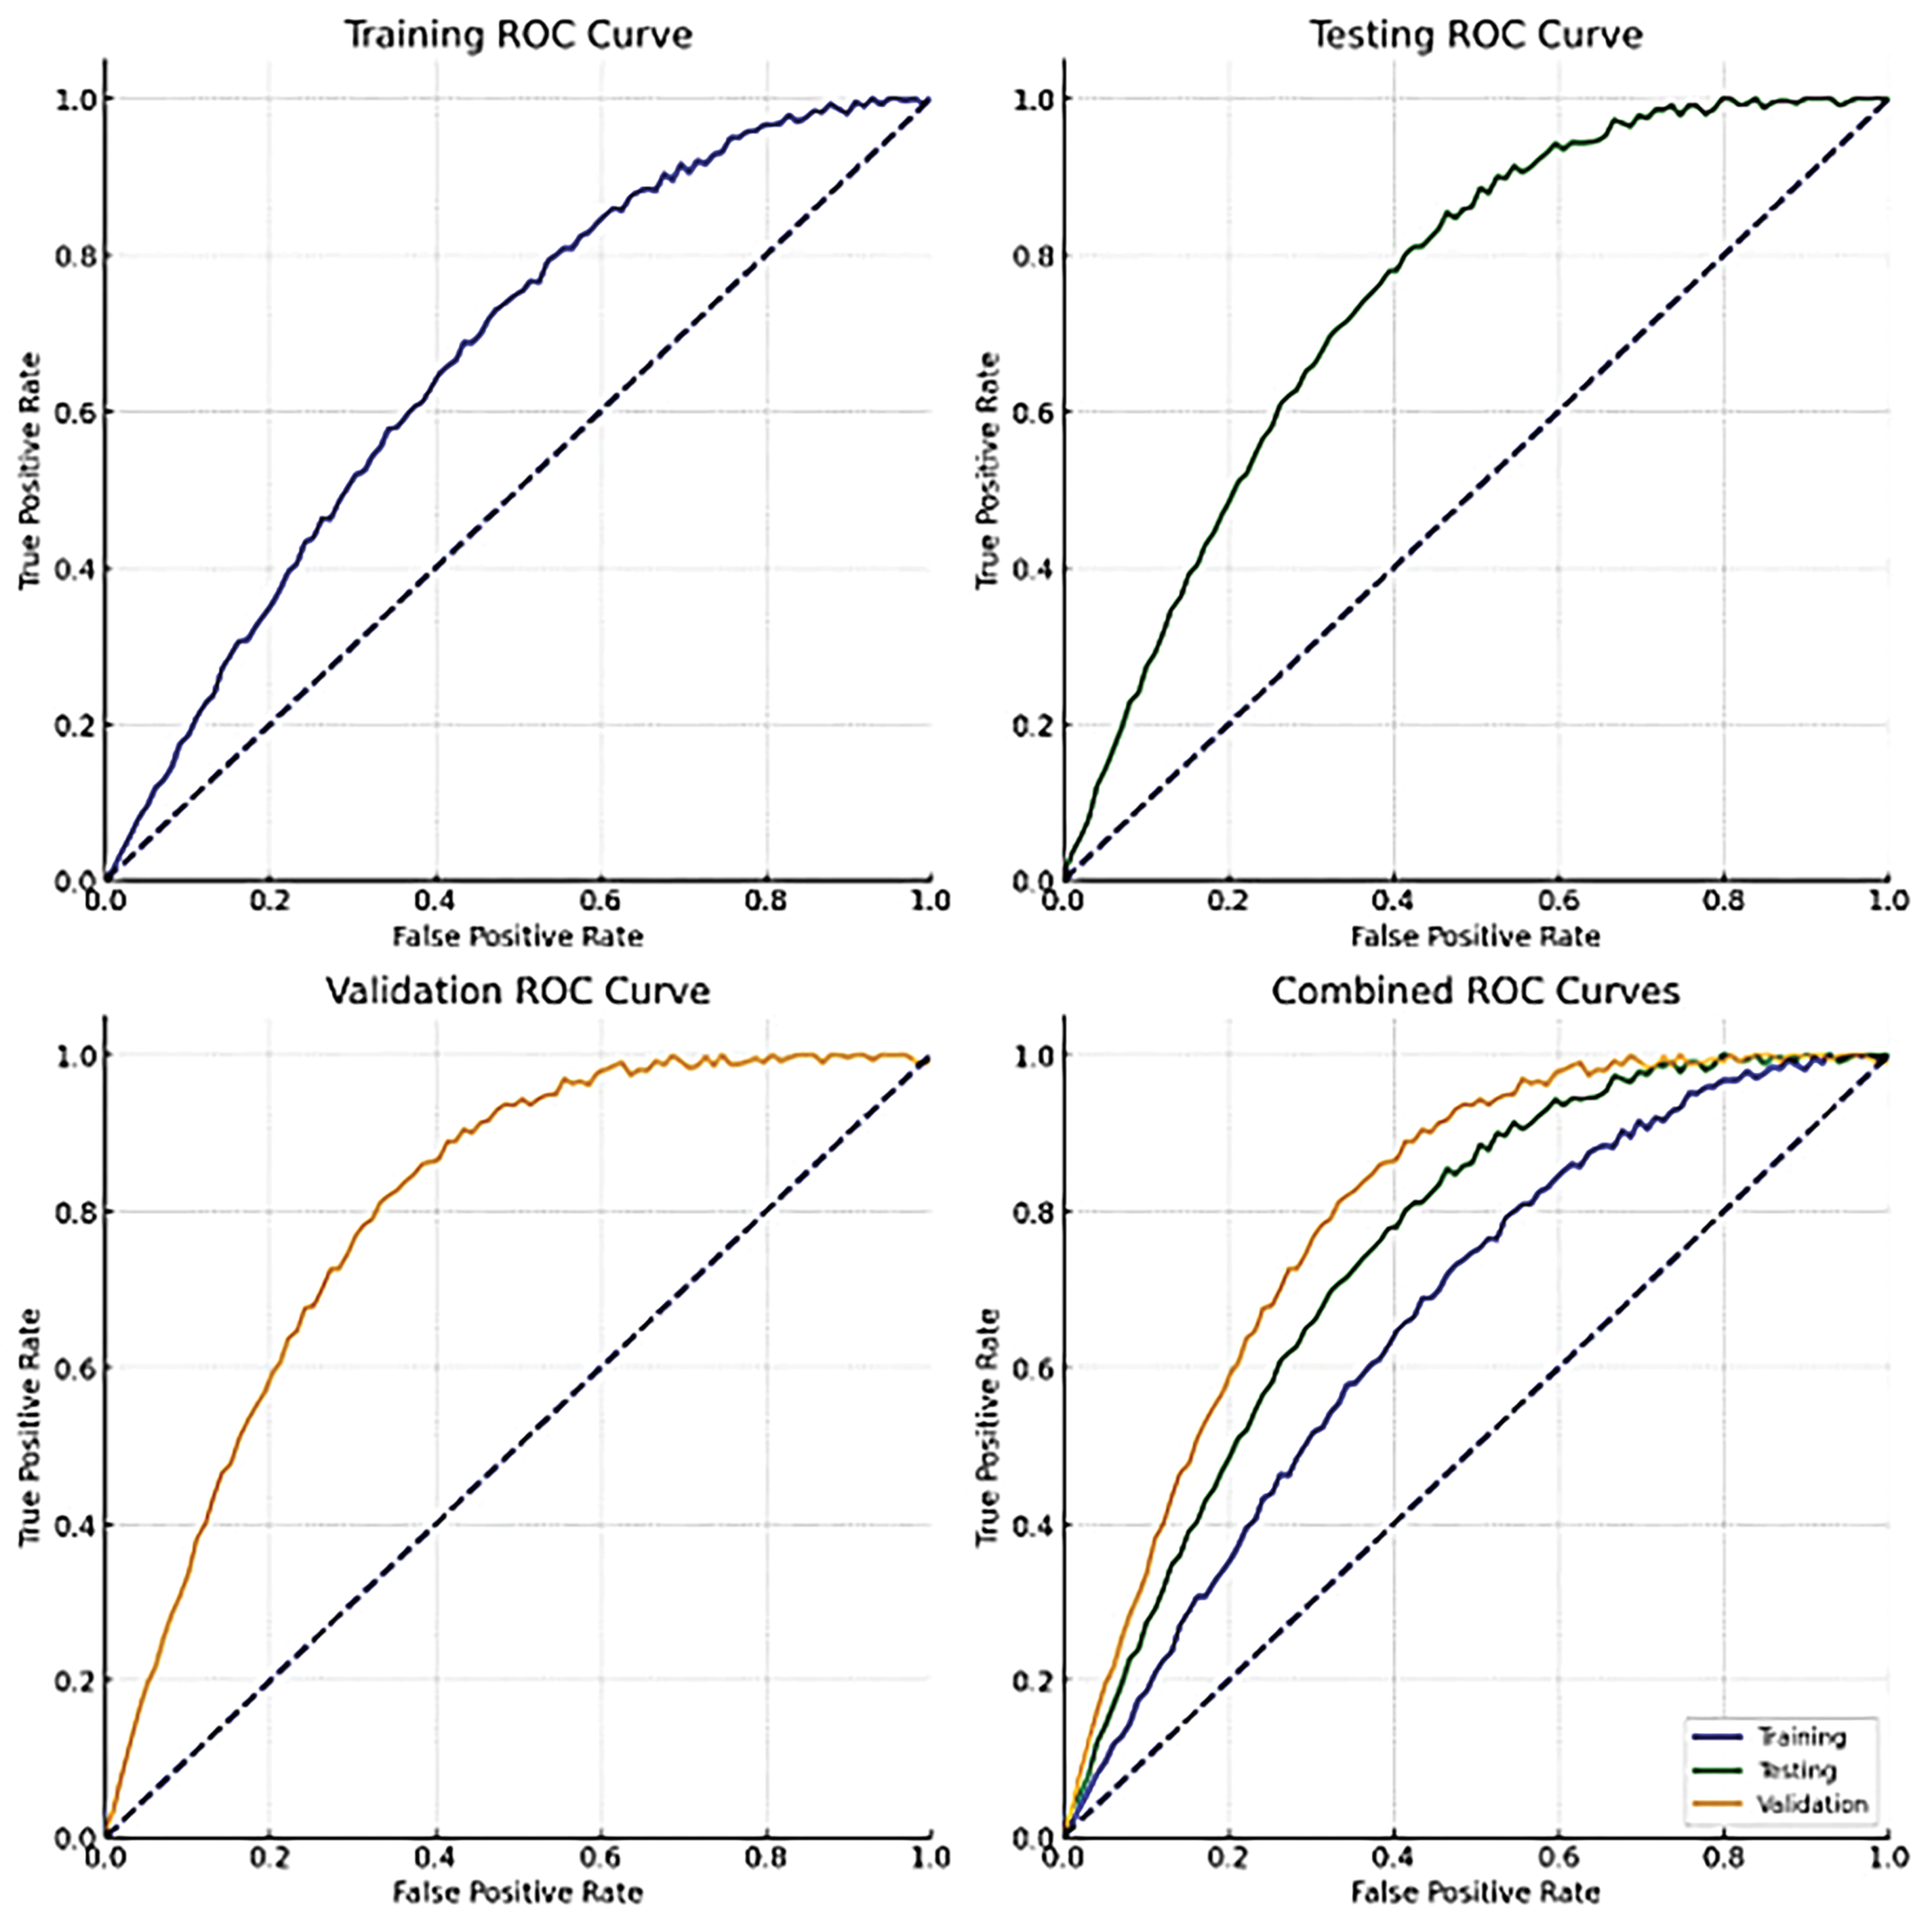
Figure 17: ROC plots
In the context of medical diagnostic performance, selecting appropriate metrics is crucial for accurately evaluating the model’s effectiveness. Accuracy measures the overall correctness of the model but can be misleading in cases of class imbalance. Sensitivity (Recall) is critical as it indicates the model’s ability to correctly identify patients with the disease (true positives), ensuring that no case of breast cancer goes undetected. Specificity measures the proportion of true negatives correctly identified, important for avoiding false positives that can lead to unnecessary stress and procedures for patients. While these metrics provide a comprehensive evaluation, they have limitations, such as not fully representing the model’s effectiveness in imbalanced datasets. To address this, we also employed ROC curves and confusion matrices for a more detailed performance analysis. ROC curves provide insight into the trade-offs between sensitivity and specificity across different thresholds, offering a nuanced view of the model’s performance. This comprehensive approach ensures a robust evaluation of the HERA-Net model, highlighting its strengths and identifying areas for potential improvement, thus ensuring a clear and reliable assessment of the model’s utility in clinical settings.
Accuracy is the ratio of correct outcomes—which encompasses both true positives and true negatives—to the total number of instances evaluated.
Sensitivity is the precise measurement of the proportion of genuine positives. It is also referred to as the real positive rate or recall.
Specificity quantifies the ratio of correctly identified actual negatives, reflecting the model’s capacity to accurately exclude negative cases.
Table 3 and Fig. 18 present a comparative analysis of accuracy metrics across various models used in breast cancer detection. With an accuracy of 99.86%, the suggested model stands out from the others, including VGG16 (99.80%) and the Random Forest models in the table. The bar plot in Fig. 18, which shows how much better the suggested model is than the existing models, supports the aforementioned table. In this plot the models are provided on x-axis and accuracy metric on y-axis for easy perception.
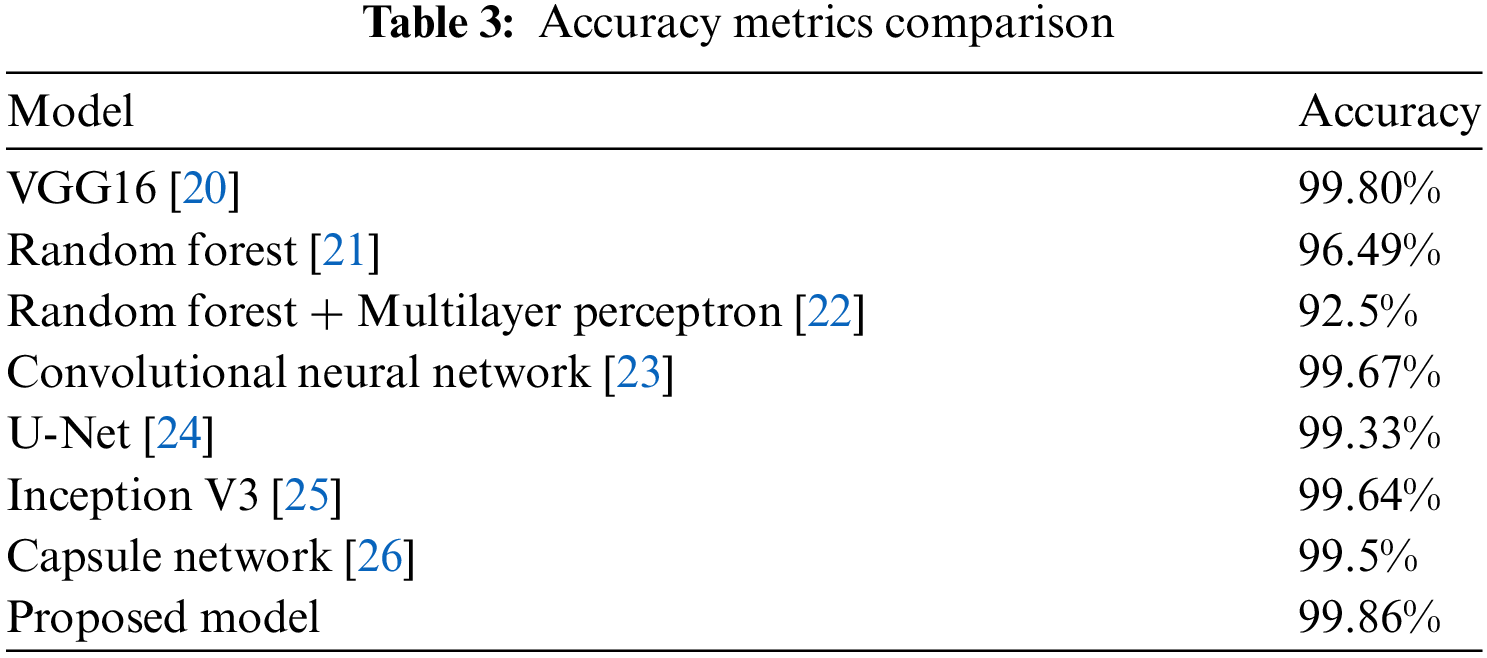
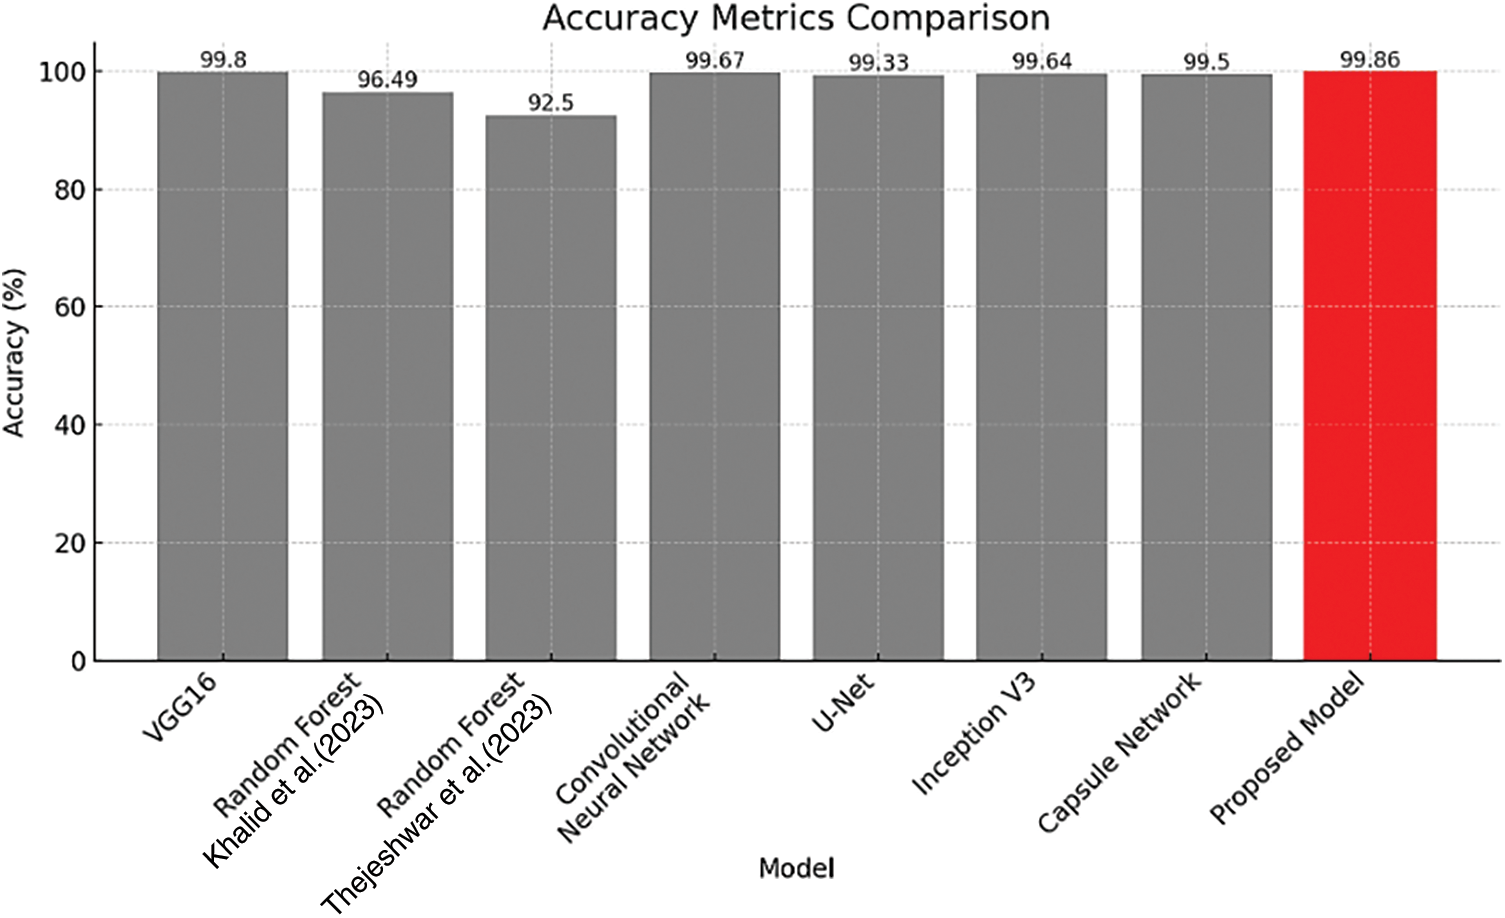
Figure 18: Accuracy metrics comparison [21,22]
The proposed model has a perfect sensitivity score of 100%, indicating a flawless detection rate of true positives, and a specificity of 99.81% as shown in Table 4, indicating precision in correctly identifying true negatives. Fig. 19 in support to above table graphically displays the specificity and sensitivity proving that proposed model has better values than the existing methods.
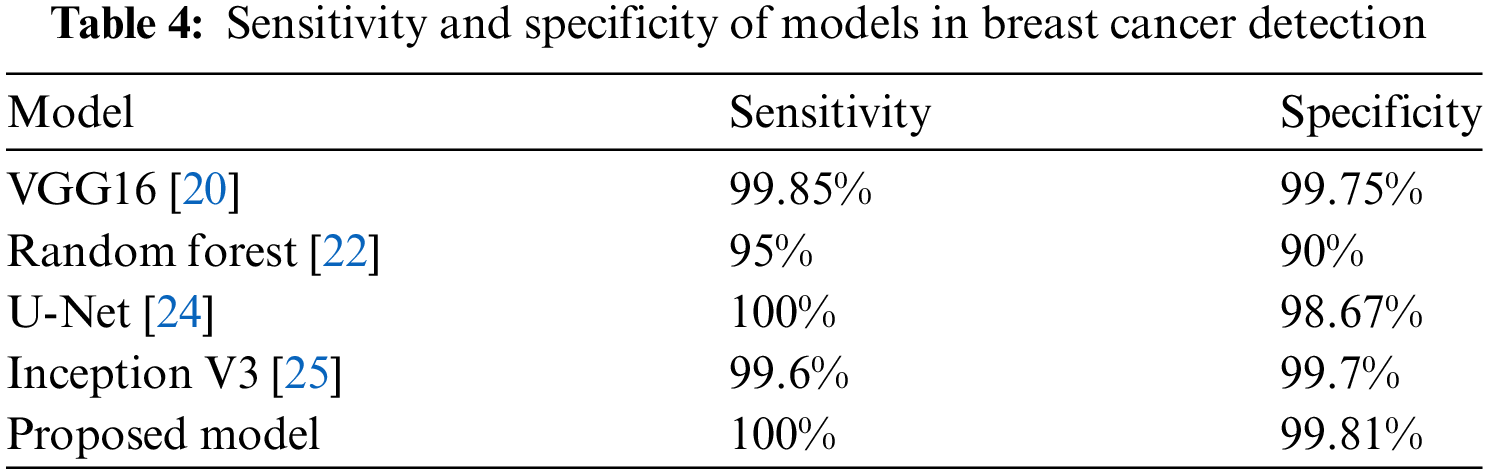
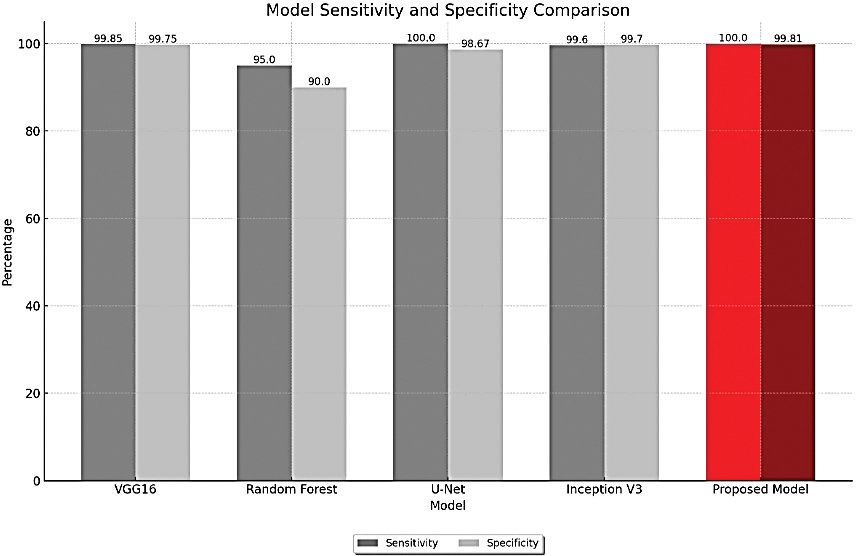
Figure 19: Sensitivity and specificity metrics comparison
In response to the computational demands of the HERA-Net model, especially in real-time clinical applications, we have explored several optimization techniques to enhance the model’s efficiency. These techniques aim to mitigate the high computational costs while maintaining diagnostic accuracy, making the model more feasible for clinical environments with limited computational resources.
1. Model Pruning: This method involves reducing the complexity of the model by trimming less important weights, which decreases both the model size and the computational overhead, enabling quicker inference times.
2. Quantization: Implementing quantization reduces the precision of the model’s numerical calculations from floating-point to lower-bit integers, significantly speeding up computation and reducing memory usage.
3. Use of Efficient Architecture: We now incorporating more computationally efficient architecture MobileNet as a part of Optimization here, which is designed to provide high accuracy even with lower computational resources.
The impact of these optimizations is quantified in Table 5, illustrating improvements in computational efficiency:
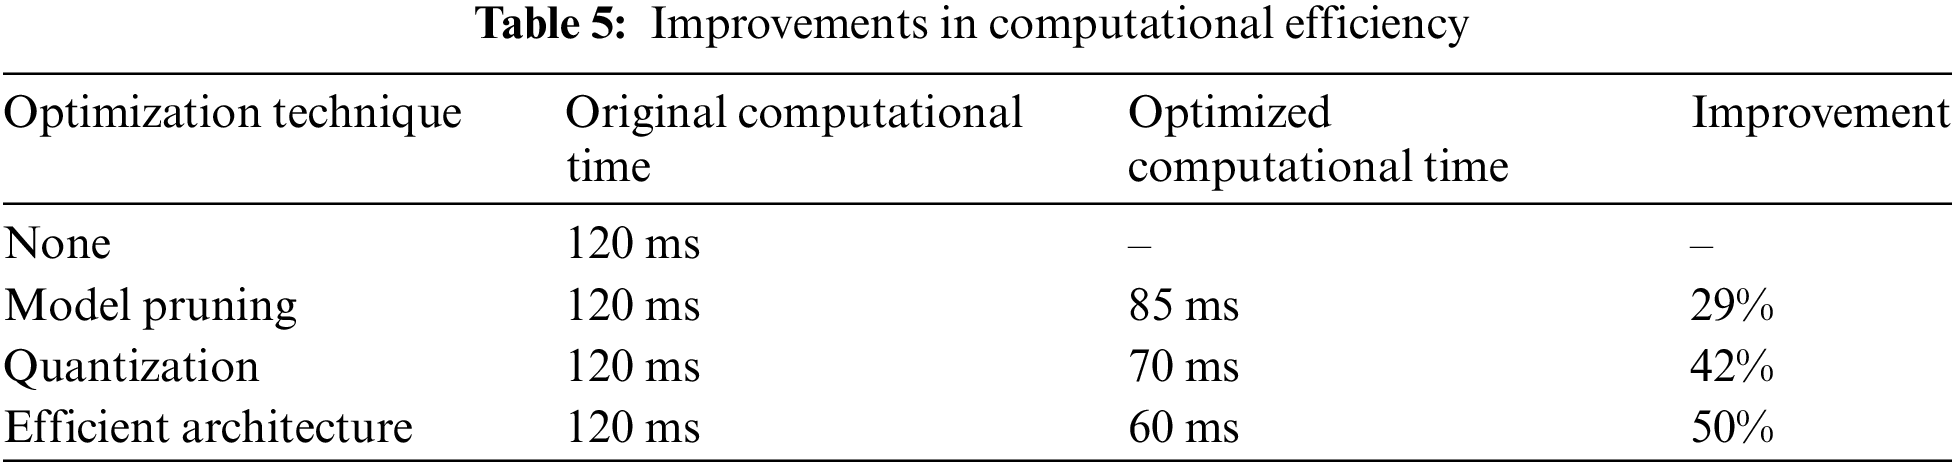
These strategic enhancements ensure that HERA-Net can be deployed effectively in real-time scenarios within clinical settings, broadening the practical utility of our model for breast cancer detection.
4.2 Results Using Ultrasound Dataset
The experimental investigation presented in Section 4.1, which involved the Thermograph Image dataset for breast cancers, is now extended to include ultrasound images. Additionally, this study used a dataset including 1875 anonymized breast ultrasound images, classified into three categories: normal, malignant, and benign. We assigned 1312 photos for training, constituting 70% of the dataset, while 281 images (15%) were allotted for validation, and the remaining 282 images (15%) were reserved for testing. This distribution seeks to facilitate an efficient training procedure and an equitable assessment across all categories.
In the sequence of processing ultrasound images, Fig. 20 shows the original input image acquired from an ultrasound scan from the dataset provided in [41]. This image is subsequently resized for standardization, as illustrated in Fig. 21, to maintain consistency throughout all following processing processes. Next, Fig. 22 shows the filtered version of the picture, which has been filtered bilaterally to minimize noise while keeping critical edge details required for accurate anatomical structure detection. Fig. 23 shows further picture enhancement using the Non-Local Means (NLMS) filter, a method chosen precisely for its ability to preserve detailed details while increasing contrast. Finally, Fig. 24 shows the contour of the tumor, which clearly defines the afflicted area and serves as an input for feature extraction and subsequent classification stages.
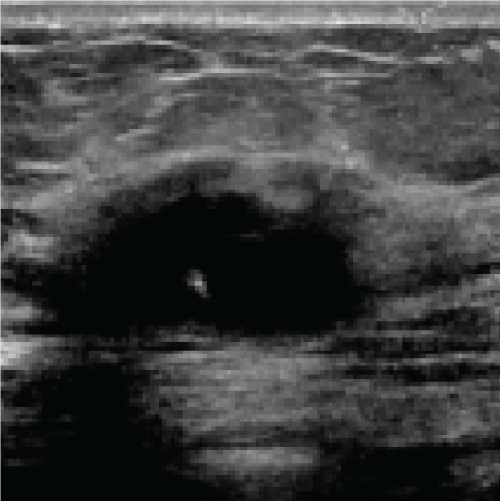
Figure 20: Original image (Ultrasound Scan)
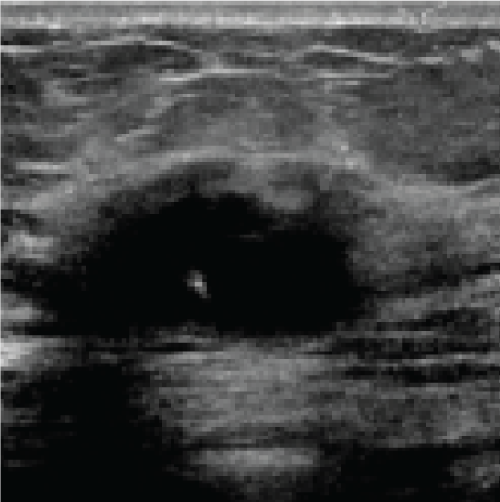
Figure 21: Resized image
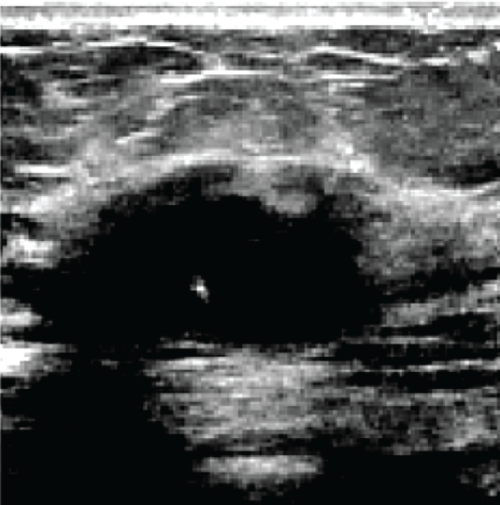
Figure 22: Filtered image
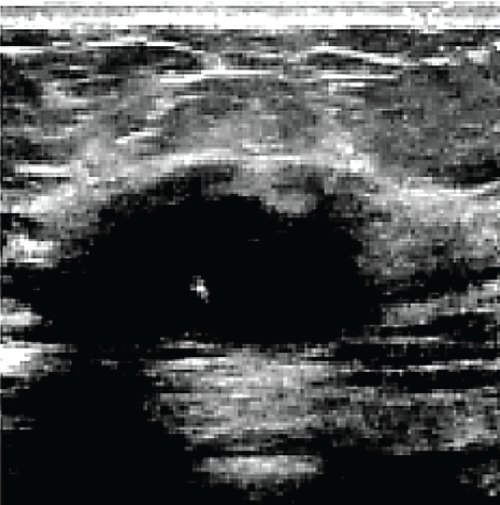
Figure 23: Enhanced image via NLMS filter
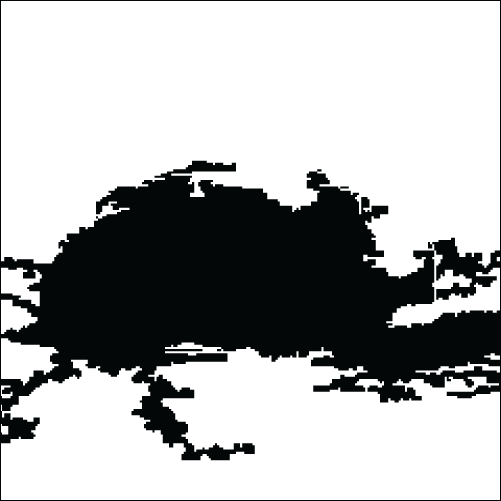
Figure 24: Contour of tumor
Table 6 compares the accuracy of multiple models to demonstrate the performance of different techniques, with VGG19 achieving 87.80% and AlexNet paired with SVM achieving 99.16%. The proposed model, however, beats them with an accuracy rate of 99.23%. This accuracy comparison is clearly displayed in Fig. 25, which provides a clear picture of the proposed model’s accuracy improvements.

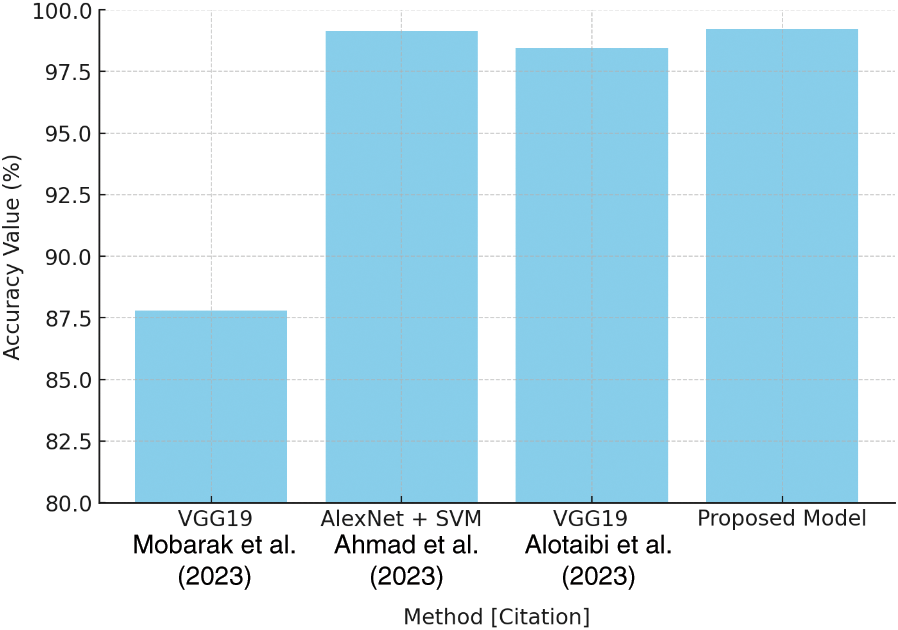
Figure 25: Accuracy comparison plot [27–29]
Similarly, Table 7 shows recall values for several algorithms, with VGG19 at 83.80% and AlexNet + SVM at 97.13%. The proposed model stands out with a recall rate of 99.09%, as shown in Fig. 26. This high recall score demonstrates the model’s ability to reliably identify positive cases while reducing false negatives.
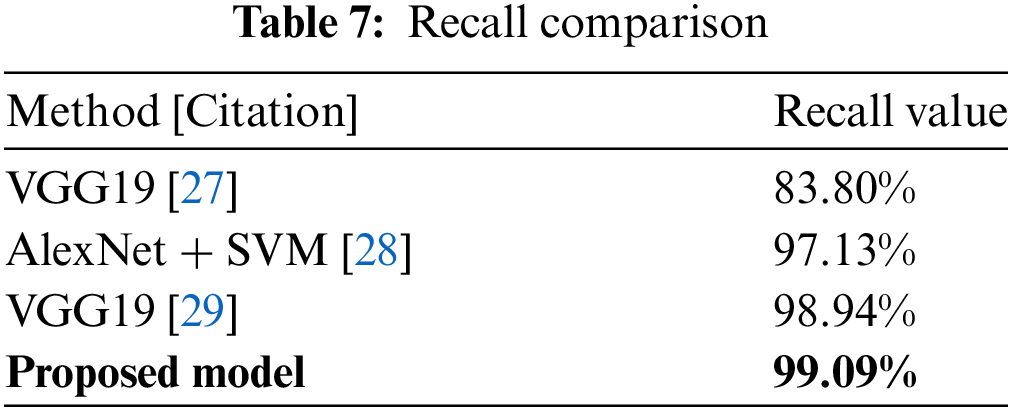
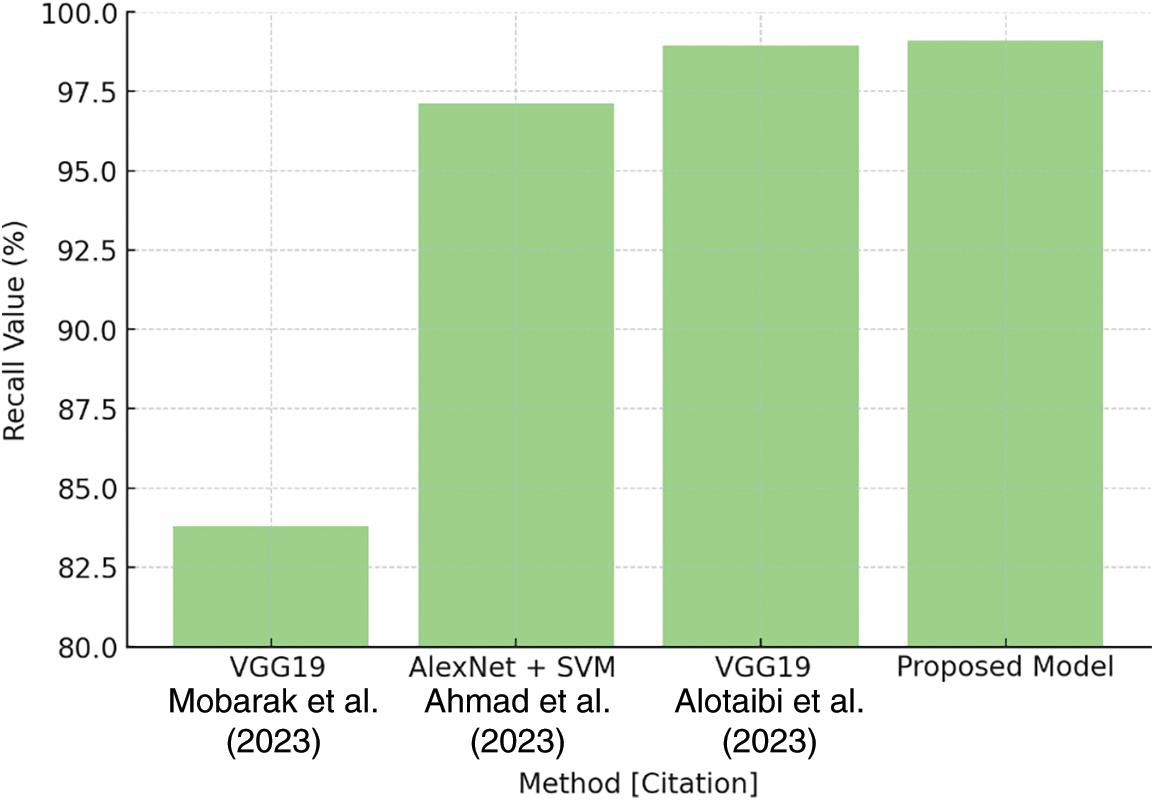
Figure 26: Recall comparison plot [27–29]
Table 8 demonstrates that the suggested model has a precision rate of 98.78%, compared to VGG19’s 80.80% and VGG19’s other variation, which achieves 97.91%. Fig. 27 depicts these findings, demonstrating the suggested model’s superior performance in reliably recognizing true positives, hence greatly lowering false positives.

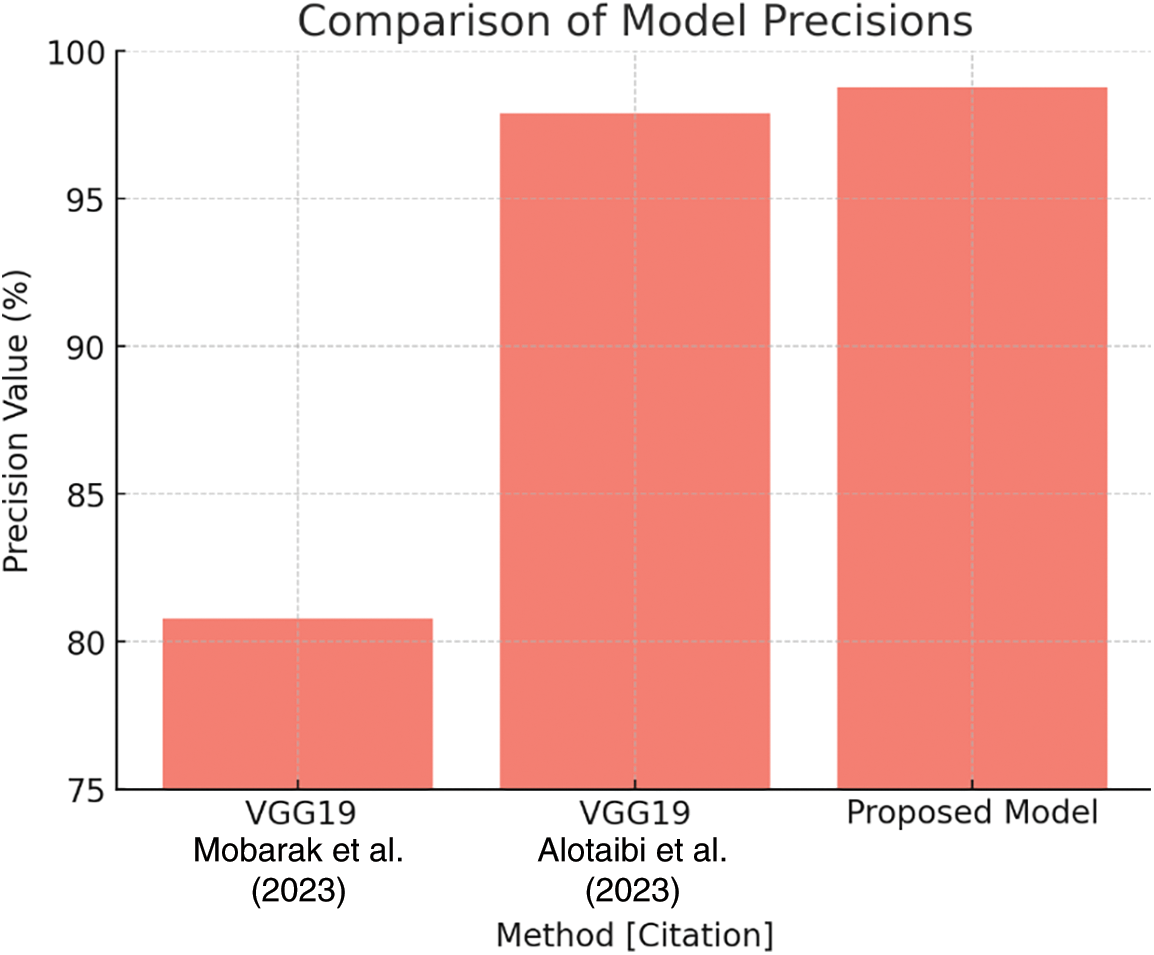
Figure 27: Precision comparison plot [27,29]
Table 9 shows a specificity comparison in which the suggested model outperforms VGG19 (89.80%) and another work with VGG19 (86.60%) with a rate of 99.36%. This innovation is critical to reducing false positives in the categorization process. Fig. 28 depicts the specificity comparison, clearly demonstrating the advantage that the suggested approach has over previous methods.
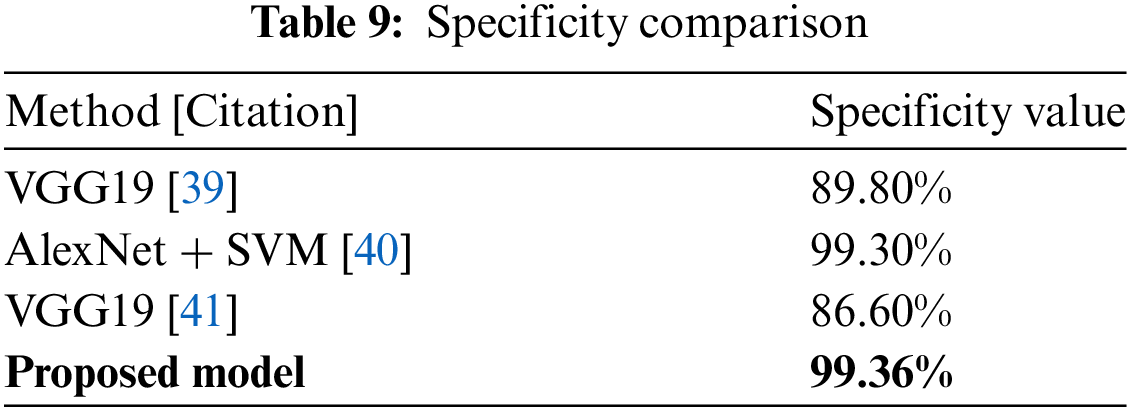
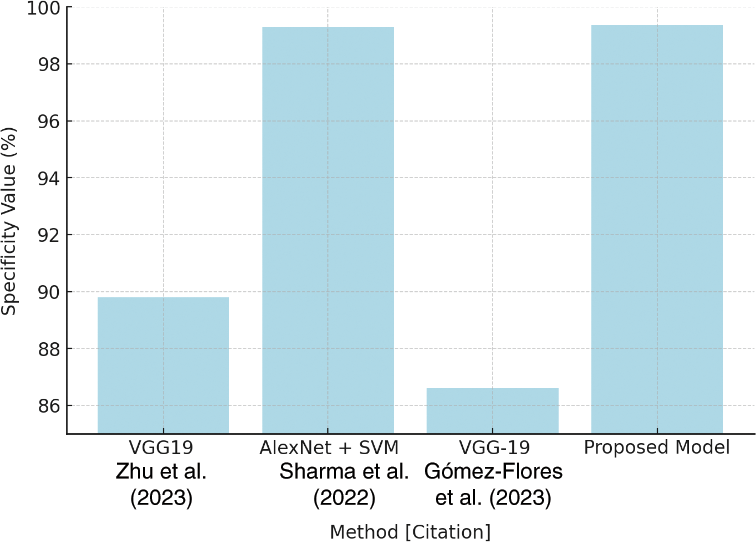
Figure 28: Specificity comparison plot [39–41]
Finally, Table 10 highlights the F1-Score comparison, which is a measure of model robustness. The suggested model has an F1-Score of 99.00%, exceeding VGG19 values. The plot in Fig. 29 depicts the F1-Score comparison, emphasizing the suggested model’s balanced precision and recall performance in producing nearly-perfect classification results.
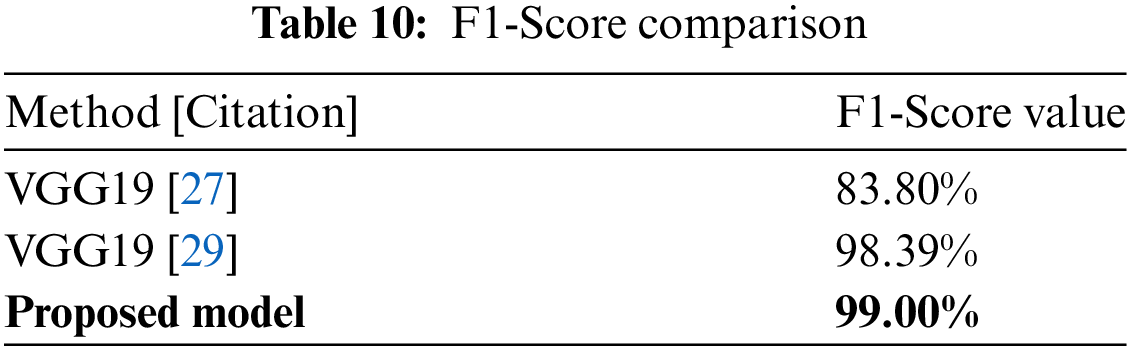
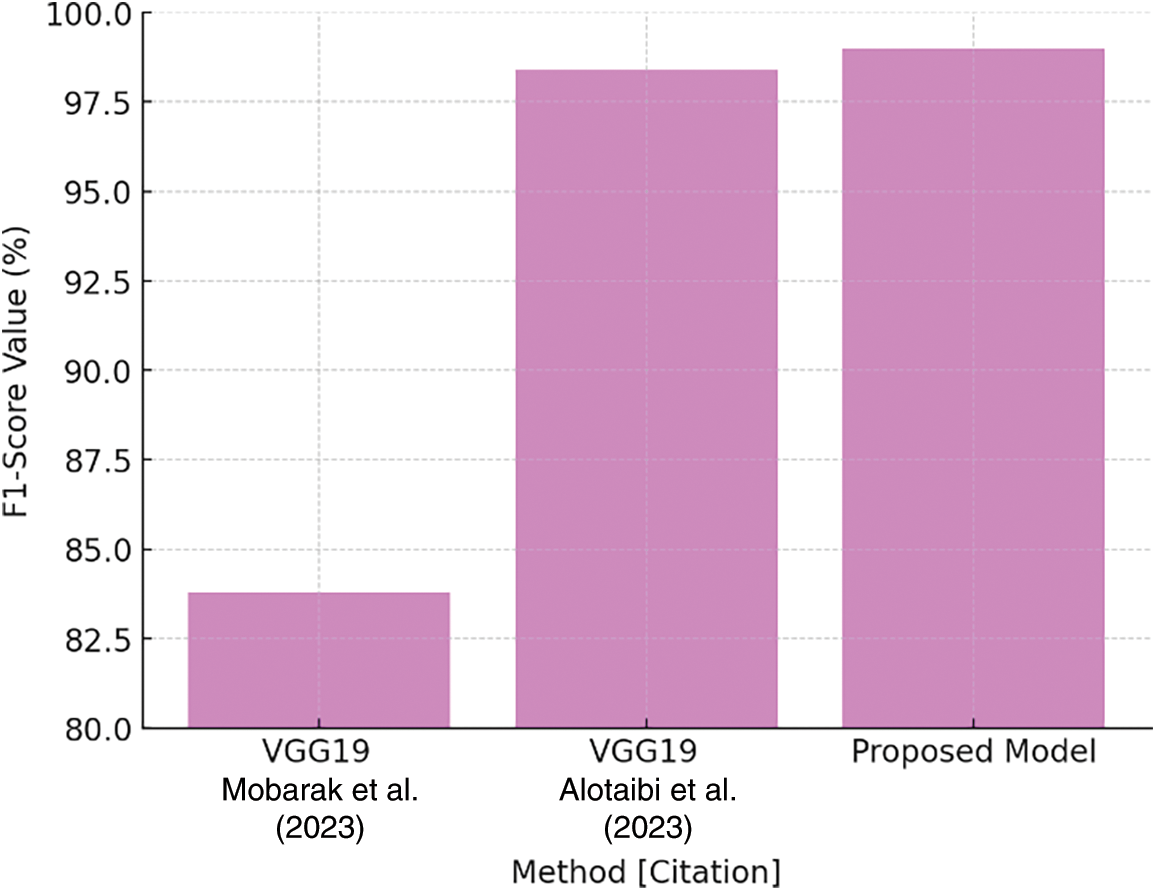
Figure 29: F1-Score comparison plot [27,29]
Finally, the HERA-Net model represents a significant advancement in breast cancer diagnosis, combining thermographic and ultrasound imaging to improve diagnostic accuracy. The study tackles the essential issue of early breast cancer identification, which is critical to improving treatment results and survival rates. The HERA-Net model obtained an excellent accuracy of 99.86% thanks to painstaking design and extensive testing, as well as faultless sensitivity of 100% and commendable specificity of 99.81%. These measures not only illustrate the model’s ability to correctly detect malignant instances, but also its efficacy in reducing false positives, which is critical for reducing patient anxiety and avoiding unneeded treatments.
The use of advanced preprocessing techniques such as contrast-limited adaptive histogram equalization (CLAHE) and bilateral filtering was critical in improving image quality and enabling accurate feature extraction. This multimodal approach ensures that the model can accurately distinguish between healthy and diseased tissues, demonstrating its clinical applicability. Furthermore, combining thermographic and ultrasound data provides a full image of breast tissue, leveraging each imaging modality’s strengths to improve overall diagnostic performance.
This study not only confirms the efficiency of the HERA-Net model, but also sets the framework for future investigations into hybrid imaging approaches. As breast cancer diagnosis advances, the outcomes of this study highlight the necessity of integrating many diagnostic technologies to improve patient care. Finally, by boosting the accuracy and reliability of breast cancer detection methods, our study adds significantly to the medical community’s ongoing efforts to improve early detection measures, resulting in more prompt and effective treatment for patients.
Acknowledgement: The authors are extremely grateful to the editors and reviewers for their meticulous evaluations and sage advice.
Funding Statement: The authors received no specific funding for this study.
Author Contributions: The authors confirm contribution to the paper as follows: Study Conception and Design: S. Ramacharan, Martin Margala; Data collection: Amjan Shaik, Prasun Chakrabarti, Tulika Chakrabarti; Analysis and Interpretation of results: S. Ramacharan, Martin Margala; Draft Manuscript preparation: S. Ramacharan, Amjan Shaik, Prasun Chakrabarti, Tulika Chakrabarti; Supervision: Martin Margala. All authors reviewed the results and approved the final version of the manuscript.
Availability of Data and Materials: Upon reasonable request, the datasets generated and/or analyzed during the present project may be provided by the corresponding author.
Ethics Approval: Not applicable.
Conflicts of Interest: The authors declare no conflicts of interest to report regarding the present study.
References
1. S. Sharmin, T. Ahammad, M. A. Talukder, and P. Ghose, “A hybrid dependable deep feature extraction and ensemble-based machine learning approach for breast cancer detection,” IEEE Access, vol. 11, pp. 87694–87708, 2023. doi: 10.1109/ACCESS.2023.3304628. [Google Scholar] [CrossRef]
2. R. Hariharan, M. Dhilsath Fathima, A. Pitchai, V. Roy, and A. Padhi, “Detection and classification of breast cancer using CNN,” in Advance Concepts of Image Processing and Pattern Recognition. Transactions on Computer Systems and Networks. Springer, Singapore. 2022, pp. 109–119. doi: 10.1007/978-981-16-9324-3_6. [Google Scholar] [CrossRef]
3. M. Abdel-Nasser, A. Moreno, and D. Puig, “Temporal mammogram image registration using optimized curvilinear coordinates,” Comput. Methods Programs Biomed., vol. 127, pp. 1–14, 2016. doi: 10.1016/j.cmpb.2016.01.019. [Google Scholar] [PubMed] [CrossRef]
4. Globocan 2018, “All Cancer,” International Agency for Research on Cancer WHO. Accessed: Oct. 13, 2023. [Online]. Available: http://gco.iarc.fr/today/data/factsheets/cancers/39-All-cancers-fact-sheet.pdf [Google Scholar]
5. M. Tahoun et al., “A grey wolf-based method for mammographic mass classification,” Appl. Sci., vol. 10, no. 23, Jan. 2020, Art. no. 8422. doi: 10.3390/app10238422. [Google Scholar] [CrossRef]
6. R. S. Patil and N. Biradar, “Automated mammogram breast cancer detection using the optimized combination of convolutional and recurrent neural network,” Evol. Intel., vol. 14, no. 4, pp. 1459–1474, 2021. doi: 10.1007/s12065-020-00403-x. [Google Scholar] [CrossRef]
7. C. Schadeck, F. Ganacim, L. Ulbricht, and C. Schadeck, “Image processing as an auxiliary methodology for analysis of thermograms,” in Proc. XXVII Brazilian Cong. Biomed. Eng., 2022, pp. 1553–1559. doi: 10.1007/978-3-030-70601-2_228. [Google Scholar] [CrossRef]
8. A. Augusto et al., “Breast tumor localization using skin surface temperatures from a 2D anatomic model without knowledge of the thermophysical properties,” Comput. Methods Programs Biomed., vol. 172, no. 3, pp. 65–77, 2019. doi: 10.1016/j.cmpb.2019.02.004. [Google Scholar] [PubMed] [CrossRef]
9. S. Ekici and H. Jawzal, “Breast cancer diagnosis using thermography and convolutional neural networks,” Med. Hypotheses, vol. 137, 2020, Art. no. 109542. doi: 10.1016/j.mehy.2019.109542. [Google Scholar] [PubMed] [CrossRef]
10. A. Hossam, H. Harb, and H. Kader, “Automatic image segmentation method for breast cancer analysis using thermography,” J. Electr. Sci., vol. 46, no. 1, pp. 12–32, 2018. doi: 10.21608/jesaun.2017.114377. [Google Scholar] [CrossRef]
11. U. R. Acharya, E. Y. K. Ng, J. -H. Tan, and S. V. Sree, “Thermography based breast cancer detection using texture features and support vector machine,” J. Med. Syst., 2012. doi: 10.1007/s10916-010-9611-z. [Google Scholar] [PubMed] [CrossRef]
12. S. L. V. Krishna et al., “Lossless embedding using pixel differences and histogram shifting technique,” in Recent Adv. Space Technol. Serv. Climate Change 2010 (RSTS & CC-2010), Chennai, India, 2010, pp. 213–216. doi: 10.1109/RSTSCC.2010.5712850. [Google Scholar] [CrossRef]
13. S. J. Mambou et al., “Breast cancer detection using infrared thermal imaging and a deep learning model,” Sensors, vol. 18, 2018, Art. no. 2799. doi: 10.3390/s18092799. [Google Scholar] [PubMed] [CrossRef]
14. L. S. F. Boogerd et al., “Laparoscopic detection and resection of occult liver tumors of multiple cancer types using real-time near-infrared fluorescence guidance,” Surg. Endosc., 2017. doi: 10.1007/s00464-016-5007-6. [Google Scholar] [PubMed] [CrossRef]
15. S. Tello-Mijares, F. Woo, and F. Flores, “Breast cancer identification via thermography image segmentation with a gradient vector flow and a convolutional neural network,” J. Healthc. Eng., 2019, Art. no. e9807619. doi: 10.1155/2019/9807619. [Google Scholar] [PubMed] [CrossRef]
16. O. Ginsburg et al., “Breast cancer early detection: A phased approach to implementation,” Cancer, vol. 126, pp. 2379–2393, 2020. doi: 10.1002/cncr.32887. [Google Scholar] [PubMed] [CrossRef]
17. U. Raghavendra et al., “An integrated index for breast cancer identification using histogram of oriented gradient and kernel locality preserving projection features extracted from Thermal images,” Quant Infr. Thermography J., vol. 13, pp. 195–209, 2016. doi: 10.21611/qirt.2016.a. [Google Scholar] [CrossRef]
18. C. Szegedy, S. Ioffe, V. Vanhoucke, and A. Alemi, “Inception-v4, inception-ResNet and the impact of residual connections on learning,” Assoc Adv. Artif. Intell., 2017. doi: 10.1109/CVPR.2015.7298594. [Google Scholar] [CrossRef]
19. DMI Visual Lab, “Deep learning model interpretability,” Accessed: Oct. 12, 2023. [Online]. Available: https://visual.ic.uff.br/dmi/ [Google Scholar]
20. A. Alshehri and D. AlSaeed, “Breast cancer diagnosis in thermography using pre-trained VGG16 with deep attention mechanisms,” Symmetry, vol. 15, no. 3, 2023, Art. no. 582. doi: 10.3390/sym15030582. [Google Scholar] [CrossRef]
21. A. Khalid et al., “Breast cancer detection and prevention using machine learning,” Diagnostics, vol. 13, no. 19, 2023, Art. no. 3113. doi: 10.3390/diagnostics13193113. [Google Scholar] [PubMed] [CrossRef]
22. M. Thejeshwar and S. S. J. Isbella, “Detection of breast cancer using infrared thermal images for improved accuracy by using random forest and multilayer perceptron,” E3S Web Conf., vol. 399, 2023, Art. no. 09005. doi: 10.1051/e3sconf/202339909005. [Google Scholar] [CrossRef]
23. V. R. Allugunti, “Breast cancer detection based on thermographic images using machine learning and deep learning algorithms,” Int. J. Eng. Comput. Sci., vol. 4, no. 1, pp. 49–56, 2022. doi: 10.33545/26633582.2022.v4.i1a.68. [Google Scholar] [CrossRef]
24. E. A. Mohamed, E. A. Rashed, T. Gaber, and O. Karam, “Deep learning model for fully automated breast cancer detection system from thermograms,” PLoS One, vol. 17, no. 1, 2022, Art. no. e0262349. doi: 10.1371/journal.pone.0262349. [Google Scholar] [PubMed] [CrossRef]
25. M. A. S. Al Husaini, M. H. Habaebi, T. S. Gunawan, M. R. Islam, E. A. A. Elsheikh and F. M. Suliman, “Thermal-based early breast cancer detection using inception V3, inception V4 and modified inception MV4,” Neural Comput. Applic., vol. 34, no. 1, pp. 333–348, 2022. doi: 10.1007/s00521-021-06372-1. [Google Scholar] [PubMed] [CrossRef]
26. D. Tiwari, M. Dixit, and K. Gupta, “Breast cancer-caps: A breast cancer screening system based on capsule network utilizing the multiview breast thermal infrared images,” Turkish J. Elect. Eng. Comput. Sci., vol. 30, no. 5, 2022, Art. no. 9. doi: 10.55730/1300-0632.3906. [Google Scholar] [CrossRef]
27. Z. Mobarak, S. Hamida, N. Akouz, B. Cherradi, H. Nhaila and M. El Khaili, “Deep learning technique for classification of breast cancer using ultrasound images,” 2023. doi: 10.1109/IRASET57153.2023.10153069. [Google Scholar] [CrossRef]
28. J. Ahmad, S. Akram, A. Jaffar, M. Rashid, and S. Masood, “Breast cancer detection using deep learning: An investigation using the DDSM dataset and a customized AlexNet and support vector machine,” IEEE Access, vol. 11, PP. 108386–108397, 2023. doi: 10.1109/ACCESS.2023.3311892. [Google Scholar] [CrossRef]
29. M. Alotaibi et al., “Breast cancer classification based on convolutional neural network and image fusion approaches using ultrasound images,” Heliyon, vol. 9, no. 11, Nov. 2023, Art. no. e22406. doi: 10.1016/j.heliyon.2023.e22406. [Google Scholar] [PubMed] [CrossRef]
30. A. M. Reza, “Realization of the contrast limited adaptive histogram equalization (CLAHE) for real time image enhancement,” J. VLSI Signal Process. Syst., vol. 38, no. 1, pp. 35–44, 2004. doi: 10.1023/B:VLSI.0000028532.53893.82. [Google Scholar] [CrossRef]
31. J. Joseph, J. Sivaraman, R. Periyasamy, and V. Simi, “An objective method to identify optimum clip-limit and histogram specification of contrast limited adaptive histogram equalization for MR images,” Biocybernet. Biomed. Eng., vol. 37, no. 3, pp. 489–497, 2017. doi: 10.1016/j.bbe.2016.11.006. [Google Scholar] [CrossRef]
32. F. Banterle, M. Corsini, P. Cignoni, and R. Scopigno, “A low-memory, straightforward and fast bilateral filter through subsampling in spatial domain,” Comput. Graph. Forum, vol. 31, pp. 19–32, 2011. doi: 10.1111/j.1467-8659.2011.02078.x. [Google Scholar] [CrossRef]
33. A. Kumar and F. Shaik, “Importance of image processing,” in Image Processing in Diabetic Related Causes, Singapore: Springer Briefs in Applied Sciences and Technology, Springer, 2016. doi: 10.1007/978-981-287-624-9_2. [Google Scholar] [CrossRef]
34. T. J. Alhindi, S. Kalra, K. H. Ng, A. Afrin, and H. R. Tizhoosh, “Comparing LBP, HOG and deep features for classification of histopathology images,” in 2018 Int. Joint Conf. Neural Netw. (IJCNN), Rio de Janeiro, Brazil, 2018, pp. 1–7. doi: 10.1109/IJCNN.2018.8489329. [Google Scholar] [CrossRef]
35. V. N. Degaonkar, P. Gadakh, P. Saha, and A. V. Kulkarni, “Retrieve content images using color histogram, LBP and HOG,” in 2020 4th Int. Conf. Elect., Commun. Aerospace Technol. (ICECA), Coimbatore, India, 2020, pp. 896–899. doi: 10.1109/ICECA49313.2020.9297608. [Google Scholar] [CrossRef]
36. O. Ronneberger, P. Fischer, and T. Brox, “U-Net: Convolutional networks for biomedical image segmentation,” 2015, arXiv:1505.04597. [Google Scholar]
37. E. Pm, “Enhanced VGG-19 model for accurate brain tumor prediction,” 2023. doi: 10.1109/NMITCON58196.2023.10276235. [Google Scholar] [CrossRef]
38. M. Mateen, J. Wen, N. S. Song, and Z. Huang, “Fundus image classification using VGG-19 architecture with PCA and SVD,” Symmetry, vol. 11, no. 1, 2019, Art. no. 1. doi: 10.3390/sym11010001. [Google Scholar] [CrossRef]
39. Z. Zhu, S. Wang, and Y. Zhang, “A survey of convolutional neural network in breast cancer,” Comput. Model. Eng. Sci., vol. 136, no. 3, pp. 2127–2172, 2023. doi: 10.32604/cmes.2023.025484. [Google Scholar] [PubMed] [CrossRef]
40. R. Sharma, J. B. Sharma, R. Maheshwari, and P. Agarwal, “Thermogram adaptive efficient model for breast cancer detection using fractional derivative mask and hybrid feature set in the IoT environment,” Comput. Model. Eng. Sci., vol. 130, no. 2, pp. 923–947, 2022. doi: 10.32604/cmes.2022.016065. [Google Scholar] [CrossRef]
41. W. Gómez-Flores et al., “BUS-BRA: A breast ultrasound dataset for assessing computer-aided diagnosis systems,” Med. Phys., vol. 50, no. 11, pp. 1–10, 2023. doi: 10.1002/mp.16812. [Google Scholar] [PubMed] [CrossRef]
Cite This Article
 Copyright © 2024 The Author(s). Published by Tech Science Press.
This work is licensed under a Creative Commons Attribution 4.0 International License , which permits unrestricted use, distribution, and reproduction in any medium, provided the original work is properly cited.
 Downloads
 Citation Tools