
 Submit a Paper
 Propose a Special lssue
 Open Access
ARTICLE

XGBoost-Based Power Grid Fault Prediction with Feature Enhancement: Application to Meteorology
1 State Grid Jiangsu Electric Power Co., Ltd., Information & Telecommunication Branch, Nanjing, 210024, China
2 State Grid Jiangsu Electric Power Co., Ltd., Information & Yangzhou Power Supply Branch, Yangzhou, 225000, China
3 School of Information Engineering, Yangzhou University, Yangzhou, 225127, China
* Corresponding Authors: Chen Zhang. Email: ; Junwu Zhu. Email:
Computers, Materials & Continua 2025, 82(2), 2893-2908. https://doi.org/10.32604/cmc.2024.057074
Received 07 August 2024; Accepted 30 October 2024; Issue published 17 February 2025
 View Full Text
 Download PDF
Abstract
The prediction of power grid faults based on meteorological factors is of great significance to reduce economic losses caused by power grid faults. However, the existing methods fail to effectively extract key features and accurately predict fault types due to the complexity of meteorological factors and their nonlinear relationships. In response to these challenges, we propose the Feature-Enhanced XGBoost power grid fault prediction method (FE-XGBoost). Specifically, we first combine the gradient boosting decision tree and recursive feature elimination method to extract essential features from meteorological data. Then, we incorporate a piecewise linear chaotic map to enhance the optimization accuracy of the sparrow search algorithm. Finally, we construct an XGBoost-based model for the classification prediction of power grid meteorological faults and optimize the hyperparameters such as the optimal tree depth, optimal learning rate, and optimal number of iterations using an enhanced sparrow search algorithm. Experimental results demonstrate that our method outperforms the baseline models in predicting power grid faults accurately.Keywords
The rapid economic development has led to an increased demand for electricity from the power grid across society. As a highly important public utility and energy foundation for the whole society, the power system occupies an irreplaceable position in national security, economic development and people’s daily life. In recent years, the rapid expansion of the power grid has led to an increasingly intricate power grid structure. The interconnection of power grids in various regions has fostered closer connections between them, leading to an increasing mutual influence [1]. Therefore, it is of great significance to ensure the safe and stable operation of the power grid. The causes of power grid accidents are complex, including internal factors such as equipment aging and operational errors, alongside external factors like natural disasters including lightning, floods, ice, and snow. Among them, meteorological disasters have become one of the most important factors threatening the safe operation of power grids due to their suddenness, destructive power and wide impact range [2]. Amidst the backdrop of global warming, there is a heightened frequency of extreme weather and climate events, including typhoons, heavy rainfall, ice storms, and snowfall. These disastrous weather occurrences are increasingly exacerbating the vulnerability of power grids [3]. The majority of power equipment is exposed to intricate and dynamic external environments for prolonged periods, rendering it highly susceptible to severe weather conditions such as lightning, windstorms, hailstorms, and ice accumulation. These adverse conditions can result in equipment damage, line interruptions, tripping incidents, power outages, and other critical faults. Therefore, harnessing meteorological monitoring data to promptly identify power grid failure risks holds paramount importance in enhancing the disaster prevention and mitigation capabilities of the power grid, thereby ensuring its safe and stable operation.
Currently, with the advancements in modern meteorological detection and numerical forecasting technology, acquiring abundant and precise meteorological monitoring data is no longer a formidable task. Particularly in short-term, small-scale refined weather forecasting, remarkable progress has been achieved [4]. The rise of big data and artificial intelligence has also provided new opportunities for in-depth mining and application of meteorological data. For example, the XGBoost regression model was used to analyze the effect of container orientation on phase change material (PCM) melting [5], as well as radial-based neural networks to predict thermal and phase change processes in complex environments [6]. Various researchers have conducted investigations on meteorological disasters in power grids. Guo et al. [7] employed the distance between lightning and the transmission line, along with the electric field strength, as warning factors for calculating the initial level of lightning warning. They proposed a multi-information fusion method for lightning warning based on atmospheric electric field, lightning location, and assessment technology of lightning disaster risk. Hou et al. [8] proposed a hybrid prediction model, integrating extreme value type I probability distribution, Monte Carlo method, and random forest, to quantitatively assess the likelihood of transmission line damage during typhoon disasters. These studies [9,10] all focused on power grid fault prediction for a specific type of meteorological disaster, extensively analyzing the underlying mechanisms causing such faults and proposing corresponding warning methods. However, it should be noted that real-life meteorological impacts on power grids exhibit significant diversity. Subsequently, a large number of scholars have studied the prediction methods of multiple types of faults by integrating the impact of various meteorological factors on power grid facilities. Li et al. [9] analyzed power grid and meteorological data, utilizing Geographic Information System (GIS) technology and visualization techniques to propose a design plan for such a warning system, facilitating resource sharing. Chen et al. [10] proposed an enhanced logistic regression model-based data-driven approach for predicting the reliability of overhead line operation, considering multiple meteorological factors. With the development of artificial intelligence, intelligent technologies such as fuzzy logic, support vector machines and deep learning have gradually been used in power grid fault prediction, and the level of power grid intelligence has been greatly improved. Lin et al. [11] trained multiple support vector machines as voting models, and then used an improved random forest algorithm to change the decision-making process to improve the fault prediction accuracy. Fang et al. [12] constructed a power grid fault prediction model using the extreme gradient boosting algorithm, and used the particle swarm optimization algorithm to find the optimal hyperparameters for the model to improve the model prediction accuracy. However, most existing research simply utilizes meteorological information and lacks comprehensive and systematic analysis of complex and diverse meteorological characteristics. The focus is mainly on fault diagnosis and status assessment during and after the event [13]. Moreover, traditional feature engineering methods exhibit significant vulnerabilities in smart grids due to their insufficient adaptability to the dynamics of complex systems and highly nonlinear models. This makes it difficult to extract truly useful key information from meteorological big data for fault prediction, resulting in poor performance of the prediction models [14].
To address the above limitations, we propose a new approach for grid fault warning. First, we automatically extract important features by combining Gradient Boosting Decision Tree (GBDT) [15] with Recursive Feature Elimination (RFE) [16]. Then, we utilize PieceWise Linear Chaotic Map (PWLCM) [17] to optimize the parameter finding process of the Sparrow Search Algorithm (SSA) [18] to enhance the XGBoost. The method aims to achieve accurate early detection of grid fault types. Our main contributions are summarized as follows:
• We innovatively propose the FE-XGBoost, which combines GBDT and RFE to extract key features from meteorological data, overcoming the limitations of manual feature selection;
• We introduce PWLCM to enhance SSA, improve its optimization accuracy and efficiency, and further enhance the accuracy of the fault prediction model;
• Through a large number of simulation experiments, the results show that the proposed FE-XGBoost is superior to traditional machine learning methods and other advanced prediction models in multiple evaluation metrics.
In this section, we review some of the works that are most related to our approach. We then summarize these approaches and briefly describe our work in this paper.
The XGBoost [19] consists of multiple classification and regression trees [20], which are considered “weak classifiers’’. By integrating these “weak classifiers”, the XGBoost is constructed. When making predictions, the sample passes through each decision tree of XGBoost in turn, and its output value is accumulated on the results in each decision tree to obtain the final prediction result:
where
The objective function of the model is:
where
where
After substituting Eqs. (2) into (3), and subsequently applying a second-order Taylor expansion of the loss function based on the principle of forward distribution addition, an approximate objective function can be derived. The expression is as follows:
where
The decision tree model is further defined as a relational expression containing branch structures and leaf node weights, and its specific relationship can be expressed as follows:
where
The complexity of the decision tree is determined by the number of leaf nodes and the two-norm of all weight vectors, thus Eq. (3) can be reformulated as Eq. (6):
Define
where
The objective function
The Sparrow Search Algorithm is inspired by the sparrow population’s foraging and avoiding being preyed on. It is a swarm intelligence optimization algorithm [21] proposed by simulating this biological behavior to establish a model. According to the different division of labor, sparrows are divided into discoverers, joiners and guards.
Assume that the space composed of
where
The joiner position update is described as follows:
where
During the foraging process, 20% of the sparrow individuals are selected as guards, and the position update is described as follows:
where
In this section, we introduce the proposed FE-XGBoost. The overall architecture is shown in Fig. 1, which contains three important components: (1) Feature Enhancement: First, we preprocess the meteorological fault dataset, and then combine GBDT and RFE to calculate the classification accuracy and feature importance scores in order to extract the key features from the dataset; (2) P-SSA: We propose P-SSA by using PWLCM to improve SSA, which makes the initial distribution of sparrow population more uniform and enhances the algorithm’s ability to find optimal parameters; (3) Fault Prediction Classification: Based on optimal hyperparameters found by P-SSA, we construct an XGBoost fault prediction model to achieve fault type prediction.
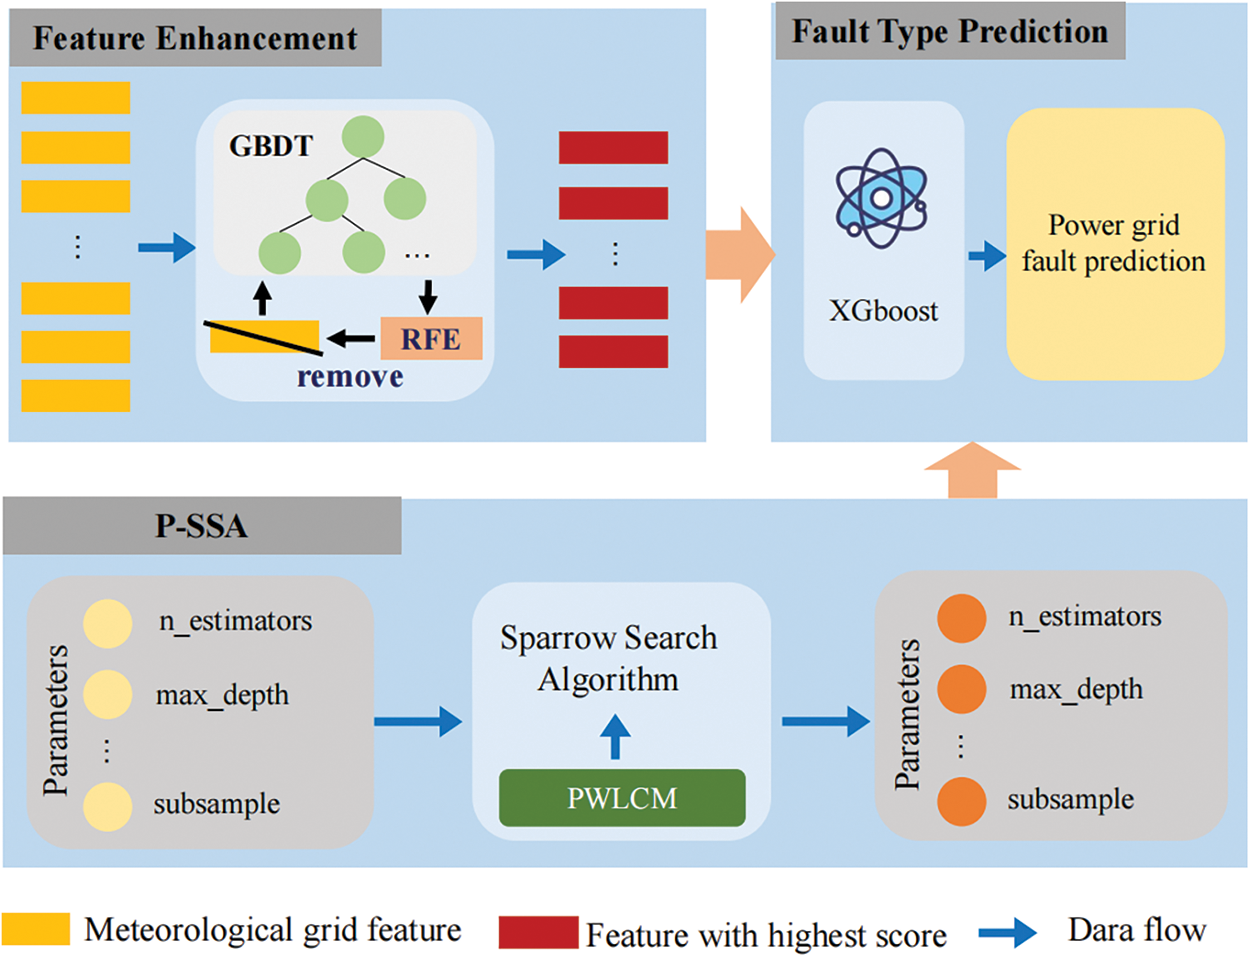
Figure 1: Framework of the FE-XGBoost
3.2 Meteorological Key Feature Extraction
The occurrence of equipment meteorological failures can be attributed to the combined impacts of multiple meteorological factors. Due to the diversity of meteorological factors and their differences in impact on equipment, although they are associated with equipment failures, they are difficult to analyze quantitatively. Therefore, meteorological factors are difficult to directly use for equipment failure prediction. In order to conduct a comprehensive analysis of the correlation between meteorological factors and equipment failures, we have devised Module 2 as depicted in Fig. 1, with the aim of delving into the intrinsic characteristics of meteorological data pertaining to specific types of equipment malfunctions.
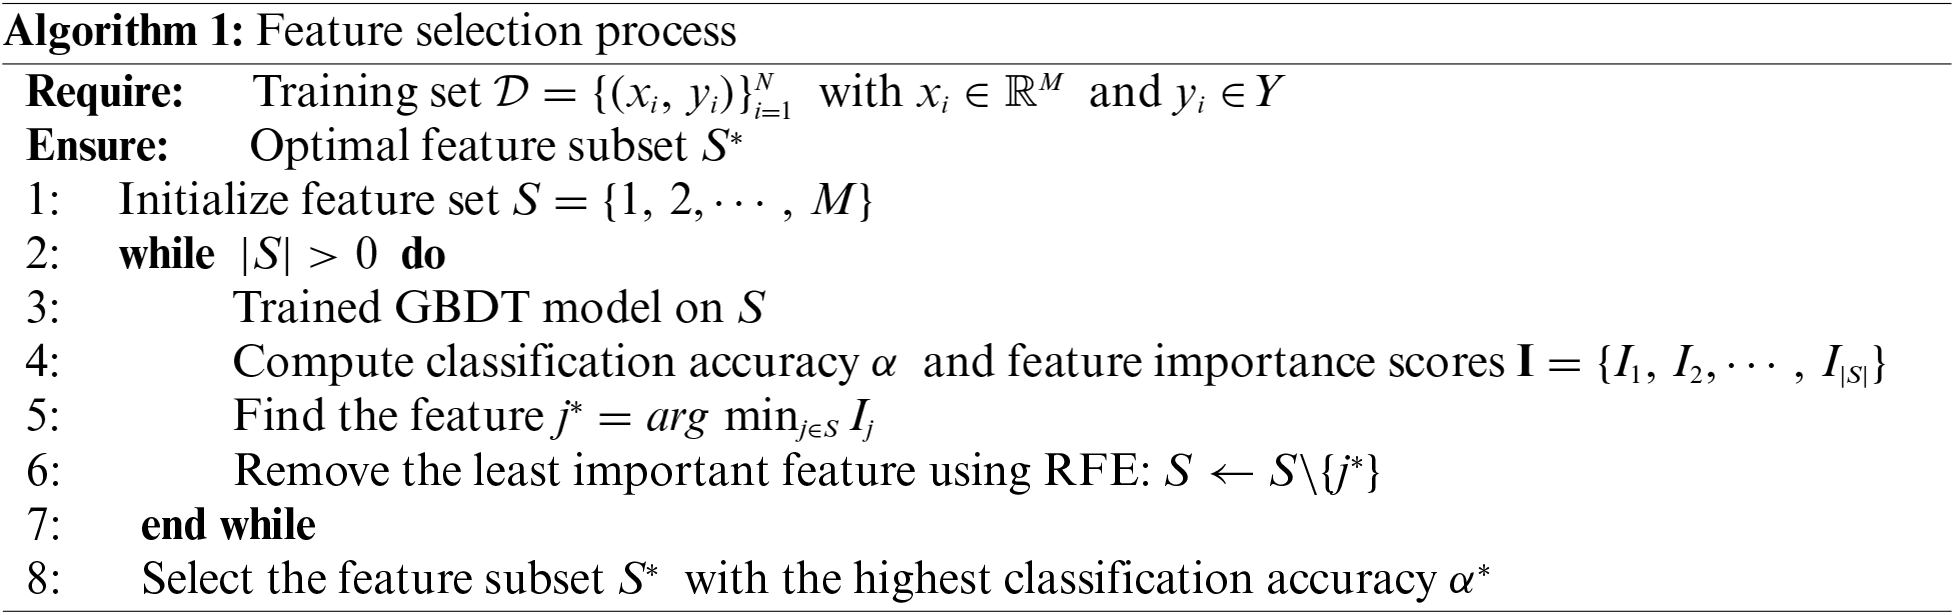
We combine GBDT and RFE for feature selection and model training. We initiate the feature extraction process by utilizing a comprehensive set of original features, iteratively eliminating those with the lowest importance scores during each round of training. Ultimately, we identify the subset of features that significantly contribute to power grid failure prediction. To enhance the readability and comprehension of our framework, Algorithm 1 presents the pseudo-code for this feature extraction method.
The random initialization values of the SSA population exhibit disorder and unevenness, thereby impeding algorithm convergence and constraining its global exploration capability. In view of the above shortcomings of the SSA algorithm, we use the chaotic sequence [22] to initialize the individual positions of sparrows in the SSA algorithm, so as to promote the uniform distribution of the sparrow population and enhance the algorithm’s optimization ability.
The values of chaotic sequences exhibit regularity and ergodicity. Incorporating chaotic sequences as sparrow individuals for population initialization enhances the uniform distribution of individuals, thereby improving population diversity and enhancing the algorithm’s global optimization capability. Therefore, the P-SSA based on PWLCM is proposed to optimize the population initialization of SSA. Its mathematical model is as follows:
where
3.4 Grid Fault Prediction Model Based on FE-XGBoost
This section constructs an XGBoost for meteorological fault prediction, but the model has many main hyperparameters, such as the optimal tree depth, optimal learning rate, optimal number of iterations, subsampling rate, column sampling rate, and minimum child node weight. These hyperparameters are usually randomly defined by users, and the model prediction performance is greatly affected by hyperparameters. The P-SSA algorithm is proposed to optimize the hyperparameters of the XGBoost, aiming to achieve an optimal meteorological fault prediction model. During the utilization of the XGBoost for predicting the meteorological failure rate in a specific region, the weights assigned to each node within the tree model are continuously adjusted to progressively approximate the intricate relationship between equipment failure rate and meteorological influencing factors. The process exhibits similarities to conventional supervised learning, where the XGBoost utilizes the training set to generate predictions for the target variable. Since the model cannot predict successfully in one attempt, the XGBoost will add a decision tree after each prediction. It then adjusts and corrects the prediction results of the previous tree based on the error function until the final prediction meets the accuracy requirements. To enhance the readability of our framework, we present Algorithm 2, which illustrates the pseudo code for the FE-XGBoost fault prediction model.
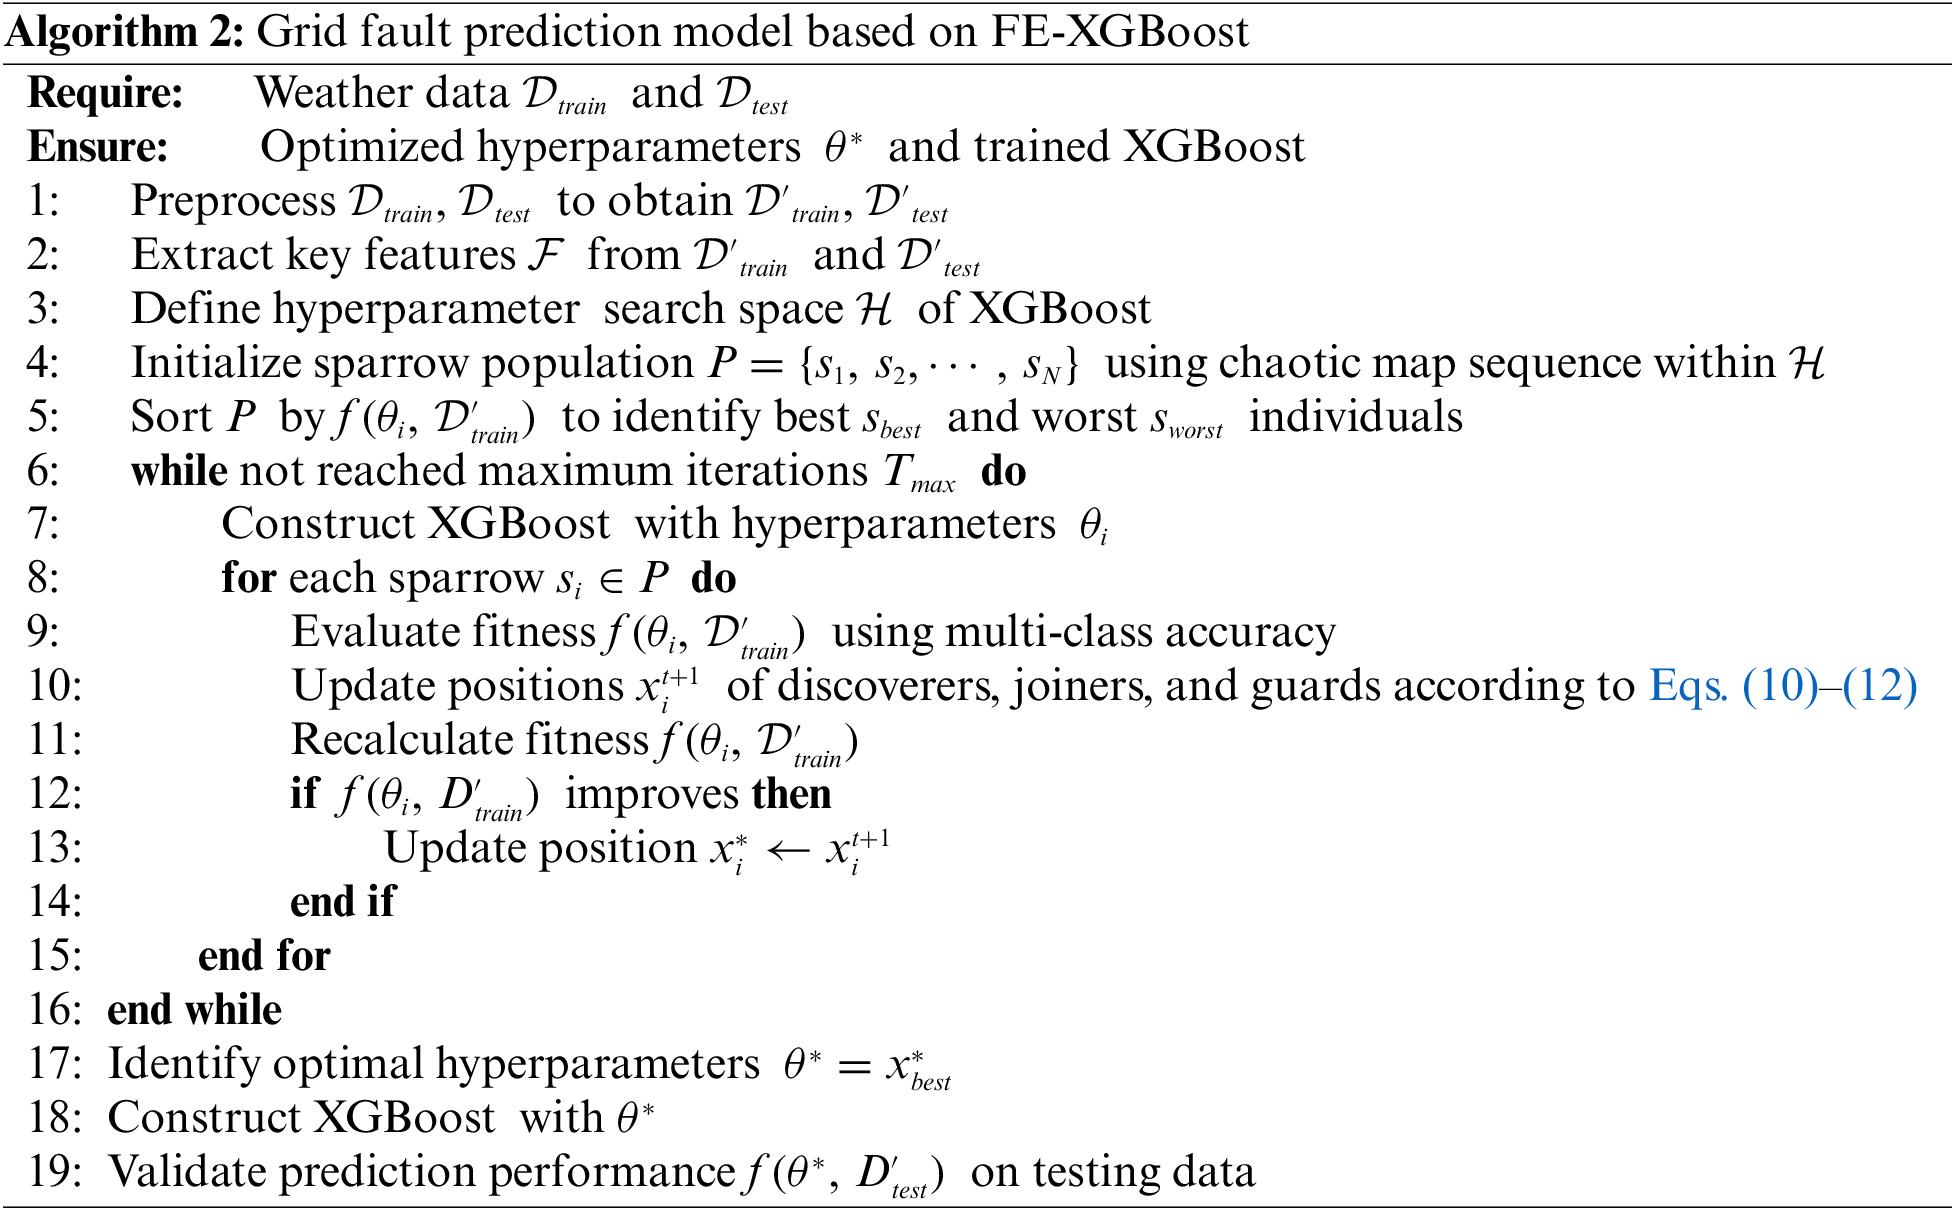
When classifying and predicting power grid faults, it is imperative to ensure a high classification accuracy of the model, minimizing any potential classification errors. Therefore, when using P-SSA to optimize the XGBoost in Algorithm 2, the multi-classification logarithmic loss of the XGBoost is used as the fitness value. The Eq. (14) demonstrates the calculation method for the multi-classification logarithmic loss employed by the model. The P-SSA algorithm is employed to identify a set of hyperparameters that minimize the model loss, thereby facilitating the construction of a power grid fault prediction model.
where
The feature enhancement module performs initial cleaning of the acquired meteorological data, followed by feature extraction using GBDT and RFE. Finally, it is divided into a training set and a test set at a ratio of 7:3. The meteorological data in this paper is obtained from the meteorological monitoring station located closest to the fault site, as indicated in Table 1.
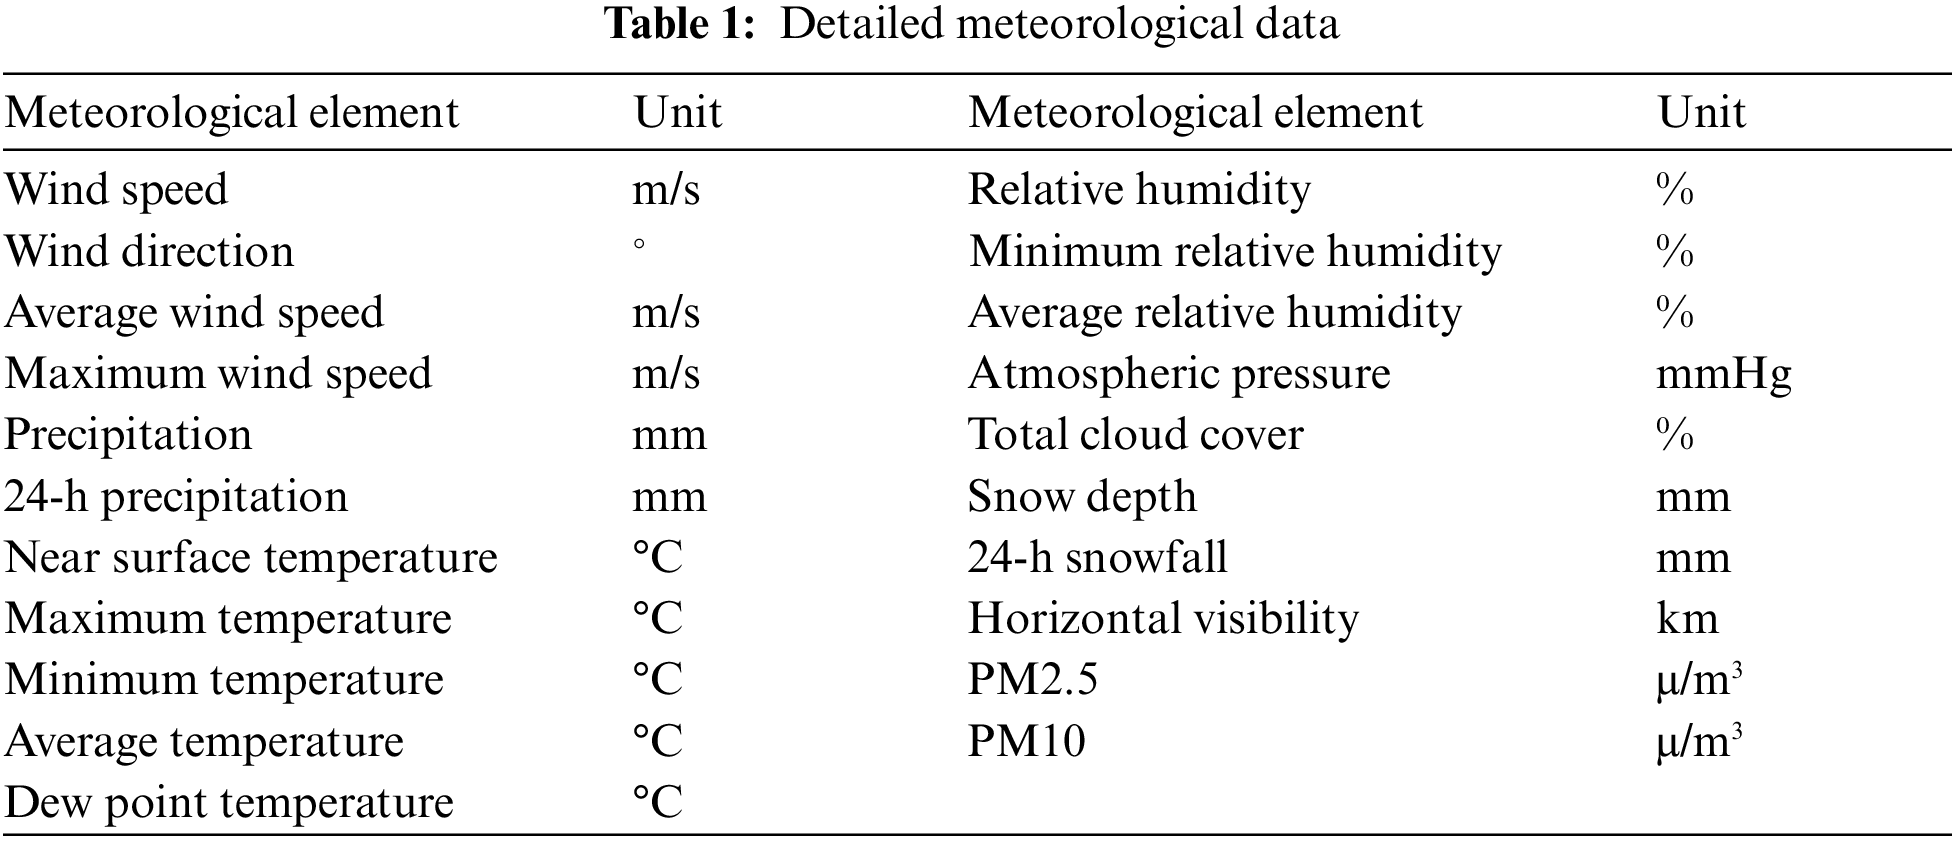
The meteorological data comprises 21 dimensions, necessitating key feature extraction. However, these data exhibit inconsistencies in units and encompass a wide range of values. To enhance computational efficiency and expedite model convergence, normalization techniques are employed:
where
The experimental environment is configured as follows: operating system Windows 10, the computer processor is 13th Gen Intel(R) Core(TM) i9-13900HX, memory is 2.20 GHz and 16 GB RAM, Python version 3.11. We simulate 3000 records of power grid faults. The samples are indexed by date and contain 21 characteristic variables such as wind speed, precipitation, and temperature, as shown in Table 1. The type of power grid fault is the dependent variable, which is normal (0), wind disaster fault (1), ice fault (2), pollution fault (3), and rain damage fault (4). The data is sorted and applied to the prediction of power grid fault type.
The meteorological data exhibits high dimensionality and imbalanced distribution, with a predominance of normal samples compared to faulty samples. If accuracy alone is employed as the sole metric for evaluating model quality, it fails to effectively capture the true impact of the model and merely represents the classification accuracy within a large sample population. Simultaneously, in the context of equipment failure prediction, overlooking any form of failure could result in severe repercussions. Hence, it is imperative to select appropriate evaluation metrics. In order to accurately predict the probability of equipment failure and enhance prediction accuracy, we employ accuracy, precision, recall, and F1-Score as evaluation metrics. The calculation formula can be expressed as follows:
where
4.4.1 Grid Fault Type Detection
To validate the efficacy of the proposed approach, we employ the subsequent baseline model and adapt it to address the task of meteorological equipment failure.
• XGBoost [23]: This model employs XGBoost to process the traffic classification task based on network traffic.
• GA-XGBoost [24]: This model employs XGBoost to analyze the characteristics of urban road traffic accidents and constructs a GA-XGBoost feature recognition model.
• GA-RF [25]: The author proposed a novel method, which combines a genetic algorithm and random forest (GA-RF), for predicting inclusions in continuous casting slabs.
The fault prediction models used in our study include the baseline model and the FE-XGBoost. We evaluate their performance using metrics such as accuracy, precision, recall, and F1. The corresponding results are presented in Table 2.
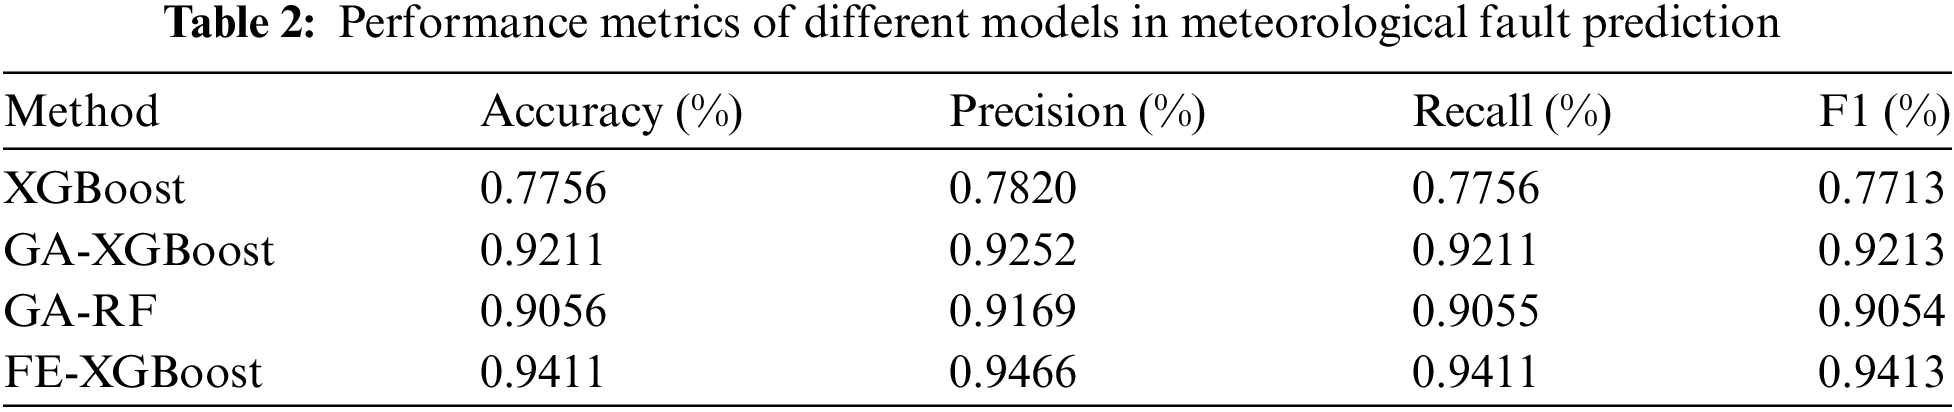
As can be seen from Table 2, the FE-XGBoost achieves the highest performance among the comparison models, with accuracy, precision, recall, and F1 reaching 94.11%, 94.66%, 94.11%, and 94.13%, respectively. This excellent performance is mainly attributed to the combination of P-SSA and XGBoost, which combines the global search ability of P-SSA and the high accuracy advantage of XGBoost. P-SSA can adaptively search for the best feature combination, further improving the prediction accuracy of the model.
The XGBoost algorithm alone exhibits subpar performance in terms of accuracy, precision, recall, and F1. Additionally, it lacks global search capability which hampers feature selection optimization and adversely affects the overall model performance. The GA-XGBoost algorithm enhances feature selection through genetic algorithms. However, its global search ability falls short compared to P-SSA resulting in slightly inadequate accuracy and prediction capabilities. Despite improvements in feature selection achieved by the GA-RF, it still achieves lower accuracy and precision than the FE-XGBoost combination due to inherent limitations of random forest.
4.4.2 Comparison of Chaos Map Methods
In order to verify the performance of the PWLCM selected in this paper, we conduct comparative experiments with the Logistic chaotic map [26] and the random generation method.
The comparison of the frequency distribution between PWLCM and logistic chaotic map is presented in Fig. 2. It can be observed that PWLCM exhibits a higher level of stability in its chaotic behavior, thereby offering enhanced global search capabilities. Fig. 3 shows the distribution of the same number of samples generated by PWLCM and random generation method. The sequence generated by the random generation method exhibits local aggregation and partial sparseness, with no values falling between 0.4 and 0.6. In contrast, the sequence generated by PWLCM demonstrates an even distribution, enabling the generation of a high-quality initial population for optimization.
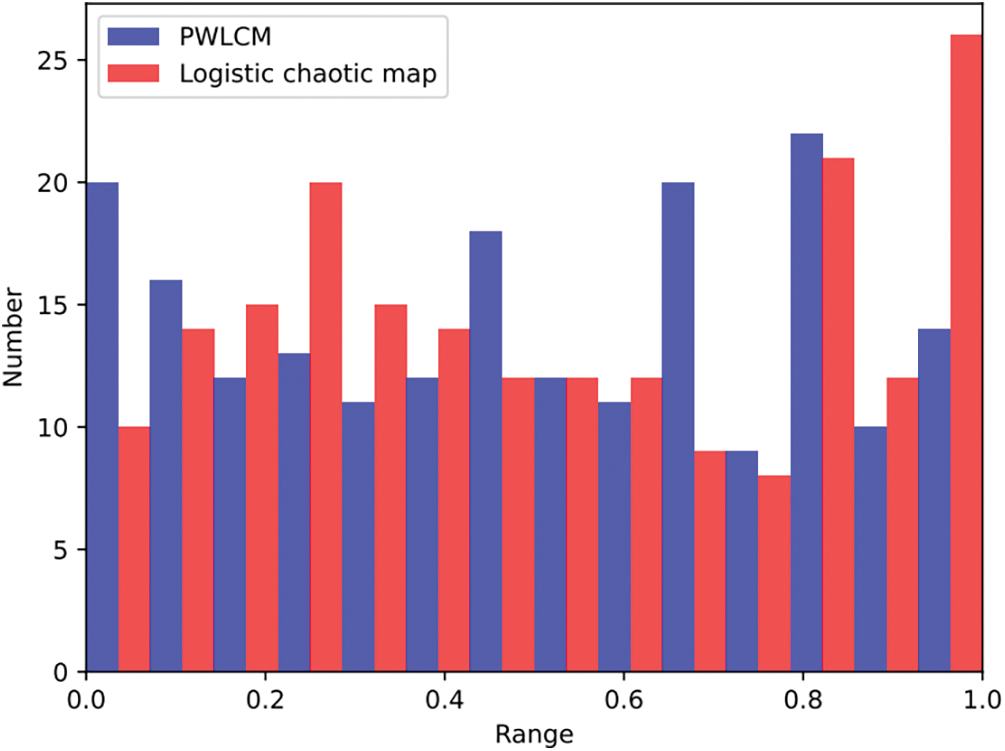
Figure 2: Comparison of frequency distribution of PWLCM and logistic chaotic map
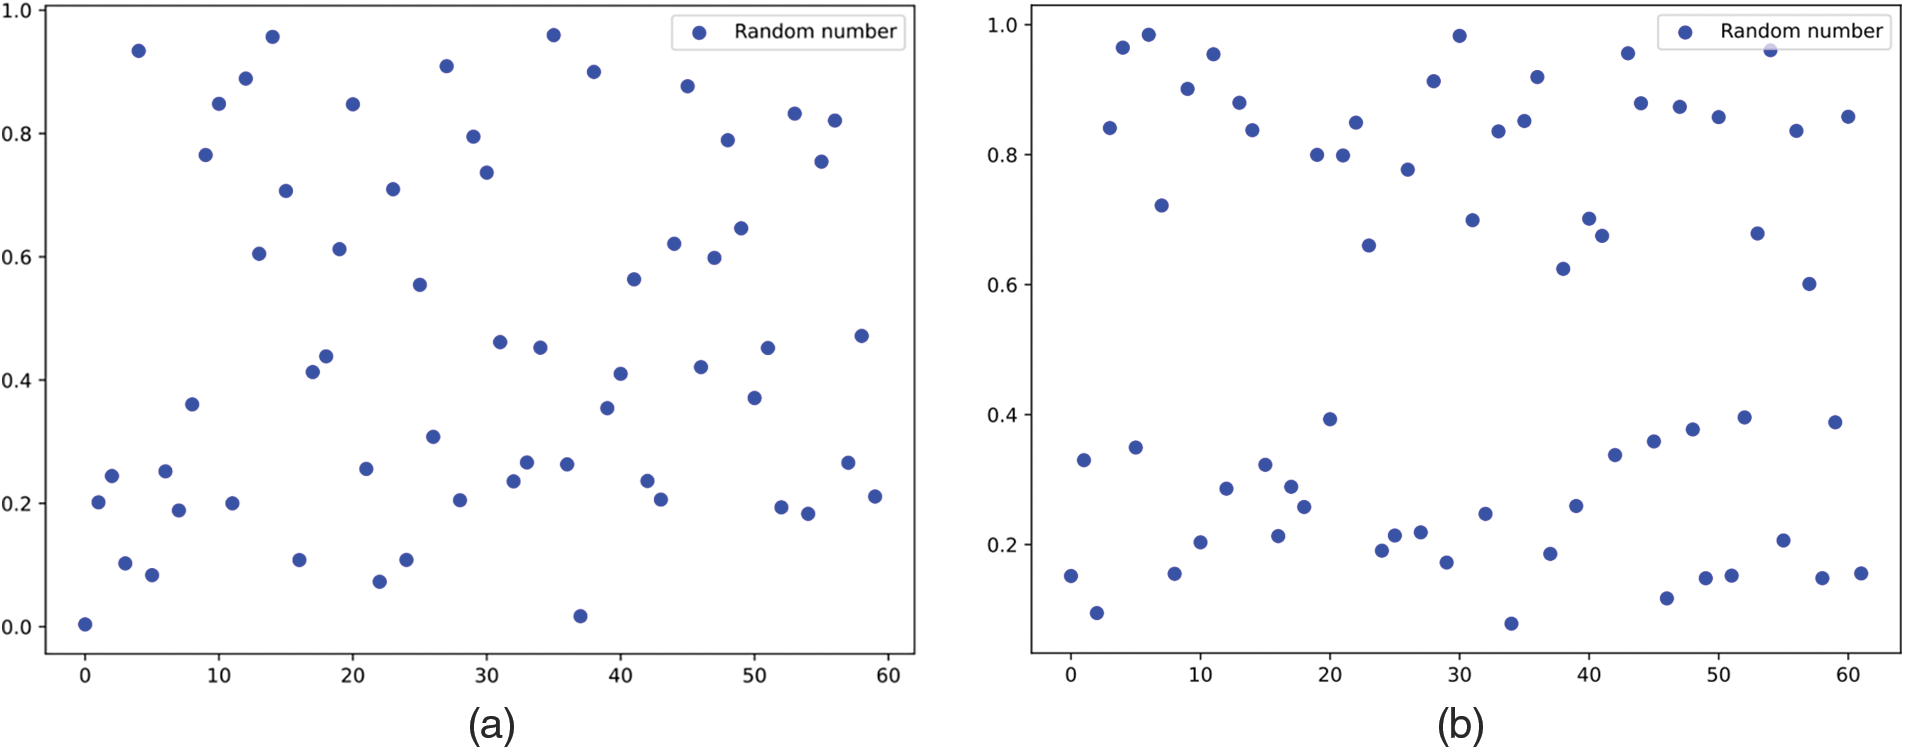
Figure 3: Comparison of initial population distribution; (a) PWLCM; (b) Random generation method
This section is based on the classification results of the FE-XGBoost in the test set. The predicted power grid fault types are “normal (0)” and “pollution flashover fault (3)”, and the ROC curves of the FE-XGBoost and the GA-XGBoost are respectively drawn, as shown in Fig. 4. The figure illustrates that the FE-XGBoost predicts AUC areas of 0.98 and 0.99 for categories 0 and 3, respectively, while the GA-XGBoost predicts AUC areas of both 0.97 for categories 0 and 3. The AUC areas of the FE-XGBoost for predicting category 0 and category 3 surpass those of the GA-XGBoost, exhibiting superior accuracy and discrimination.
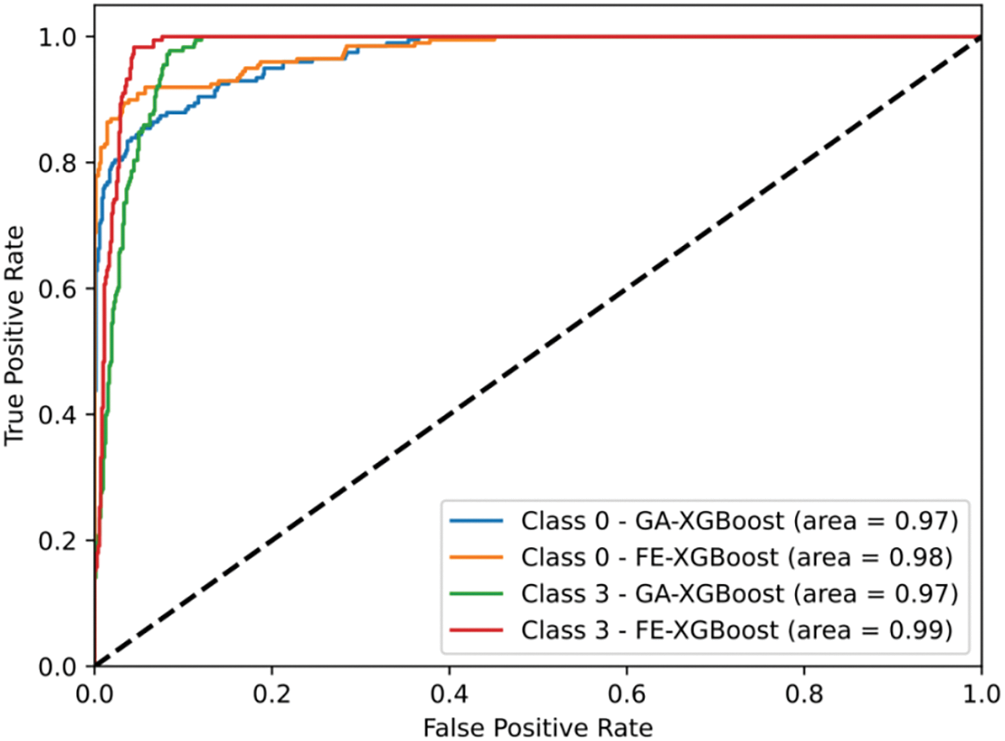
Figure 4: ROC curve comparison
4.4.4 Generalization Experiments
To validate the generalization ability of FE-XGBoost, we further conduct generalization experiments on larger-scale datasets. Fig. 5 presents the experimental results of FE-XGBoost and GA-XGBoost on ROC curves across datasets of varying sizes. We train FE-XGBoost on a dataset with 3000 samples and evaluate its performance under the same settings on a dataset with 4000 samples. We observe that FE-XGBoost outperforms GA-XGBoost when scaled to larger datasets. This superiority is mainly attributed to the fact that the FE-XGBoost extracts key meteorological features through GBDT and RFE, which enables it to efficiently deal with the complex nonlinear relationships among meteorological features. By accurately identifying and utilizing these meteorological characteristics, FE-XGBoost can achieve higher generalization performance on larger-scale datasets.
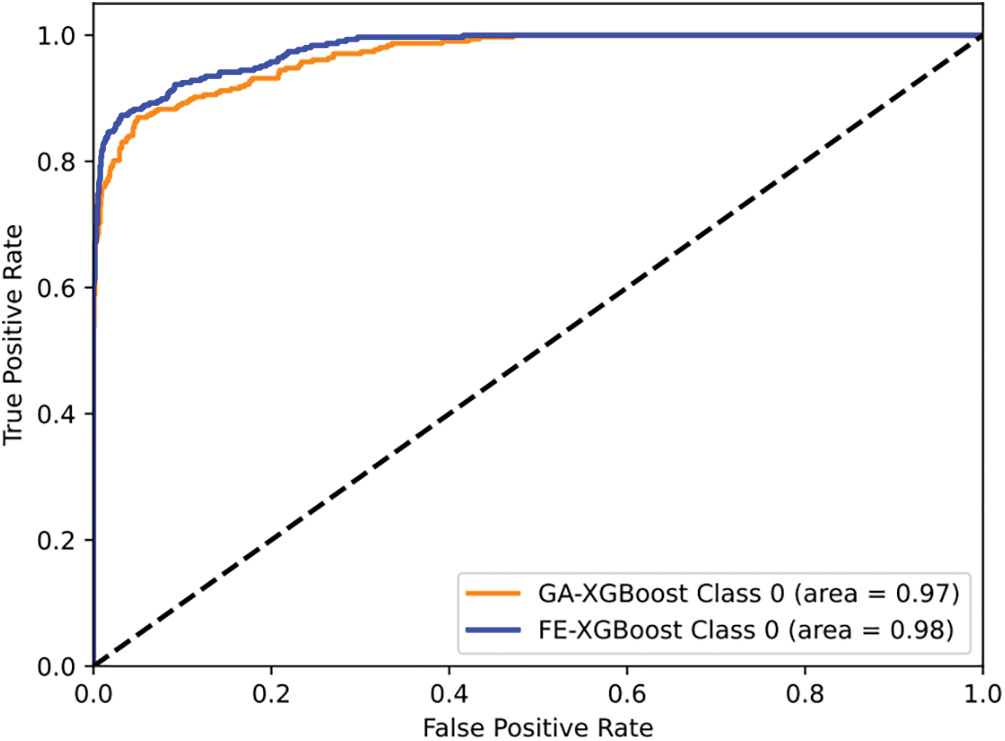
Figure 5: Generalization results on larger scale data
The root mean square error calculation results of the four models on the test set are presented in Fig. 6. It is evident from the figure that the FE-XGBoost exhibits the lowest root mean square error value of 0.5083. The prediction error of the GA-RF is slightly higher compared to that of the FE-XGBoost. The XGBoost serves as the baseline, exhibiting the highest root mean square error value of 0.7756. The GA-XGboost demonstrates an intermediate performance between FE-XGBoost and GA-RF, yielding a moderately effective prediction outcome. Therefore, based on the calculation results of root mean square error, the FE-XGBoost outperforms other models in predicting power grid fault types with higher prediction accuracy and smaller error.
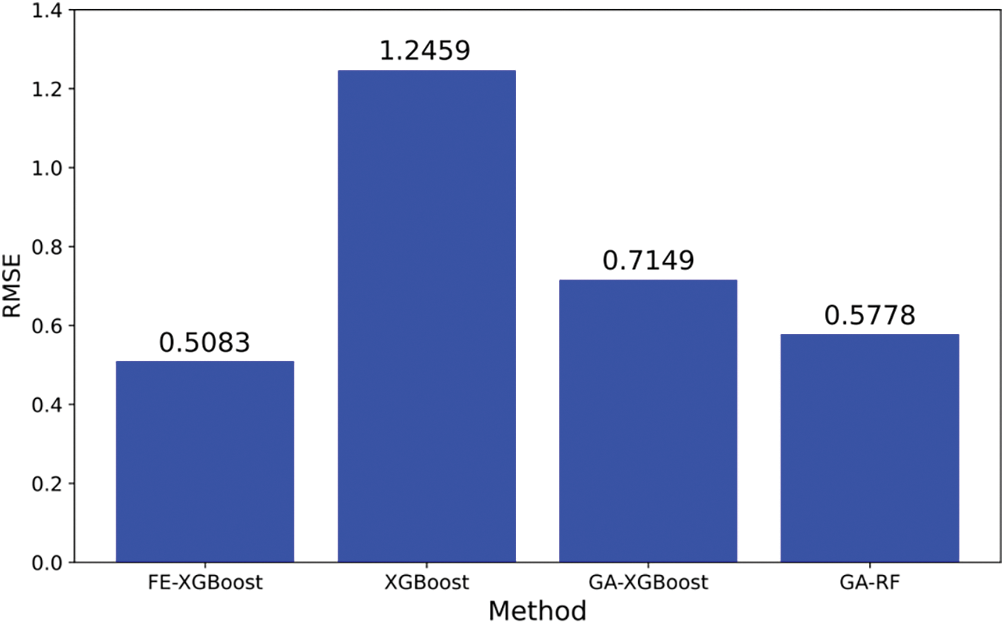
Figure 6: Comparison of RMSE for different models
We propose a feature-enhanced XGBoost-based power grid fault prediction model, FE-XGBoost, to address the nonlinear relationship between complex meteorological factors and power grid faults. First, we combine GBDT and RFE to calculate the classification accuracy and feature importance score to extract the key features. Then, we design the optimization algorithm P-SSA to find the optimal hyperparameters of XGBoost. Finally, we construct the XGBoost fault prediction model to predict the grid fault type. The experimental results show that FE-XGBoost significantly outperforms other baselines on the datasets of different sizes, verifying its effectiveness and superiority.
In the future, we intend to integrate real-time meteorological data streams, which will bolster the predictive abilities of model in ever-changing environmental conditions. Furthermore, we envision expanding the scope of model to incorporate a broader range of external factors, such as infrastructure maintenance conditions and human interventions. This expansion aims to provide a more holistic and nuanced approach to power grid fault prediction, considering both environmental and operational elements that could influence grid performance.
Acknowledgement: The authors are grateful to all the editors and anonymous reviewers for their comments and suggestions and thank all the members who have contributed to this work with us.
Funding Statement: This work is supported by the Science and Technology Project of State Grid Jiangsu Electric Power Co., Ltd. (Research on Power Meteorology Digitalization Application for Future Climate Scenarios and New Energy Operation Risks, J2023076).
Author Contributions: The authors confirm contribution to the paper as follows: study conception and design: Kai Liu; data collection: Meizhao Liu; analysis and interpretation of results: Ming Tang; draft manuscript preparation: Chen Zhang, Junwu Zhu; project supervision: Junwu Zhu. All authors reviewed the results and approved the final version of the manuscript.
Availability of Data and Materials: The raw data supporting the conclusions of this article are available from the corresponding author upon reasonable request.
Ethics Approval: Not applicable.
Conflicts of Interest: The authors declare no conflicts of interest to report regarding the present study.
References
1. O. M. Butt, M. Zulqarnain, and T. M. Butt, “Recent advancement in smart grid technology: Future prospects in the electrical power network,” Ain Shams Eng. J., vol. 12, no. 1, pp. 687–695, Jan. 2021. doi: 10.1016/j.asej.2020.05.002. [Google Scholar] [CrossRef]
2. C. M. Furse, M. Kafal, R. Razzaghi, and Y. J. Shin, “Fault diagnosis for electrical systems and power networks: A review,” IEEE Sens. J., vol. 21, no. 2, pp. 888–906, Jan. 2020. doi: 10.1109/JSEN.2020.2987321. [Google Scholar] [CrossRef]
3. A. M. Brockway and L. N. Dunn, “Weathering adaptation: Grid infrastructure planning in a changing climate,” Clim. Risk Manage., vol. 30, Jan. 2020, Art. no. 100256. doi: 10.1016/j.crm.2020.100256. [Google Scholar] [CrossRef]
4. C. J. Zhang, J. Zeng, H. Y. Wang, L. M. Ma, and H. Chu, “Correction model for rainfall forecasts using the LSTM with multiple meteorological factors,” Meteorol. Appl., vol. 27, no. 1, Jan. 2020, Art. no. e1852. doi: 10.1002/met.1852. [Google Scholar] [CrossRef]
5. B. Kıyak, H. F. Öztop, F. Ertam, and İ.G. Aksoy, “An intelligent approach to investigate the effects of container orientation for PCM melting based on an XGBoost regression model,” Eng. Anal. Bound. Elem., vol. 161, pp. 202–213, Jan. 2024. doi: 10.1016/j.enganabound.2024.01.018. [Google Scholar] [CrossRef]
6. F. Selimefendigil and H. F. Öztop, “Thermal and phase change process in a branching T-channel under active magnetic field and two rotating inner cylinders: Analysis and predictions by radial basis neural networks,” Int. J. Heat Mass Transf., vol. 217, Jan. 2023, Art. no. 124548. doi: 10.1016/j.ijheatmasstransfer.2023.124548. [Google Scholar] [CrossRef]
7. J. Guo, S. Gu, W. Feng, Y. Chen, and H. Zhang, “Lightning warning method of transmission lines based on multi-information fusion: Analysis of summer thunderstorms in Jiangsu,” presented at the Int. Conf. Light. Prot. (ICLPShanghai, China, Oct. 6–10, 2014, pp. 600–605. doi: 10.1109/ICLP.2014.6973195. [Google Scholar] [CrossRef]
8. H. Hou et al., “A hybrid prediction model for damage warning of power transmission line under typhoon disaster,” IEEE Access, vol. 8, pp. 85038–85050, Aug. 2020. doi: 10.1109/ACCESS.2020.2992528. [Google Scholar] [CrossRef]
9. D. Li, Y. Gong, S. Shen, and G. Feng, “Research and design of meteorological disaster early warning system for power grid based on big data technology,” presented at the 2020 Asia Energy Electr. Eng. Symp. (AEEESChengdu, China, May 2020, pp. 658–662. doi: 10.1109/AEEES48850.2020.9121375. [Google Scholar] [CrossRef]
10. X. Chen, J. Tang, Q. Chang, and W. Li, “A data-driven method for operational reliability prediction on electric devices considering multiple meteorological factors,” presented at the IEEE Int. Conf. Probabilistic Methods Appl. Power Syst. (PMAPSBoise, ID, USA, Jun. 18–22, 2018, pp. 1–6. doi: 10.1109/PMAPS.2018.8440321. [Google Scholar] [CrossRef]
11. R. Lin, Z. Pei, Z. Ye, B. Wu, and G. Yang, “A voted based random forests algorithm for smart grid distribution network faults prediction,” Enterp Inf. Syst., vol. 14, no. 4, pp. 496–514, Aug. 2020. doi: 10.1080/17517575.2019.1600724. [Google Scholar] [CrossRef]
12. J. Fang, H. Wang, F. Yang, K. Yin, X. Lin and M. Zhang, “A failure prediction method of power distribution network based on PSO and XGBoost,” Aust J. Electr. Electron. Eng., vol. 19, no. 4, pp. 371–378, Nov. 2022. doi: 10.1080/1448837X.2022.2072447. [Google Scholar] [CrossRef]
13. Z. Yu, J. Feng, S. Tang, Z. Liu, Y. Yan and N. Luo, Disaster Intelligent Perception and Emergency Command of Power Grid. Singapore, Singapore: Springer Nature, 2024. Accessed: Nov. 17, 2023. [Online]. Available: https://link.springer.com/book/10.1007/978-981-99-7236-4 [Google Scholar]
14. Z. Zhang et al., “Vulnerability of machine learning approaches applied in IoT-based smart grid: A review,” IEEE Internet Things J., vol. 11, no. 11, pp. 18951–18975, Nov. 2024. doi: 10.1109/JIOT.2024.3349381. [Google Scholar] [CrossRef]
15. J. H. Friedman, “Greedy function approximation: A gradient boosting machine,” Ann. Stat., vol. 29, no. 5, pp. 1189–1232, Sep. 2001. doi: 10.1214/aos/1013203450. [Google Scholar] [CrossRef]
16. N. S. Escanilla, L. Hellerstein, R. Kleiman, Z. Kuang, J. Shull and D. Page, “Recursive feature elimination by sensitivity testing,” presented at the 17th IEEE Int. Conf. Mach. Learn. Appl. (ICMLAMiami, FL, USA, Dec. 17–20, 2018, pp. 40–47. doi: 10.1109/ICMLA.2018.00014. [Google Scholar] [CrossRef]
17. S. Li, X. Mou, Y. Cai, Z. Ji, and J. Zhang, “On the security of a chaotic encryption scheme: Problems with computerized chaos in finite computing precision,” Comput. Phys. Commun., vol. 153, no. 1, pp. 52–58, Jan. 2003. doi: 10.1016/S0010-4655(02)00875-5. [Google Scholar] [CrossRef]
18. J. Xue and B. Shen, “A novel swarm intelligence optimization approach: Sparrow search algorithm,” Syst. Sci. Control Eng., vol. 8, no. 1, pp. 22–34, Feb. 2020. doi: 10.1080/21642583.2019.1708830. [Google Scholar] [CrossRef]
19. T. Chen and C. Guestrin, “XGBoost: A scalable tree boosting system,” presented at the 22nd ACM SIGKDD Int. Conf. Knowl. Discov. Data Min., San Francisco, CA, USA, Aug. 2016, pp. 785–794. doi: 10.1145/2939672.2939785. [Google Scholar] [CrossRef]
20. H. A. Chipman, E. I. George, and R. E. McCulloch, “Bayesian CART model search,” J. Amer. Stat. Assoc., vol. 93, no. 443, pp. 935–948, Sep. 1998. doi: 10.1080/01621459.1998.10473750. [Google Scholar] [CrossRef]
21. M. Mavrovouniotis, C. Li, and S. Yang, “A survey of swarm intelligence for dynamic optimization: Algorithms and applications,” Swarm Evol. Comput., vol. 33, pp. 1–17, Dec. 2017. doi: 10.1016/j.swevo.2016.12.005. [Google Scholar] [CrossRef]
22. R. Caponetto, L. Fortuna, S. Fazzino, and M. G. Xibilia, “Chaotic sequences to improve the performance of evolutionary algorithms,” IEEE Trans. Evol. Comput., vol. 7, no. 3, pp. 289–304, Jun. 2003. doi: 10.1109/TEVC.2003.810069. [Google Scholar] [CrossRef]
23. I. L. Cherif and A. Kortebi, “On using eXtreme Gradient Boosting (XGBoost) machine learning algorithm for home network traffic classification,” presented at the Wirel. Days (WD), Manchester, UK, Apr. 15–17, 2019, pp. 1–6. doi: 10.1109/WD.2019.8734193. [Google Scholar] [CrossRef]
24. Y. Qu, Z. Lin, H. Li, and X. Zhang, “Feature recognition of urban road traffic accidents based on GA-XGBoost in the context of big data,” IEEE Access, vol. 7, pp. 170106–170115, 2019. doi: 10.1109/ACCESS.2019.2952655. [Google Scholar] [CrossRef]
25. L. Xiong, Z. Q. Luo, and B. B. Dan, “A method for predicting the quality of slabs based on GA-RF algorithm,” presented at the 2021 IEEE 16th Conf. Ind. Electron. Appl. (ICIEAChengdu, China, 2021, pp. 1637–1642. doi: 10.1109/ICIEA51954.2021.9516413. [Google Scholar] [CrossRef]
26. A. Kanso and N. Smaoui, “Logistic chaotic maps for binary numbers generations,” Chaos Solit. Fractals, vol. 40, no. 5, pp. 2557–2568, May 2009. doi: 10.1016/j.chaos.2007.10.049. [Google Scholar] [CrossRef]
Cite This Article
 Copyright © 2025 The Author(s). Published by Tech Science Press.
This work is licensed under a Creative Commons Attribution 4.0 International License , which permits unrestricted use, distribution, and reproduction in any medium, provided the original work is properly cited.
 Downloads
 Citation Tools