
 Submit a Paper
 Propose a Special lssue
 Open Access
ARTICLE

HMFM: A Method for Identifying High-Value Patents by Fusing Multiple Features
School of Computer Science, Hubei University of Technology, Wuhan, 430068, China
* Corresponding Author: Jiuan Zhang. Email:
Computers, Materials & Continua 2025, 82(2), 2235-2254. https://doi.org/10.32604/cmc.2024.058103
Received 04 September 2024; Accepted 15 November 2024; Issue published 17 February 2025
 View Full Text
 Download PDF
Abstract
Rapid and accurate identification of high-quality patents can accelerate the transformation process of scientific and technological achievements, optimize the management of intellectual property rights and enhance the vitality of innovation. Aiming at the shortcomings of the traditional high-value patent assessment method, which is relatively simple and seldom considers the influence of patentees, this paper proposes a high-quality patent method HMFM (High-Value Patent Multi-Feature Fusion Method) that fuses multi-dimensional features. A weighted node importance assessment method in complex network called GLE (Glob-Local-struEntropy) based on improved structural entropy is designed to calculate the influence of the patentee to form the patentee’s features, and the patent text features are extracted by BERT-DPCNN deep learning model, which is supplemented to the basic patent indicator system. Finally a machine learning algorithm is used to assess the value of patents. Experiment results show that our method can identify high-value patents more effectively and accurately.Keywords
Patent is an important driving force for the development of high and new technology, and the transformation of patented technology achievements into practical applications can not only bring economic benefits and competitive advantages to enterprises, promote scientific and technological progress, but also strengthen intellectual property protection, optimize the innovation environment, and comprehensively promote the development of technology, economy and society. However, the low rate of transformation of patented technology achievements has also been a long-standing problem. According to the data from the State Intellectual Property Office (SIPO) of China, the industrialization rate of China’s invention patents in 2023 was only 39.6%, which still has a huge room for improvement [1].
The identification of high-value patents is of great significance to the transformation of patents, intellectual property management and the enhancement of innovation vitality. From the perspective of enterprises, identifying and acquiring high-value patents can not only provide enterprises with a clear direction of technological development, optimize resource allocation, avoid repetitive R&D, and circumvent potential risks in technological innovation, but also raise the technology barriers of the enterprises, and safeguard their core competitiveness, so as to realize sustainable development and long-term profitability. From the perspective of the country and the science and technology management department, the accurate identification of high-value patents contributes to the rational allocation of resources and the effective formulation of policies. The identification of high-value patents can help resources tilt towards more innovative units or individuals, making the benefits of resources be maximized. From the perspective of researchers, the identification of high-value patents provides strong support and guarantee for their high-level innovation activities. Through applying for and being granted high-value patents, researchers may receive more support such as funds and resources, which motivates them to conduct more innovative research. To sum up, the identification of high-value patents plays an important role in economic and social development.
With the advent of the big data era, traditional patent value assessment methods show deficiencies in speed and accuracy when dealing with massive patent data. Most of the existing methods rely on the indicator system, and the selection and weight setting of assessment indicators usually depend on the experience of experts, affecting the objectivity and consistency of the assessment. In the existing patent value assessment system, indicators such as the number of patent citations, the size of patent family, and the life cycle of patents are usually used for evaluation. These indicators mainly rely on quantitative data, easily ignoring the rich semantic information contained in the patent texts. Patent text contains detailed technical description, innovation and legal protection scope, which are of great significance for the comprehensive and accurate assessment of the technical value and market potential of patents. Existing methods seldom consider these textual semantic features, resulting in a certain degree of bias in the assessment results. In addition, the influence of the patentee is also a factor that cannot be ignored. The technical strength, market position and innovation ability of the patentee have an important impact on the practical application value of a patent. However, the existing valuation system often ignores this factor.
Based on this, this paper proposes a high-value patent identification method HMFM (High-Value Patent Multi-Feature Fusion Method) that integrates multiple features. The contributions of this paper are as follows: (1) A high-value patent identification method HMFM incorporating multi-dimensional features is proposed, which breaks through the limitations of existing methods relying on a single feature to assess the quality of patents. (2) A weighted complex network node importance evaluation method GLE (Glob-Local-struEntropy) algorithm with improved structural entropy is designed for quantifying the influence of patentees in patent networks, which is an innovation in patent network analysis.
At present, there is no consensus on the definition of high-quality patents. Researchers have proposed different criteria for measuring high-quality patents from different perspectives. For example, Wu et al. [2] advocate that patent quality should be evaluated by the number of years it has been maintained. They believe the fact that a patent can be maintained for a long period of time implies that it has technological and commercial value, which can be used as an important indicator of high-quality patents. Weinstein et al. [3] think that high-quality patents should be characterized by a high degree of legal resilience and a low cost of patent maintenance from the view of legal stability. In addition, Xu et al. [4] propose a more comprehensive evaluation standard. They argue that the evaluation of patent quality should include technical progressiveness and economic efficiency. This view emphasizes the dual contribution of patents in terms of both technology and economy.
With the development of intellectual property rights, domestic and foreign scholars actively conduct research on patent value assessment. The current research on patent value assessment mainly starts from three dimensions, that is, technical dimension, legal dimension and economic dimension. In the technical dimension, Trajtenberg [5] thinks that the number of patent citations is a more commonly used indicator to evaluate the value of patents, but there are great limitations, such as different citation habits in different technical fields. In addition, the number of citations may also be affected by strategic citations and self-citations, which cannot fully reflect the real technical value and market potential of patents. So scholars study the patent value indicators from the legal dimension, Nordhaus [6] believes that the patent life determines the patent value, the longer the patent survival time, the higher its technical value. Fischer et al. [7] believe that the number of patent citations and the number of countries where the application filed are positively correlated with the patent value. Caviggioli et al. [8] find that the number of inventors and the remaining life of the patent can better reflect the relationship with patent value. Moreover, more indicators for assessing the value of patents are proposed, including the survival period, the number of patent licenses, and the number of patent pledges, which are mainly based on the economic dimension. However, these unidimensional value indicators are too one-sided. Recently, researchers use multidimensional indicators to construct a patent value assessment system to judge patent value more comprehensively [9].
Patent value assessment methods usually use various tools and techniques, such as statistical analysis, market research, patent data analysis tools and models, to quantify the value of specific patents or patent portfolios at the commercial, legal, and strategic levels. For traditional patent value assessment methods, researchers mainly drawn on the cost, market and income approach commonly used in valuation of intangible asset [10]. However, there are significant limitations. These limitations stem from the unique nature of patents themselves, including their legal attributes, technological innovation, and dynamic changes in the market environment, which make it difficult for traditional intangible asset valuation methods to accurately reflect the actual value of patents. Therefore, patent value assessment requires new technologies and methods to capture the potential value of patents more accurately and quickly.
In recent years, with the development of machine learning technology, more and more scholars began to use machine learning to assess the value of patents [11]. Ran et al. [12] propose a machine learning based method, using AutoGluon classification algorithm, to quickly identify the actual value of patents. Trappey et al. [13] apply deep learning models to evaluate the potential value of patents in IoT domain. The results show that the accuracy of the model exceeds 95%. Xiao et al. [14] propose an innovative patent value evaluation combination prediction model. This model integrates multiple prediction methods and uses neural networks for training. Empirical results show that it has high prediction accuracy and stability in patent value evaluation. Hu et al. [15] achieve automatic prediction of high-value patents by constructing a multidimensional indicator system and using advanced machine learning algorithms. Through the application of MIV algorithm, the contribution and impact of various dimensional indicators are analyzed in depth, and the effectiveness and rationality of the indicator system is verified.
In addition, other patent value recognition methods have also achieved good results. Wan et al. [16] design a research method based on the theory of complex network to investigate the factors affecting patent value. By constructing and analyzing the network relationships between patents, the flow of knowledge in the innovation process is revealed. By capturing and tracking the propagation paths and associations of knowledge in innovation activities, the relative value of patents in this network can be well measured, providing a new perspective for evaluating the relative value of patents. Sun [17] proposes an improved Black Scholes option valuation model. In traditional Black Scholes models, due to the inability to fully consider the interactions of multiple variables, valuation results often have biases. With the introduction of genetic algorithms, this model can search and optimize in a multidimensional parameter space, thereby more accurately reflecting the true value of patents. By conducting sensitivity analysis on different variables, researchers can evaluate the specific impact of various factors on patent value, such as market volatility, technology lifecycle, competition intensity, etc. These factors can be quantitatively analyzed through models.
However, existing machine learning algorithms and other methods mainly rely on patent indicators, without delving into the content of patent texts and the implicit patent value of patentees. This limitation makes the evaluation results unable to reflect the potential technological value and innovation level of the patent to a certain extent. HMFM proposed in this paper can effectively compensate for this deficiency. By integrating multidimensional data, in-depth analysis of the content of patent texts, the characteristics of patentees, and their innovative activities in the technical field, high-value patents can be identified more comprehensively and accurately.
3 High Value Patent Identification Method
The methodology of this paper was originally designed to explore the key factors and influencing mechanisms about high-value patents. Through in-depth observation of patents that have been recognized by authorities as high-value or have generated significant economic benefits, we find that the right holders of these patents are usually individuals or organizations that have significant influence in their professional fields or industries. This influence may stem from their outstanding performance in technological innovation, market development or policy formulation, enabling them to occupy a favorable position in the process of patent application, protection and enforcement. Moreover, we note the rich technical information contained in the text of the patent itself, which is important for understanding the value and potential of the patent. High-value patents often cover leading-edge or advanced technological content. Therefore, accurately interpreting and analyzing the technical details and legal requirements in the text of a patent is important for assessing its commercial value and its position in the innovation ecosystem.
HMFM proposed in this paper integrates multiple features of patents, including text features, patentee features, and base indicator features, and improves the accuracy and reliability of patent value assessment. The framework of the method is shown in Fig. 1.
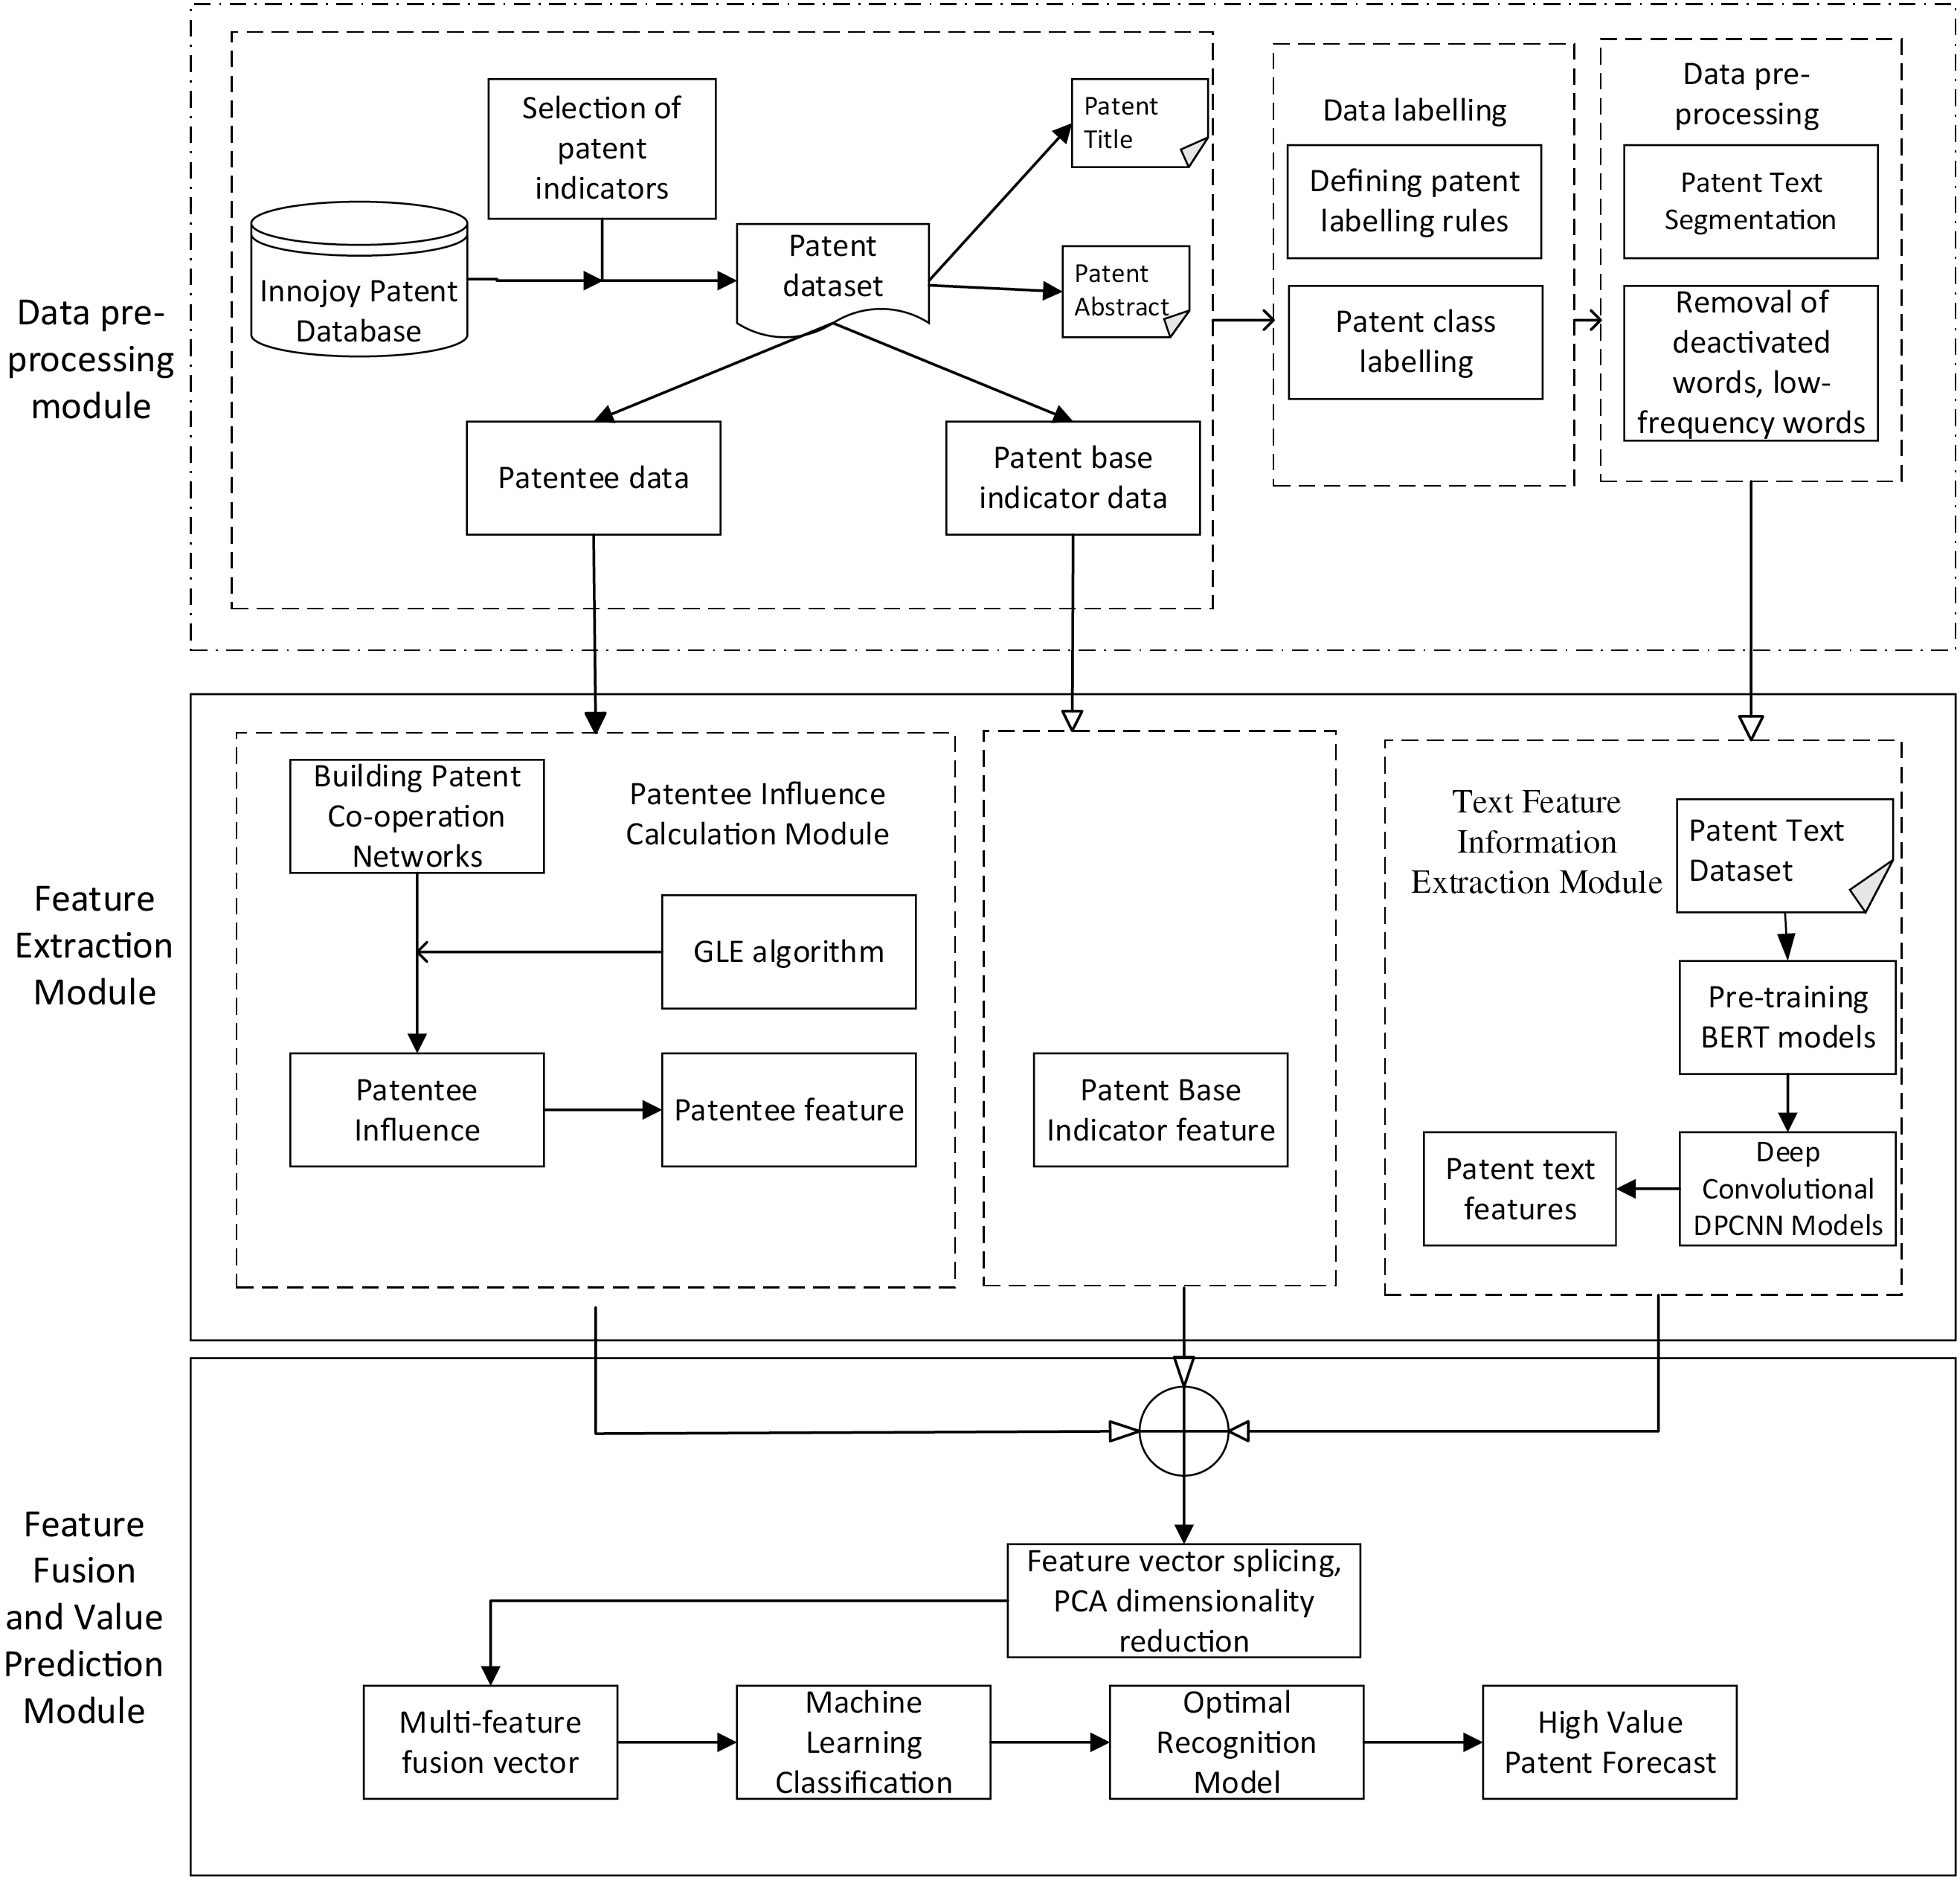
Figure 1: The framework of HMFM
The framework consists of a data preprocessing module, a patentee influence calculation module, a text feature information extraction module, a multi-feature fusion module, and a patent value prediction module. In the data preprocessing module, patent information is extracted from the patent database, including basic attributes such as patent title, disclosure number, abstract, patentee, number of citations, etc. The patent abstract and title are spliced and processed to form the patent text. After that, the processed patent data are labeled. In the patentee influence calculation module, GLE algorithm proposed in this paper is used to calculate the patentee influence. In the text feature information extraction module, the BERT-DPCNN model is used to generate high-quality word vectors for each text. In the multi-feature fusion module, feature splicing and Principal Component Analysis (PCA) are used to fuse the basic indicator features, patentee indicator features, and text features, to achieve dimension reduction and features’ fusion. In the patent value prediction module, the fused features are fed into multiple machine learning classifiers, and the optimal model is selected for high-value patent prediction. The flowchart of HMFM is shown in Fig. 2.
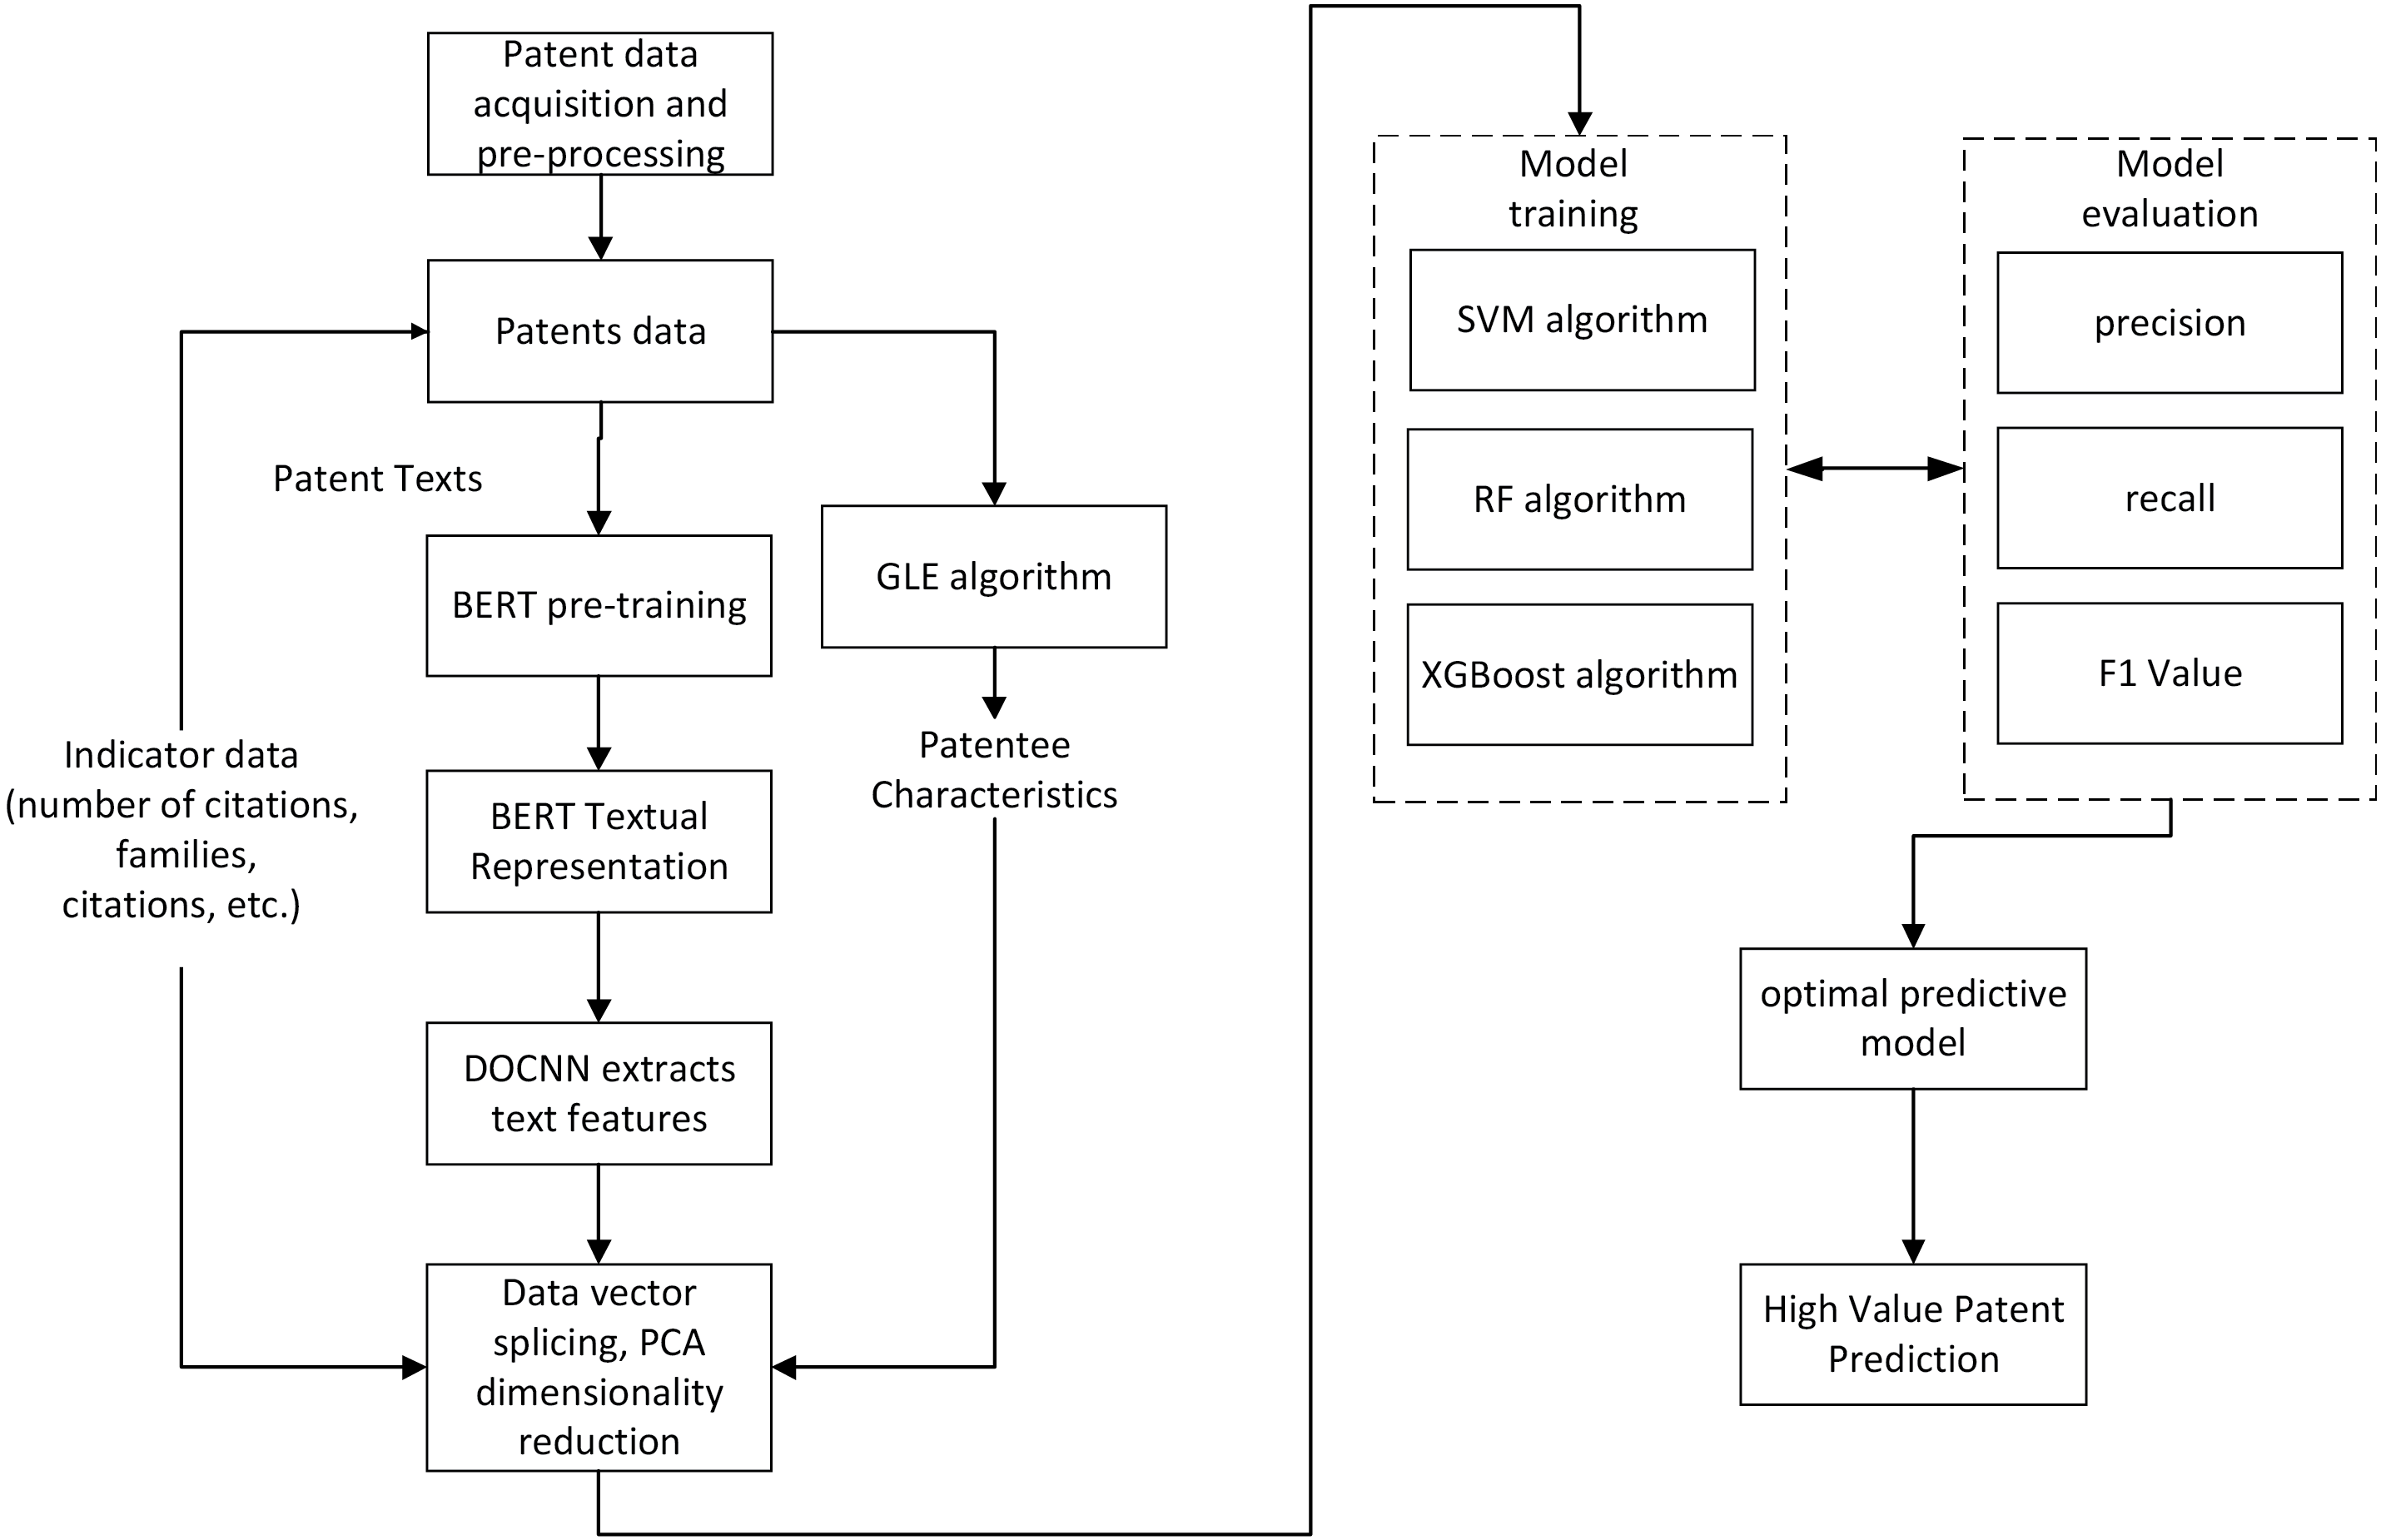
Figure 2: The flowchart of the model HMFM
3.1 Selection of Patent Base Indicators
Patent indicators play an important role in the task of patent value assessment, and the scientific selection of high-value patent indicators can help us identify the technical value and market potential of patents. Common patent indicators can usually be divided into three main categories: technical dimension, economic dimension and legal dimension. In order to assess the value of patents more comprehensively, this paper selects the above three dimensions as the most basic patent indicators and constructs a basic patent indicator system to provide an all-round assessment basis for patent value. The indicators and specific descriptions selected in this paper are shown in Table 1.

3.2 Patentee Influence Calculation
Few scholars have considered the patentee dimension in the current studies on patent value assessment, and the neglect of the patentee dimension has led to the limitations of the existing assessment methods in practical application. For example, the same patented technology in the hands of different patentees may show very different market performance and technology scalability. Some enterprises have strong R&D and marketing capabilities, and they can fully explore and utilize the potential value of patents, while others may not be able to bring their patents into play due to limited resources or lack of relevant experience. Therefore, this paper proposes the indicators of the number of patentees and the influence of patentees from the dimension of patentees and integrates them into the basic patent indicator system. Among them, the number of patentees indicates the cooperation and resource investment involved in the R&D process of the patent, reflecting the complexity and technical content of the patent. The influence of the patentee reflects the technical strength, market position and resource advantages of the patentee. Patents owned by high impact patentees are usually more likely to attract investors and partners and will have stronger competitiveness in terms of market promotion and application landing.
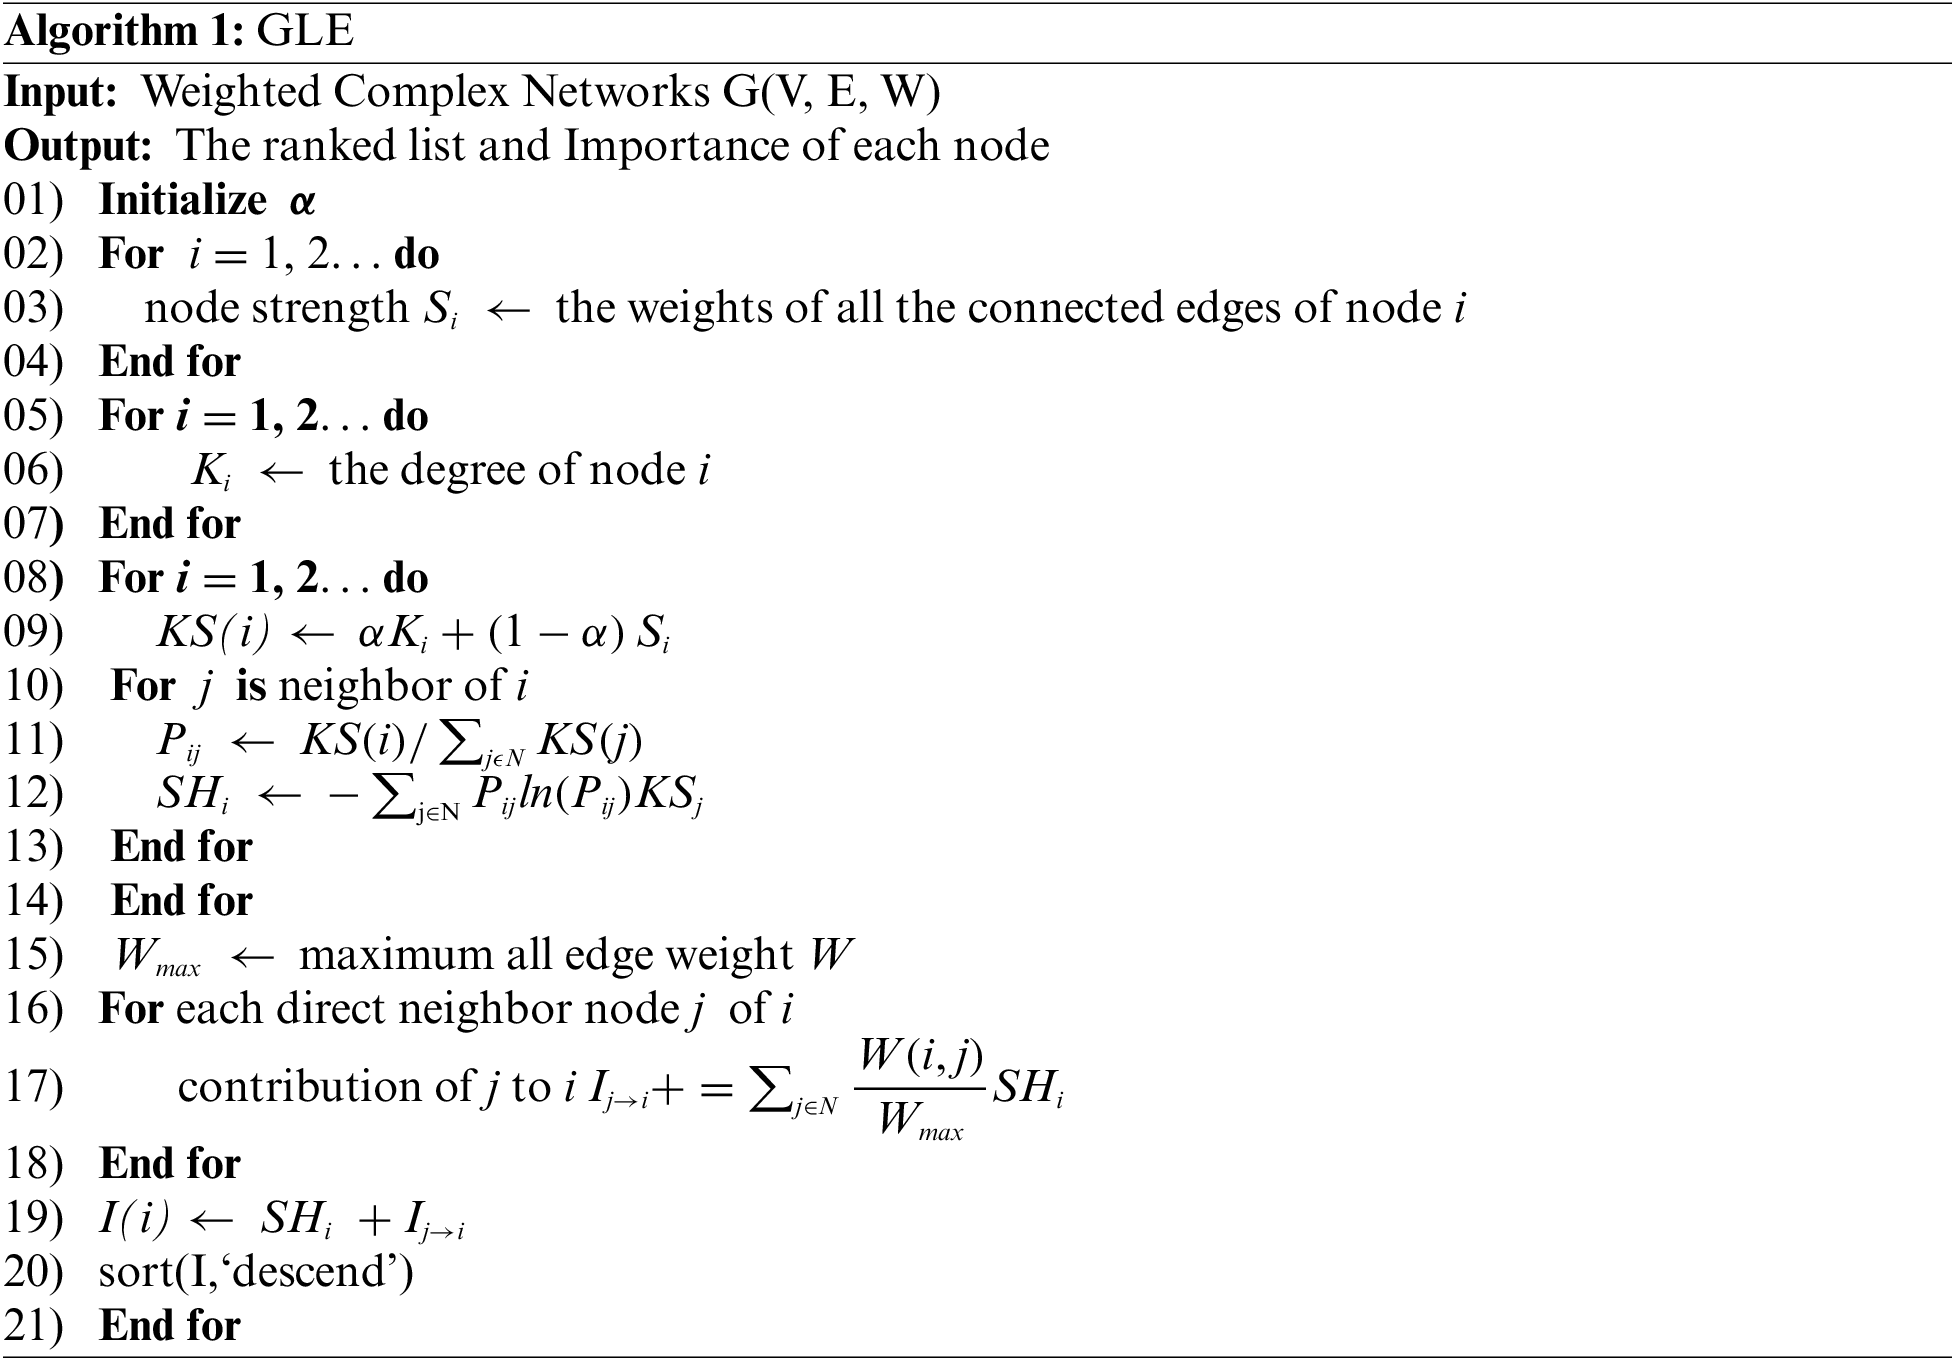
In this paper, a weighted node importance assessment method in complex network called GLE with improved structural entropy is proposed to identify the influence of patentees. The GLE algorithm first defines the weighted degree of a node based on its degree and strength, and then introduces structural entropy on the basis of the weighted degree to measure the influence of a node. In order to effectively get the global position information of nodes, K-shell algorithm is introduced and a new method of calculating the comprehensive structural information entropy of nodes is proposed. Finally, the importance degree of the node in the network is obtained based on the structural entropy of the node and the contribution of different neighbor nodes. The exact steps of the algorithm are shown below:
Step 1: Extract patent data to form a weighted complex network G = (V, E, W), where patentees are mapped as the basic nodes in the network; the patent co-operation relationships that exist between patentees are mapped as the edges of the network; and the frequency of co-patenting between patentees is mapped as the weight of the edge.
Step 2: Calculate the strength of the node. The strength of node i is the sum of the weights of its connecting edges. The definition is shown in Eq. (1).
where N is the set of direct neighbor nodes of node i.
Step 3: Calculate the weighted degree of the node with Eq. (2).
where
Step 4: Calculate the selection probability
Step 5: Calculate the node structure entropy using Eq. (4).
Step 6: Introduce in the K-shell algorithm to calculate the comprehensive structural entropy of the nodes. K-shell can effectively extract the global position information of the nodes in the network. Based on this method, this paper proposes a new method to calculate the comprehensive structural entropy of nodes in the network. The method not only covers the local information of nodes in the network, but also includes the global information of nodes in the network. The formula for calculating the comprehensive structural information entropy of a node is shown in Eq. (5).
where
Step 7: Importance of nodes. The importance of node i depends on the structural entropy of node i and the contribution of neighbor nodes to it. The node importance of node i is defined as shown in Eq. (6).
Step 8: Output the importance of each node in the constructed network G along with its ranking.
The GLE algorithm can well calculate the cooperation influence of a patentee in a certain field. If a patentee has no cooperation relationship with other patentees, we consider that the patentee has low influence in the field and set its influence to 0. The pseudo-code of this algorithm is shown in Algorithm 1. In Line 1, α is initialized; in Lines 2 to 4, the weighting degree of the node is calculated based on the node degree and intensity; in Lines 5 to 6, the integrated structural entropy of the node is calculated based on the weighting degree; the importance of the node is calculated in Lines 7–11.
3.3 Text Feature Information Extraction
The abstract and title of a patent describes the core content and innovation of the invention, and also contains key information such as technical field, technical scheme, technical effect, etc. By analyzing the keywords, technical terms, innovation points in the abstract, the technical value and market potential of the patent can be quickly understood. In this paper, we use the BERT-DPCNN deep learning model to extract features from the patent text, to capture the information structure and semantic association in the patent text more comprehensively. The model is shown in Fig. 3.
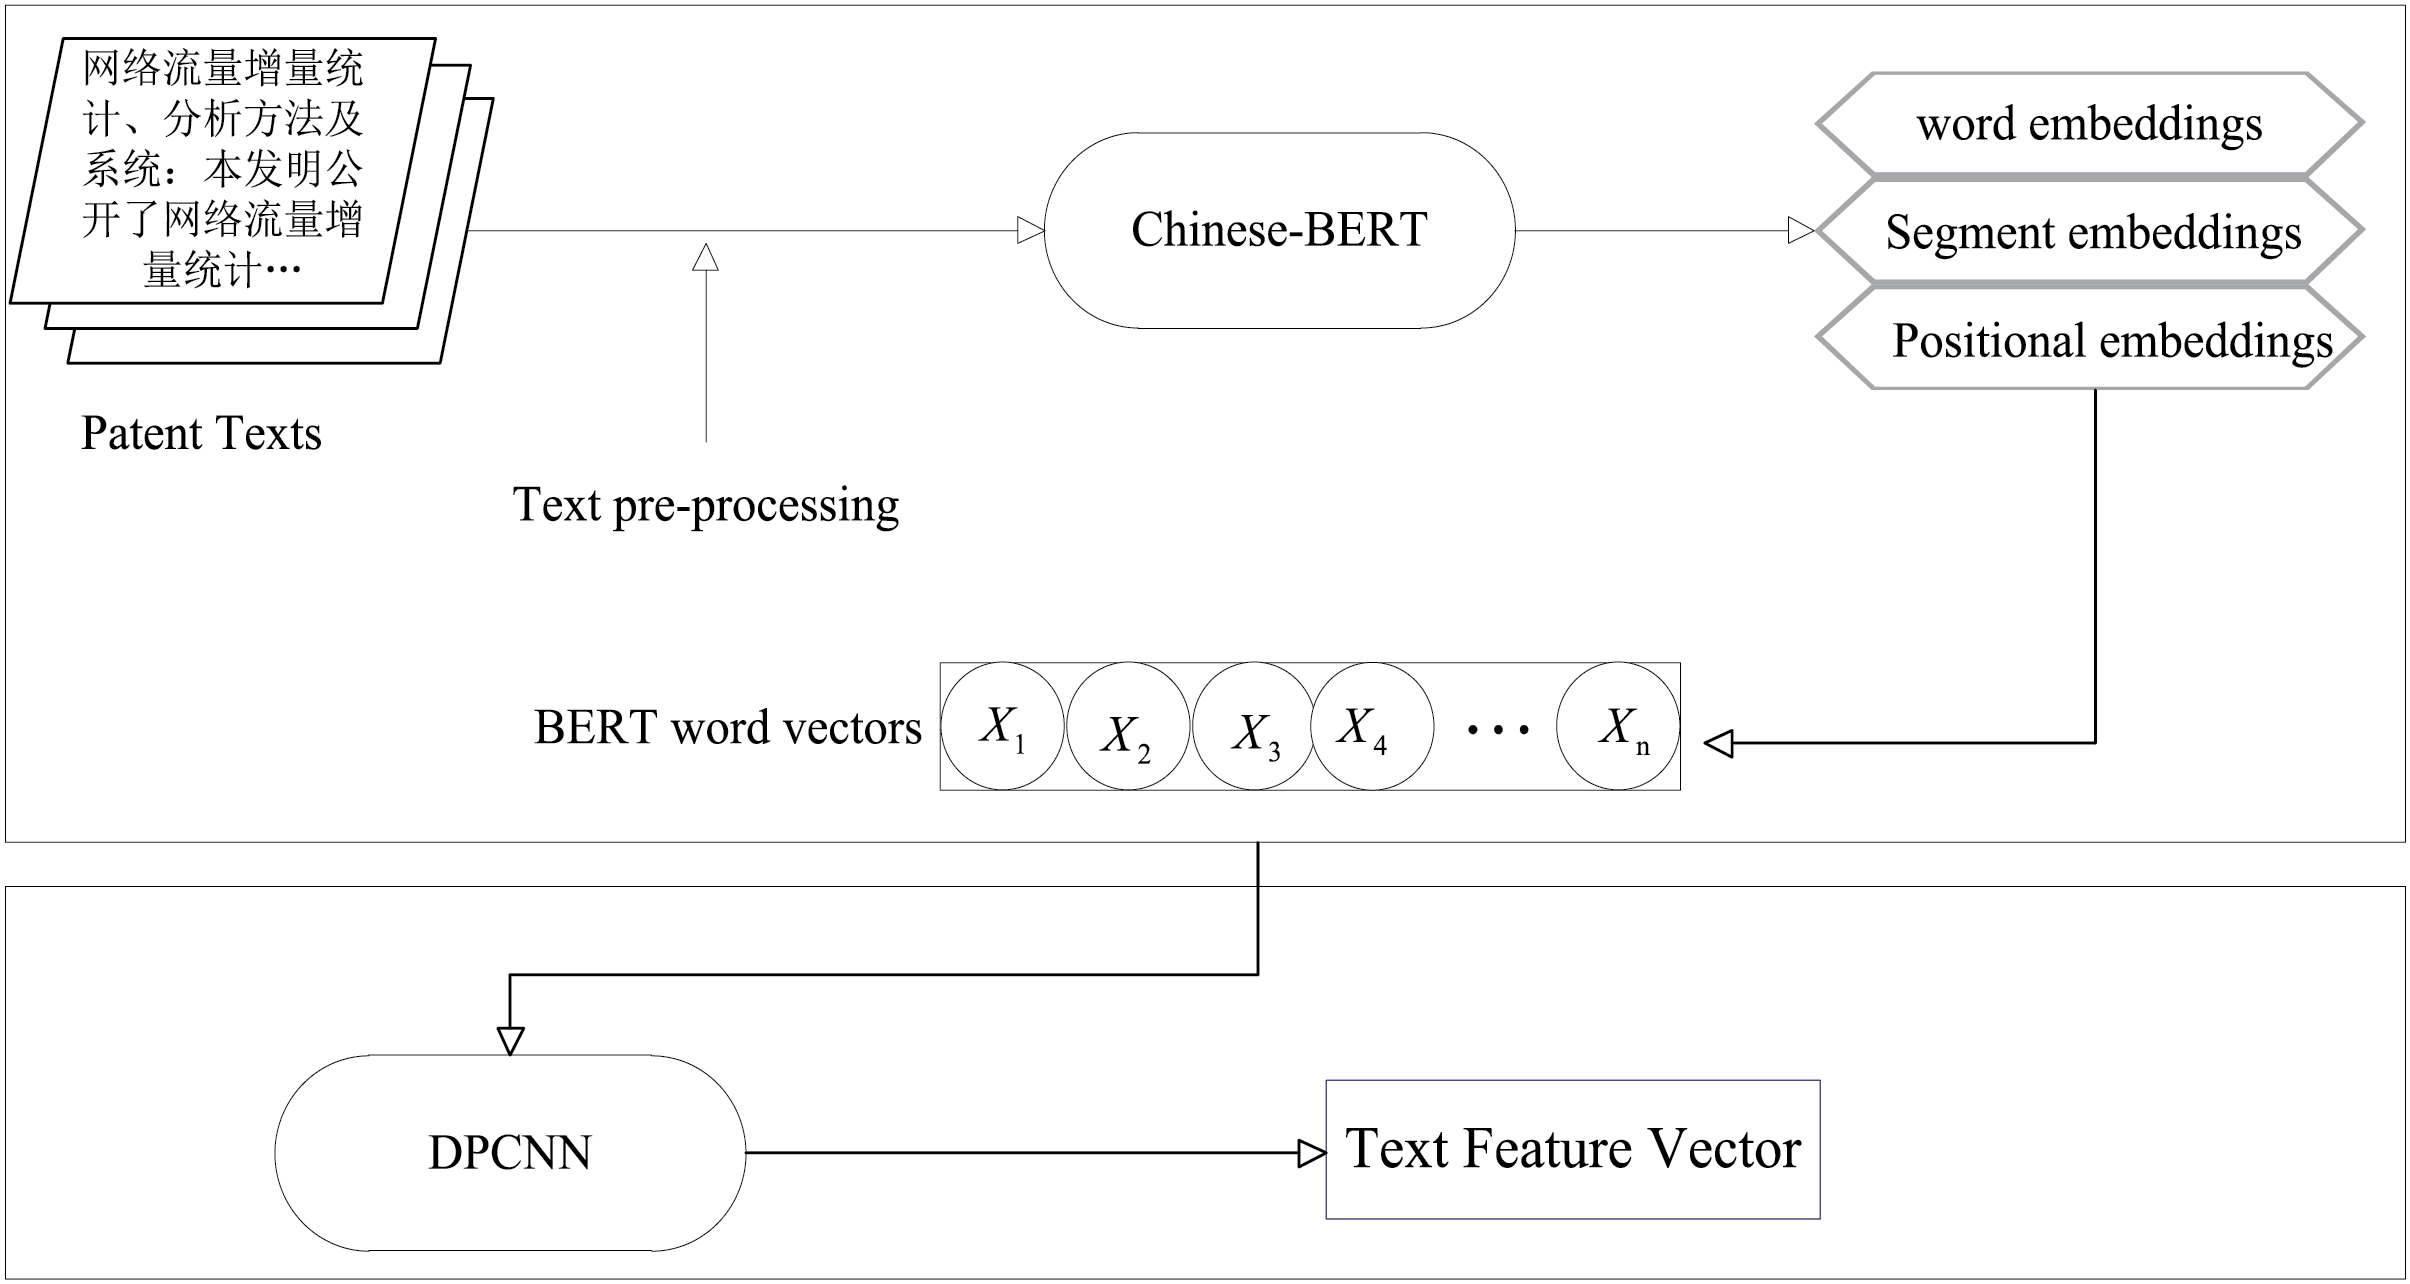
Figure 3: Text information extraction model
In this paper, for the coding layer of the text feature extraction model, we use BERT [18]. Unlike traditional word vector methods such as Word2Vec [19] and GloVe [20], BERT efficiently can better understand the contextual information of words through the bidirectional transformer architecture [21]. Using BERT pre-training model, high quality patent text vectors can be generated, and the text embedding representation of the patent text extracted by BERT is shown in Fig. 4.
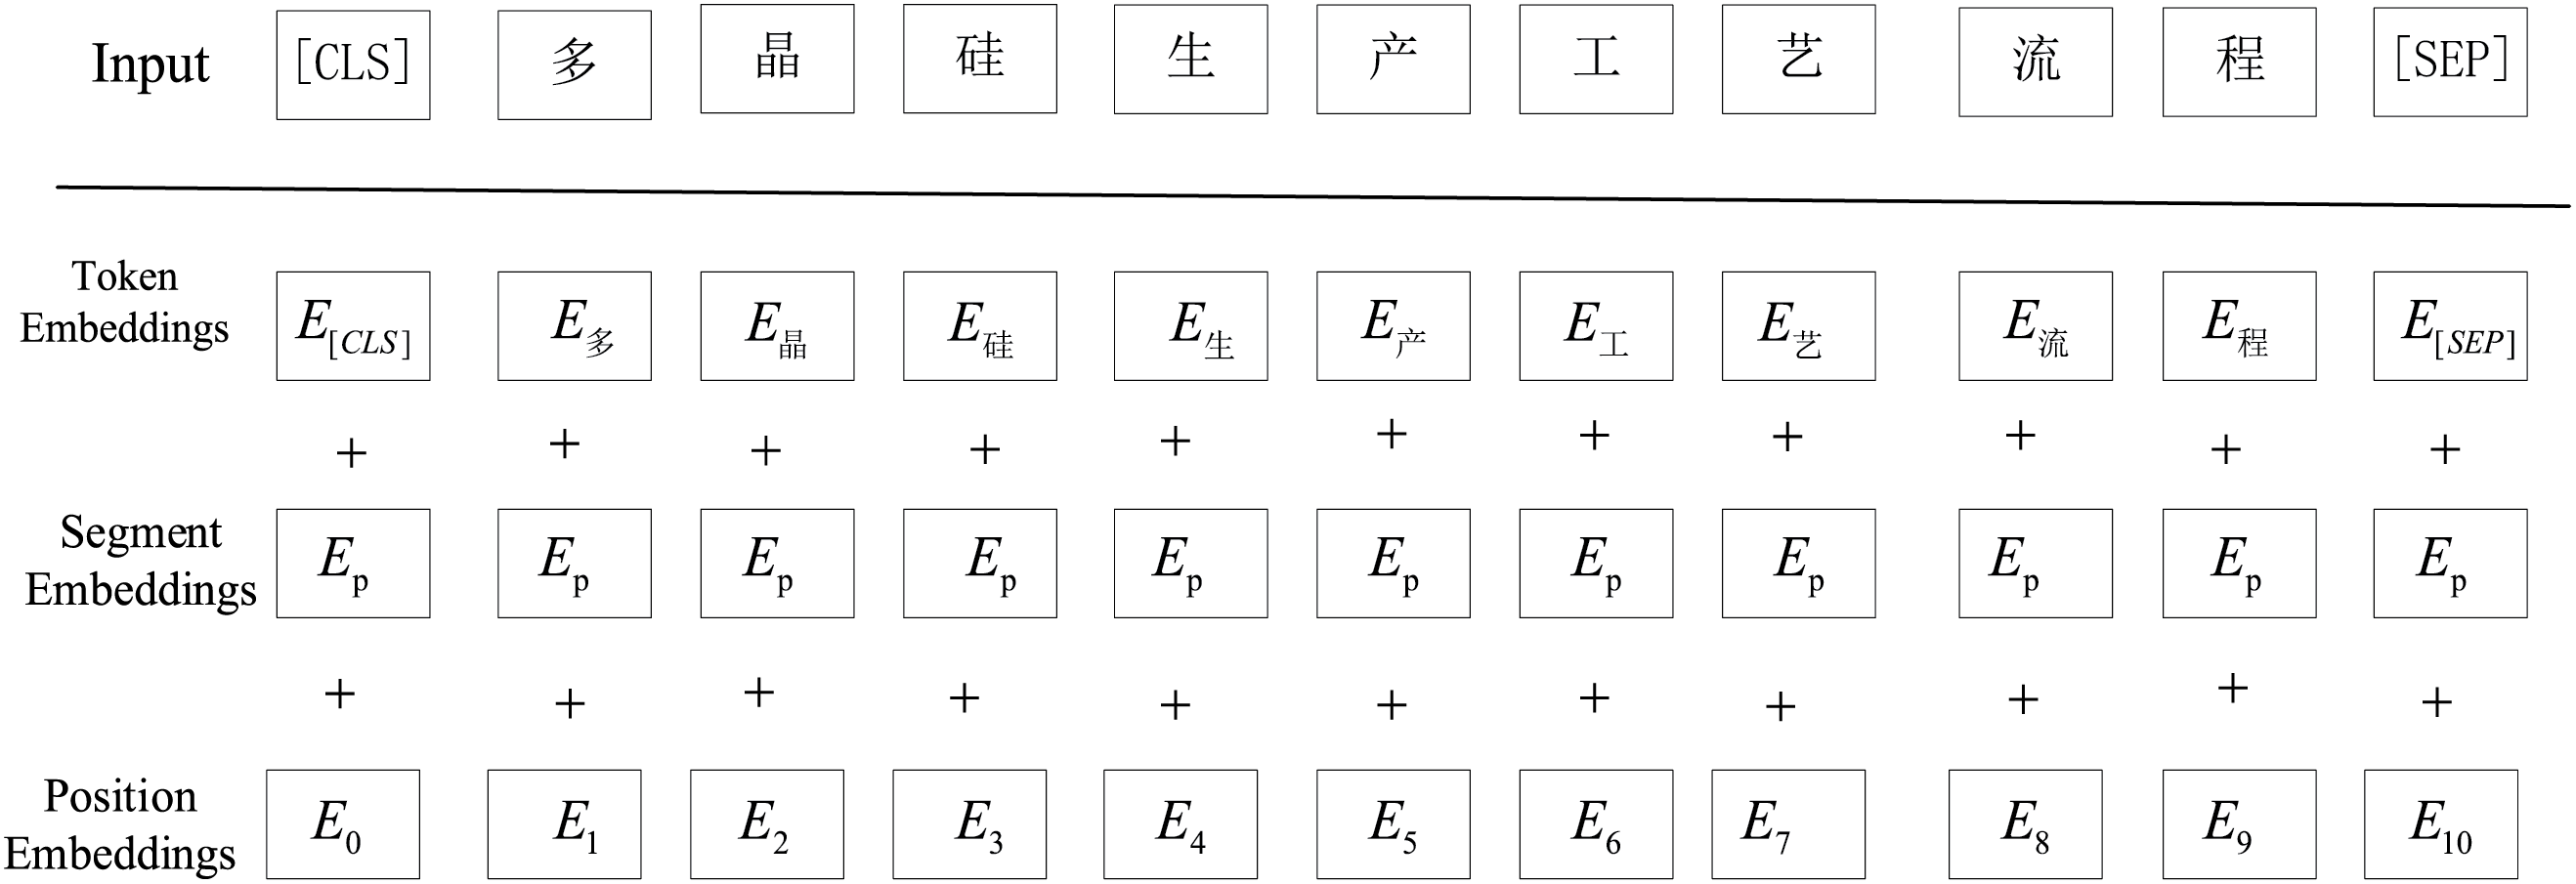
Figure 4: Example of BERT training word vector representation
In the input preprocessing part, BERT uses a Tokenizer to cut the patent text into sub-word units, add special tokens [CLS] and [SEP] at the beginning and end of the sequence, and finally convert the sub-words into the corresponding indicators after word splitting. When dealing with variable-length text, padding is usually used to make all input sequences reach the same length. Assuming the input text is W = [
DPCNN is a kind of deep convolutional neural network [22,23], which can effectively capture global and local features of text by using deep residual structure and region embedding methods. This paper uses word vectors generated by the BERT pre-training model instead of the DPCNN’s region embedding as input, which is passed into the DPCNN model, and the DPCNN gradually extracts the high-level features of the text through deep convolutional layers, as shown in Fig. 5. The obtained patent text vector T is input into the convolutional layer to extract preliminary local features. Then the subsequent convolution operation is performed, two convolutions are performed in each residual block to refine the feature extraction and obtain the feature C, which is calculated using Eq. (7).
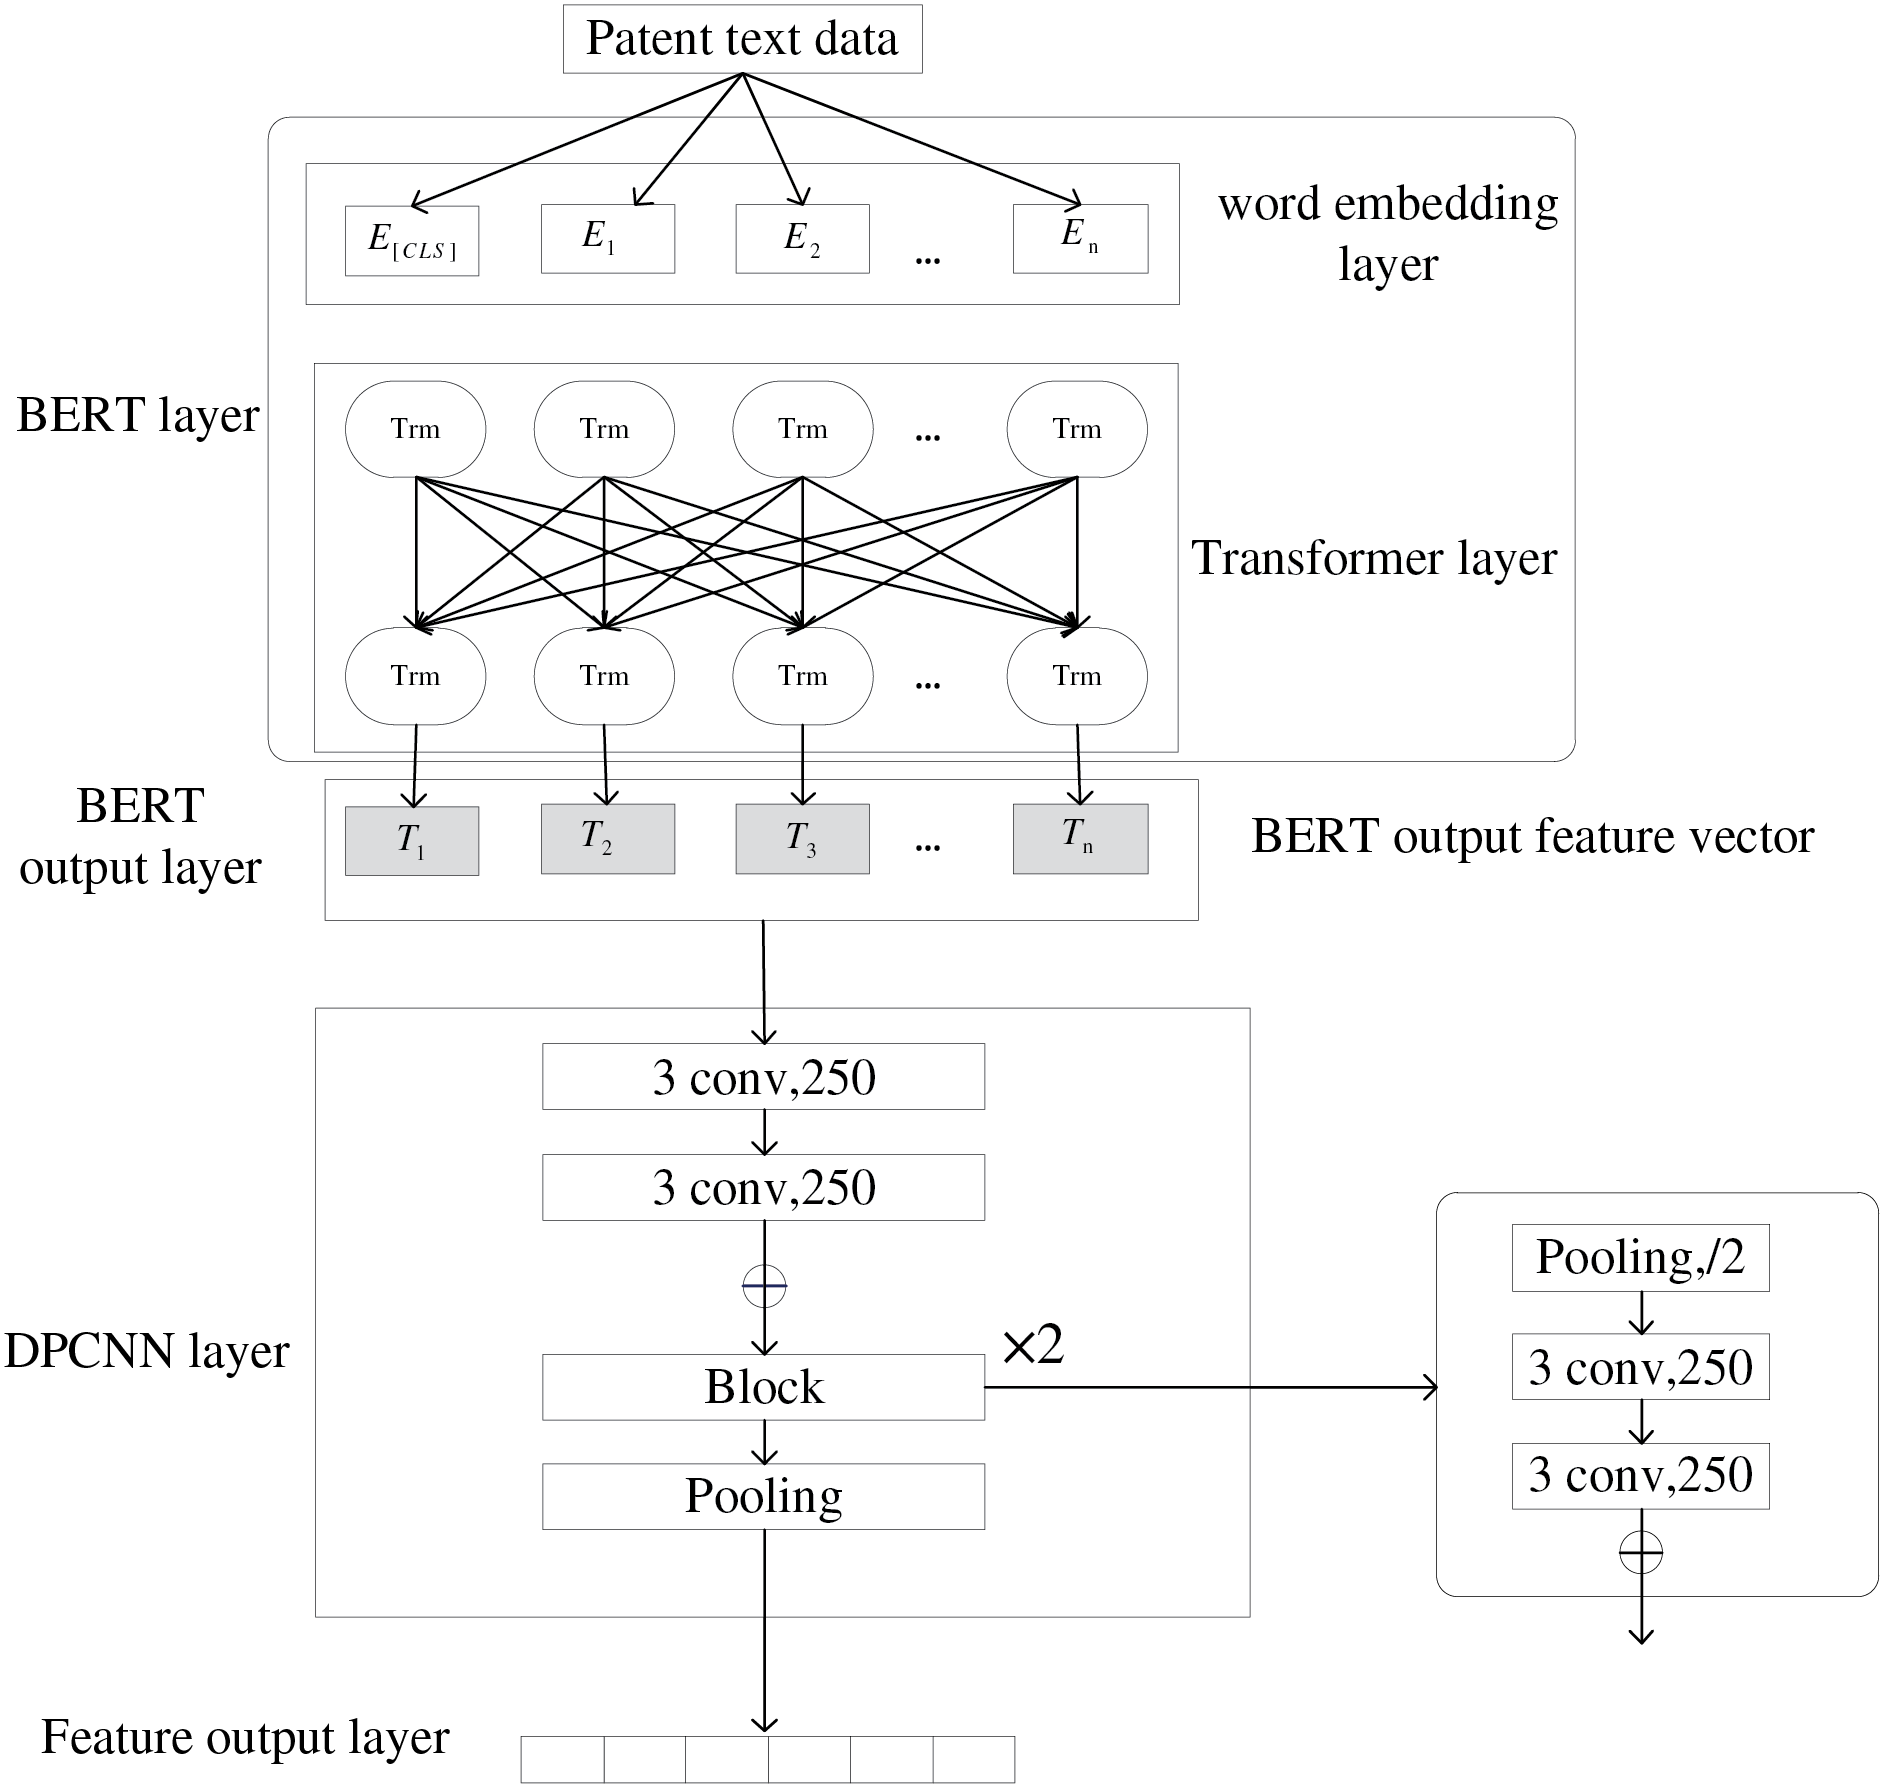
Figure 5: BERT-DPCNN model
The sequence length is gradually reduced through the maximum pooling layer, as shown in Eq. (8), forming a pyramid structure, and finally obtaining the last obtained text vector W_d, which denotes the 250-dimensional vector obtained after convolution through DPCNN. DPCNN model in this paper uses 250 convolution kernels, each block contains two convolution operations, consisting of two convolution functions with fixed convolution kernel of 3. Compared with the Sigmoid function, Relu not only has lower computation, but also can effectively solve the gradient vanishing problem. Therefore, we adopt the Relu activation function.
3.4 Feature Fusion and Prediction Module
In order to fully integrate the patent text information, patent base indicators, and patentee influence features, we splice the patent text vector, patent indicator vector, and patentee vector in the horizontal direction. Specifically, we merge the various types of feature vectors by columns to form a new data matrix. The spliced matrix maintains the same number of rows as the original data, and the number of columns is the sum of the columns of each feature set, as shown in Fig. 6. The advantage of splicing in this way is that it can make comprehensive use of the information from different sources, thus enhancing the representation of the data and improving the prediction performance of the model. However, the dimension of the spliced data may be high, which can bring about curse of dimension. To address this challenge, we introduce PCA method for dimension reduction. PCA is a commonly used dimension reduction technique that reduces the dimension of the data by mapping the original high-dimensional data into a low-dimensional space through linear transformations. When applying PCA, we calculate the cumulative proportion of variance explained, which is a cumulative metric that measures how much of the original data variance is explained by the first few principal components in total. Through the cumulative explained variance ratio, we can find the optimal dimension reduction, i.e., to achieve effective dimension reduction of the data while retaining as much information of the original data as possible.
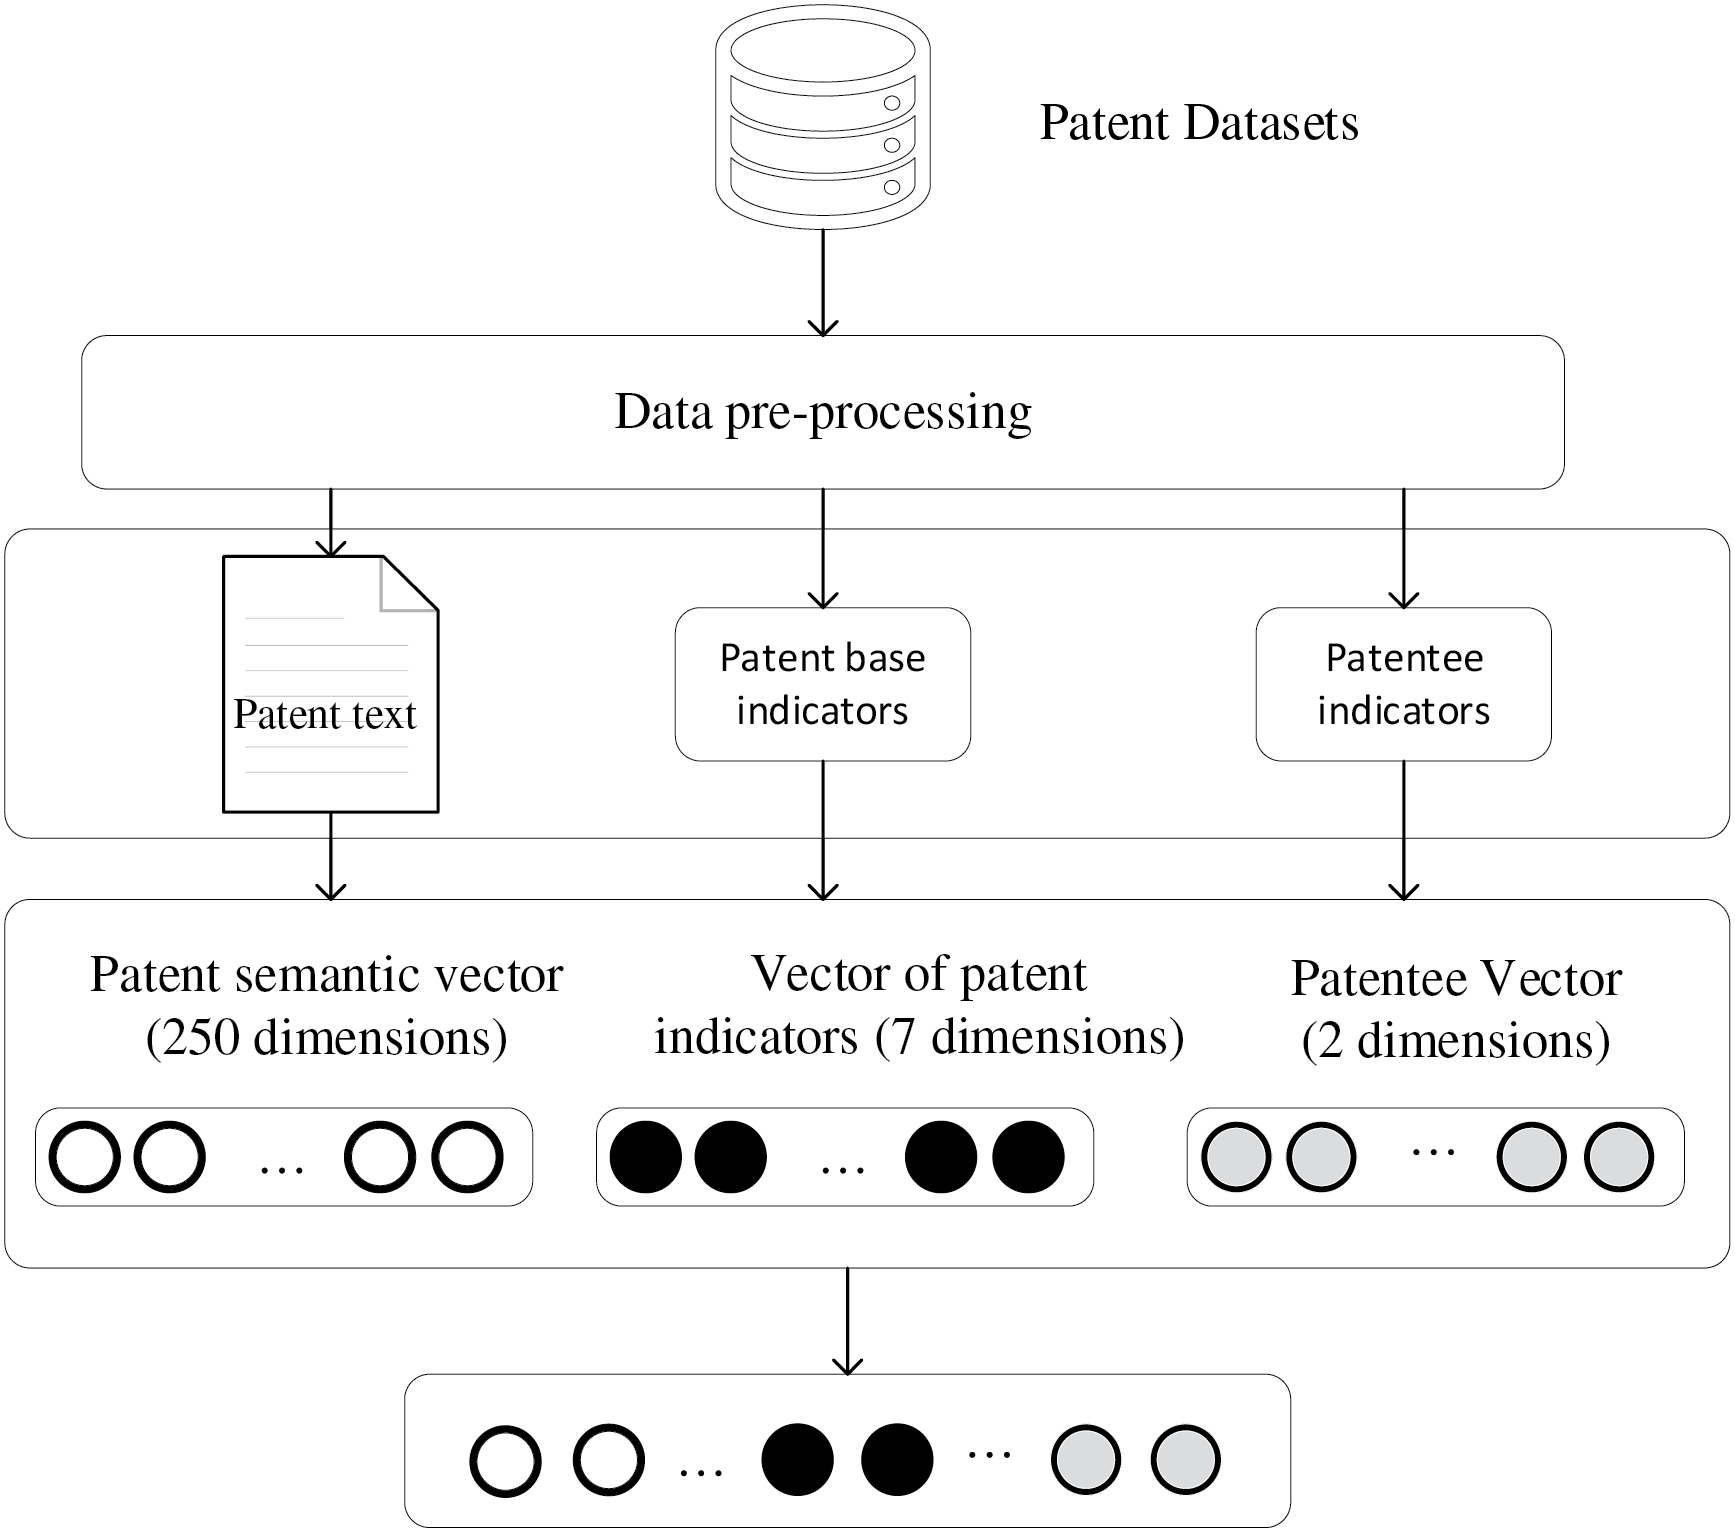
Figure 6: Feature fusion module
In the patent value prediction module, the fused feature vectors are input into three machine learning algorithms, SVM, RF, and XGBoost, and their performance is evaluated to find the optimal model. The optimal patent value identification model is used to complete the subsequent patent value prediction task. In this paper, the invention patents that won the China Patent Award in each province from 2017 to 2022 are retrieved from the patent database, and the samples are randomly drawn from the award-winning patents and the non-award-winning patents in equal amounts for prediction and analysis. The specific prediction steps are as follows: firstly, the patent text is preprocessed and converted into semantic vectors. After the semantic vectors are extracted, they are fused with the patentee vectors and the base indicator vectors to form a more comprehensive feature representation. This step of the fusion process ensures the effective combination of patent text information and patentee information, which improves the predictive ability of the model. After that, the fused feature vectors are processed and analyzed using the BERT-DPCNN model and the machine learning algorithm. After completing the prediction, the corresponding prediction results are reflected from the category labels of the sample patents.
The experiment data in this paper are retrieved from the Innojoy patent database [24], which includes patent data from Hubei Province during 2017–2022, with the search formula (‘Hubei’) and (PDY = ‘2022’ or PDY = ‘2021’ or PDY = ‘2020’ or PDY = ‘2019’ or PDY = ‘2018’ or PDY = ‘2017’). We obtained 10,247 patents including 5247 high-quality patents and 5000 low-quality patents. Each patent includes patent application number, title, abstract, applicant, disclosure number, number of rights, number of cited patents, survival period, number of citations, number of homologues, number of licenses and number of pledges. Some of them are shown in Table 2.

SIPO now explicitly includes invention patents that have won the National Science and Technology Prize or the China Patent Prize in the statistics on the number of high-value invention patents. Due to the small number of invention patents awarded, we will also label patents that have been transferred as high-quality patents. The transfer of patent usually involves the purchase and sale of intellectual property rights, which is an important business behavior. The occurrence of a patent transfer often means that the patent has high technical value and market potential. Based on the above analyses and the high-quality patent labeling proposed in the literature [25], this paper formulates the following patent quality labeling rules, which are shown in Table 3.

4.2 Experimental Environment and Metrics
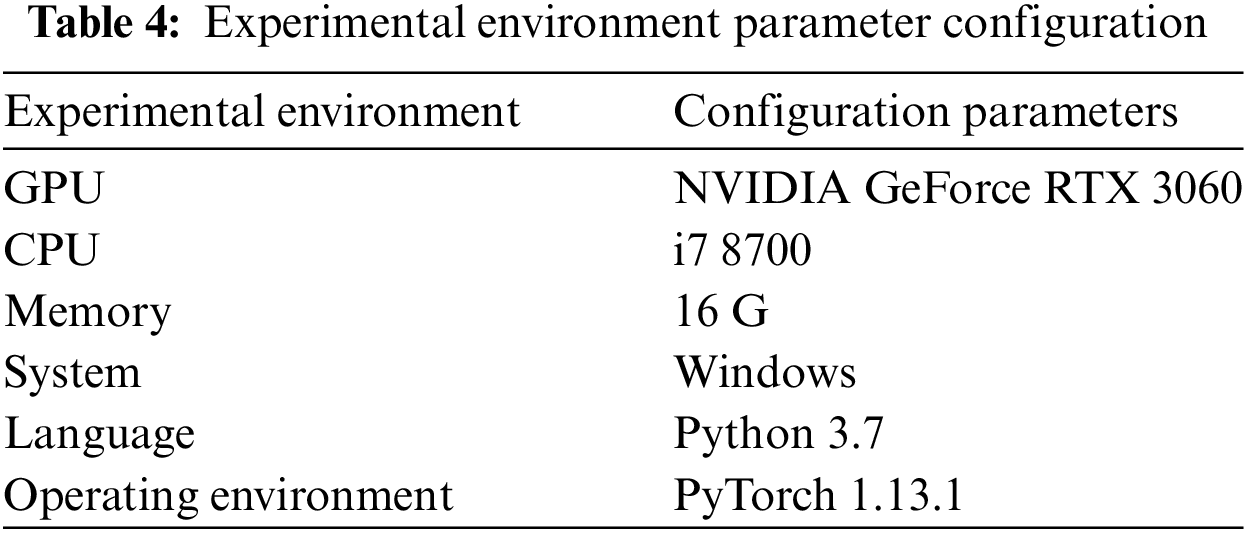
The specific hardware parameters of the machine used for the experiments in this paper are shown in Table 4. Python version 3.7 is built on the machine and PyTorch 1.13.1 environment is used for training. Bert-base-Chinese is used as the BERT pre-training model. The parameter settings of BERT-DPCNN model are shown in Table 5. We divide the training set, validation set, and test set in the ratio of 8:1:1. During training, we let the model learn the data features through multiple epoch cycles and monitor the changes in the model’s loss function and evaluation metrics. Stochastic Gradient Descent (SGD) is also used as the optimizer, setting the learning rate to 2e−5. To reduce the risk of overfitting, the dropout mechanism is used during training, which randomly sets the outputs of some of the neurons to 0, so as to enhance the model’s generalization ability. We also adopt batch strategy to update the model weights using 32 samples at a time. After each epoch in the training process, we monitor the performance of the model on validation set.
In this paper, the experimental model is evaluated using three metrics: accuracy (P), recall (R), and F1 value. These metrics can comprehensively reflect the performance of the model in the task of identifying patent values. The calculation of these metrics is shown in Eqs. (9)–(11).
where
After feeding the patent text data into the trained BERT-DPCNN model, we obtain 250-dimensional text vector data. Next, we extracted 7 base indicators shown in Table 1, and these indicators form a 7-dimensional vector matrix, which can effectively reflect different aspects of patent features. At the same time, this paper uses the GLE algorithm to calculate the influence of patentees. The patentee vector, the patent base indicators vector, and the text semantic vector are fused to form a 259-dimensional vector matrix, and the vector matrix is downscaled using PCA. The cumulative variance contribution rate and the number of principal components is shown in Fig. 7, and the cumulative proportion of explained variance is close to 99% when the principal component is 10, that is, when downscaling the dimensionality to 10-dimensionality, it achieves the optimal dimensionality, and preserves most of the original information. Meanwhile, we also find that when the patent base indicator vector is only fused with the text semantic vector, the optimal dimension is 9.
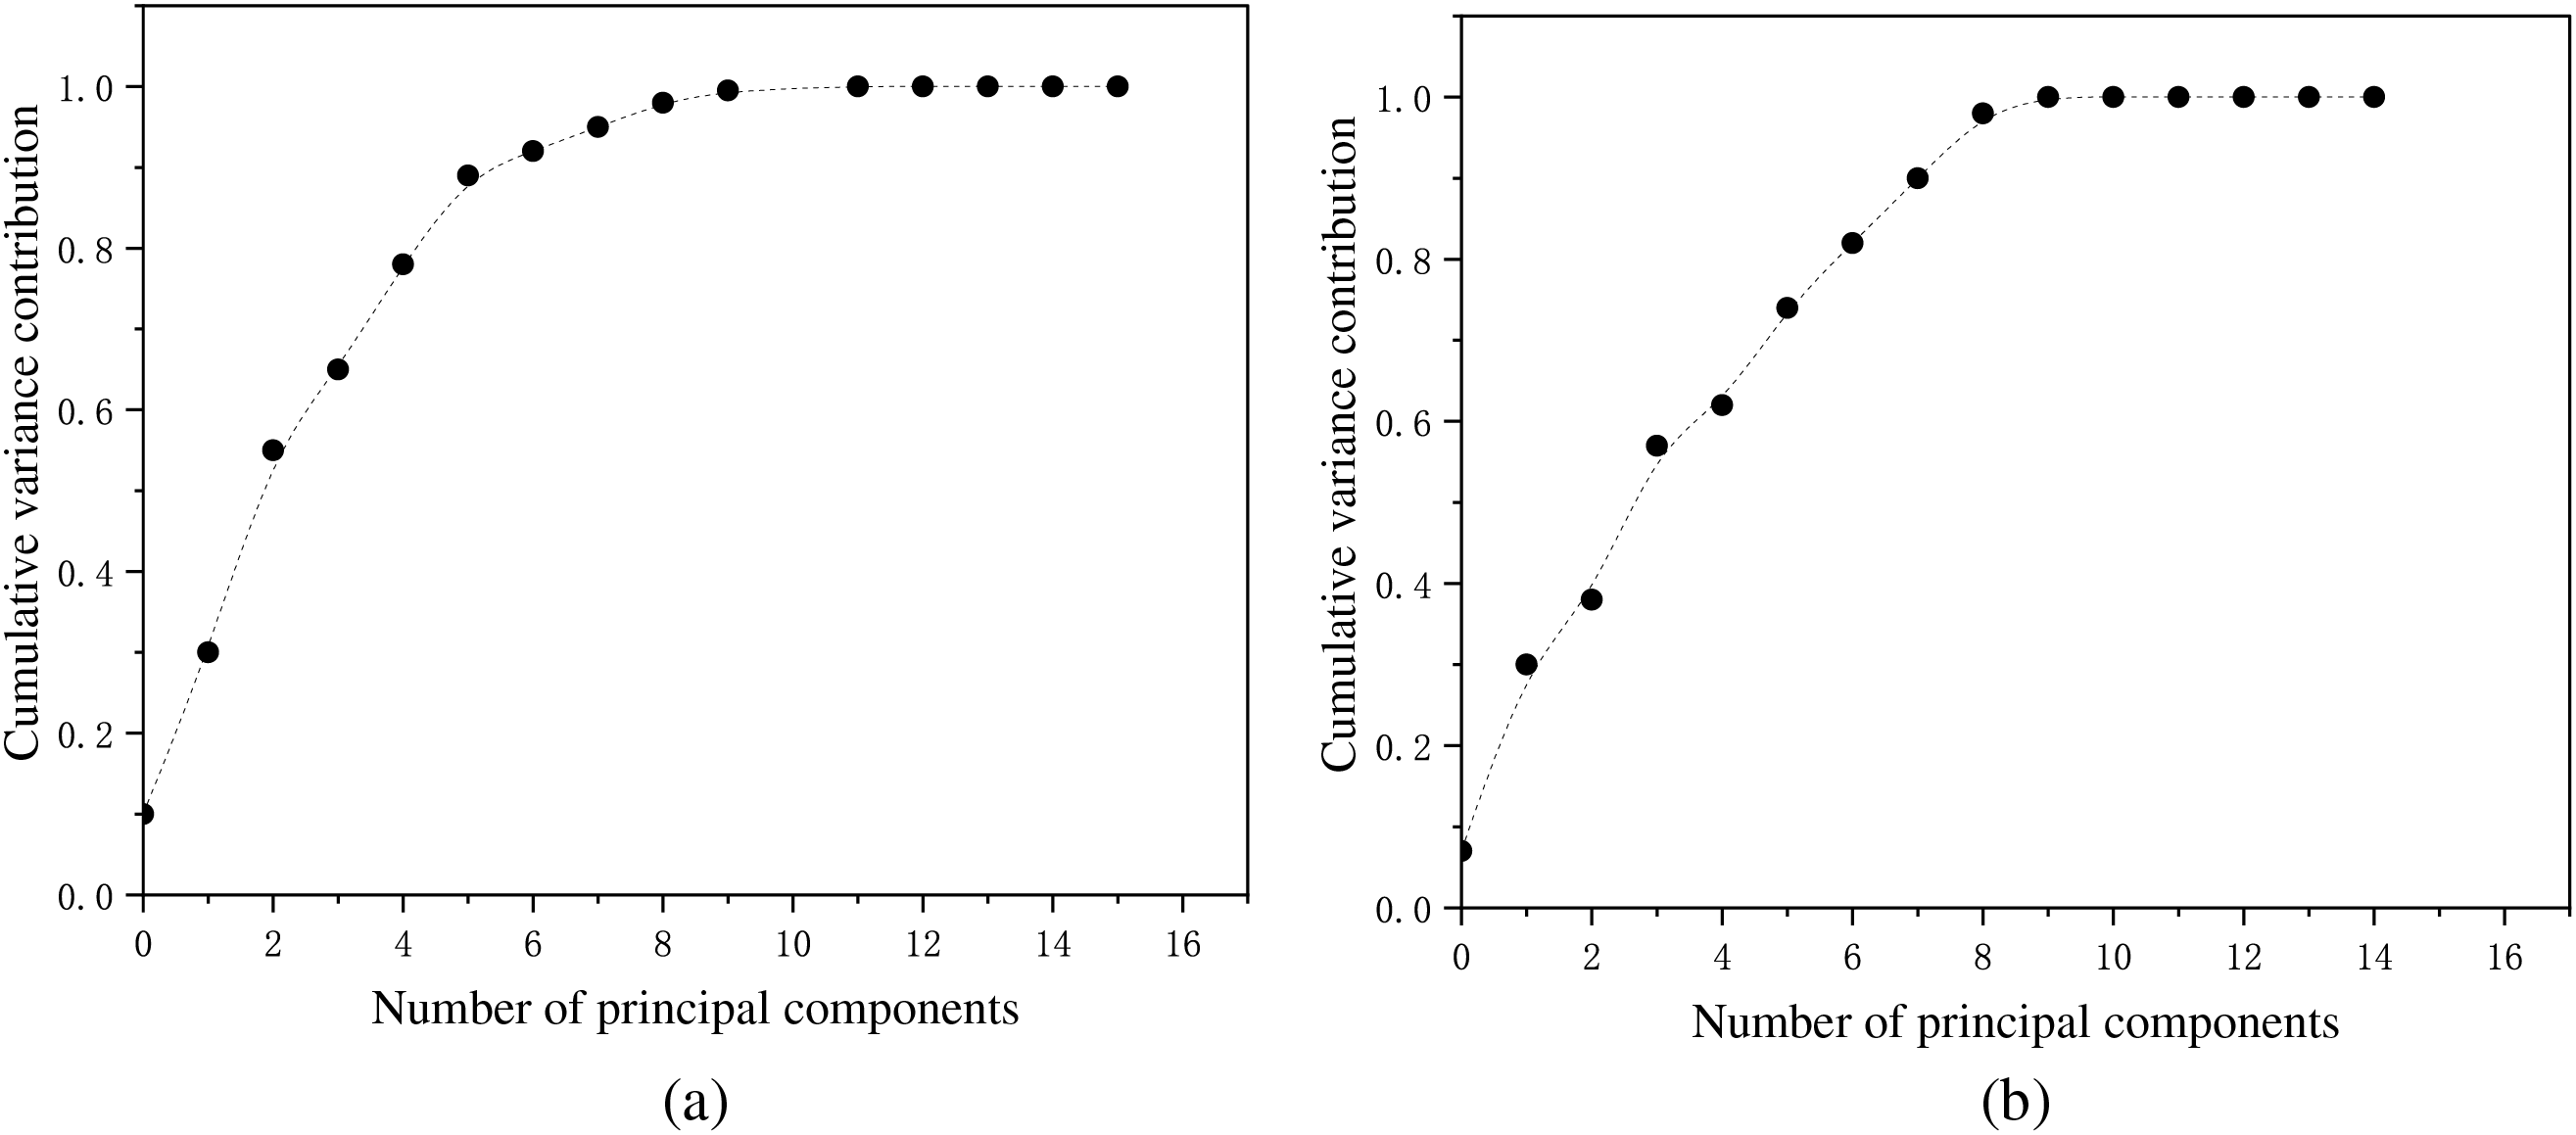
Figure 7: (a) Cumulative variance contribution rate and number of principal components after fusion of patentees, patent base indicators and textual semantic vectors (b) Cumulative variance contribution and number of principal components after fusion of patent base indicator vectors and textual semantic vectors
We select Support Vector Machine (SVM), Random Forest Algorithm (RF) and XGBoost Algorithm as classifiers to validate the effectiveness and superiority of the proposed methods. The aim of the experiment is to determine the best parameter configuration by systematically tuning and optimizing the parameters of the three machine learning models and evaluating their performance on a given task. The optimal parameters of these three machine learning algorithm are shown in Table 6.

The paper begins with a basic experiment which uses only the base patent indicators as input variables to the machine learning classifier, that is, no text data features or patentee-related features are added. In this case, the dimension of the input vector is 7. As we can see in Table 7, the experimental results show that the XGBoost algorithm performs optimally in this setting, with an accuracy of 0.841. In addition, the average accuracy of all classifiers exceeds 0.8, which indicates that the machine learning model is capable of predicting the patent value even if it relies only on the base patent metrics.
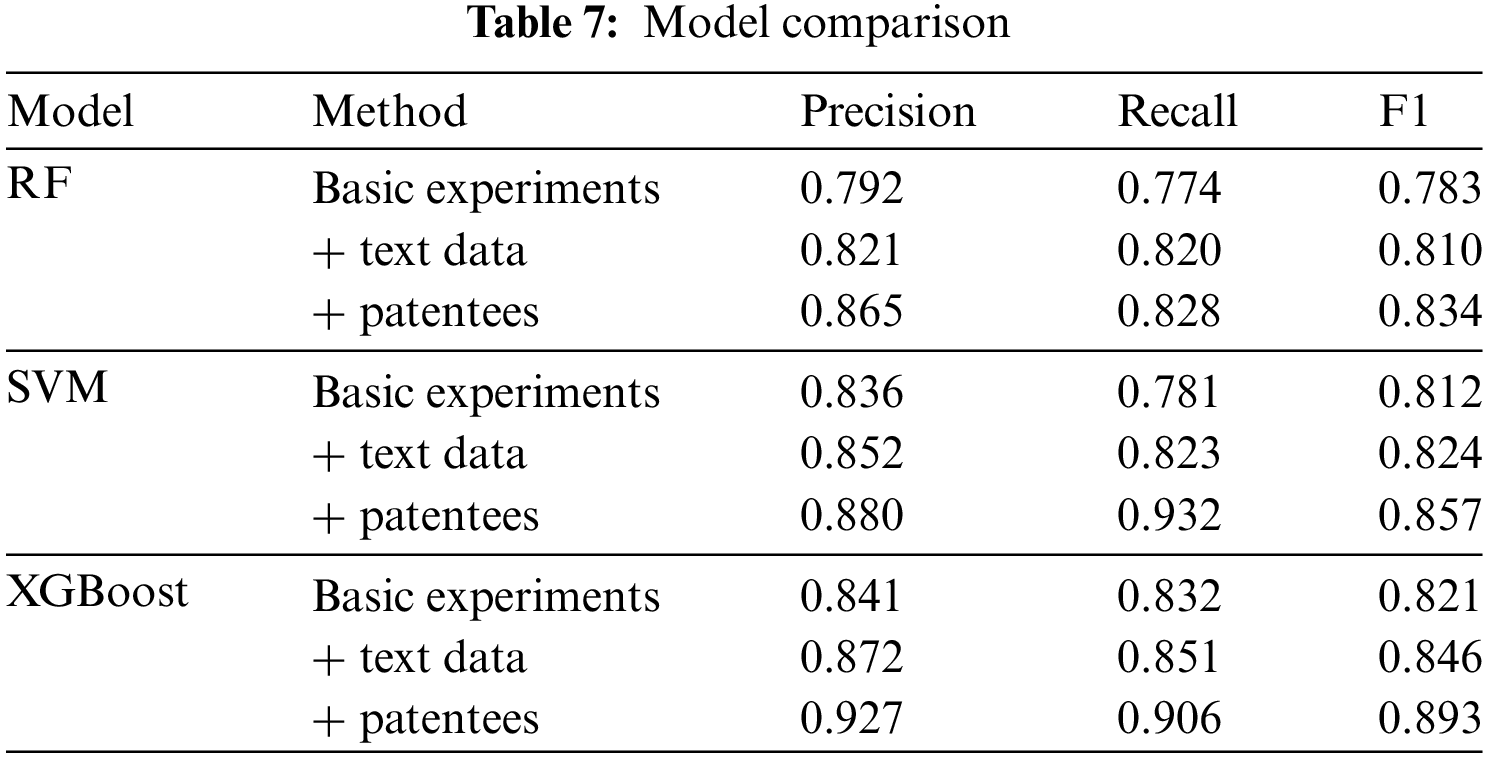
In the next study, this paper introduces patent text data features and combines them with traditional patent indicator features. By fusing these two types of features, a comprehensive model is constructed, which not only captures explicit indicators such as the number of patents and citation frequency, but also mines out implicit technical details and innovations through the text data, thus providing a more comprehensive and precise basis for the assessment of patent value. From the experiment results, the performance of the three machine learning algorithms are improved to different degrees after fusing the patented text data features. Specifically, the accuracy of RF is improved by 2.9%, the accuracy of SVM is improved by 1.6%, and the accuracy of XGBoost is improved by 3.1%. This suggests that combining patent text content features with traditional patent indicator features can improve the model’s effectiveness in identifying high-value patents.
After patent patentee indicators are added into the patent value recognition task, the experiment results show that the accuracy, recall and F1 value of the model are all improved to different degrees, and the overall performance of the model is further optimized. The accuracy of XGBoost reaches 0.927, which is the most obvious improvement. Moreover, compared with the basic experiments and the experiments of adding the patent text data, the accuracy is improved by 8.6% and 5.5%, respectively. In addition, we find that the main reason why certain patents are misclassified is that particular features (such as the influence of the patentee and the legal status of the patent) may not adequately reflect the actual value of certain patents.
Through the comparative analysis of the above experiments, it can be seen that the XGBoost algorithm has a slight advantage in overall performance. Firstly, from the results of the basic experiment, XGBoost (0.821) performs slightly better than RF (0.783) and SVM (0.812) in terms of F1 score, which indicates that it has stronger robustness in dealing with the base feature data. When text data is added, the performance of all algorithms improves, but the F1 score of XGBoost improves from 0.821 to 0.846, which still maintains the leading position, indicating that it performs well in the processing of semantic features. Eventually, when fusing the patentee’s metrics data, XGBoost’s F1 score further improves to 0.893, surpassing RF (0.834) and SVM (0.857), while its Precision (0.927) and Recall (0.906) both reach the highest values, demonstrating its dual advantages in accuracy and recall. Through these comparisons, we can conclude that XGBoost not only excels in the processing of base features, but especially performs excellently after fusion of text and patentee data. It can more effectively improve the overall performance of the model. Based on this conclusion, this paper chooses BERT-DPCNN model and XGBoost algorithm as the optimal identification patent value model to predict the patent value.
In this paper, 20 sample patents are randomly selected for prediction among the invention patents that have won the China Patent Award and the patents that have not won any awards. Some of the prediction results are shown in Table 8.

According to the prediction results, out of 40 patent samples, we successfully predicted 17 high-quality patents and 16 low-quality patents with an overall recognition accuracy of 82.5%. Further evaluation shows that the model has a precision of 80.95% in high-quality patent identification, a recall (Recall) of 85%, and an F1 score of 82.93%, which indicates that the model is able to balance the performance of precision and recall while maintaining a high level of accuracy. By analyzing the confusion matrix of the model, as shown in Table 9. The results of identifying both high-quality and low-quality patents show better classification results. These metrics demonstrate the effectiveness and robustness of our method, which is not only able to achieve a more precise distinction between different types of patents, but also maintains a stable prediction performance in the face of sample imbalance and feature complexity. Taken together, these results validate the usefulness and promotion potential of our model in patent quality identification.

By identifying high-value patents, enterprises and research institutions can better attract investment and partners, push technological achievements from laboratories to the market, and achieve an organic combination of technological innovation and economic growth. The high-value patent recognition method HMFM proposed in this paper fully utilizes the semantic information, base indicators, and patentee information of patent texts to improve the performance of high-value patent recognition, providing a more comprehensive and refined perspective for scientific and technological innovation research. Future research may focus on the combination of different patent feature extraction methods and indicator fusion strategies, providing more references and guidance for patent value evaluation.
Acknowledgement: Thank all the people who contributed to this paper.
Funding Statement: The authors received no specific funding for this study.
Author Contributions: The authors confirm contribution to the paper as follows: study conception and design: Na Deng; data collection: Jiuan Zhang; analysis and interpretation of results: Jiuan Zhang; draft manuscript preparation: Na Deng. All authors reviewed the results and approved the final version of the manuscript.
Availability of Data and Materials: The data that support the findings of this study are available from the corresponding author, Jiuan Zhang, upon reasonable request.
Ethics Approval: Not applicable.
Conflicts of Interest: The authors declare no conflicts of interest to report regarding the present study.
References
1. State Intellectual Property Office, “China patent survey report 2023,” 2024. Accessed: Mar. 1, 2024. [Online]. Available: https://www.cnipa.gov.cn/module/download/downfile.jsp?classid=0&showname=2023%E5%B9%B4%E4%B8%AD%E5%9B%BD%E4%B8%93%E5%88%A9%E8%B0%83%E6%9F%A5%E6%8A%A5%E5%91%8A.pdf&filename=bf5fc071a77b49d6ac79291cc861b047.pdf [Google Scholar]
2. J. Wu, L. Gui, and P. Liu, “Indicator and textual features-based patent evaluation with graph convolutional networks,” (in ChineseJ. Intell., vol. 41, no. 1, pp. 88–95, 2022. doi: 10.3969/j.issn.1002-1965.2022.01.014. [Google Scholar] [CrossRef]
3. L. Weinstein, R. J. Vokurka, and G. A. Graman, “Costs of quality and maintenance: Improvement approaches,” Total Qual. Manag., vol. 20, no. 5, pp. 497–507, 2009. doi: 10.1080/14783360902863648. [Google Scholar] [CrossRef]
4. M. Xu and L. Chen, “On the theory of patent quality: A literature review perspective,” (in ChineseJ. Intell., vol. 37, no. 12, pp. 28–35, 2018. doi: 10.3969/j.issn.1002-1965.2018.12.005. [Google Scholar] [CrossRef]
5. M. Trajtenberg, “A penny for your quotes: Patent citations and the value of innovations,” Rand J. Econ., vol. 164, no. 1, pp. 172–187, 1990. doi: 10.2307/2555502. [Google Scholar] [CrossRef]
6. F. M. Scherer, “Nordhaus’ theory of optimal patent life: A geometric reinterpretation,” Am. Econ. Rev., vol. 62, no. 3, pp. 422–427, 1972. doi: 10.3386/w3208. [Google Scholar] [CrossRef]
7. T. Fischer and J. Leidinger, “Testing patent value indicators on directly observed patent value-an empirical analysis of ocean tomo patent auctions,” Res. Policy, vol. 43, no. 3, pp. 519–529, 2014. doi: 10.1016/j.respol.2013.07.013. [Google Scholar] [CrossRef]
8. F. Caviggioli and E. Ughetto, “Buyers in the patent auction market: Opening the black box of patent acquisitions by non-practicing entities,” Technol. Forecast. Soc. Change, vol. 104, no. 6, pp. 122–132, 2016. doi: 10.1016/j.techfore.2015.11.031. [Google Scholar] [CrossRef]
9. P. C. Lee, “Investigating patent value and litigation probability of global technology standards,” IEEE Trans. Eng. Manag., vol. 71, pp. 4377–4388, 2022. doi: 10.1109/TEM.2022.3208453. [Google Scholar] [CrossRef]
10. Y. H. Wei, “Optimization of machine learning-based value assessment model in high value patent cultivation in universities,” Appl. Math. Nonlinear Sci., vol. 9, no. 1, 2024. doi: 10.2478/amns-2024-2572. [Google Scholar] [CrossRef]
11. C. Lee, O. Kwon, M. Kim, and D. Kwon, “Early identification of emerging technologies: A machine learning approach using multiple patent indicators,” Technol. Forecast. Soc. Change, vol. 127, no. 1, pp. 291–303, 2018. doi: 10.1016/j.techfore.2017.10.002. [Google Scholar] [CrossRef]
12. C. Ran, W. Li, Q. Hu, and W. Huang, “Research on the application of machine learning-based cost method in patent value assessment-taking ‘new energy vehicle’ as the case,” J. Modern Inf., vol. 44, no. 5, pp. 140–152, 2024. doi: 10.3969/j.issn.1008-0821.2024.05.011. [Google Scholar] [CrossRef]
13. A. J. C. Trappey, C. V. Trappey, U. H. Govindarajan, and J. J. H. Sun, “Patent value analysis using deep learning models-the case of IoT technology mining for the manufacturing industry,” IEEE Trans. Eng. Manag., vol. 68, no. 5, pp. 1334–1346, 2019. doi: 10.1109/TEM.2019.2957842. [Google Scholar] [CrossRef]
14. X. Xiao, X. Duan, and Y. Zhao, “Evaluation and verification of patent value based on combination forecasting model,” Appl. Math. Nonlinear Sci., vol. 8, no. 1, pp. 715–722, 2023. doi: 10.2478/amns.2022.2.0058. [Google Scholar] [CrossRef]
15. Z. W. Hu and X. J. Zhou, “Prediction of high-value patents and analysis of influencing factors based on BP neural network and MIV algorithm,” J. Inf. Res. Manag., vol. 13, no. 6, pp. 144–155, 2023. doi: 10.13365/j.jirm.2023.06.144. [Google Scholar] [CrossRef]
16. F. Wan and A. Seidmann, “Dynamics of assignee networks: A new approach for measuring the impact on patent value based on network analysis,” in Proc. Annu. Hawaii Int. Conf. Syst. Sci., Maui, HI, USA, Jan. 8–11, 2019, pp. 6775–6781. [Google Scholar]
17. M. Sun, “Genetic algorithm and black-scholes option pricing model in patent value evaluation,” in Proc. 2019 Int. Conf. Virt. Real. Intell. Syst., Jishou, China, Sep. 14–15, 2019, pp. 276–281. [Google Scholar]
18. J. Devlin, M. W. Chang, and K. Lee, “BERT: Pre-training of deep bidirectional transformers for language understanding,” 2018, arXiv:1810.04805. [Google Scholar]
19. T. Mikolov, I. Sutskever, and K. Chen, “Distributed representations of words and phrases and their compositionality,” 2013, arXiv:1310.4546v1. [Google Scholar]
20. J. Pennington, R. Socher, and C. D. Manning, “GloVe: Global vectors for word representation,” in Proc. 2014 Conf. Empir. Methods Natural Lang. Process. (EMNLP), Doha, Qatar, Oct. 25–29, 2014, pp. 1532–1543. [Google Scholar]
21. A. Vaswani, N. Shazeer, and N. Parmar, “Attention is all you need,” in Proc. 31st Annu. Conf. Neural Inf. Process. Syst., Long Beach, CA, USA, Dec. 4–9, 2017, pp. 45998–46009. [Google Scholar]
22. X. Jiao, F. Wang, and D. Feng, “Convolutional neural network for universal sentence embeddings,” in Proc. 27th Int. Conf. Computat. Linguist., Santa Fe, NM, USA, Aug. 20–26, 2018, pp. 2470–2481. [Google Scholar]
23. R. Johnson and T. Zhang, “Deep pyramid convolutional neural networks for text categorization,” in Proc. 55th Annu. Meet. Assoc. Comput. Linguist., Vancouver, BC, Canada, Jul. 30–Aug. 4, 2017, pp. 562–570. [Google Scholar]
24. Dawei Soft Technology Co., Ltd., “Innojoy patent search engine,” 2024. Accessed: Jun. 2, 2024. [Online]. Available: https://innojoy.com/search/home.html [Google Scholar]
25. Y. F. Zhou, C. H. Tan, and T. Jiang, “Research on the screening method of high-quality patent results based on machine learning classification algorithms,” (in ChineseJ. Modern Inf., vol. 44, no. 2, pp. 81–91, 2024. doi: 10.3969/j.issn.1008-0821.2024.02.007. [Google Scholar] [CrossRef]
Cite This Article
 Copyright © 2025 The Author(s). Published by Tech Science Press.
This work is licensed under a Creative Commons Attribution 4.0 International License , which permits unrestricted use, distribution, and reproduction in any medium, provided the original work is properly cited.
 Downloads
 Citation Tools