
 Submit a Paper
 Propose a Special lssue
 Open Access
ARTICLE

Plant Disease Detection Algorithm Based on Efficient Swin Transformer
1 School of Information Science and Engineering, Shenyang Ligong University, Shenyang, 110158, China
* Corresponding Author: Wei Liu. Email:
Computers, Materials & Continua 2025, 82(2), 3045-3068. https://doi.org/10.32604/cmc.2024.058640
Received 17 September 2024; Accepted 04 November 2024; Issue published 17 February 2025
 View Full Text
 Download PDF
Abstract
Plant diseases present a significant threat to global agricultural productivity, endangering both crop yields and quality. Traditional detection methods largely rely on manual inspection, a process that is not only labor-intensive and time-consuming but also subject to subjective biases and dependent on operators’ expertise. Recent advancements in Transformer-based architectures have shown substantial progress in image classification tasks, particularly excelling in global feature extraction. However, despite their strong performance, the high computational complexity and large parameter requirements of Transformer models limit their practical application in plant disease detection. To address these constraints, this study proposes an optimized Efficient Swin Transformer specifically engineered to reduce computational complexity while enhancing classification accuracy. This model is an improvement over the Swin-T architecture, incorporating two pivotal modules: the Selective Token Generator and the Feature Fusion Aggregator. The Selective Token Generator minimizes the number of tokens processed, significantly increasing computational efficiency and facilitating multi-scale feature extraction. Concurrently, the Feature Fusion Aggregator adaptively integrates static and dynamic features, thereby enhancing the model’s ability to capture complex details within intricate environmental contexts.Empirical evaluations conducted on the PlantDoc dataset demonstrate the model’s superior classification performance, achieving a precision of 80.14% and a recall of 76.27%. Compared to the standard Swin-T model, the Efficient Swin Transformer achieves approximately 20.89% reduction in parameter size while improving precision by 4.29%. This study substantiates the potential of efficient token conversion techniques within Transformer architectures, presenting an effective and accurate solution for plant disease detection in the agricultural sector.Keywords
Plant diseases represent one of the most significant challenges to global agricultural production, posing serious threats to both crop yield and quality. With the global population continually expanding, enhancing the yield and quality of staple crops has become increasingly vital. Rapid and accurate detection of plant diseases is essential not only for ensuring healthy crop growth but also for significantly boosting farmers’ economic returns. Thus, early detection is crucial for crop protection and for enhancing agricultural productivity [1,2]. Crops such as rice, maize, and tomatoes hold substantial economic and social importance in numerous countries, including China, and their health is directly linked to the stability of agricultural production.
Traditional plant disease detection methods rely primarily on manual observation, which is time-consuming, labor-intensive, and demands specialized expertise. Additionally, manual detection is prone to subjective human error, often leading to misdiagnosis [3,4]. Consequently, the development of automated, accurate, and efficient plant disease detection technologies capable of real-time crop health monitoring has emerged as a primary research priority, providing essential support for modern agricultural management [5].
With the accelerated advancements in deep learning methodologies, particularly through the extensive application of Convolutional Neural Networks (CNNs), substantial progress has been achieved in the domain of plant disease recognition. CNN architectures have consistently demonstrated high efficacy in tasks related to image classification and object detection, leading to their widespread adoption in plant disease detection applications. For example, Simonyan et al. [6] proposed VGGNet, which significantly improved image classification performance by increasing network depth; Szegedy et al. [7] developed the Inception model, which optimized computational efficiency and accuracy by implementing parallel operations of multi-scale convolutional kernels. Similarly, Huang et al. [8] introduced DenseNet, a model that enhances feature transmission through densely connected layers, thereby achieving further improvements in model performance. Such advancements have significantly promoted the application of deep learning techniques in the field of plant disease recognition.
In recent years, Transformer architectures have shown substantial promise in visual processing tasks. Dosovitskiy et al. [9] introduced the Vision Transformer (ViT), a model capable of capturing global features by segmenting images into patches and employing self-attention mechanisms. Building on this foundation, Han et al. [10] developed the Swin Transformer, which improves computational efficiency through hierarchical processing combined with a sliding window mechanism. Similarly, Wang et al. [11] proposed the Pyramid Vision Transformer (PVT), which integrates a pyramid structure and multi-scale processing to enhance performance in complex visual scenarios. Nevertheless, while these advancements mark significant progress, further optimization is essential to fully address computational efficiency constraints in these models.
To address these challenges, this study proposes an improved Vision Transformer model—the Efficient Swin Transformer. This model integrates a Feature Fusion Aggregator and a Selective Token Generator to achieve adaptive feature fusion and sparse representation, significantly reducing the initial number of tokens. This enhancement boosts both computational efficiency and recognition performance.
In computer vision, the prompt and precise recognition of objects in images remains a foundational objective. Traditional image recognition methods primarily depend on manual feature extraction, a process that is inherently complex, time-intensive, and heavily reliant on the quality of extracted features [12,13]. In recent years, deep learning approaches, especially Convolutional Neural Networks (CNNs), have become integral to image classification and object detection due to their superior capability for automatic feature learning [14–17].
Within supervised learning frameworks, CNNs serve as end-to-end solutions for classification and detection tasks and have seen extensive application in plant disease recognition. For instance, Atila et al. [18] achieved notable improvements in classification performance by refining CNN architectures and incorporating innovative modules. Similarly, Ferentinos [19] conducted systematic comparisons across various CNN models, underscoring the advantages of deep networks in feature extraction. Furthermore, Brahimi et al. [20] enhanced detection accuracy by integrating AlexNet and VGG models with traditional machine learning methods, while Picon et al. [21] developed a hybrid model that combined deep learning with classical machine learning to increase model robustness and detection precision. Other notable contributions include the work of Li et al. [22], who achieved stable disease recognition in complex environments by employing data augmentation alongside deep learning, and Zhang et al. [23], who optimized the ResNet architecture and hyperparameters on the PlantVillage dataset, thereby enhancing overall model performance. Abade et al. [24] proposed a DenseNet-based detection framework that improved feature representation, whereas Chen et al. [25] combined CNNs with Bayesian inference for efficient disease detection. Lastly, Jiang et al. [26] introduced an adaptive CNN model featuring dynamic feature weight adjustment mechanisms, significantly advancing detection accuracy in complex disease contexts. Collectively, these studies underscore the exceptional performance and continuous evolution of CNN-based methods in plant disease recognition.
Despite the substantial advancements made by convolutional neural networks (CNNs) in plant disease detection, they are inherently limited by their focus on local features, which constrains their capacity to capture broader contextual information effectively. To overcome these limitations, researchers have increasingly turned to Transformer-based architectures, which utilize self-attention mechanisms to better capture global information and manage complex image backgrounds. Recently, Transformer variants such as the Vision Transformer (ViT) and Swin Transformer have demonstrated exceptional performance in image classification tasks and are progressively being adopted for plant disease and pest recognition.For instance, Fu et al. [27] introduced an enhanced Vision Transformer (ViT) model specifically for crop disease and pest image recognition, significantly increasing recognition accuracy through the model’s multi-scale feature extraction capabilities. In another study, Li et al. [28] developed an automated method for plant disease and pest recognition using Vision Transformer, effectively addressing overfitting issues with self-attention mechanisms, yielding impressive results across diverse datasets. Additionally, Barman et al. [29] designed the ViT-SmartAgri system, which integrates Vision Transformer with smartphone technology to enable precise and convenient plant disease detection in smart agriculture applications.Furthermore, Karthik et al. [30] proposed a crop disease and pest classification approach that combines the Swin Transformer with a dual-attention multi-scale fusion network, accurately identifying diseased regions in complex multi-scale settings by employing Swin Transformer’s sliding window attention mechanism. Expanding on this work, Karthik et al. [31] introduced a dual-stream deep fusion network that incorporates grouped random depth feature pyramids with the Swin Transformer, enhancing both accuracy and efficiency in the classification of citrus diseases. Collectively, these methods have demonstrated remarkable effectiveness in real-world applications, underscoring the practical utility of Transformer architectures in plant disease detection tasks.
While considerable progress has been made in visual processing tasks by prior methods, conventional models continue to face inherent limitations in computational efficiency and the precision of feature extraction. In response to these challenges, this study introduces an optimized Efficient Swin Transformer model, with the following primary contributions:
• The Selective Token Generator module is designed to automatically identify representative tokens within images while filtering out redundant information, thus significantly reducing computational complexity without compromising performance. This module enhances the model’s computational efficiency, making it particularly suitable for visual tasks that require rapid processing.
• The Feature Fusion Aggregator facilitates the adaptive integration of static and dynamic features, enabling the model to accurately capture subtle details within complex backgrounds. This adaptation enhances both recognition and classification performance, particularly in visually challenging scenarios.
• In addition to maintaining high accuracy, the model achieves an optimized parameter structure, reducing parameter count by approximately 20.89% and enhancing precision by 4.29% compared to the standard Swin Transformer. This optimization effectively balances computational load with model accuracy.
• This model is exceptionally well-suited for agricultural monitoring in resource-limited environments, such as those with hardware constraints, including drones and mobile devices. Through reduced computational complexity and refined parameter design, the Efficient Swin Transformer enables high-accuracy, efficient, and automated plant disease detection. This capability provides reliable, cost-effective support for smart agricultural monitoring, making the model particularly advantageous for remote, real-time monitoring and early disease detection applications.
3 Efficient Swin Transformer Algorithm
The Efficient Swin Transformer is an optimized Transformer architecture specifically designed for vision tasks, as illustrated in Fig. 1. This architecture comprises four main stages, each containing a different number of Swin Transformer blocks and enhanced modules. Through a series of feature extraction and compression operations, it generates the final classification results from input images. The first stage includes two Swin Transformer blocks, the second stage contains four, and the third stage incorporates six blocks. These modules progressively extract multi-scale and deep features from the input image. The Swin Transformer blocks utilize a Shifted Window Attention mechanism, which significantly enhances the extraction of both local and global features, enabling efficient processing of large-scale images without increasing computational complexity.
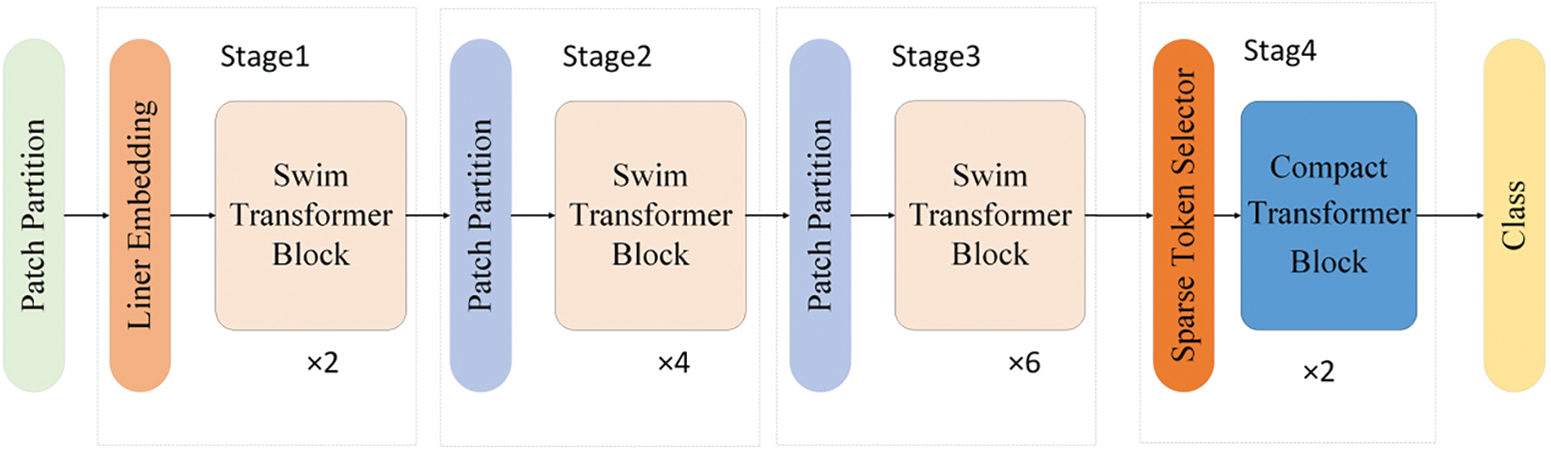
Figure 1: Structure of the efficient Swin Transformer
The fourth stage integrates a Selective Token Generator and a Compact Transformer. The Selective Token Generator selectively samples input features, filtering out representative feature tokens and removing redundant or irrelevant information, thus reducing the number of tokens processed and lowering computational costs. The Compact Transformer, structurally optimized from standard Transformer blocks, includes an innovative Feature Fusion Aggregator module. By leveraging sparse token representation and structural optimization, this module decreases the model’s computational load and parameter size while maintaining effective feature learning capabilities, thereby further enhancing the model’s overall performance.
3.1 Selective Token Generator Module
In visual tasks, traditional methods often process the entire image, which typically includes irrelevant or redundant information—such as background, noise, or repetitive features. This approach dramatically increases computational complexity and leads to resource waste, making it difficult for models to meet efficiency and real-time requirements in practical applications. When extracting and analyzing visual features in complex scenarios, current deep learning models frequently struggle to filter out irrelevant information effectively. To address this issue, this paper introduces the Selective Token Generator module. This module selectively generates token representations, focusing on the most representative feature regions within the image and effectively eliminating redundant or irrelevant information. Fig. 2 illustrates the structure of the Selective Token Generator, detailing the collaborative mechanism of convolutional layers and linear transformations.
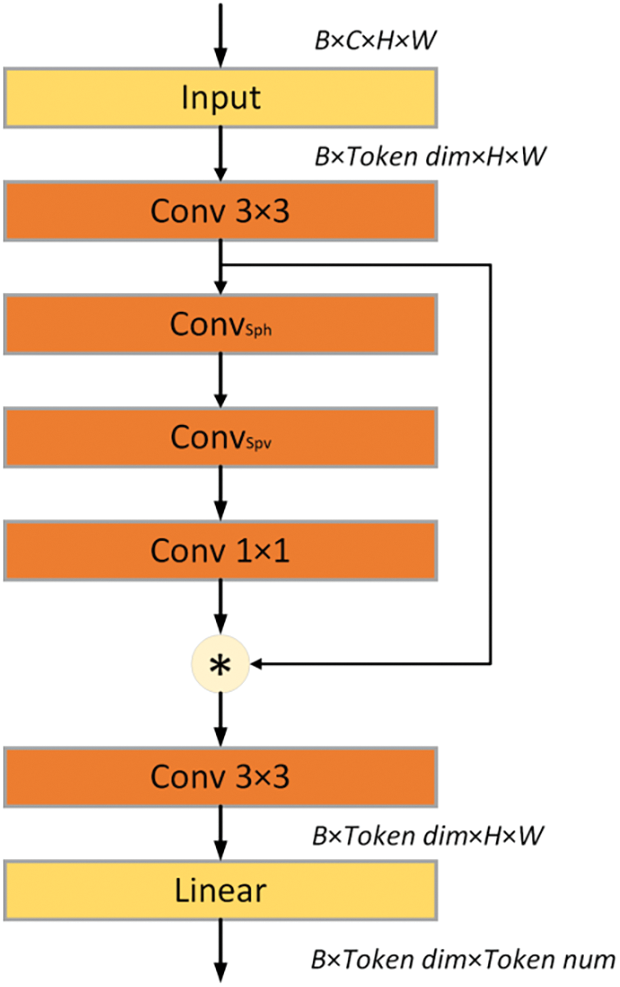
Figure 2: Structure of the sparse token selector
The Selective Token Generator comprises a series of convolutional layers along with a linear transformation layer, specifically designed to dynamically select and extract the most representative tokens from input data. The operational workflow of this module can be delineated into the following distinct steps:
(1) Initial Feature Extraction
The input feature matrix,
(2) Spatial Feature Enhancement
The spatial feature enhancement module improves input feature representation through two depth-wise dilated convolution operations applied in the horizontal and vertical directions. This design significantly enhances the model’s capability to capture spatial information. In the horizontal direction, a convolution kernel,
This configuration substantially expands the receptive field of the convolutional kernel. Through the integration of depthwise dilated convolutions, the model not only preserves its capacity to capture local features but also substantially enhances its ability to capture contextual information. Such a design enables the model to effectively discern complex spatial relationships within small-sized feature maps, thus improving both the breadth and depth of feature representation. Additionally, the fusion of multi-scale features further strengthens the network’s capacity to identify local feature patterns across various spatial positions, equipping the model to perform robustly in complex scenarios. Consequently, this enhanced architecture markedly improves the model’s capacity for feature representation and processing in challenging environments, providing robust support for the accurate capture of diverse feature patterns.
Formula for Horizontal Spatial Feature Extraction:
Here,
The formula for vertical spatial feature extraction is:
(3) Dynamic Feature Adjustment
The spatial information extracted in the previous step is refined and compressed using a 1 × 1 convolution layer, resulting in a feature-enhanced map, denoted as
(4) Generating Sparse Token Representations
By performing element-wise multiplication of the computed feature-enhanced map
The Selective Token Generator integrates multiple convolutional operations, enabling precise extraction of essential information across both spatial and channel dimensions. Subsequently, a linear transformation compresses these extracted features into sparse token representations, thereby significantly reducing the number of input tokens and markedly decreasing computational complexity. This approach enhances the model’s overall efficiency while maintaining high fidelity in feature representation [36].
Traditional Vision Transformer architectures excel at capturing global features; however, their feature fusion capability is often constrained by the computational overhead and redundancy inherent in the standard self-attention mechanism, particularly when dealing with fine-grained features and complex scenarios. This limitation is especially evident in tasks such as agricultural disease detection, where precise feature extraction and efficient fusion are critical for enhancing detection accuracy. To address this limitation, this study introduces the Compact Transformer Block, which improves feature fusion and representation efficiency by incorporating a Feature Fusion Aggregator module and residual connections.
The Compact Transformer Block comprises a normalization layer, a Feature Fusion Aggregator module, a Multi-Layer Perceptron (MLP), and residual connections, significantly optimizing the efficiency of feature extraction and fusion. The normalization layer is positioned before the Feature Fusion Aggregator and MLP to balance feature distribution, improve training stability, and accelerate model convergence (see Fig. 3). The Feature Fusion Aggregator module combines convolutional operations with adaptive attention mechanisms, dynamically fusing static and dynamic features, making it particularly suitable for complex or high-noise image scenarios to achieve flexible and precise feature extraction. Residual connections retain the original information from the input features, enhancing the network’s training stability, while the MLP further refines the fused features through nonlinear transformations, improving feature representation and diversity.
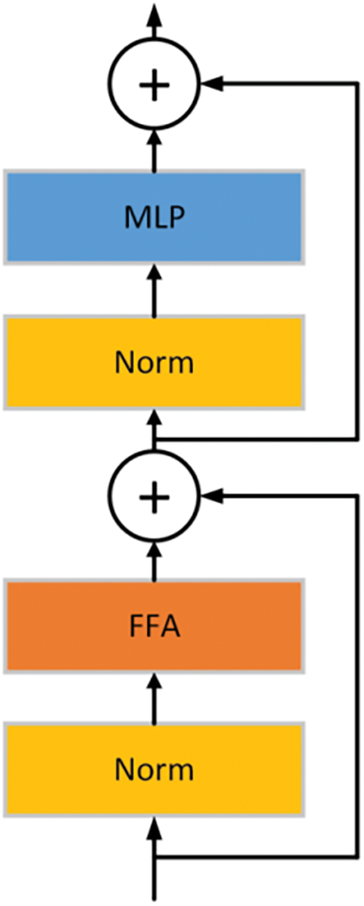
Figure 3: Structure of the compact transformer block
The Feature Fusion Aggregator (FFA) serves as the core module within the Compact Transformer Block (CTB), specifically engineered to adaptively fuse static and dynamic feature representations. This design facilitates the precise extraction of subtle features within complex backgrounds, allowing the model to excel in scenarios characterized by high noise levels and fine-grained variations. The detailed architecture of the FFA is illustrated in Fig. 4.
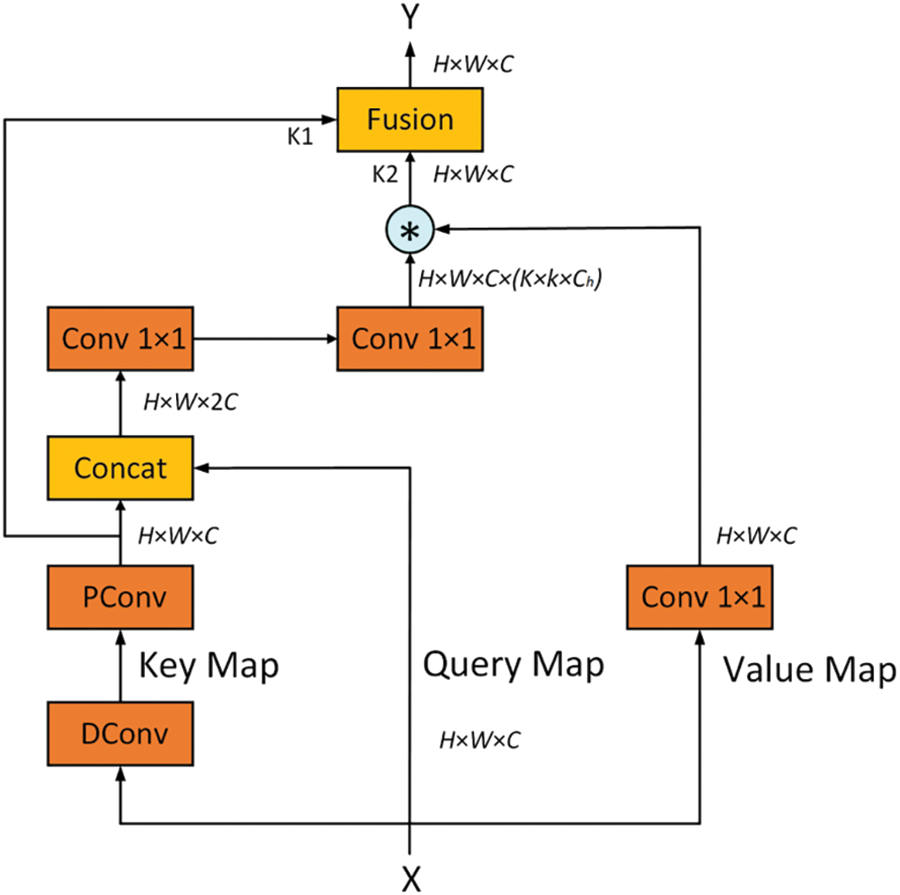
Figure 4: Structure of the feature fusion aggregator
The FFA’s operational workflow encompasses three key steps: static and dynamic feature extraction, attention weight calculation, and feature fusion. Through multi-scale analysis of input features, the FFA achieves accurate and robust feature extraction, enhancing the model’s adaptability to diverse visual contexts and improving its overall performance in complex scenarios.
(1) Static and Dynamic Feature Extraction
First, static and dynamic features are extracted from the input feature matrix
Static features are extracted through depthwise and pointwise convolutions, and the formula is given by:
where
Dynamic feature
(2) Attention Weight Calculation
Next, the static feature
Using two layers of convolution and activation functions to compute the attention weight
Here,
Finally, the Softmax function is used to normalize the weights to obtain the attention weight matrix:
(3) Feature Fusion Process
In the feature fusion stage, attention weights are used to combine static and dynamic features, generating the final output feature matrix
Here,
The final output feature
This fusion approach adaptively adjusts the significance of static and dynamic features, thereby markedly enhancing the model’s representational capacity in complex scenarios. The FFA module achieves efficient feature fusion through adaptive feature selection, integrating contextual information with detailed analysis of static and dynamic features. This design effectively improves the model’s robustness and its capacity for accurate recognition across varied environments.
All experiments in this study were conducted in an Ubuntu 20.04 operating system environment. The experimental setup consisted of an NVIDIA RTX 4090D GPU and an 18-core AMD EPYC 9754 128-Core processor. Experiments were implemented using PyTorch 1.11.0 and CUDA 11.3 with Python 3.8.
During training, the model employed the AdamW optimizer in conjunction with the cross-entropy loss function to evaluate classification errors. The initial learning rate was set to 5e−5, with a batch size of 64, and training was conducted over 30 epochs. Validation was performed at the end of each epoch to ensure that the model’s performance on the validation set was iteratively optimized.
The dataset utilized in this study is PlantDoc, a publicly available resource specifically designed for image-based plant disease classification and detection tasks [37]. PlantDoc comprises 2598 images across 13 plant categories and 27 types of plant diseases. As the data in PlantDoc is derived from real-world environments, it is highly valuable for developing plant disease detection models that can achieve robust performance under realistic conditions. This dataset presents challenges to the model’s robustness and classification accuracy due to complex backgrounds, variable lighting conditions, and multiple interference factors. Sample images from PlantDoc are displayed in Fig. 5.
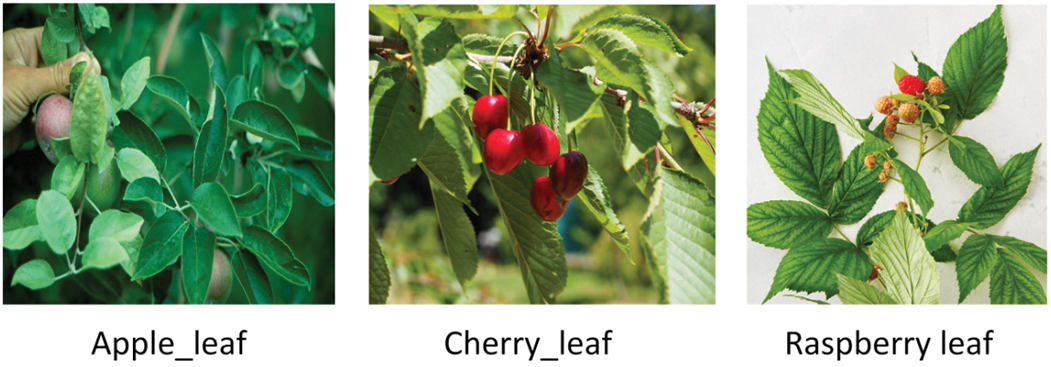
Figure 5: Sample images from the plantdoc dataset
In this experiment, four essential evaluation metrics were employed to comprehensively assess the performance of the Efficient Swin Transformer model in plant disease recognition tasks: Precision, Recall, F1 score, and GMACs. Each metric is defined and formulated as follows:
1. Precision quantifies the model’s accuracy in predicting positive samples, defined as the proportion of true positives among all samples classified as positive. The formula is provided as follows:
where
2. Recall indicates the model’s capability to identify actual positive samples, defined as the proportion of true positives among all genuine positive instances. The formula is provided as follows:
where
3. The
4. GMACs (Giga Multiply-Accumulate Operations) serve as a critical metric for assessing the computational complexity of the model. This metric quantifies the total number of multiply-add operations performed during execution, expressed in billions. A lower GMACs value indicates reduced computational load and enhanced execution efficiency, making this metric particularly valuable for evaluating the model’s viability in resource-constrained environments.
Collectively, these evaluation metrics offer a robust assessment of the model’s accuracy, stability, and computational efficiency in classification tasks, particularly in the context of complex plant disease imagery. They provide a thorough evaluation of the model’s practical applicability and overall performance.
The purpose of this experiment is to evaluate the performance of the Efficient Swin Transformer model in plant disease recognition tasks and to assess its effectiveness in practical applications. The experimental results indicate the superior performance of the Efficient Swin Transformer in terms of precision, recall, and F1 score across various categories, as detailed in Table 1 and the confusion matrix (Fig. 6).
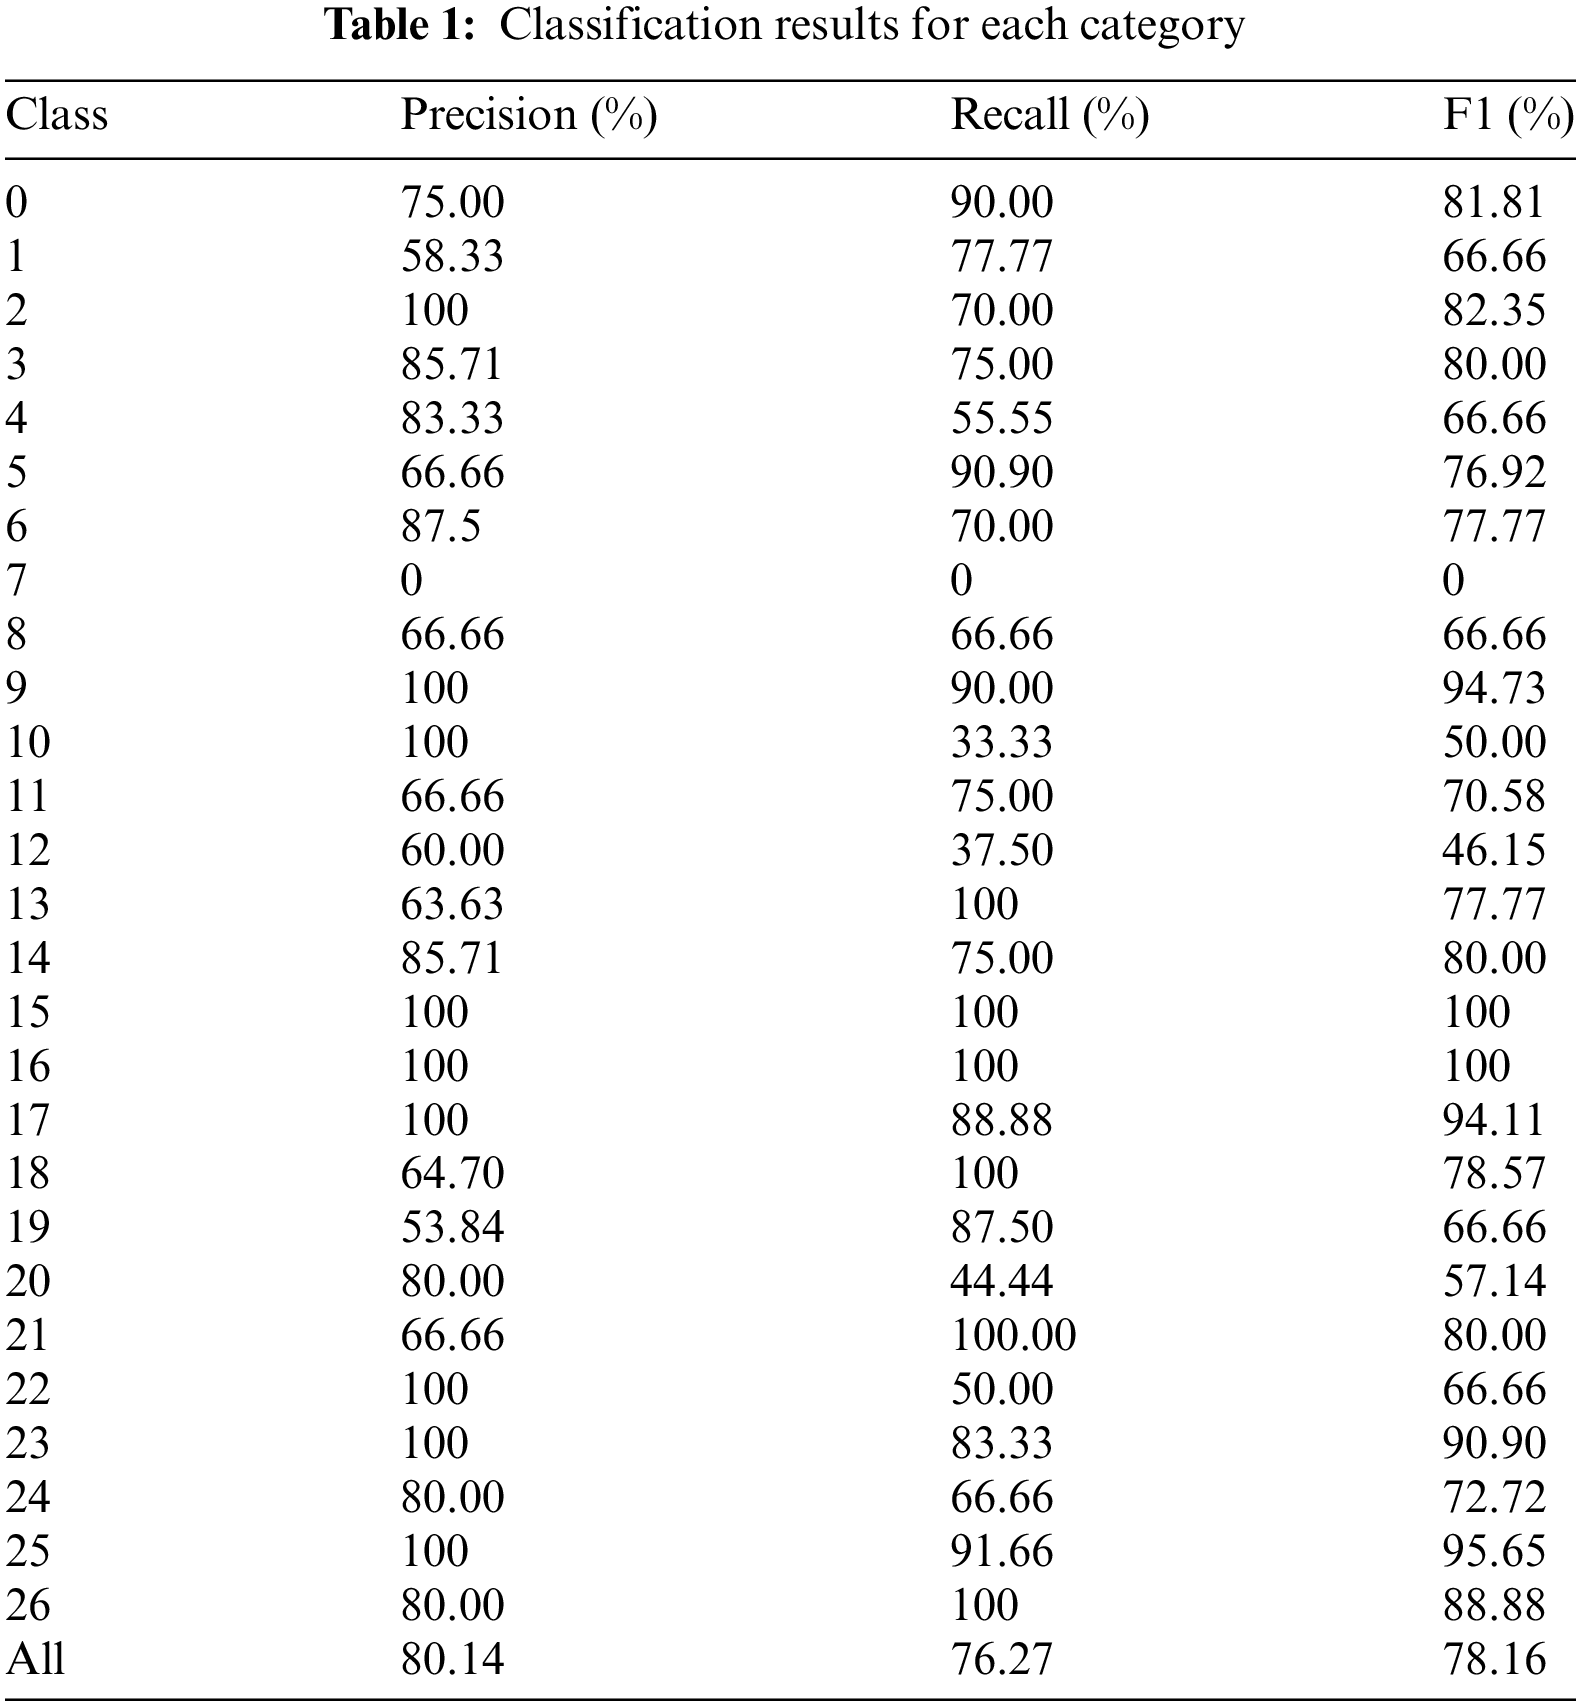
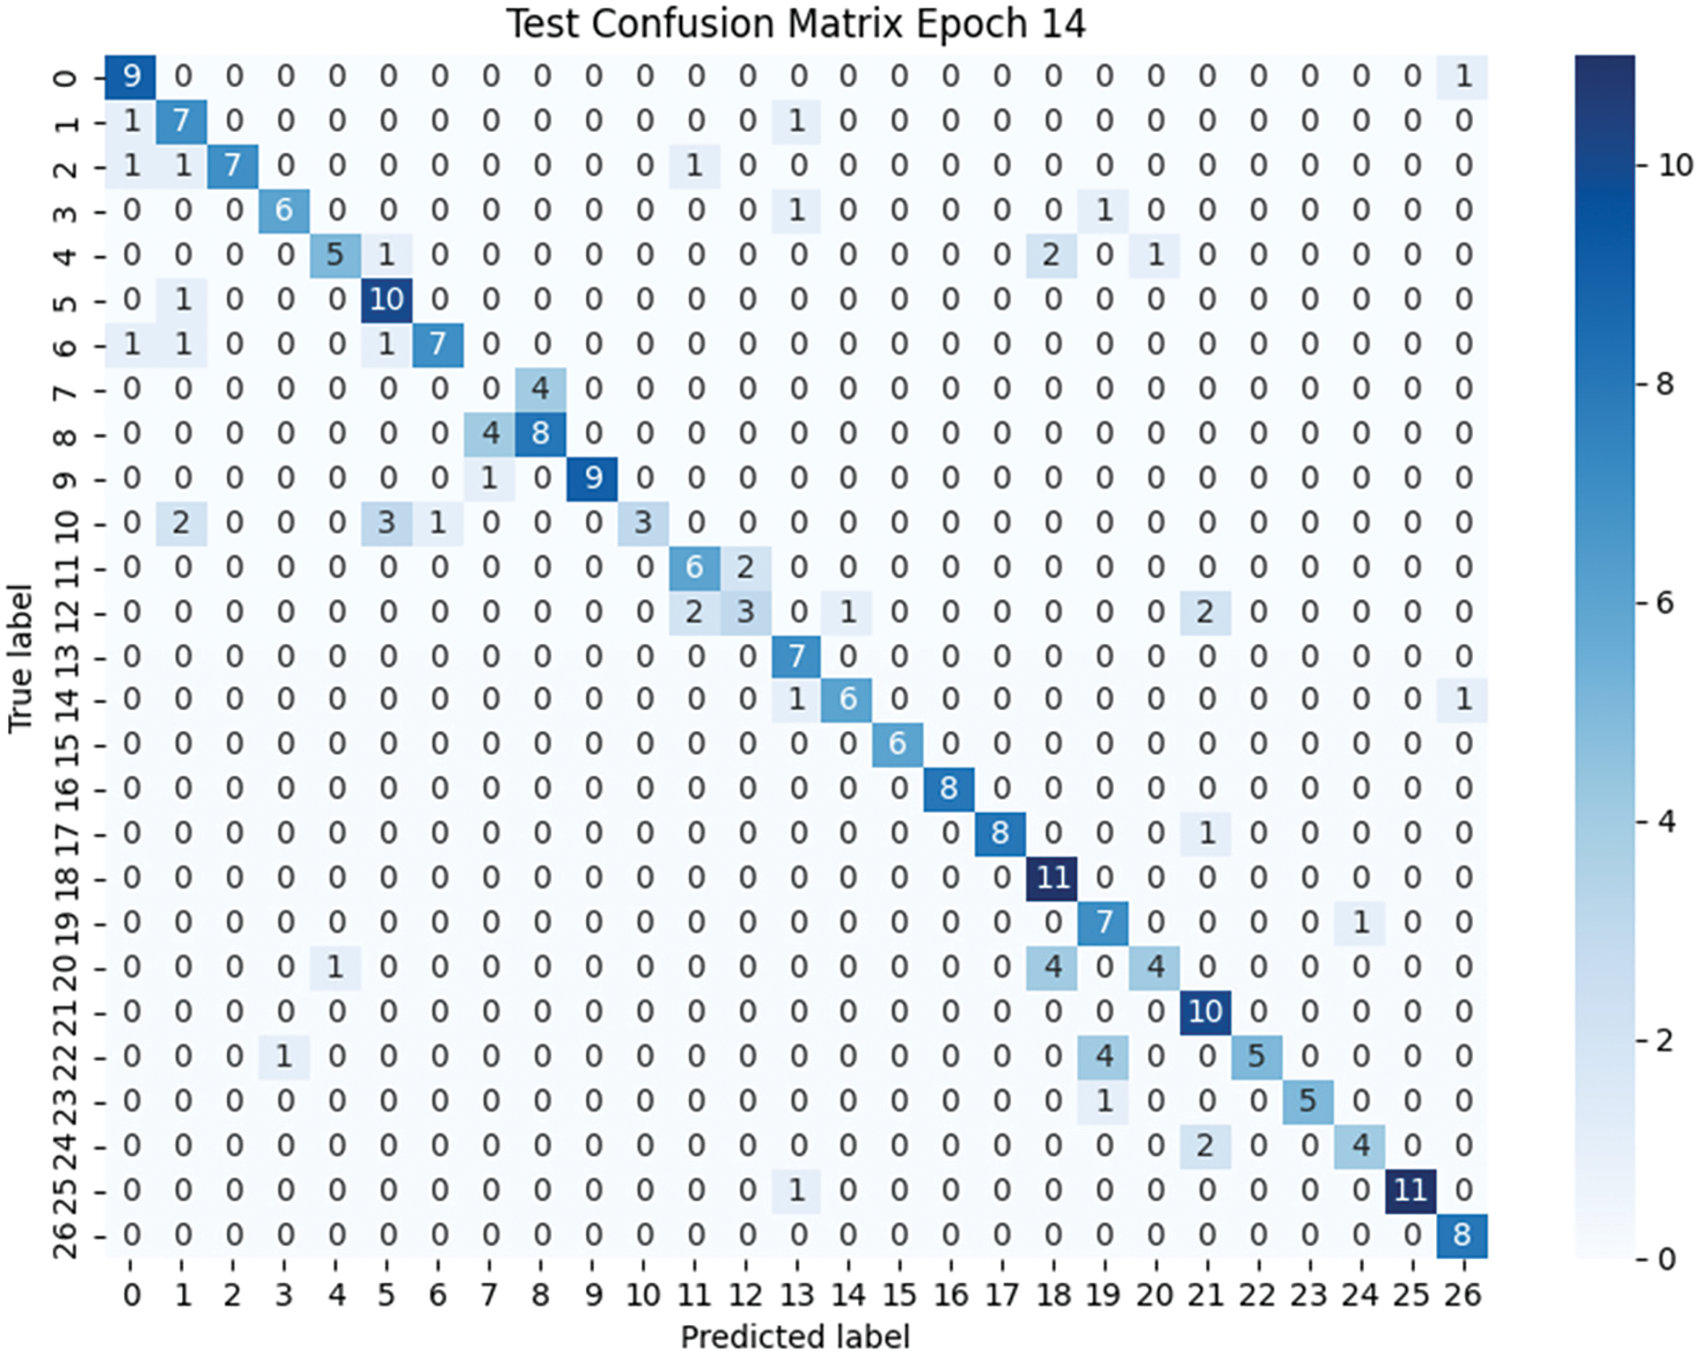
Figure 6: Confusion matrix
As shown in Table 1, the Efficient Swin Transformer demonstrates excellent overall performance in plant disease recognition tasks. The model achieves an overall precision of 80.14%, indicating a high correct classification rate across all categories and enabling accurate identification of plant diseases in most cases. Notably, the model achieved 100% precision in categories 15 and 16. The overall recall is 76.27%, indicating that the model successfully detected disease samples in most instances. However, the recall for category 7 is zero, suggesting that samples in this category were not detected accurately, potentially due to sample imbalance or high similarity of image features with other categories, complicating feature capture during training.
The F1 score, as the harmonic mean of precision and recall, provides a comprehensive measure of the model’s classification performance. The overall F1 score of the Efficient Swin Transformer is 78.16%, reflecting a balanced trade-off between precision and recall and enabling stable performance in complex multi-category environments. In certain challenging categories (e.g., categories 19 and 20), although precision or recall fluctuated for individual categories, the F1 score remained consistently high, underscoring the robustness of the model.
Figs. 7–9 illustrate the convergence of precision, accuracy, and loss for the Efficient Swin Transformer on the validation set as the number of training epochs increases. The model’s validation precision and accuracy (Figs. 7 and 8) rise rapidly in the initial training epochs, indicating that the model effectively captures key features from the data in the early learning stages. After the 6th epoch, the growth in precision slows and fluctuates slightly between 75% and 80%, while accuracy stabilizes, suggesting that the model’s validation performance has reached a plateau without overfitting. The validation loss (Fig. 9) decreases significantly from an initial high value (around 3.5) to approximately 1.0 during early training epochs, indicating that the model effectively reduces prediction errors in the initial phase. As training progresses, validation loss stabilizes around 1.0, demonstrating good convergence, absence of overfitting, and strong generalization capabilities. The stability of validation loss further supports the model’s learning efficiency throughout the training process.
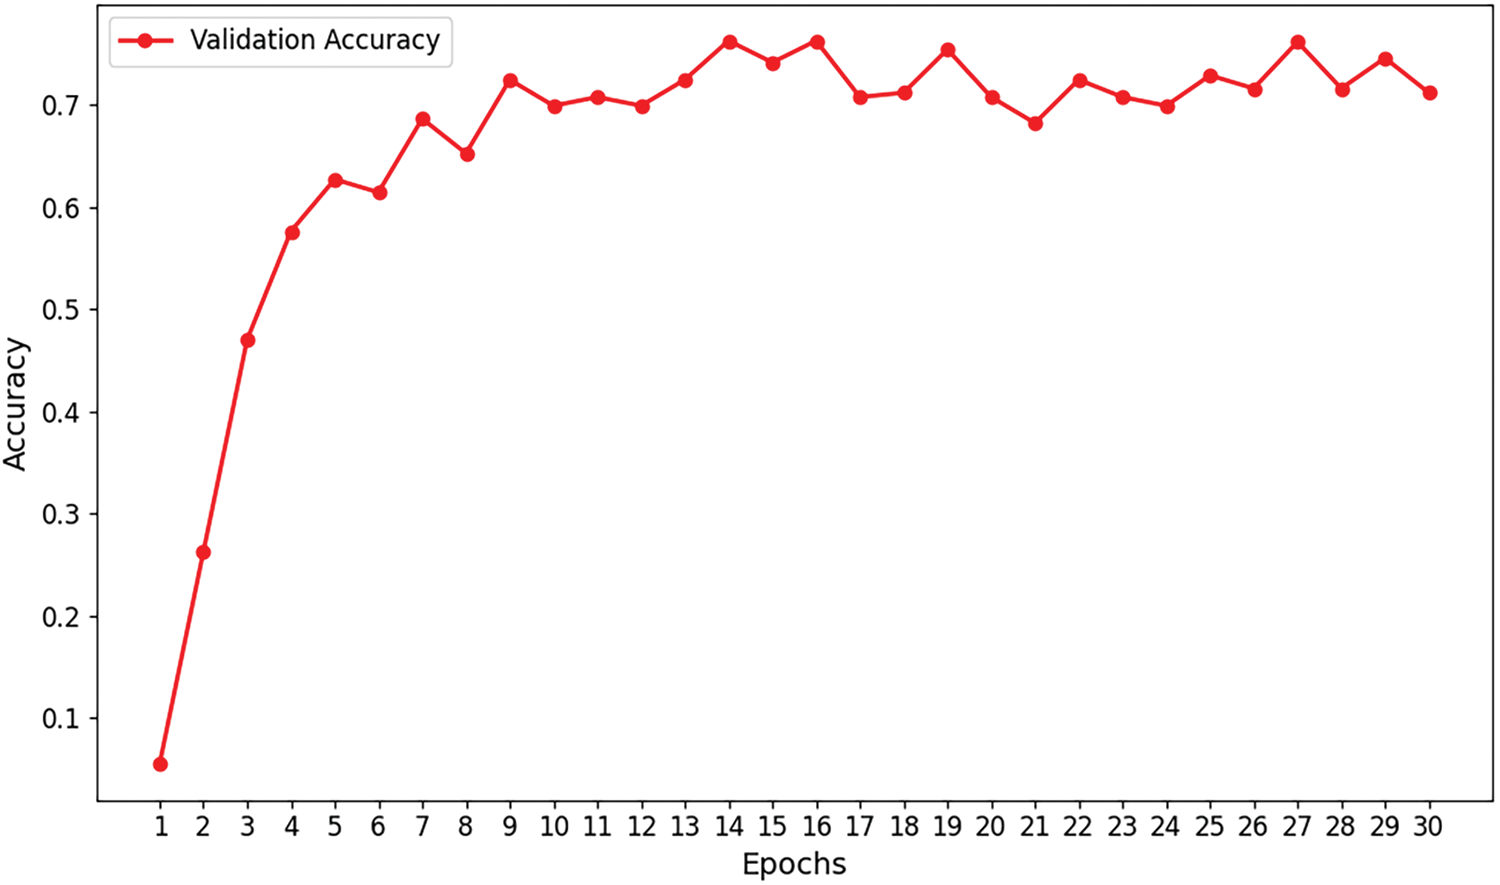
Figure 7: Validation accuracy curve
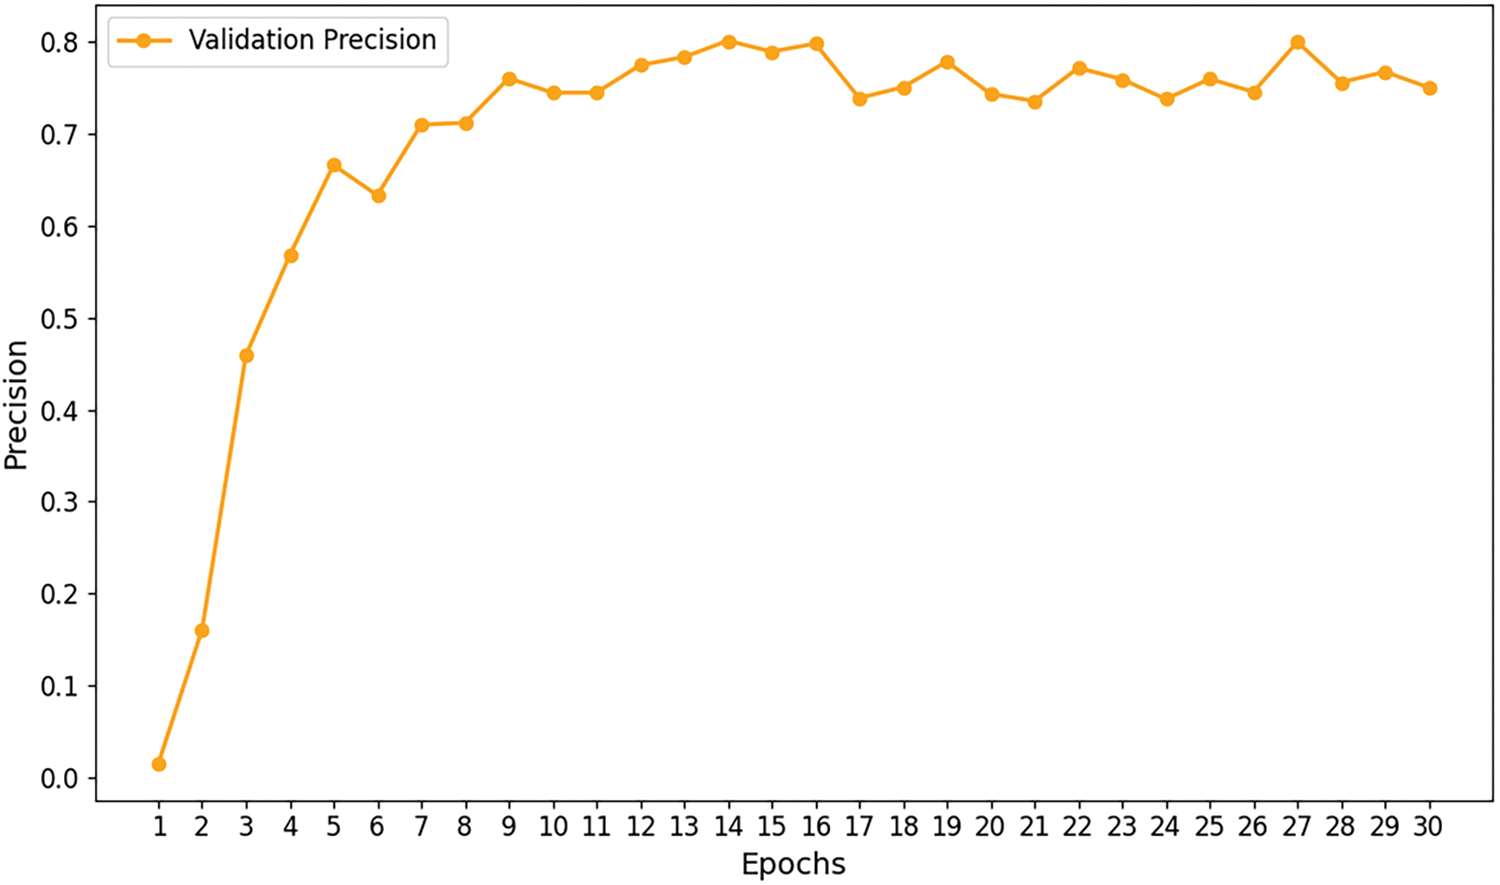
Figure 8: Validation precision curve
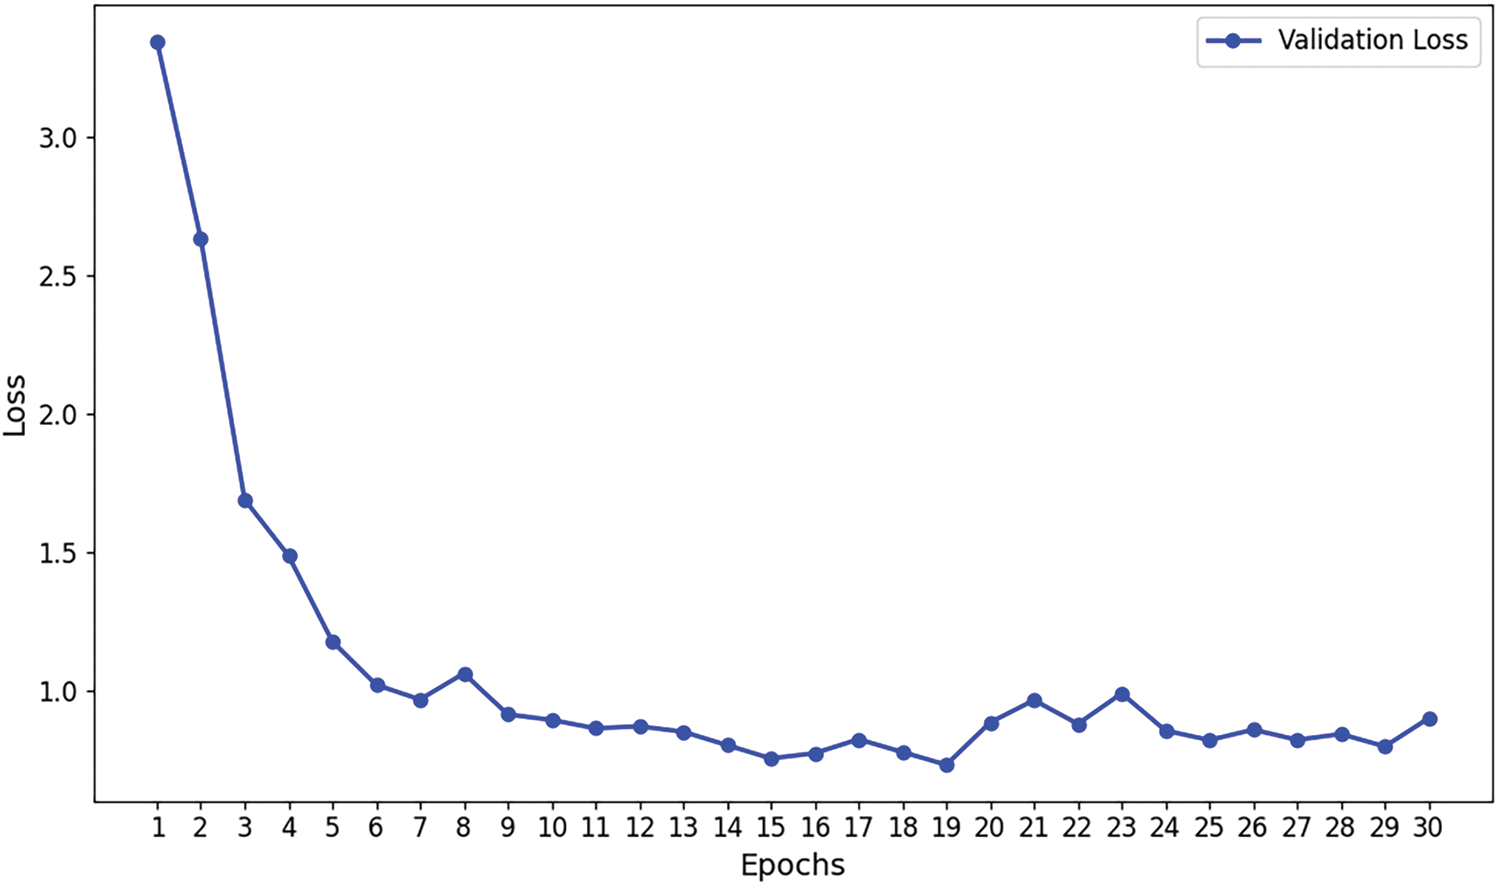
Figure 9: Validation loss curve
The multi-level feature aggregation mechanism of the Efficient Swin Transformer allows it to sustain high recognition accuracy even under challenging conditions, such as complex backgrounds and subtle disease regions. Experimental results confirm that the model performs reliably, even in the presence of high category similarity or variations in sample quality. This stability is attributed to the model’s advanced feature extraction capabilities, including multi-scale adaptive aggregation and efficient feature representation, which render the Efficient Swin Transformer exceptionally refined and precise for plant disease recognition tasks.
4.5 Grad-CAM Visualization for Model Diagnostic Function
To evaluate the performance of the Efficient Swin Transformer in plant disease detection, this study visualizes the classification results using Grad-CAM (Gradient-weighted Class Activation Mapping) technology. Grad-CAM generates heatmaps that highlight the image regions the model focuses on when making classification decisions, helping to assess whether the model accurately identifies diseased areas. Red regions indicate areas with a greater contribution to classification, while blue regions indicate lesser contribution, making it straightforward to visually determine whether the model is focused on the core diseased areas of the leaf rather than the background.
Fig. 10 presents a sample of corn leaf blight, characterized by irregularly distributed lesions across the leaf surface. The Grad-CAM heatmap shows that the model’s focus aligns well with actual lesion locations, indicated by red-highlighted areas, demonstrating high recognition accuracy in identifying complex and dispersed disease patterns. The model effectively minimizes background interference, consistently focusing on disease-affected regions.
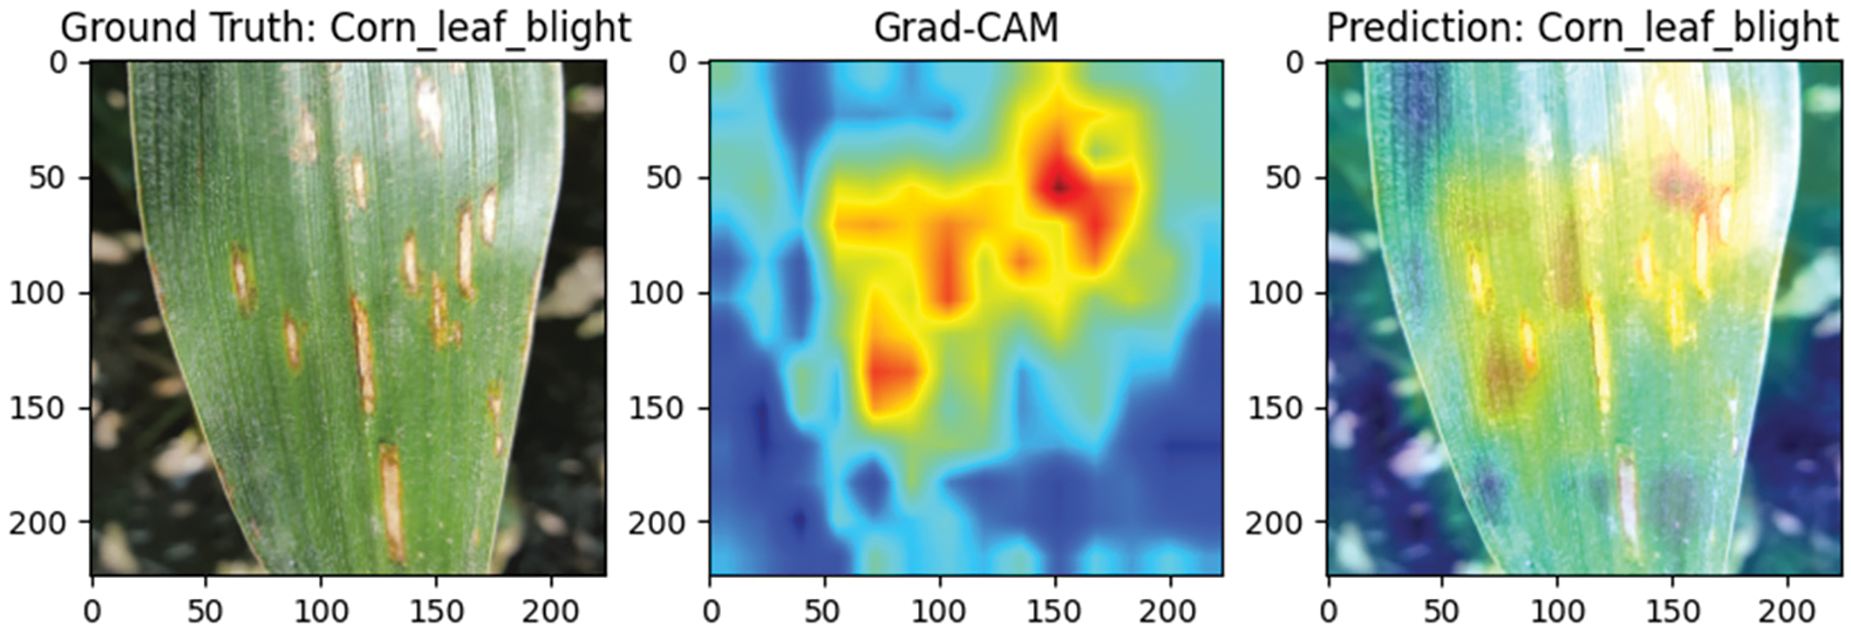
Figure 10: Grad-CAM visualization of corn leaf blight detection
Figs. 11 and 12 display samples of bell pepper leaf spot and apple rust diseases, respectively. In Fig. 11, the bell pepper leaf exhibits multiple lesion points scattered across the surface, and the model accurately identifies these areas without misclassifying healthy tissue, confirming its adaptability and precision in multi-lesion detection. In Fig. 12, the apple rust spots are widely distributed, and the model’s attention closely matches these locations, indicating high precision and focus in recognizing broad disease patterns. These findings suggest that the Efficient Swin Transformer is well-suited for complex disease monitoring tasks across diverse agricultural applications.
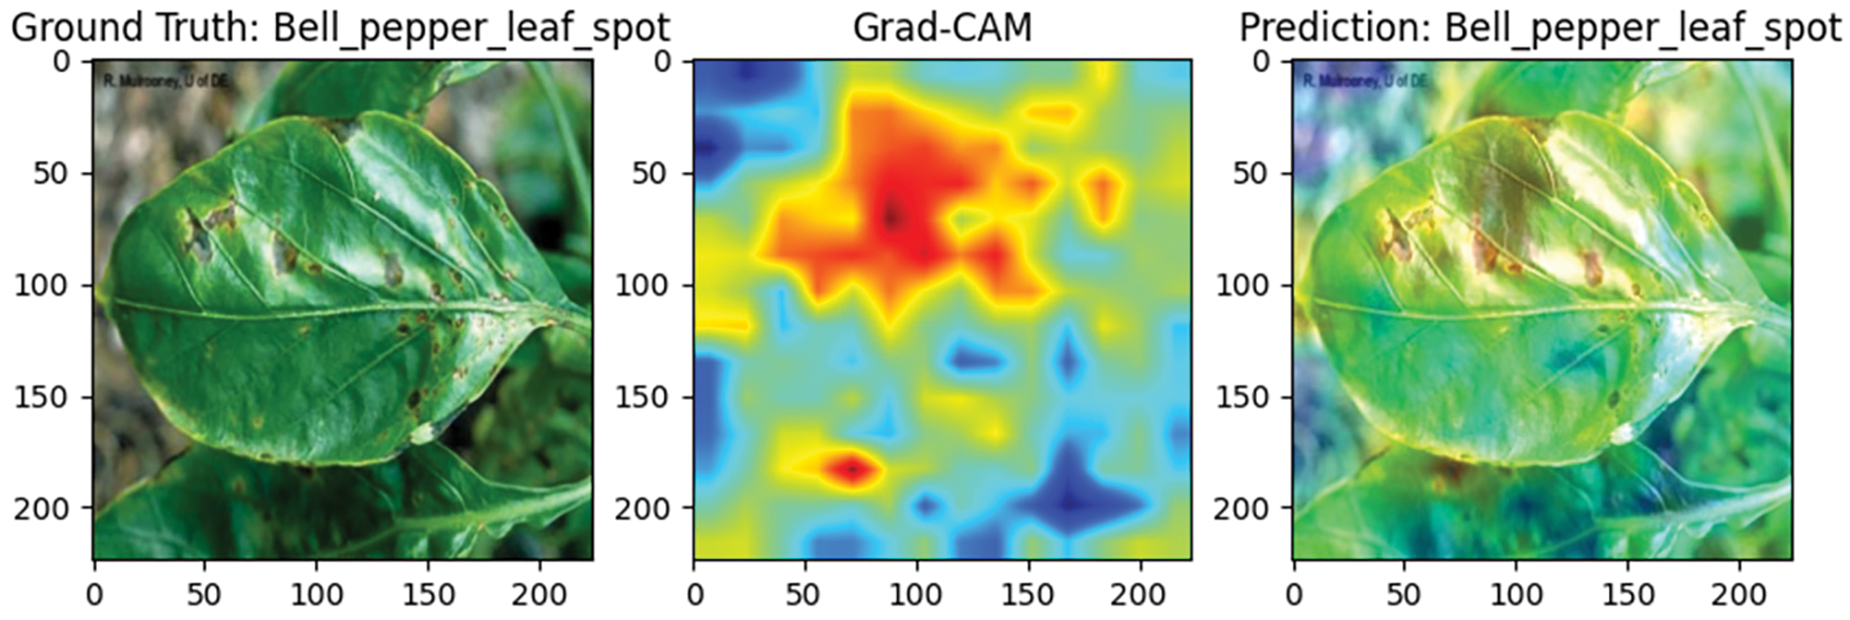
Figure 11: Grad-CAM visualization of bell pepper leaf spot detection
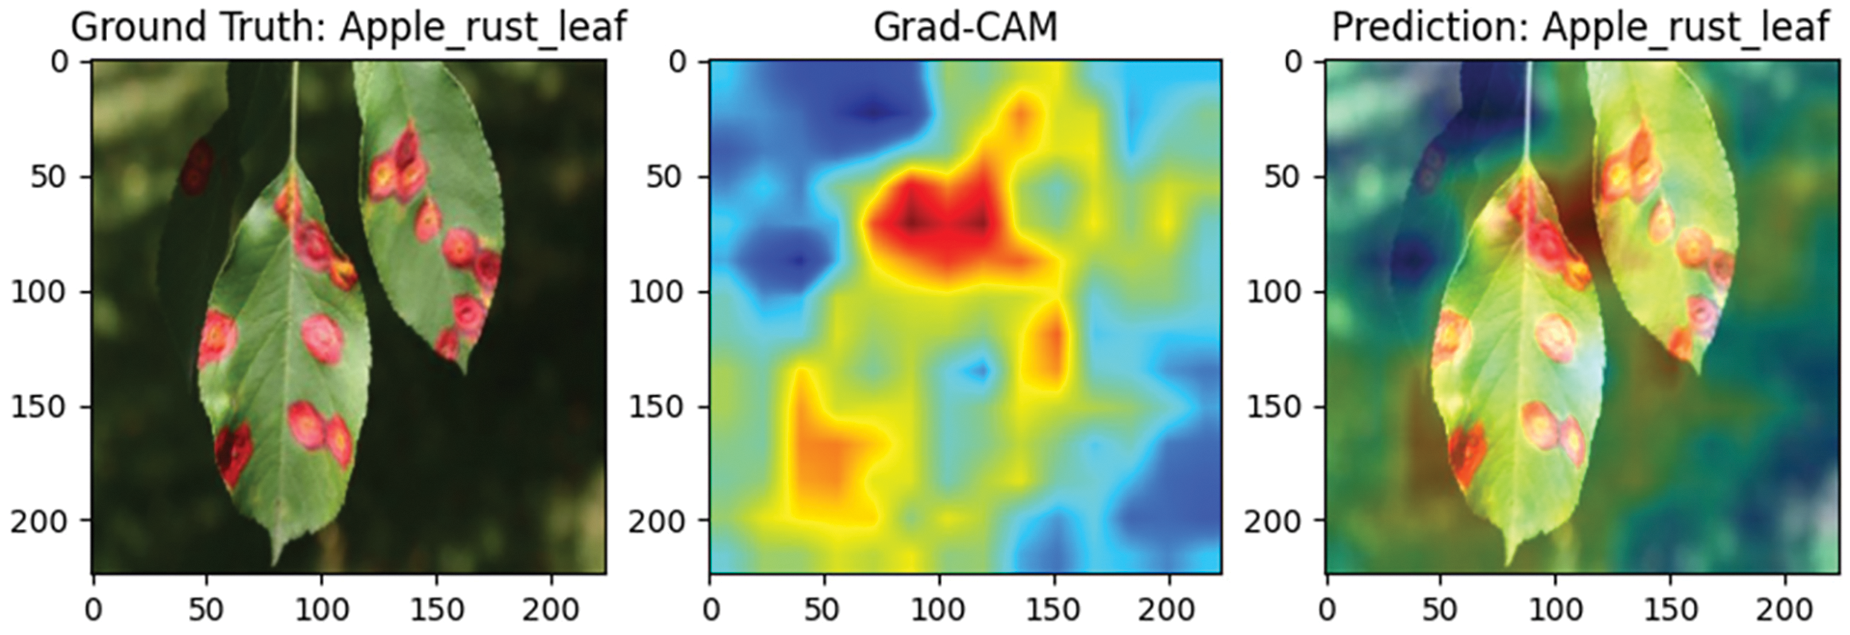
Figure 12: Grad-CAM visualization of apple rust leaf spot detection
In this experiment, we compared the performance of various deep learning models in plant disease classification tasks to validate the effectiveness of the proposed model. The results, as shown in Table 2, cover various deep learning classification model architectures, including Mobilenet [38], ResNet [15], GoogLeNet [7], DenseNet [8], ShuffleNet V2 [39], MobileViT [40], Vision Transformer, Swin Transformer, and other models applied to plant disease classification tasks, such as T-CNN (ResNet-101) [41] and ICVT [42].
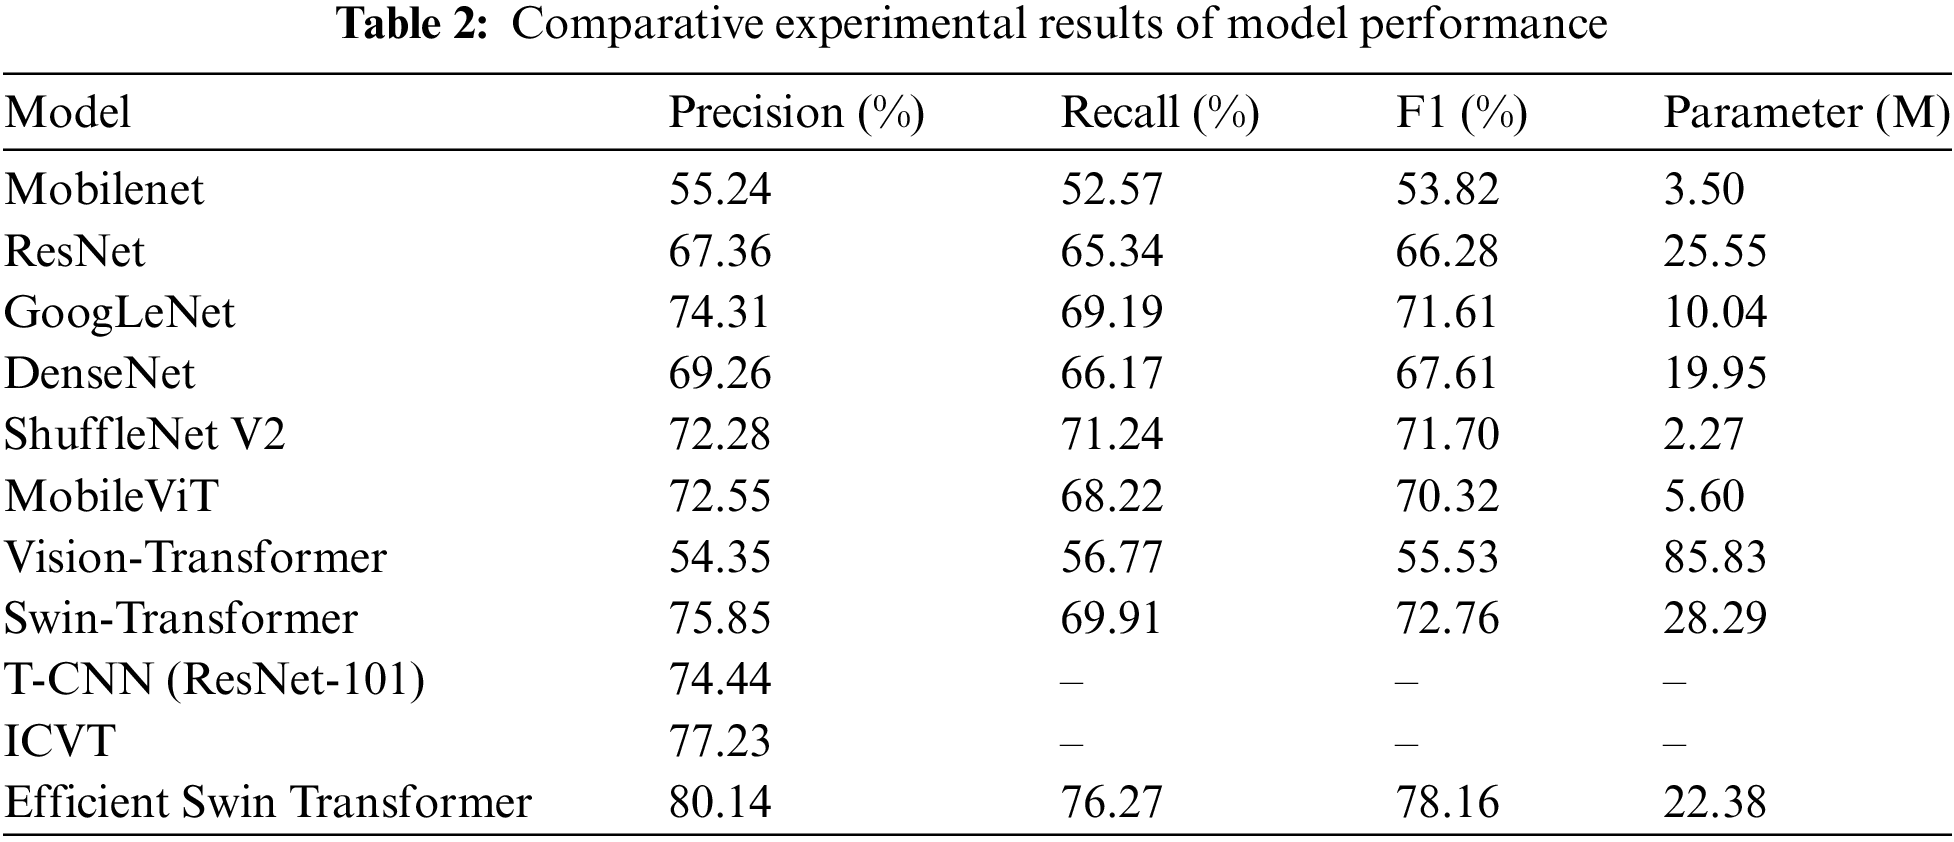
From the results in Table 2, it is evident that different models exhibit significant variations in performance on plant disease classification tasks. Lightweight models, such as Mobilenet and ShuffleNet V2, while offering low computational complexity and reduced parameter counts, display lower precision and recall when handling complex disease images due to their relatively limited feature extraction capabilities. This suggests that, in disease detection tasks, relying solely on lightweight designs may fall short of high-precision requirements, especially in practical agricultural applications where disease types are diverse and complex, necessitating models with stronger feature recognition capabilities.
Classic deep convolutional neural networks, including ResNet, GoogLeNet, and DenseNet, significantly enhance the ability to capture disease features through increased network depth and multi-scale feature extraction mechanisms. In experiments, GoogLeNet achieved precision and recall of 74.3% and 69.1%, respectively, outperforming most lightweight networks. However, the high parameter count and computational costs of these models constrain their application in resource-limited scenarios, particularly in mobile deployment or real-time detection, where their performance benefits are challenging to fully utilize.
In contrast, Transformer architectures have demonstrated tremendous potential in visual tasks due to their powerful global feature extraction capabilities. The Swin Transformer achieves high recognition precision (75.85%) and recall (69.91%) through its sliding window mechanism and hierarchical feature extraction design, excelling in handling complex scenarios and multi-scale disease features. Nonetheless, the high parameter count of the Swin Transformer (28.29 M) remains a primary limitation to its practical application. Furthermore, global attention mechanisms like the Vision Transformer, despite theoretically robust feature capture capabilities, perform slightly worse than other convolutional models in plant disease classification, primarily due to lower efficiency in handling small-scale data and fine-grained features.
The proposed Efficient Swin Transformer introduces a Feature Fusion Aggregator and a Selective Token Generator, effectively addressing the computational bottlenecks of traditional Transformer models and significantly enhancing feature fusion and sparsification capabilities. Experimental results indicate that the Efficient Swin Transformer achieved precision, recall, and F1 scores of 80.14%, 76.27%, and 78.16%, respectively, outperforming all compared models, especially under limited computational resources, validating its application potential and innovative value in practical agricultural disease detection.
Additionally, this study evaluated other representative models for plant disease classification, including T-CNN (ResNet-101) and ICVT. T-CNN (ResNet-101) is an enhanced convolutional neural network based on ResNet-101, integrating advanced deep feature learning and multi-level feature fusion techniques. ICVT (Improved Convolutional Vision Transformer), on the other hand, represents the latest advancements in deep learning combined with Transformer architecture, further improving global feature capture capabilities. Experimental results indicate that T-CNN and ICVT achieved precision scores of 74.44% and 77.23%, respectively. In comparison, the Efficient Swin Transformer achieved a precision of 80.14%, significantly outperforming T-CNN and ICVT, thereby highlighting its superior performance in plant disease classification tasks.
In this study’s ablation experiments, we designed five comparative tests to verify the contribution of different modules in the Efficient Swin Transformer to the model’s classification performance (Table 3).
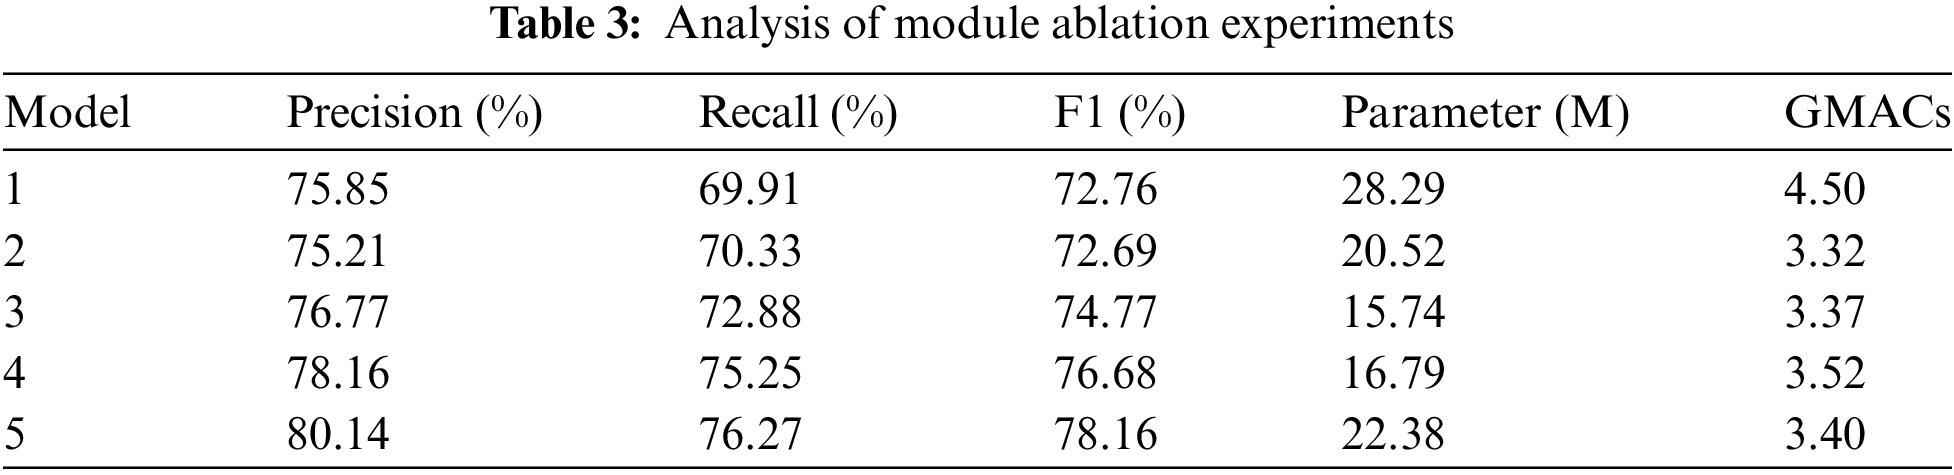
The first experiment utilized the basic Swin-T model as a baseline. This model possesses certain global feature extraction capabilities but incurs a high computational cost (28.29 M parameters, 4.5 GMACs) and achieved an F1 score of 72.76%.
In the second experiment, the Feature Fusion Aggregator was replaced with a multi-head attention mechanism. The results indicated that multi-head attention had limitations in feature fusion, with the F1 score slightly decreasing to 72.69%. The model’s parameters were reduced to 20.52 M, and the computational cost dropped to 3.32 GMACs. These findings suggest that the Feature Fusion Aggregator significantly enhances feature fusion quality and overall model performance.
The third experiment further removed the Selective Token Generator and replaced the Feature Fusion Aggregator with a multi-head attention mechanism. Although the model’s parameters were reduced to 15.74 M, and the computational cost was 3.37 GMACs, the F1 score dropped to 74.77%, underscoring the critical role of the Selective Token Generator in enhancing feature sparsity and reducing redundancy.
The fourth experiment removed only the Selective Token Generator while retaining the Feature Fusion Aggregator, resulting in an F1 score of 76.68%, with 16.79 M parameters and a computational cost of 3.52 GMACs. This outcome further validated the effectiveness of the Feature Fusion Aggregator.
Finally, the fifth experiment utilized the complete Efficient Swin Transformer model, integrating both the Selective Token Generator and Feature Fusion Aggregator. This configuration achieved the highest performance, with an F1 score of 78.16%, 22.38 M parameters, and a computational cost of 3.40 GMACs, fully demonstrating the critical contributions of these two modules in enhancing the model’s classification performance.
4.8 Analysis of the Impact of Regularization Methods on Model Performance
In this study, we conducted an in-depth comparison of different regularization methods (L1 regularization, L2 regularization, and no regularization) on the performance of the Efficient Swin Transformer model, focusing on changes in precision, recall, and F1 score (Table 4). The results indicate that L1 regularization yielded the best performance, achieving a precision of 80.14%, recall of 76.27%, and an F1 score of 78.16%. L1 regularization introduces sparsity, enabling the model to perform more selective feature extraction, effectively reducing the influence of unimportant features and enhancing the model’s generalization ability and stability in plant disease classification. This advantage allows the model to maintain high recognition accuracy even when processing complex and variable disease images.
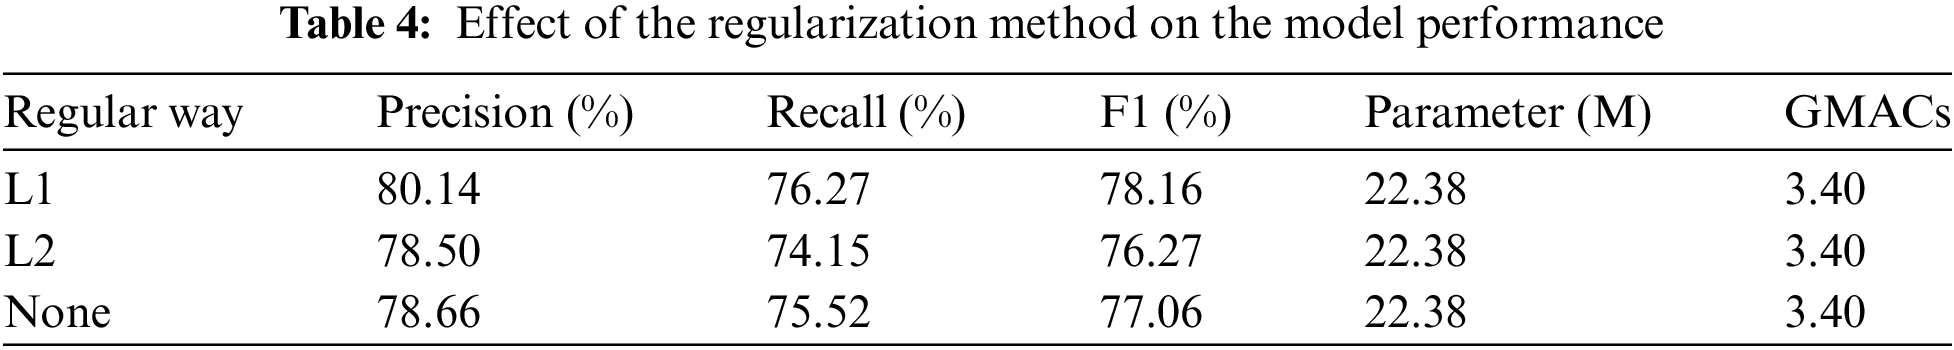
In contrast, the performance of L2 regularization and no regularization was slightly inferior. L2 regularization achieved a precision of 78.50%, recall of 74.15%, and an F1 score of 76.27%. Although L2 regularization mitigates overfitting, its uniform weight penalty may reduce the model’s ability to capture subtle features. For no regularization, the results showed a precision of 78.66%, recall of 75.52%, and an F1 score of 77.06%. While the absence of regularization can preserve strong feature learning capabilities in certain cases, it tends to increase the risk of overfitting, especially when handling high-dimensional and complex plant disease images.
Overall, L1 regularization enhances model sparsity, significantly improving detection performance and resistance to interference, thus providing more stable support for practical disease detection tasks.
4.9 Discussion of the Influence of Token Dimension and Quantity on Model Performance
In this study, a systematic investigation was conducted to evaluate the effects of varying token dimensions and quantities within the Selective Token Generator module on the model’s classification performance, parameter count, and computational cost (GFLOPs). By adjusting token dimensions (128, 256, 512, and 768) and token quantities (25, 49, 64, and 81), changes in Precision, Recall, F1 score, model parameter count, and GFLOPs were thoroughly analyzed. The experimental findings demonstrate that both token dimension and quantity exert a considerable impact on the model’s performance, underscoring a distinct trade-off between classification accuracy, computational complexity, and resource consumption.
4.9.1 Impact of Token Quantity (49 Tokens) on Model Performance
With a token dimension of 128, the model achieved a precision of 76.85%, recall of 70.76%, and an F1 score of 73.68%, utilizing 13.14 M parameters and incurring 2.72 GFLOPs. This configuration demonstrated low computational complexity alongside satisfactory performance, rendering it suitable for scenarios with limited computational resources.
Increasing the token dimension to 256 resulted in a slight decrease in precision to 75.81%, while recall improved to 71.18%, yielding an F1 score of 73.42%. The parameter count increased to 15.17 M, and GFLOPs rose to 2.89, suggesting that a larger token dimension can enhance recall while maintaining a relatively low computational cost.
At a token dimension of 512, the model exhibited optimal performance, achieving a precision of 80.14%, recall of 76.27%, and an F1 score of 78.16%. The parameter count was 22.37 M, with a computational load of 3.40 GFLOPs. This configuration strikes an effective balance between performance and computational cost, making it the recommended setting for this study.
Further increasing the token dimension to 768 led to a slight improvement in recall to 72.45%, but precision dropped to 76.62%, resulting in an F1 score of 74.48%. The parameter count rose to 33.78 M, and GFLOPs surged to 4.14, indicating that excessively high token dimensions add complexity and introduce redundant features, ultimately diminishing overall precision.
4.9.2 Impact of Token Quantity on Model Performance (with Dimension of 512)
With a token quantity of 25 and a token dimension of 512, the model demonstrated stable performance, achieving a precision of 76.45%, recall of 73.30%, and an F1 score of 74.84. The parameter count and GFLOPs were 22.38 M and 3.21, respectively, making this configuration suitable for applications that prioritize computational efficiency while still requiring reliable performance.
Setting the token quantity to 49 achieved a balanced performance, particularly with a token dimension of 512, where the F1 score reached 78.16%, reflecting moderate computational cost and excellent performance.
Increasing the token quantity to 64 maintained stable precision and recall (75.53% and 73.30%), yielding an F1 score of 74.40. The parameter count remained at 22.38 M, and GFLOPs increased slightly to 3.53. This configuration enhanced the model’s spatial awareness, albeit with a marginal rise in computational cost.
At a token quantity of 81, precision improved to 77.91%, though recall decreased slightly to 72.88%, resulting in an F1 score of 75.31. The parameter count rose to 22.39 M, with GFLOPs reaching 3.67, indicating that increasing token quantity can marginally improve precision but also introduces additional computational overhead.
4.9.3 Discussion on Model Computational Performance and Practicality in Resource-Constrained Environments
Table 5 illustrates a clear trade-off between the model’s performance and computational cost (GFLOPs) as the token dimension and quantity vary. Experimental results indicate that when the token dimension is 512 and the token quantity is 49, the model achieves an optimal balance between performance and computational cost. Under this configuration, the Efficient Swin Transformer attains an F1 score of 78.16%, with approximately 20.89% fewer parameters and a significant reduction in GFLOPs compared to the standard Swin Transformer. These improvements allow the model to maintain high accuracy while significantly reducing computational complexity.
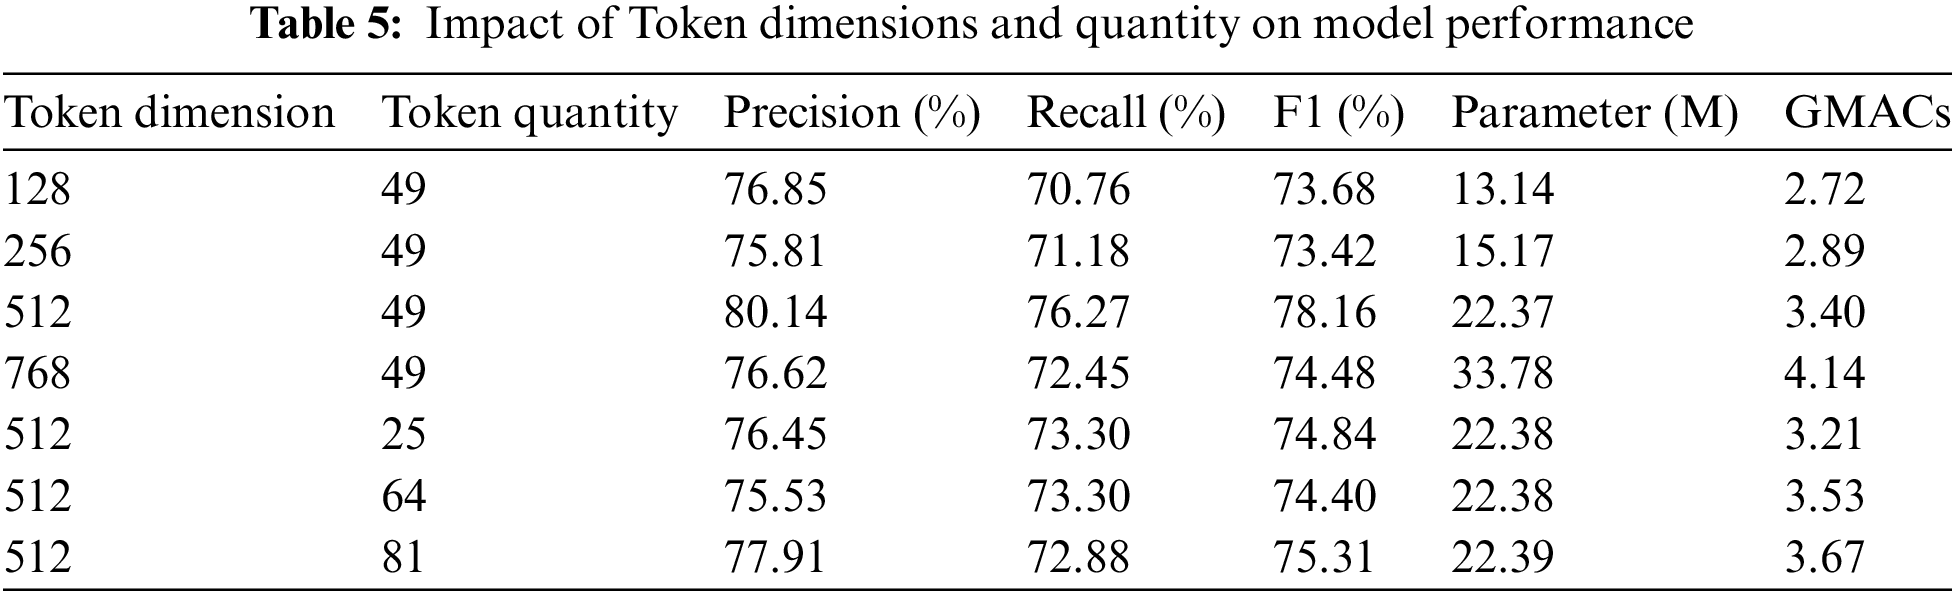
The reduction in GFLOPs enhances the model’s efficiency in utilizing computational resources, making it particularly suitable for hardware platforms with limited computational power and energy resources, such as drones and mobile devices. In such scenarios, devices typically require efficient inference tasks with limited power supply and computational capacity, making computational efficiency critical. Experimental results further demonstrate that the model can operate effectively in low-power, low-latency environments (e.g., agricultural monitoring and remote plant disease detection), balancing performance with energy consumption.
Additionally, Table 5 shows that although increasing the token number and dimension can enhance specific performance metrics, it also substantially increases computational overhead. Therefore, in practical applications, selecting a token dimension of 512 and a quantity of 49 is an ideal configuration for resource-constrained environments. In future research, further optimization of the Selective Token Generator may help ensure that the model maintains real-time detection capability and high-precision performance in more extreme resource-constrained environments (e.g., embedded devices), thereby broadening the applicability of the Efficient Swin Transformer. By reducing GFLOPs and parameter count, the Efficient Swin Transformer can function effectively in resource-limited environments, particularly excelling in scenarios where a balance between computational complexity, energy consumption, and performance is critical.
This study introduces the Efficient Swin Transformer, which significantly enhances classification performance in plant disease detection by incorporating the Feature Fusion Aggregator and Selective Token Generator. Compared with traditional convolutional neural networks and Transformer architectures, this model excels in multi-scale feature extraction and adaptability to complex scenarios, while effectively reducing computational costs, providing an innovative solution for efficient visual recognition. This work underscores the potential of efficient visual recognition in resource-constrained environments, promising advancements in plant disease detection and breakthroughs in agricultural automation technologies.
Experimental results indicate that the Efficient Swin Transformer surpasses existing state-of-the-art models on the PlantDoc dataset, particularly excelling in key metrics such as precision, recall, and F1 score. Furthermore, in optimization experiments focused on token dimension and count, a configuration of 512 dimensions and 49 tokens achieved an optimal balance between performance and computational resource consumption, validating the feasibility and effectiveness of this method in practical agricultural applications. These findings demonstrate that the Efficient Swin Transformer not only delivers outstanding performance in plant disease detection tasks but also provides valuable insights for achieving efficient recognition in other complex scenarios.
Nonetheless, this study acknowledges certain limitations. Although the Selective Token Generator effectively reduces computational load, it may lead to excessive filtering or feature loss when processing redundant or overly complex scenarios. Additionally, the balance between computational efficiency and accuracy requires further optimization, particularly in applications involving higher resolutions or real-time detection tasks. Improving feature extraction and fusion mechanisms will be an important area of future exploration to enhance the model’s performance in higher-resolution and dynamic scenarios.
Future research directions involve further refinement of the Selective Token Generation strategy to improve adaptability to dynamic features and diverse complex scenarios, thus enhancing the model’s generalizability. Additionally, incorporating other innovative feature extraction methods, such as adaptive attention mechanisms, or integrating multi-modal data fusion could bolster the model’s robustness. With these optimizations and expansions, the Efficient Swin Transformer is anticipated to play an increasingly pivotal role in plant disease detection and to extend its applicability to other visual tasks, providing robust technical support across a broad spectrum of agricultural and industrial applications.
Acknowledgement: Thanks to our researchers for their collaboration and technical assistance.
Funding Statement: The authors did not receive specific funding for this research.
Author Contributions: Wei Liu developed the experimental plan and methodology. Wei Liu and Ao Zhang developed the model and performed the experiments. Wei Liu analyzed the experimental effects, and Ao Zhang conducted the statistical analysis and figure generation. Ao Zhang also conducted the literature survey and data collection. All authors reviewed the results and approved the final version of the manuscript.
Availability of Data and Materials: All data generated or analyzed during this study are available. The PlantDoc dataset’s link: https://github.com/pratikkayal/PlantDoc-Dataset (accessed on April 16 2024).
Ethics Approval: Not applicable.
Conflicts of Interest: The authors declare no conflicts of interest to report regarding the present study.
References
1. S. Savary, L. Willocquet, F. A. Elazegui, N. Estrada, P. S. Teng and P. Tharreau, “The global burden of pathogens and pests on major food crops,” Nat. Ecol. Evol., vol. 3, no. 3, pp. 430–439, Mar. 2019. doi: 10.1038/s41559-018-0793-y. [Google Scholar] [PubMed] [CrossRef]
2. H. Fones, G. E. Baranger, M. W. Leggett, S. Smithson, and K. Syngenta, “Pathogens, beneficial microbes, and beyond: A toolbox for plant health improvement,” Plant Physiol., vol. 182, no. 1, pp. 27–42, Jan. 2020. [Google Scholar]
3. A. K. Mahlein, “Plant disease detection by imaging sensors—Parallels and specific demands for precision agriculture and plant phenotyping,” Plant Dis., vol. 100, no. 2, pp. 241–251, Feb. 2016. doi: 10.1094/PDIS-03-15-0340-FE. [Google Scholar] [PubMed] [CrossRef]
4. C. H. Bock, G. H. Poole, P. E. Parker, and T. R. Gottwald, “Plant disease severity estimated visually, by digital photography and image analysis, and by hyperspectral imaging,” CRC Crit. Rev. Plant Sci., vol. 29, no. 2, pp. 59–107, Feb. 2010. doi: 10.1080/07352681003617285. [Google Scholar] [CrossRef]
5. S. V. Ramesh, A. Ghosh, and L. Naik, “Advances in plant disease detection,” Plant Sci., vol. 267, pp. 130–141, Aug. 2018. [Google Scholar]
6. K. Simonyan and A. Zisserman, “Very deep convolutional networks for large-scale image recognition,” presented at the Int. Conf. Learn. Representations, San Diego, CA, USA, May 7–9, 2015. [Google Scholar]
7. C. Szegedy et al., “Going deeper with convolutions,” presented at the IEEE Conf. Comput. Vis. Pattern Recognit., Boston, MA, USA, Jun. 7–12, 2015. [Google Scholar]
8. G. Huang, Z. Liu, L. Van Der Maaten, and K. Q. Weinberger, “Densely connected convolutional networks,” presented at the IEEE Conf. Comput. Vis. Pattern Recognit., Honolulu, HI, USA, Jul. 21–26, 2017. [Google Scholar]
9. A. Dosovitskiy et al., “An image is worth 16 × 16 words: Transformers for image recognition at scale,” presented at the Int. Conf. Learn. Representations, Vienna, Austria, May 3–7, 2021. [Google Scholar]
10. K. Han, A. Xiao, E. Wu, J. Guo, and C. Xu, “Swin transformer: Hierarchical vision transformer using shifted windows,” presented at the IEEE/CVF Int. Conf. Comput. Vis., Montreal, QC, Canada, Oct. 11–17, 2021. [Google Scholar]
11. W. Wang, X. Xie, and Y. Li, “Pyramid vision transformer: A versatile backbone for dense prediction without convolutions,” presented at the IEEE/CVF Int. Conf. Comput. Vis., Montreal, QC, Canada, Oct. 11–17, 2021. [Google Scholar]
12. R. Szeliski, Computer Vision: Algorithms and Applications, 1st ed. New York, NY, USA: Springer, 2010. [Google Scholar]
13. D. G. Lowe, “Distinctive image features from scale-invariant keypoints,” Int. J. Comput. Vis., vol. 60, no. 2, pp. 91–110, Nov. 2004. doi: 10.1023/B:VISI.0000029664.99615.94. [Google Scholar] [CrossRef]
14. A. Krizhevsky, I. Sutskever, and G. E. Hinton, “ImageNet classification with deep convolutional neural networks,” presented at the Adv. Neural Inf. Process. Syst., Lake Tahoe, NV, USA, Dec. 3–6, 2012. [Google Scholar]
15. K. He, X. Zhang, and J. Sun, “Deep residual learning for image recognition,” presented at the IEEE Conf. Comput. Vis. Pattern Recognit., Las Vegas, NV, USA, Jun. 27–30, 2016. [Google Scholar]
16. M. Tan and Q. V. Le, “EfficientNet: Rethinking model scaling for convolutional neural networks,” presented at the Int. Conf. Mach. Learn., Long Beach, CA, USA, Jun. 9–15, 2019. [Google Scholar]
17. J. Redmon, S. Divvala, R. Girshick, and A. Farhadi, “You only look once: Unified, real-time object detection,” presented at the IEEE Conf. Comput. Vis. Pattern Recognit., Las Vegas, NV, USA, Jun. 27–30, 2016. [Google Scholar]
18. U. Atila, U. Kose, and T. Yigit, “Plant leaf disease detection using improved convolutional neural network,” IEEE Access, vol. 9, pp. 108907–108915, 2021. [Google Scholar]
19. K. P. Ferentinos, “Deep learning models for plant disease detection and diagnosis,” Comput. Electron. Agric., vol. 145, pp. 311–318, Feb. 2018. doi: 10.1016/j.compag.2018.01.009. [Google Scholar] [CrossRef]
20. M. Brahimi, K. Boukhalfa, and A. Moussaoui, “Deep learning for tomato diseases: Classification and symptoms visualization,” Appl. Sci., vol. 7, no. 6, Jun. 2017, Art. no. 610. [Google Scholar]
21. A. Picon, J. L. Alvarez-Gila, A. Echazarra, M. T. Hernando, and A. Rodriguez-Vaamonde, “Combining deep learning and machine learning for plant disease detection,” Agronomy, vol. 9, no. 9, Sep. 2019, Art. no. 525. [Google Scholar]
22. Y. Li, M. Chen, and J. Xu, “Enhancing plant disease detection using CNN and data augmentation techniques,” Agriculture, vol. 11, no. 6, Jun. 2021, Art. no. 558. [Google Scholar]
23. S. Zhang, J. Wang, and X. Ding, “Improved deep learning approach for plant disease recognition on PlantVillage dataset,” Sensors, vol. 19, no. 21, Oct. 2019, Art. no. 4063. [Google Scholar]
24. A. Abade, A. Ferreira, and F. De Barros Vidal, “DenseNet-based framework for plant disease recognition,” IEEE Access, vol. 9, pp. 108907–108915, 2021. [Google Scholar]
25. J. Chen, M. Shi, L. Wang, and Y. Zhang, “Bayesian convolutional neural networks for efficient plant disease detection,” J. Agric. Informat., vol. 11, no. 2, pp. 1–9, 2020. [Google Scholar]
26. P. Jiang, X. Li, H. Xie, and Q. Wang, “Adaptive CNN for complex plant disease recognition,” Comput. Electron. Agric., vol. 157, pp. 138–146, Feb. 2019. [Google Scholar]
27. X. Fu, Q. Ma, F. F. Yang, C. Zhang, X. Zhao and F. Chang, “Crop pest image recognition based on the improved ViT method,” Inf. Process. Agric., vol. 11, no. 2, pp. 249–259, 2024. doi: 10.1016/j.inpa.2023.02.007. [Google Scholar] [CrossRef]
28. H. Li, S. Li, J. Yu, Y. Han, and A. Dong, “Plant disease and insect pest identification based on vision transformer,” presented at the Int. Conf. Image Signal Process. Agricul., Beijing, China, SPIE, Apr. 2022. [Google Scholar]
29. U. Barman, P. Sarma, M. Rahman, V. Deka, and S. Lahkar, “ViT-SmartAgri: Vision transformer and smartphone-based plant disease detection for smart agriculture,” Agronomy, vol. 14, no. 2, Feb. 2024, Art. no. 327. doi: 10.3390/agronomy14020327. [Google Scholar] [CrossRef]
30. R. Karthik, A. Ajay, A. S. Bisht, T. Illakiya, and K. Suganthi, “A deep learning approach for crop disease and pest classification using Swin transformer and dual-attention multi-scale fusion network,” IEEE Access, vol. 12, pp. 152639–152655, Oct. 2024. doi: 10.1109/ACCESS.2024.3481675. [Google Scholar] [CrossRef]
31. R. Karthik, S. Hussain, T. T. George, and R. Mishra, “A dual track deep fusion network for citrus disease classification using group shuffle depthwise feature pyramid and Swin transformer,” Ecol. Inform., vol. 73, no. 2, 2023, Art. no. 101257. doi: 10.1016/j.ecoinf.2023.102302. [Google Scholar] [CrossRef]
32. R. Reedha, E. Dericquebourg, R. Canals, and A. Hafiane, “Application of convolution-free vision transformers in small dataset scenarios,” presented at the IEEE Int. Conf. Comput. Vis. Appl., Singapore, 2022. [Google Scholar]
33. Y. Yu and V. Koltun, “Multi-scale context aggregation by dilated convolutions,” presented at the IEEE Conf. Comput. Vis. Pattern Recognit., Las Vegas, NV, USA, Jun. 27–30, 2016. [Google Scholar]
34. X. Li, W. Wang, X. Hu, and J. Yang, “Selective kernel networks,” presented at the IEEE Conf. Comput. Vis. Pattern Recognit., Long Beach, CA, USA, Jun. 16–20, 2019. [Google Scholar]
35. A. G. Howard et al., “Searching for MobileNetV3,” presented at the IEEE Int. Conf. Comput. Vis., Seoul, Republic of Korea, Oct. 27–Nov. 2, 2019. [Google Scholar]
36. S. Han, J. Pool, J. Tran, and W. J. Dally, “Learning both weights and connections for efficient neural networks,” presented at the Adv. Neural Inf. Process. Syst., Montreal, QC, Canada, Dec. 7–12, 2015. [Google Scholar]
37. PlantDoc Dataset, “A dataset for plant disease detection and classification,” 2019, Accessed: Apr. 16, 2024. [Online]. Available: https://github.com/pratikkayal/PlantDoc-Dataset [Google Scholar]
38. A. G. Howard et al., “MobileNets: Efficient convolutional neural networks for mobile vision applications,” 2017, arXiv:1704.04861. [Google Scholar]
39. N. Ma, X. Zhang, H. T. Zheng, and J. Sun, “ShuffleNet V2: Practical guidelines for efficient CNN architecture design,” presented at the Eur. Conf. Comput. Vis., Munich, Germany, Sep. 8–14, 2018. [Google Scholar]
40. S. Mehta and M. Rastegari, “MobileViT: Light-weight, general-purpose, and mobile-friendly vision transformer,” 2021, arXiv:2110.02178. [Google Scholar]
41. D. Wang, J. Wang, W. Li, and P. Guan, “T-CNN: Trilinear convolutional neural networks model for visual detection of plant diseases,” Comput. Electron. Agric., vol. 190, no. 1, 2021, Art. no. 106468. doi: 10.1016/j.compag.2021.106468. [Google Scholar] [CrossRef]
42. S. Yu, L. Xie, and Q. Huang, “Inception convolutional vision transformers for plant disease identification,” Internet Things, vol. 21, no. 2, 2023, Art. no. 100650. doi: 10.1016/j.iot.2022.100650. [Google Scholar] [CrossRef]
Cite This Article
 Copyright © 2025 The Author(s). Published by Tech Science Press.
This work is licensed under a Creative Commons Attribution 4.0 International License , which permits unrestricted use, distribution, and reproduction in any medium, provided the original work is properly cited.
 Downloads
 Citation Tools