
 Submit a Paper
 Propose a Special lssue
 Open Access
ARTICLE

Multisource Data Fusion Using MLP for Human Activity Recognition
1 Department of Computer Science and Information Technology, Faculty of Science, Naresuan University, Phitsanulok, 65000, Thailand
2 Center of Excellence for Innovation and Technology for Detection and Advanced Materials (ITDAM), Faculty of Science, Naresuan University, Phitsanulok, 65000, Thailand
3 Center of Excellence in Nonlinear Analysis and Optimizations, Faculty of Science, Naresuan University, Phitsanulok, 65000, Thailand
* Corresponding Author: Kreangsak Tamee. Email:
Computers, Materials & Continua 2025, 82(2), 2109-2136. https://doi.org/10.32604/cmc.2025.058906
Received 24 September 2024; Accepted 02 January 2025; Issue published 17 February 2025
 View Full Text
 Download PDF
Abstract
This research investigates the application of multisource data fusion using a Multi-Layer Perceptron (MLP) for Human Activity Recognition (HAR). The study integrates four distinct open-source datasets—WISDM, DaLiAc, MotionSense, and PAMAP2—to develop a generalized MLP model for classifying six human activities. Performance analysis of the fused model for each dataset reveals accuracy rates of 95.83 for WISDM, 97 for DaLiAc, 94.65 for MotionSense, and 98.54 for PAMAP2. A comparative evaluation was conducted between the fused MLP model and the individual dataset models, with the latter tested on separate validation sets. The results indicate that the MLP model, trained on the fused dataset, exhibits superior performance relative to the models trained on individual datasets. This finding suggests that multisource data fusion significantly enhances the generalization and accuracy of HAR systems. The improved performance underscores the potential of integrating diverse data sources to create more robust and comprehensive models for activity recognition.Keywords
Human Activity Recognition (HAR) is a rapidly growing field within artificial intelligence (AI) and pattern recognition that focuses on the automatic identification and interpretation of human activities through various data sources [1]. The primary objective of HAR is to enable machines to understand and respond to human behaviors, which can be applied across diverse domains such as healthcare, security, and human-computer interaction [2]. As technology continues to advance, HAR systems are becoming increasingly integral to applications like health monitoring, smart home automation, and user behavior analysis. These systems aim to enhance user experiences, optimize processes, and improve safety by accurately recognizing and categorizing human activities [3,4].
Despite its rapid development, HAR faces several challenges due to the inherent complexity of human behavior, the variability of environmental conditions, and the demand for real-time processing. The integration of data from multiple sensors, such as accelerometers, gyroscopes, and image sensors, has proven essential for addressing the limitations of single-sensor approaches. Multisource data fusion techniques, such as those utilizing Multi-Layer Perceptrons (MLPs) [5], offer promising avenues for enhancing the robustness and accuracy of HAR systems. Addressing these challenges will be key to unlocking its full potential across various industries as the field evolves. MLPs offer a straightforward architecture with fully connected layers, making them relatively simple to design and implement. This flexibility is helpful in HAR when handling various types of sensor data from diverse sources [6–8]. HAR has witnessed significant advancements in recent years, driven by the increasing demand for intelligent systems that can understand and respond to human behavior. The motivation behind this research stems from the recognition of challenges inherent to HAR and the need for innovative solutions to enhance its effectiveness [9,10].
• Variability in Human Behavior: Human activities exhibit high variability due to individual differences, cultural nuances, and evolving behavioral patterns. This variability poses a challenge for HAR systems, which must be robust enough to adapt to diverse human behaviors.
• Ambient Conditions: HAR often takes place in dynamic and uncontrolled environments, where lighting conditions, noise, and other environmental factors can significantly impact the accuracy of activity recognition. Adapting to these changing conditions is a critical challenge for HAR systems.
• Real-Time Processing: Many applications of HAR, such as those in healthcare monitoring and security surveillance, require real-time processing to provide timely insights and responses. Achieving low-latency recognition while maintaining accuracy is a complex challenge [11,12].
• Limited Generalization: HAR models trained on specific datasets may struggle to generalize well to unseen scenarios or populations. The lack of generalization can limit the practical applicability of HAR systems across diverse contexts.
One key avenue for addressing the challenges in HAR is the exploration of effective feature fusion techniques. Feature fusion combines information from multiple sources or modalities to create a more comprehensive representation of human activities [13]. This approach addresses the technical gaps which have been identified in several ways:
• Improved Discrimination: Fusing features from multiple sources enhances HAR systems’ ability to differentiate subtle activity variations, thereby overcoming the limited discriminative power of single-feature models.
• Increased Robustness: Feature fusion mitigates sensor limitations by leveraging the strengths of multiple sensors, reducing the impact of noise and enhancing data coverage.
• Greater Adaptability: Fusion enables models to adapt to diverse activities and better capture human behavior variability, addressing the lack of adaptability in current systems.
• Enhanced Context Awareness: Combining features provides a deeper contextual understanding, improving accuracy in recognizing activities across different scenarios.
The primary motivation behind this study is to enhance the generalization capabilities of HAR models across diverse datasets and real-world settings. Current models often rely on single-source data, which limits their ability to adapt to different sensor placements and activity types. By integrating multiple data sources and employing feature fusion techniques, there is potential to create more robust and adaptable models that can handle the inherent variability in real-world scenarios. This approach aims to address the limitations of existing HAR systems, leading to improved accuracy and reliability in activity recognition tasks.
This study makes the following key contributions:
• Multisource Feature Fusion Methodology, which introduces a feature fusion approach that integrates data from multiple datasets (WISDM, MotionSense, DaLiAc, and PAMAP2) to create a comprehensive representation of human activities.
• Enhanced Model Robustness and Adaptability, which utilizes an MLP to effectively handle diverse activity patterns and domain shifts, improving the model’s ability to generalize across different environments.
• Comprehensive Evaluation Across Diverse Datasets, which can be used to conduct extensive experiments across multiple datasets to demonstrate the effectiveness of the proposed feature fusion approach in overcoming challenges such as sensor variability and class imbalance.
• Improved Accuracy and Generalization in HAR Systems, which help to achieve higher accuracy and generalization performance compared to existing single-source models, showcasing the benefits of integrating multiple data sources for HAR.
The remainder of this paper is structured as follows: Section 2 offers a detailed review of the relevant literature. Section 3 outlines the proposed methodology, explaining the approach in depth. Section 4 presents a critical analysis of the experimental results. Finally, Section 5 provides the conclusions and suggests avenues for future research.
2 Review of Human Activity Recognition
Recent advancements in HAR using wearable devices have showcased significant progress and innovation. Adaimi et al. have presented a comprehensive study on location-invariant and device-agnostic motion activity recognition, emphasizing the development of a robust dataset and models that maintain high accuracy across various sensor placements [14,15]. Mishra and Pal focused on energy-efficient HAR through a pruned CNN-GRU model that demonstrates high accuracy with low computational demands, making it suitable for lightweight devices [16]. Liu explored impedance sensing as a novel approach to HAR, aiming for efficient edge device implementation [17]. Hutabarat et al. introduced a feedforward neural network for HAR, achieving superior accuracy compared to traditional algorithms [18]. Finally, Gkountelos et al. have discussed compressing CNN models to reduce computational requirements while maintaining performance, crucial for resource-constrained wearable devices [19].
Transformers offer several advantages in HAR, including enhanced temporal modeling capabilities, flexibility in handling multi-modal data, and scalability, making them a promising option for complex activity recognition tasks. However, compared to traditional architectures such as CNNs, RNNs, LSTMs, and MLPs, they also present certain limitations [20]. These drawbacks include high computational and memory requirements, reduced interpretability, longer training times, and challenges in deploying them on resource-constrained devices. Additionally, Transformers are less effective in scenarios requiring incremental learning or adaptation to new data or activities, as they typically rely on large datasets for optimal performance. These challenges underscore the trade-offs between advanced Transformer-based models and traditional approaches in HAR [21].
Sensor-based HAR has become a prominent research area due to the growing availability of various sensors and their non-intrusive nature. According to Mario [22], wearable sensors like tri-axial accelerometers are particularly advantageous for HAR applications due to their ability to continuously record activities across different locations and contexts. The study highlights a novel method where a Convolutional Neural Network (CNN) is used to process acceleration data, transforming it into georeferenced coordinate systems for enhanced feature extraction. This approach demonstrated a significant improvement in activity recognition accuracy, outperforming traditional methods by approximately 8%. Parida et al. [23] proposed a hybrid approach integrating CNN with Long Short-Term Memory (LSTM) networks to address limitations in vision-based HAR techniques. While CNNs are effective in extracting spatial features, LSTMs capture temporal dynamics, leading to improved performance in long-term HAR applications. The integration of these models offers a comprehensive method for recognizing human activities by overcoming the drawbacks of traditional vision-based approaches. Machine learning, particularly deep learning, has significantly advanced HAR. Browne et al. [24] emphasize the efficiency of Temporal Convolutional Networks (TCNs) over LSTMs for HAR due to their faster training times and superior long-term dependency capture. Their study reveals that TCNs, when paired with Convolutional Auto-Encoders (CAE), achieve state-of-the-art results in fall detection and other applications within smart environments. The strength of 1D-CNN models lies in their ability to automatically extract hierarchical features from raw sensor data, outperforming traditional methods in accuracy and efficiency.
In contrast, MLP classifiers, particularly in the fusion stage, provide robust support by integrating features from multiple sensors, ensuring comprehensive activity detection. MLP classifiers are effective in the fusion stage of HAR as they integrate multiple sensor inputs to extract meaningful patterns. This approach is particularly beneficial in scenarios where data from various sources must be combined to improve recognition accuracy. Miskatul Jannat et al. highlights the use of MLPs in conjunction with CNN-based transfer learning models, demonstrating significant performance improvements in HAR tasks through effective data fusion [25].
The integration of data from various sources has been a focal point in recent HAR research. The fusion of spatial and temporal data using hybrid models like CNN-LSTM has shown promising results. Parida et al. introduced a hybrid approach combining CNN for spatial feature extraction and LSTM for temporal data learning, addressing the limitations of standalone models in real-world HAR applications. They discuss the limitations of vision-based techniques that fail to capture both spatial and temporal data adequately, leading to sub-optimal performance in real-world scenarios [23].
Data fusion in HAR offers several key benefits, as highlighted in multiple studies. Firstly, data fusion enhances the reliability and robustness of HAR systems by combining information from multiple sensors, such as IMU sensors, software-defined radios, radars, and wearable sensors, leading to more precise activity recognition [2,26,27]. Secondly, fusion techniques like multi-resolution time-frequency analysis and feature extraction methods like DWT and EMD help in identifying discriminative features and reducing dimensionality, improving classification accuracy significantly. Additionally, data fusion allows for the integration of complementary advantages of different sensors through hybrid models like CNNs and Recurrent Neural Networks (RNNs), resulting in more effective multi-modal fusion and better long-term information capture for improved performance in HAR systems [28].
Traditional models, including CNNs, primarily detect consistent and repetitive patterns within sensor data. This strength makes them particularly effective for bilateral activities, where movements tend to be regular and predictable. However, this reliance on regularity poses significant challenges when these models are applied to imbalanced activities that involve varying movements between the left and right sides of the body. For instance, activities such as downstairs and upstairs entail complex, non-repetitive motions that are not easily captured by traditional CNNs. Consequently, these models often exhibit lower accuracy and higher misclassification rates when classifying such activities. To address these challenges, hybrid models that combine MLPs with other deep learning techniques have emerged as a promising alternative. A notable example is the model proposed by Cengiz et al. [29], which leverages the strengths of MLPs in feature integration and combines them with other methods to enhance both performance and explainability in HAR. These hybrid models have shown improved capability in recognizing both simple and complex activities, providing a more robust solution compared to traditional CNN-based approaches.
Recent advancements in the field have further attempted to mitigate the limitations of traditional models. Mekruksavanich and Jitpattanakul, for example, introduced a deep residual network augmented with a Convolutional Block Attention Module (CBAM). This approach enhances the recognition of activities by focusing on critical features within the sensor data. The inclusion of CBAM allows the model to capture subtle differences in movement patterns often overlooked by conventional CNNs, improving classification accuracy, particularly for asymmetrical activities [30]. In addition, Bian et al. [31] conducted a comprehensive survey on state-of-the-art sensing techniques in HAR, identifying ongoing challenges in accurately capturing and classifying complex human movements. While advancements in sensing modalities and computational methods have bolstered the robustness of HAR systems, they have also highlighted the persistent need for more sophisticated models capable of handling the inherent variability in irregular activities.
This section is organized to provide a comprehensive background and context for the proposed study. Having reviewed the relevant literature and established the context for our study, we now proceed to Section 3, which details the proposed methodology. In this section, we outline our approach in depth, including the architecture, parameters, and data fusion strategies utilized to develop a robust and generalizable HAR model.
3.1 Description of the Datasets Used
In Table 1, we highlight the diverse datasets used in building a generalized model for predicting six primary activities in HAR using an MLP. The table details four distinct datasets: WISDM, MotionSense, DaLiAc, and PAMAP2, which include 36, 24, 19, and 9 subjects, respectively. These datasets feature different sensor positions, such as in pants pockets, on a belt, on the right wrist, and either wrist. They cover various activities, including walking, running, sitting, standing, and navigating stairs (upstairs and downstairs), offering a comprehensive foundation for developing a robust and adaptable model.
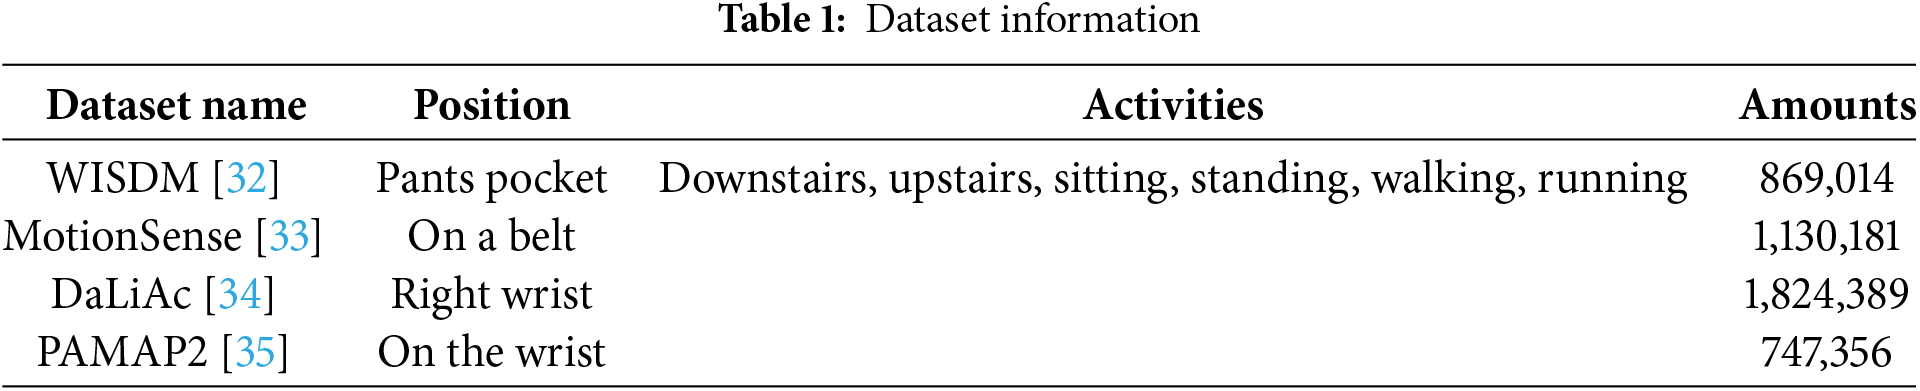
To create a generalized model that can predict only six core activities–downstairs, upstairs, walking, running, sitting, and standing—these datasets provide a diverse foundation. The variation in sensor placement and the large differences in sample sizes across the datasets, ranging from 747,356 to 1,824,389 data points, present unique challenges in data preprocessing, normalization, and feature extraction. These aspects must be carefully managed to ensure the model effectively learns with our data fusion model to generalize across the different datasets and sensor positions.
In this study, the data fusion approach is crucial, as it seeks to harmonize these varied inputs into a unified model that can accurately predict the six target activities. We employed an MLP as our base model due to its suitability for integrating diverse, feature-level inputs derived from multi-source data fusion within the HAR domain. Compared to more complex architectures (e.g., deep CNNs or RNNs), the MLP offers a straightforward means of assessing how fused features enhance performance without introducing additional complexities that could obscure the effects of data integration. This approach leverages the MLP capacity to handle high-dimensional, heterogeneous features, thereby facilitating robust recognition across all activities. To ensure that the chosen MLP architecture is both effective and robust, we conducted a systematic grid search with cross-validation to fine-tune key hyperparameters (e.g., the number of hidden layers, the number of neurons per layer, learning rate, and regularization parameters). Informed by established HAR literature and initial empirical trials, this procedure enabled us to rigorously evaluate multiple configurations against validation sets and to identify the combination yielding consistent generalization performance. Details of this procedure are provided in Algorithm 1.
The diagram in Fig. 1 illustrates a multisource data fusion process for human activity recognition using datasets from four different sources: WISDM, DaLiAc, PAMAP2, and MotionSense. Each dataset contains accelerometer readings across three axes (X, Y, Z). The data undergoes feature extraction to compute various metrics such as Mean, Median, Amplitude, and Signal Magnitude Area (SMA) for each dataset, which are then processed through a MLP model. The outputs of these MLP models are combined using a softmax function to predict the activity class (e.g., walking, running, sitting, standing). This approach aims to create a generalized model capable of classifying human activities across different datasets. This diagram illustrates the end-to-end workflow, from raw sensor data input to final activity prediction.
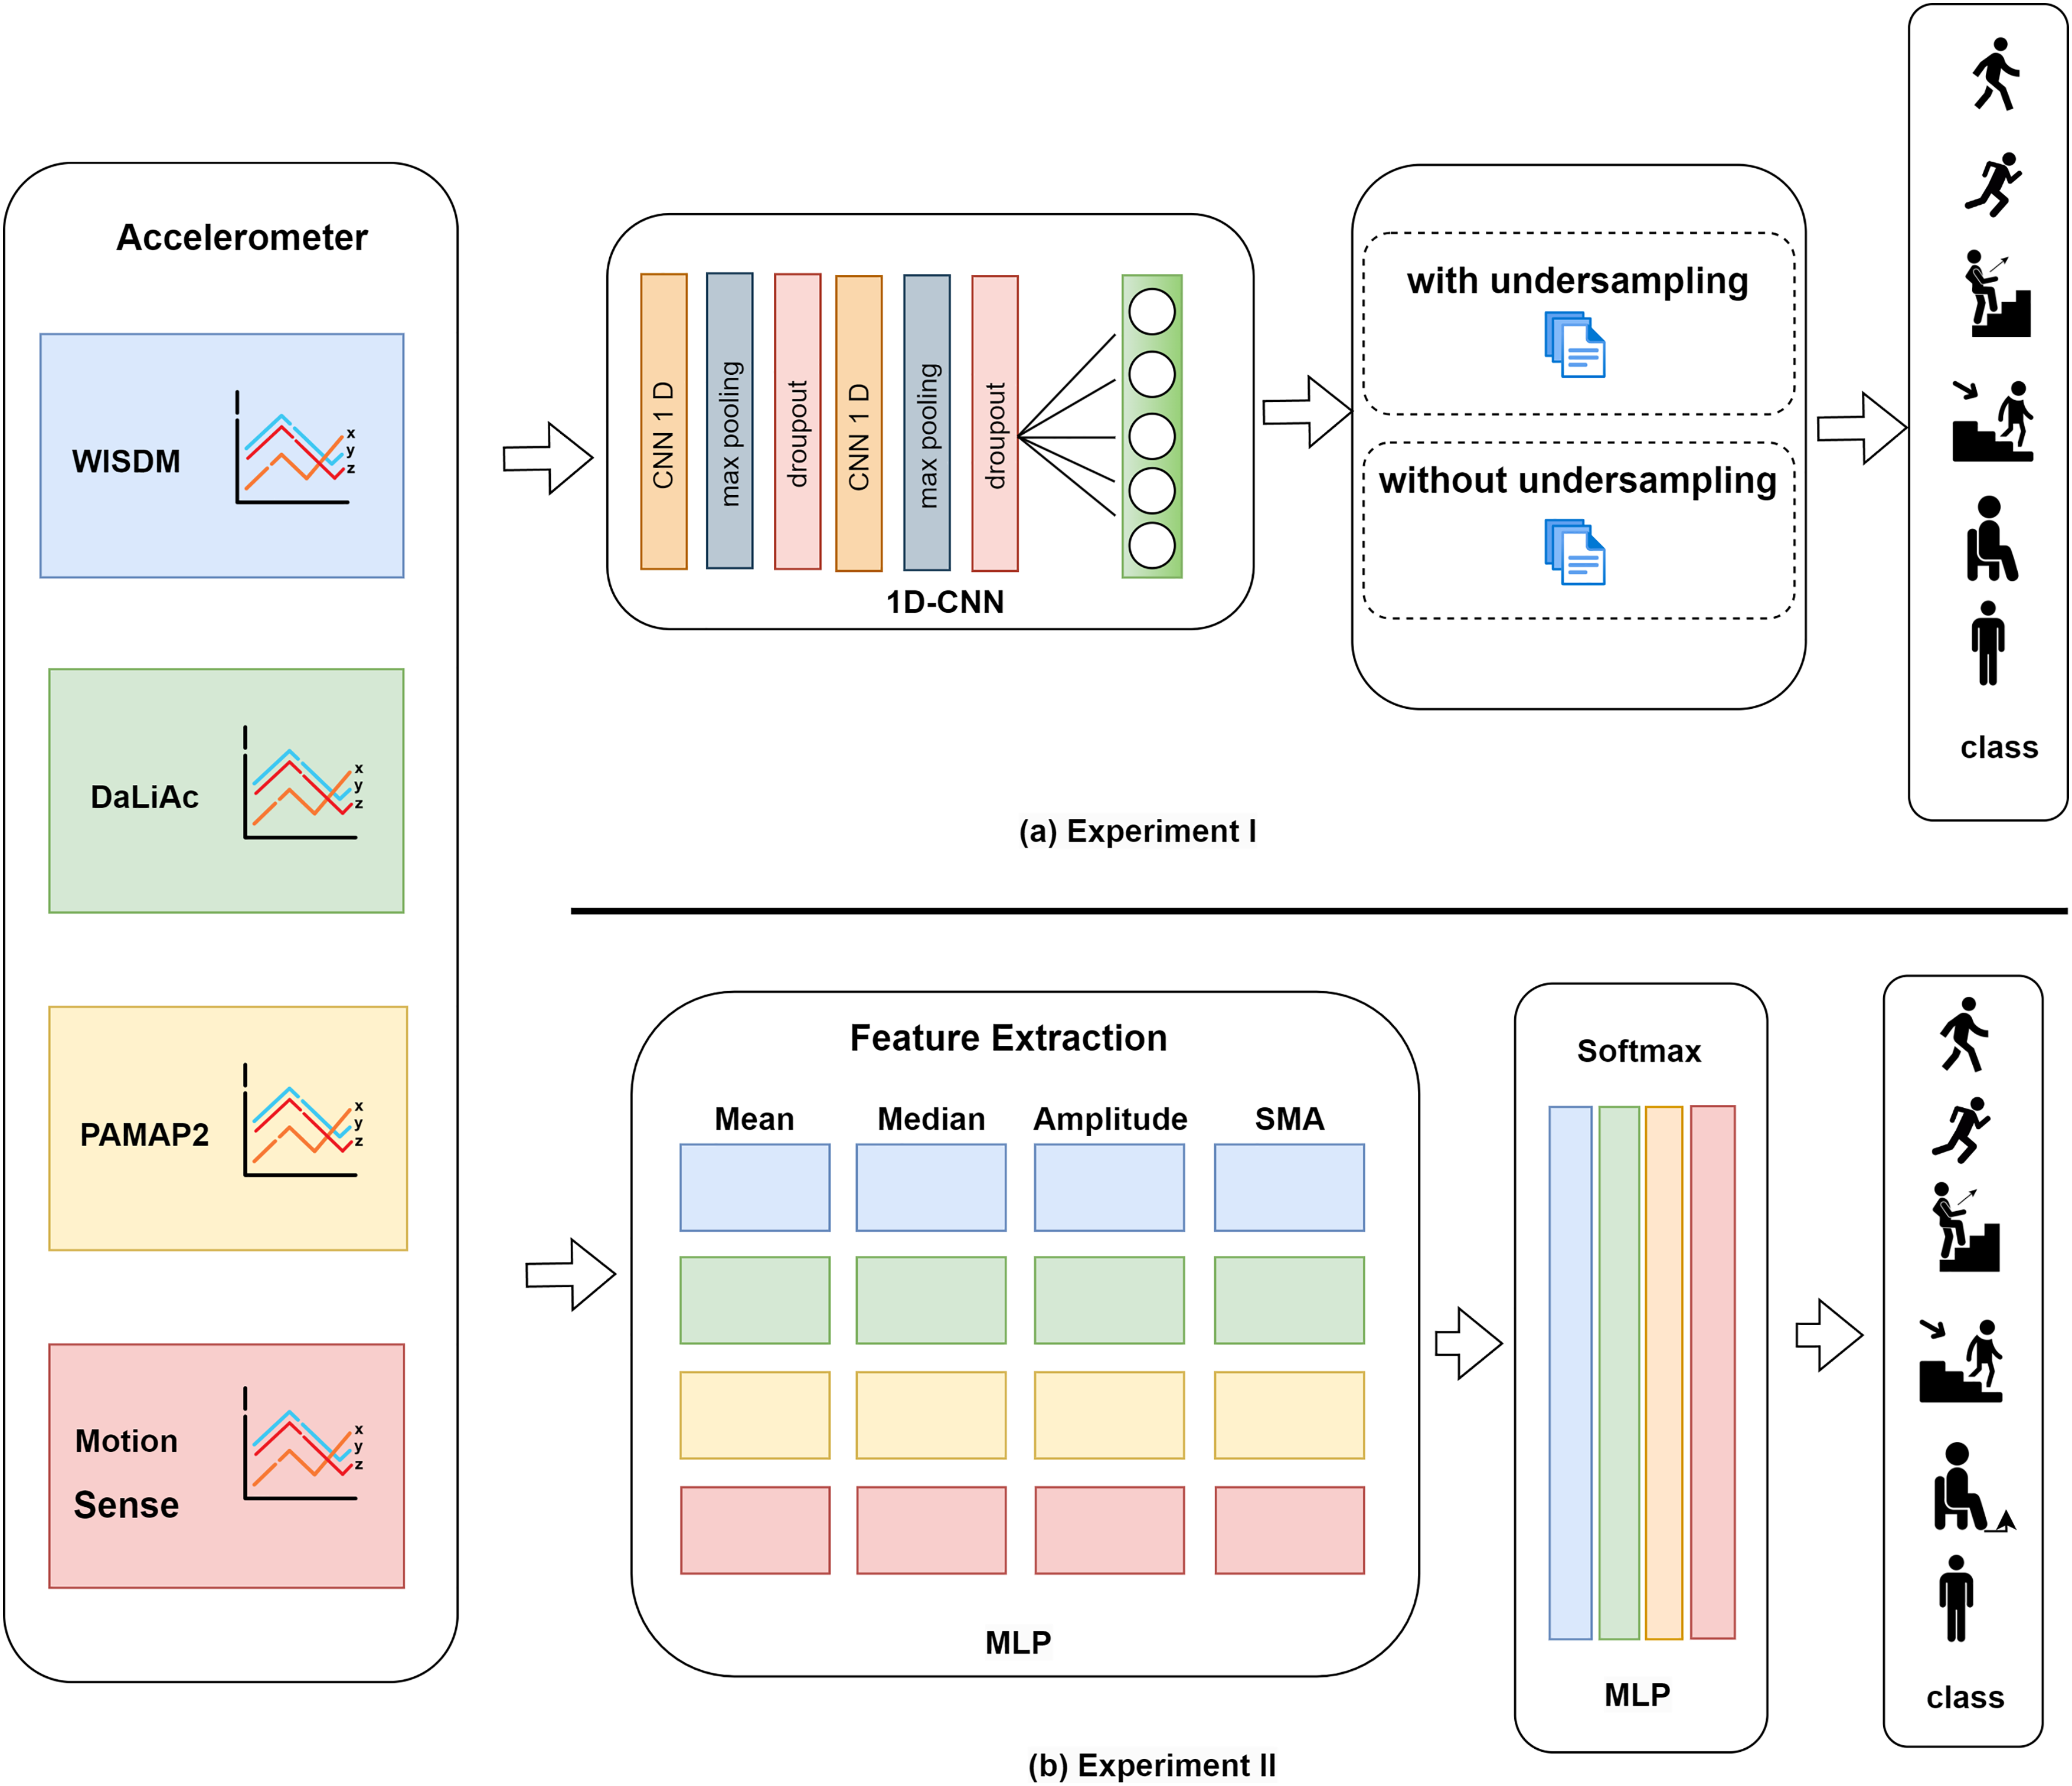
Figure 1: Architecture of the data fusion approach with 1D-CNN (a) Experiment I and MLP (b) Experiment II for activity classification
3.2 Explanation of the Sensor Sources
In analyzing human activities through accelerometer data, it is essential to identify and understand the different data sources, as variations in sensor placement, sampling rates, and device types can significantly impact the quality and interpretation of the collected data.
Accelerometer data is fundamental in understanding and analyzing human movements. Various datasets provide this data, each collected using different devices and methodologies. The following sections will present and analyze the histogram graphs for different activities, focusing on the insights they provide into the nature and variability of human movements as captured by these diverse sensor sources.
To compare the accelerometer data distributions for “walking” and “running” activities across the different datasets (WISDM, PAMAP2, Daliac, Motionsense), we will analyze the histograms for each axis (accX, accY, accZ) in Fig. 2. To conduct a detailed analysis of the “walking” activity in Fig. 2a for each axis across different datasets, we can structure the discussion into the following:
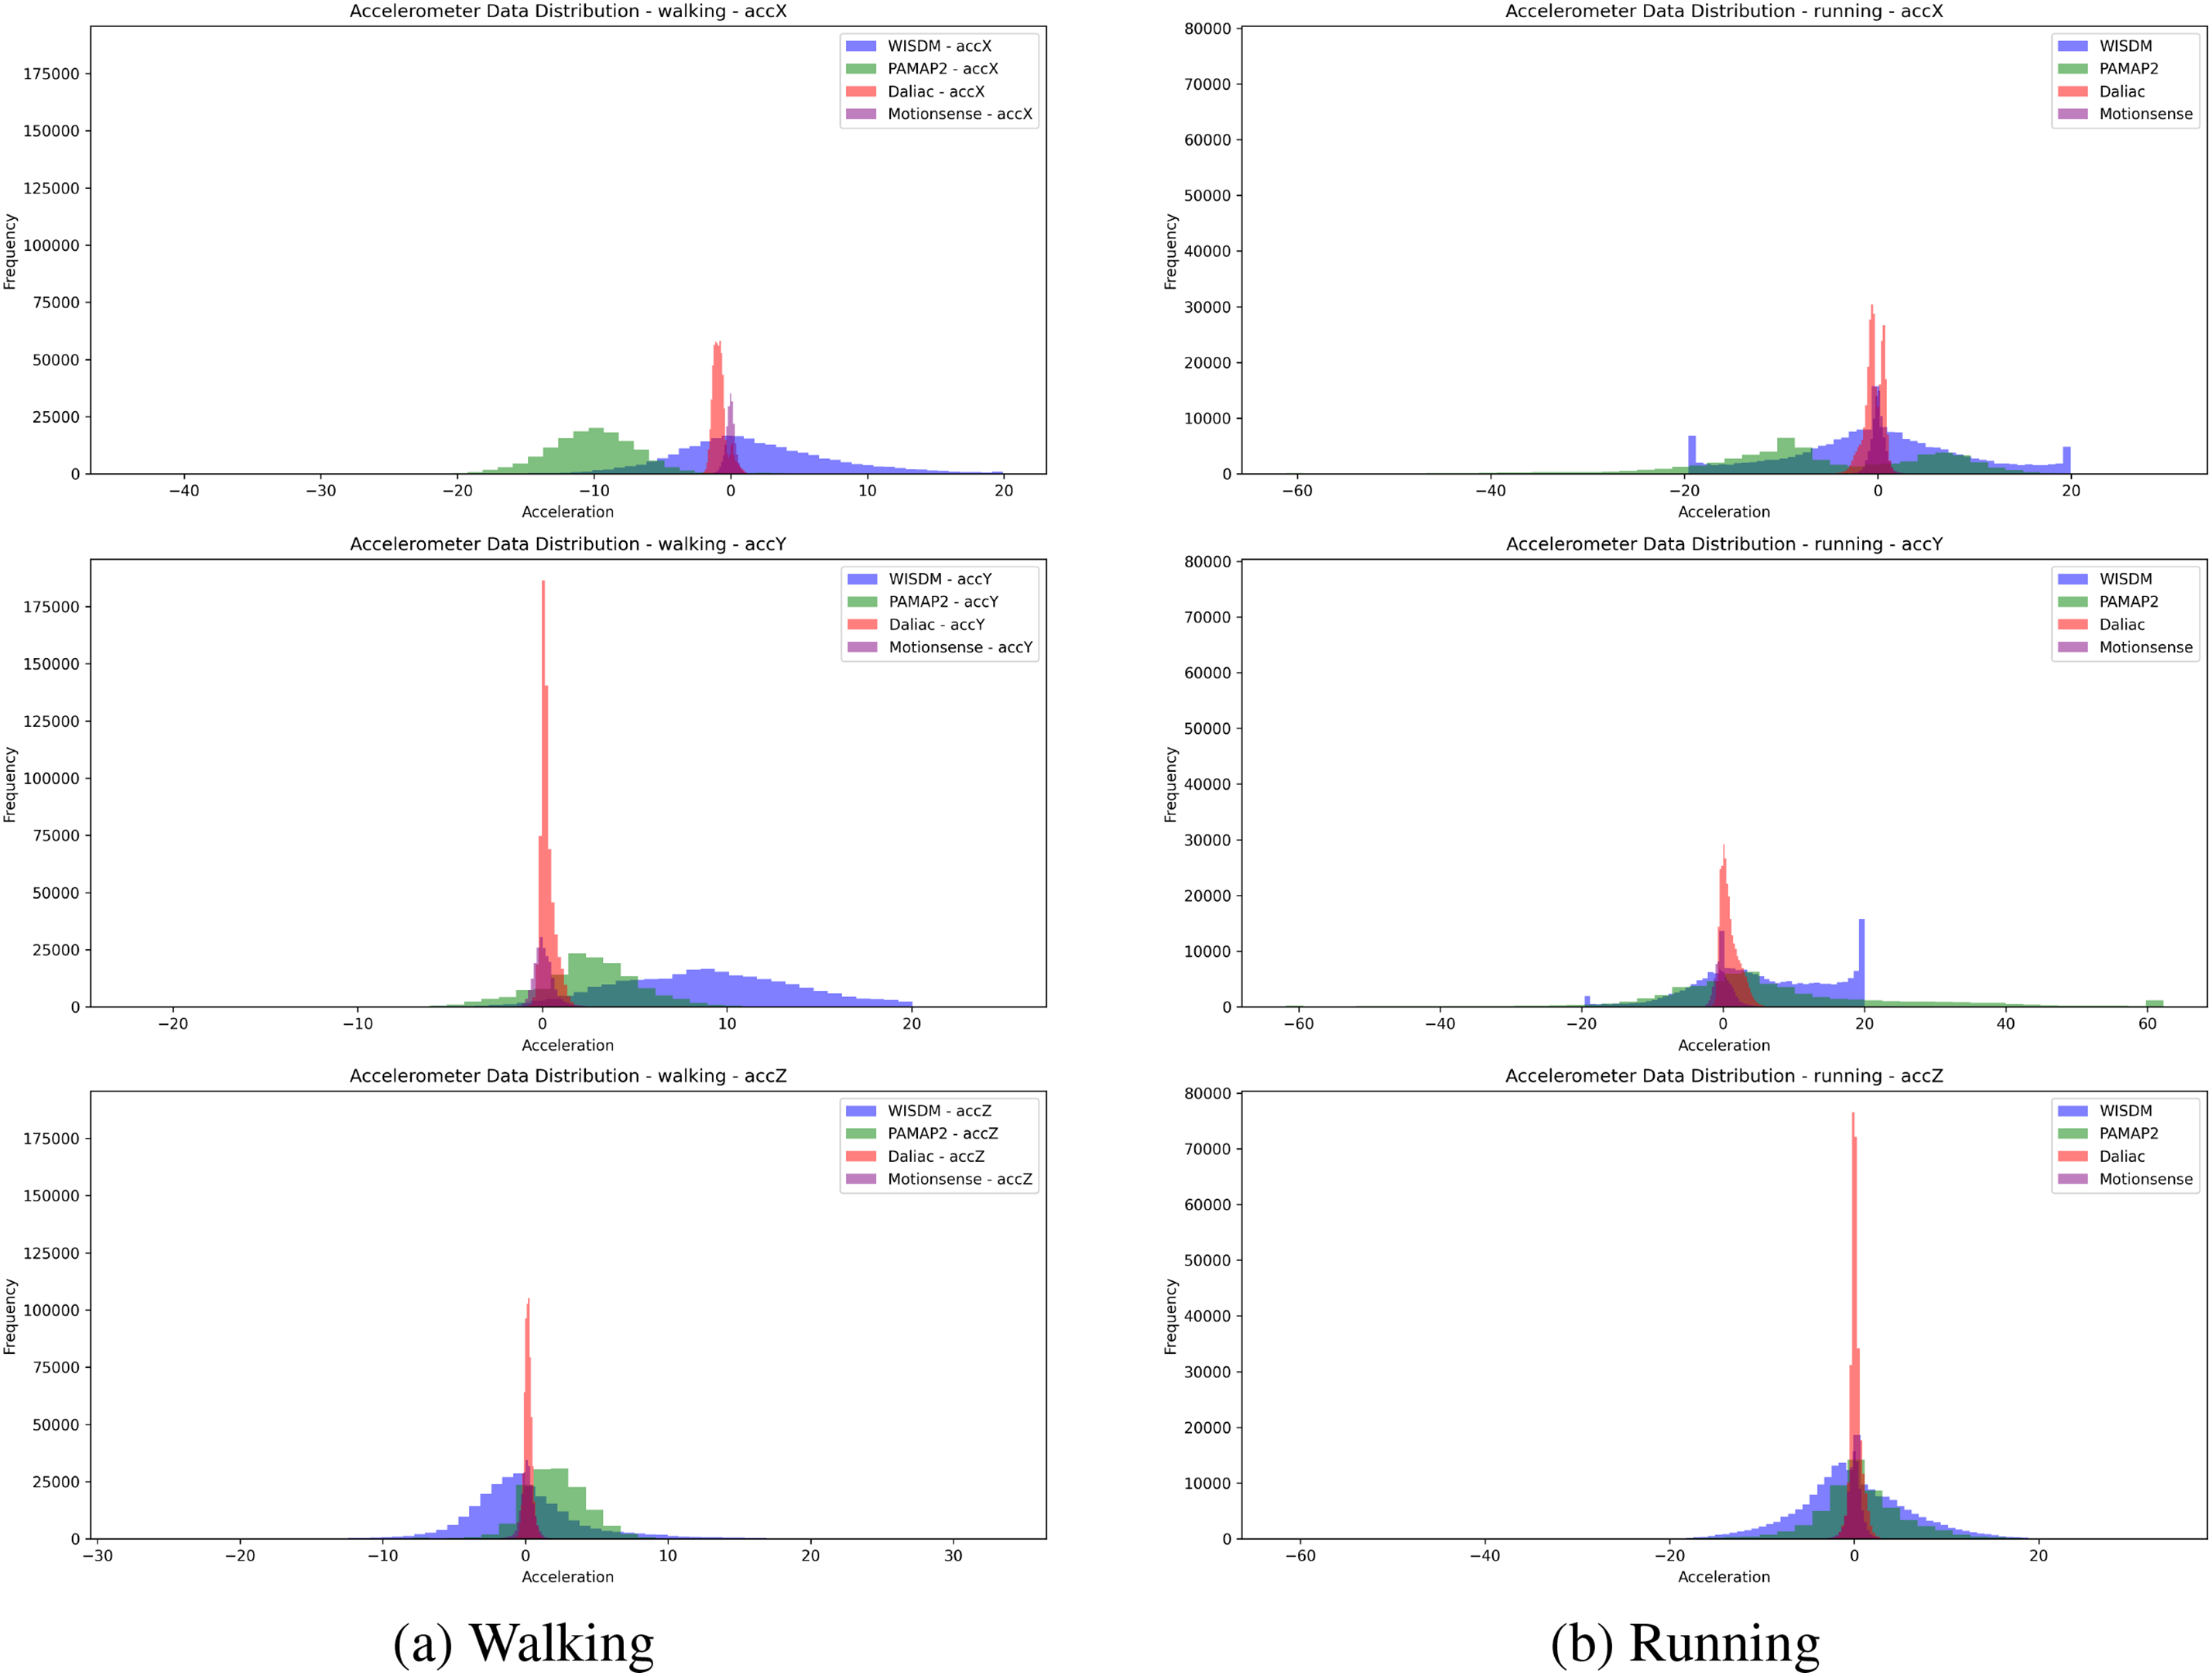
Figure 2: Distribution of walking (a) and running (b) activities from raw accelerometer data across four sources
For the accX Axis, which measures lateral movements, the WISDM dataset shows a moderate spread with peaks around zero, extending to positive and negative values, indicating general lateral movement. PAMAP2 exhibits a broader spread with multiple peaks, suggesting variability in lateral movement. Similarly, DaLiAc is moderately concentrated around zero but shows a noticeable spread, reflecting lateral shifts. Motionsense behaves similarly to DaLiAc, with a moderate spread around zero.
In the accY axis (forward and backward movements), WISDM also shows a moderate spread with peaks around zero, indicating forward and backward movement. PAMAP2, on the other hand, displays a wider spread with more pronounced peaks, suggesting more significant variability in this axis. DaLiAc is mainly concentrated around zero, with some spread indicating movement along the Y-axis, while Motionsense shares similar characteristics with DaLiAc, displaying moderate spread around zero.
For the accZ axis, which tracks vertical movements, the WISDM dataset reveals a moderate spread with peaks around zero. PAMAP2 has a wider spread, with peaks extending to positive values, indicating more variability in vertical movement. DaLiAc, though concentrated around zero, also displays a noticeable spread, and Motionsense exhibits behavior similar to DaLiAc, with a moderate spread around zero.
In summary, the distribution analysis between the “walking” and “running” activities in Fig. 2 highlights the key patterns and differences in their respective data distributions, which can be categorized into three main points as follows:
Variability: Walking displays moderate variability across all datasets, with noticeable but moderate spreads in the accX, accY, and accZ axes. Running shows significant variability, with wider spreads and higher peaks, indicating more intense movements.
Peak Distributions: In Walking, peaks are generally centered around zero with moderate spreads, reflecting the regular and repetitive nature of the movement. For Running, peaks remain centered around zero but have much wider spreads, indicating higher intensity and variability.
Axis Differences: accX (Lateral Movements): Both walking and running show spreads, but running exhibits significantly wider spreads, indicating greater lateral movement.
accY (Forward/Backward Movements): Patterns are similar to accX, with running showing higher variability and intensity.
accZ (Vertical Movements): Walking shows moderate vertical movements, while running exhibits significant vertical movement, reflecting the bouncing motion inherent in running.
The key differences between walking and running activities are the intensity and variability of the movements. Walking shows moderate and consistent movements across all three axes, while running exhibits significantly higher variability and intensity. The accelerometer data for running have much wider spreads and higher peaks, indicating more vigorous and varied movements. This is consistent across all datasets (WISDM, PAMAP2, Daliac, Motionsense), highlighting the fundamental differences in the dynamics of these two activities. To compare the accelerometer data distributions for the “sitting” and “standing” activities across the different datasets (WISDM, PAMAP2, Daliac, Motionsense) in Fig. 3, we analyzed the histograms for each axis (accX, accY, accZ). For the “standing” activity in Fig. 3a:
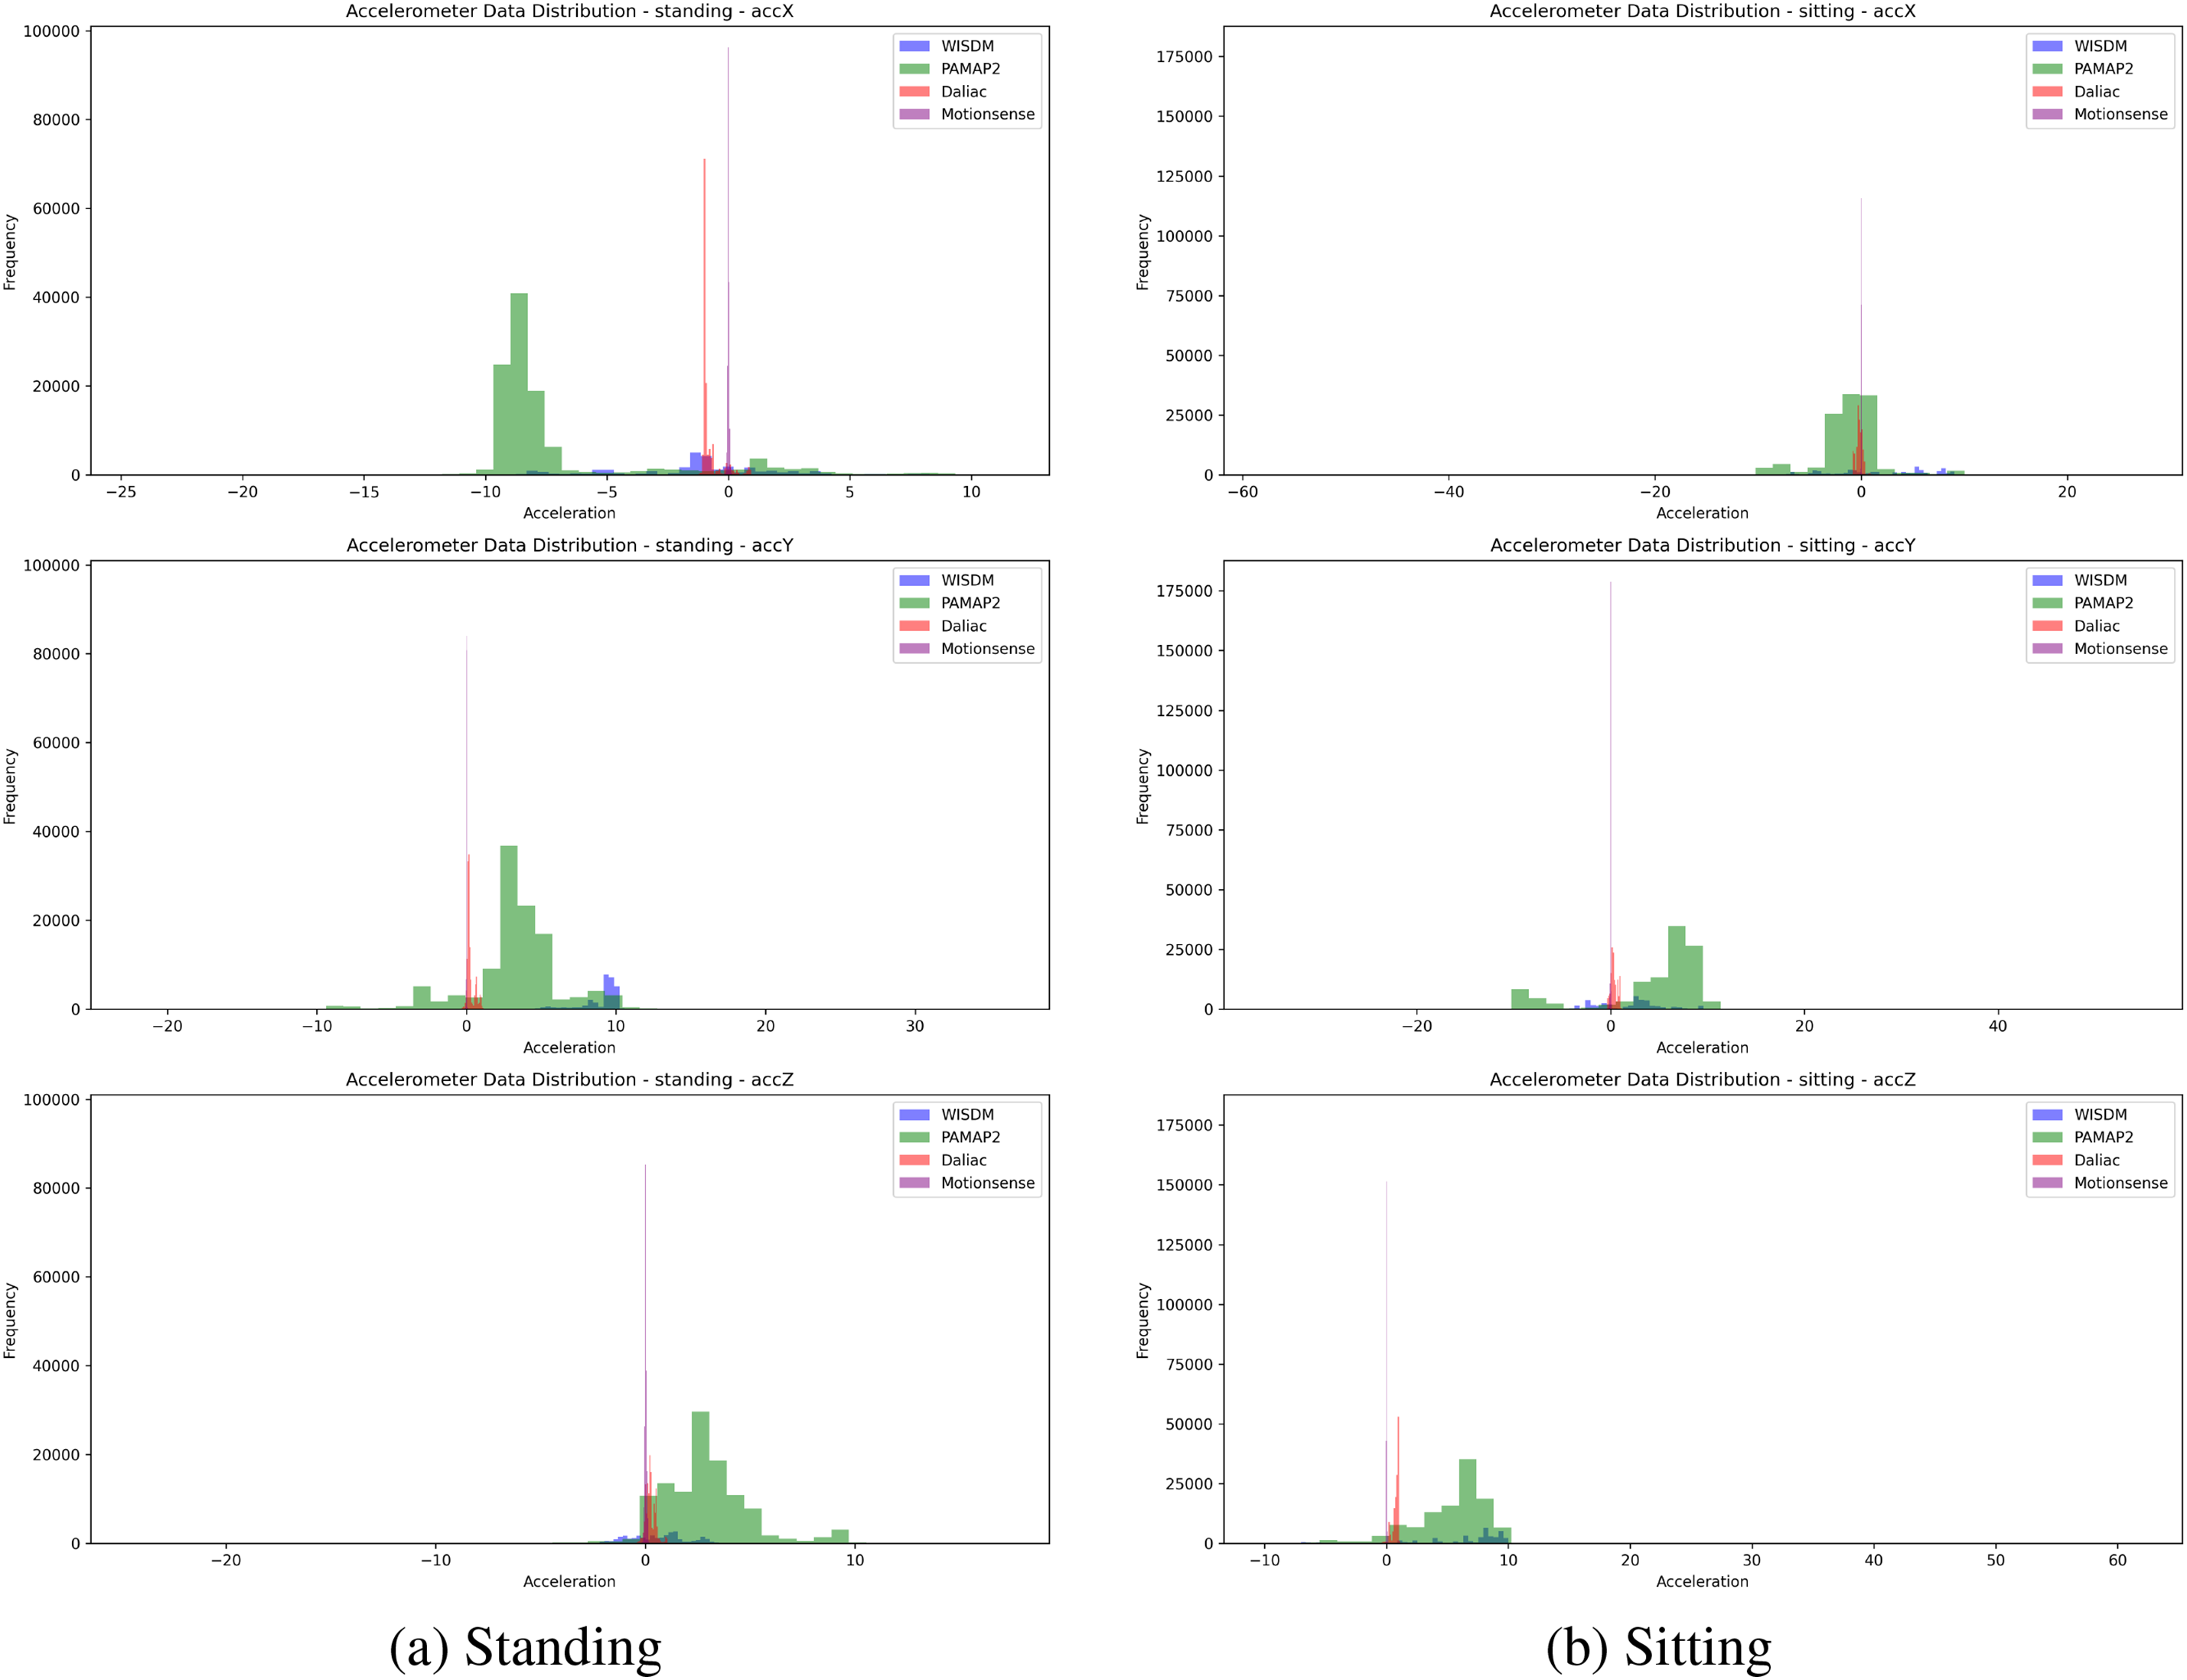
Figure 3: Distribution of standing (a) and sitting (b) activities from raw accelerometer data across four sources
For the accX axis, WISDM shows a narrow distribution with peaks centered around zero, indicating minimal lateral accelerations. PAMAP2, however, exhibits a wider spread with peaks around zero that extend to negative values, suggesting some variability in lateral movement. DaLiAc is highly concentrated around zero, reflecting very little lateral movement, a pattern that is similarly observed in the Motionsense dataset, which also shows a narrow distribution around zero.
Regarding the accY axis, WISDM shows a narrow distribution with peaks around zero, extending slightly to both positive and negative values. PAMAP2 demonstrates a wider spread, with peaks around zero extending more clearly to both positive and negative sides, indicating greater variability. DaLiAc is again highly concentrated around zero, suggesting minimal forward or backward movement, and Motionsense follows this pattern, with a narrow spread around zero.
For the accZ axis, WISDM shows a narrow distribution with peaks around zero, indicating minimal vertical accelerations. PAMAP2 displays a wider spread, with peaks around zero extending slightly to positive values, indicating more variability in vertical movement. Both DaLiAc and Motionsense show highly concentrated distributions around zero, indicating limited vertical movement.
To summarize the distribution analysis between the “standing” and “sitting” activities, three key points are highlighted as follows:
Variability: Both “sitting” and “standing” activities show minimal variability across all datasets, reflecting low movement levels. WISDM and PAMAP2 show slightly more spread than DaLiAc and Motionsense, suggesting minor movements during these activities.
Peak Distributions: For both “sitting” and “standing,” peaks are close to zero across all axes, indicating minimal accelerations. PAMAP2 displays a slightly wider spread, suggesting more variability in recorded accelerations.
Axis Differences: The accX, accY, and accZ axes for both activities show narrow distributions, highlighting the low movement involved. The accZ axis remains particularly stable, indicating negligible vertical movements for both sitting and standing.
The key takeaway is that both “sitting” and “standing” activities are characterized by minimal accelerations across all axes and datasets, with the Daliac and Motionsense datasets showing particularly narrow distributions around zero. This indicates that there is very little movement associated with these activities, as expected. The WISDM and PAMAP2 datasets show slightly more spread, suggesting minor movements, but overall, the accelerations remain low for both sitting and standing.
To compare the accelerometer data distributions for the “downstairs” and “upstairs” activities across the different datasets (WISDM, PAMAP2, Daliac, Motionsense), we analyzed the histograms for each axis (accX, accY, accZ) in Fig. 4. For the “upstairs” activity in Fig. 4a:
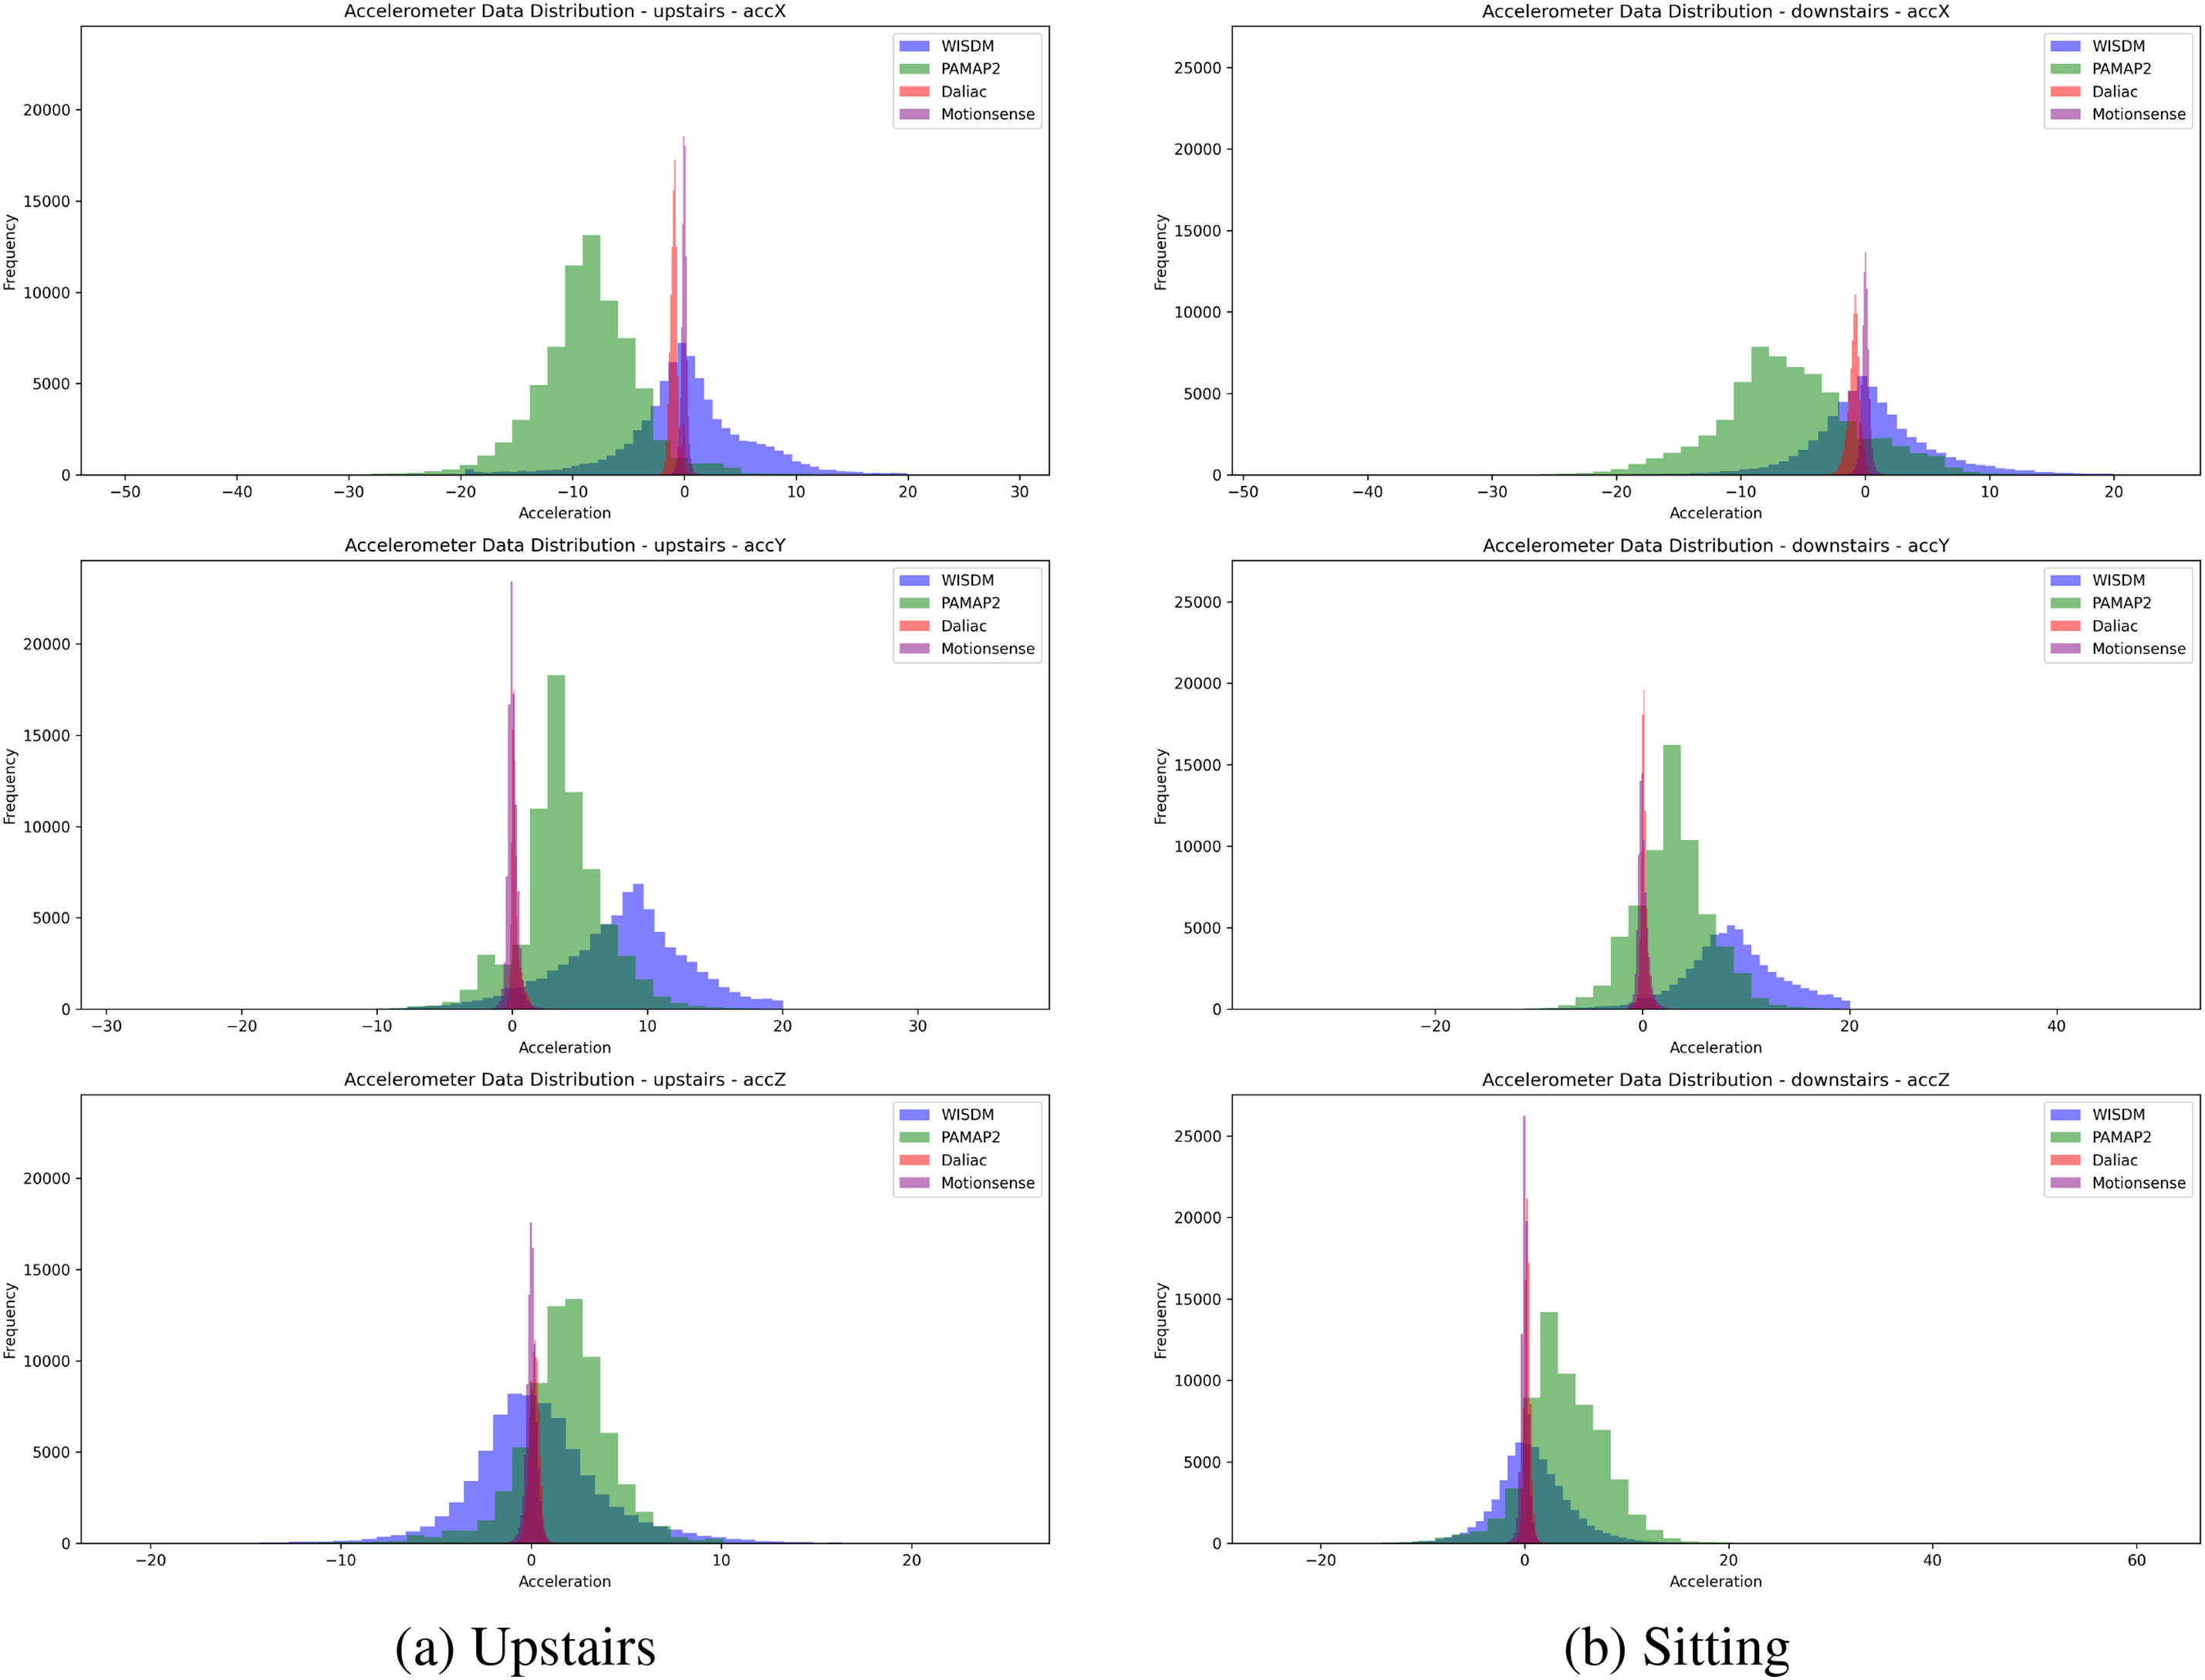
Figure 4: Distribution of upstairs (a) and downstairs (b) activities from raw accelerometer data across four sources
For the accX axis, the WISDM dataset shows a wide distribution with a peak around −10, suggesting varied acceleration experiences during the upstairs activity. PAMAP2 exhibits a broad spread with a peak around −10, extending into positive values, indicating upward movement. In contrast, DaLiAc presents a more concentrated distribution around zero, suggesting less variance in lateral movement, while Motionsense displays a wider spread than DaLiAc, with peaks closer to zero.
For the accY axis, WISDM demonstrates a broader distribution with significant data centered around zero. PAMAP2 also has a wide distribution but with more data points leaning toward the negative side. DaLiAc is highly concentrated around zero, indicating minimal variability in forward and backward movements, whereas Motionsense shows a narrower spread compared to WISDM and PAMAP2.
Regarding the accZ axis, WISDM’s distribution resembles its patterns in accX and accY, with peaks around zero. PAMAP2 displays a wider spread with peaks near zero, extending to higher values. DaLiAc, like in the other axes, is concentrated around zero, and Motionsense mirrors DaLiAc, with peaks also centered around zero.
To summarize the distribution analysis between the “upstairs” and “downstairs” activities, three key points are presented as follows:.
Variability: Both “downstairs” and “upstairs” activities exhibit significant variability in the WISDM and PAMAP2 datasets, indicating pronounced accelerations. In contrast, the DaLiAc and Motionsense datasets show less variability for both activities.
Peak Distributions: For “downstairs,” peaks are closer to zero across all axes, suggesting smaller accelerations during descent. For “upstairs,” the peaks shift slightly, particularly in the PAMAP2 dataset, indicating higher accelerations due to the increased climbing effort.
Axis Differences: The accX and accY axes for “upstairs” display more spread compared to “downstairs,” reflecting the varied movements and effort involved in ascending stairs. The accZ axis remains more stable with less spread in both activities, indicating less variability in vertical movements.
The key takeaway is that the “upstairs” activity generally shows higher and more varied accelerations compared to the “downstairs” activity, especially in the WISDM and PAMAP2 datasets. This is likely due to the increased effort required to move upward compared to downward movement. The Daliac and Motionsense datasets are more concentrated around zero, indicating less sensitivity or variability in recorded accelerations for both activities.
Feature extraction is critical in data preprocessing, particularly in machine learning and data analysis tasks. It plays an essential role for several reasons:
• Dimensionality Reduction: Datasets often contain a large number of features, leading to the curse of dimensionality. Feature extraction techniques help reduce the number of features while preserving the most important information, thereby simplifying the model and enhancing its performance.
• Improved Model Performance: Extracting relevant features provides the model with more meaningful and discriminative information, leading to better generalization and predictive performance.
• Noise Reduction: Feature extraction techniques can filter out noisy or irrelevant information from the dataset, improving the signal-to-noise ratio and making the model more robust.
• Interpretability: Extracted features are often more interpretable than raw data, facilitating a better understanding of the relationships between variables and the underlying patterns in the data.
• Computational Efficiency: Using fewer, more informative features significantly reduces the computational resources required for model training and inference.
In HAR, feature extraction plays a critical role by transforming raw sensor data into a structured format that enhances its suitability for analysis and modeling. This process enables more accurate identification of relevant patterns, leading to improved model performance and more reliable insights into human activities.
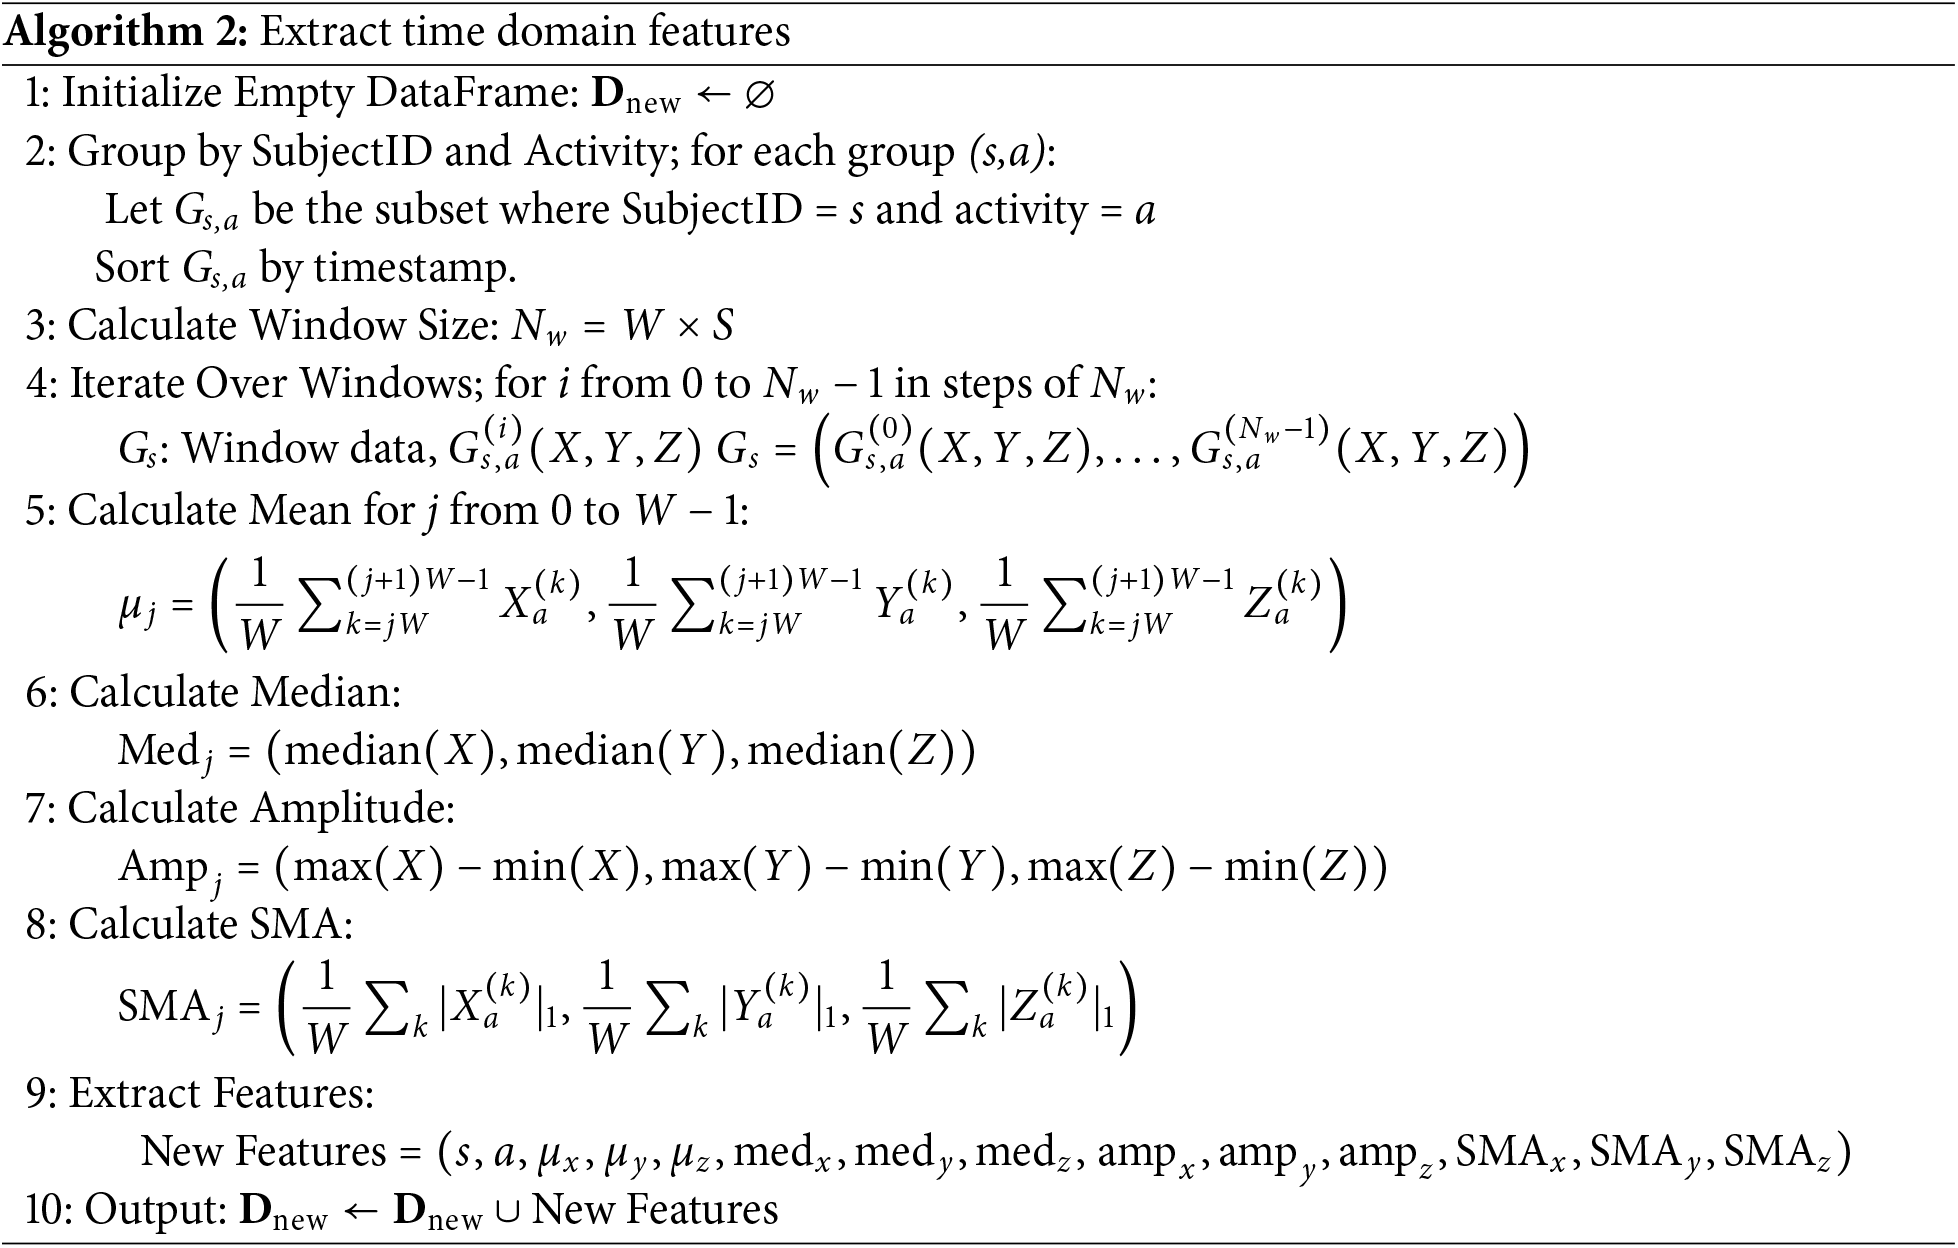
Accelerometer signals from the X, Y, and Z axes are segmented into 10-s windows at a sampling rate of 20 Hz, yielding 200 data points per window. We then computed statistical features for each axis based on these 200 points. The original sampling rates differ among the datasets—20 Hz for WISDM, 100 Hz for PAMAP2, 50 Hz for MotionSense, and 200 Hz for DaLiAc–reflecting the variety of data resolutions commonly encountered in human activity recognition research. The accelerometer readings for each dataset are processed at their native sampling rate. Applying a uniform feature extraction process across all datasets ensures that the resulting features are directly comparable and can be effectively combined after training the MLP model. By integrating these diverse data sources, the resulting fused representation captures a wider range of conditions and participant characteristics. This unified feature vector is then input into a multi-layer perceptron (MLP), allowing the model to learn complex, non-linear relationships across datasets and ultimately enhancing the robustness and accuracy of activity classification. Let N be the total number of data points, let
Calculating the statistics of a feature provides a measure of its central tendency, offering valuable insights into the average behavior of the data. The median is another measure of central tendency, but it is less sensitive to outliers than the mean. This makes it particularly useful for analyzing skewed distributions or datasets that contain outliers. In Eq. (2),
Amplitude in Eq. (3), typically quantified as the range of a feature, provides an indication of the variability or dispersion within the data. Calculating the range of acceleration values along each axis in accelerometer data is essential for understanding the intensity and magnitude of the observed movements. This analysis provides valuable insights into the dynamics of human activities.
The max function determines the maximum value within the current window for each axis, while the min function determines the minimum value within the same window for each axis. The difference between these maximum and minimum values for each axis represents the amplitude, or range, within the window.
Signal Magnitude Area (SMA) measures the overall magnitude of a signal. It is calculated by summing the absolute values of the signal over a specified time window and then dividing by the window length. SMA effectively captures the overall intensity or energy of the signal, which can be beneficial for applications such as activity recognition as in Eq. (4).
The absolute value function ensures that negative and positive values contribute equally to the sum. The numerator aggregates the absolute acceleration values for each axis within the window. The denominator
Let features_extraction
The calculation of window size in rows, determined as
3.5 Description of the Feature Fusion Process
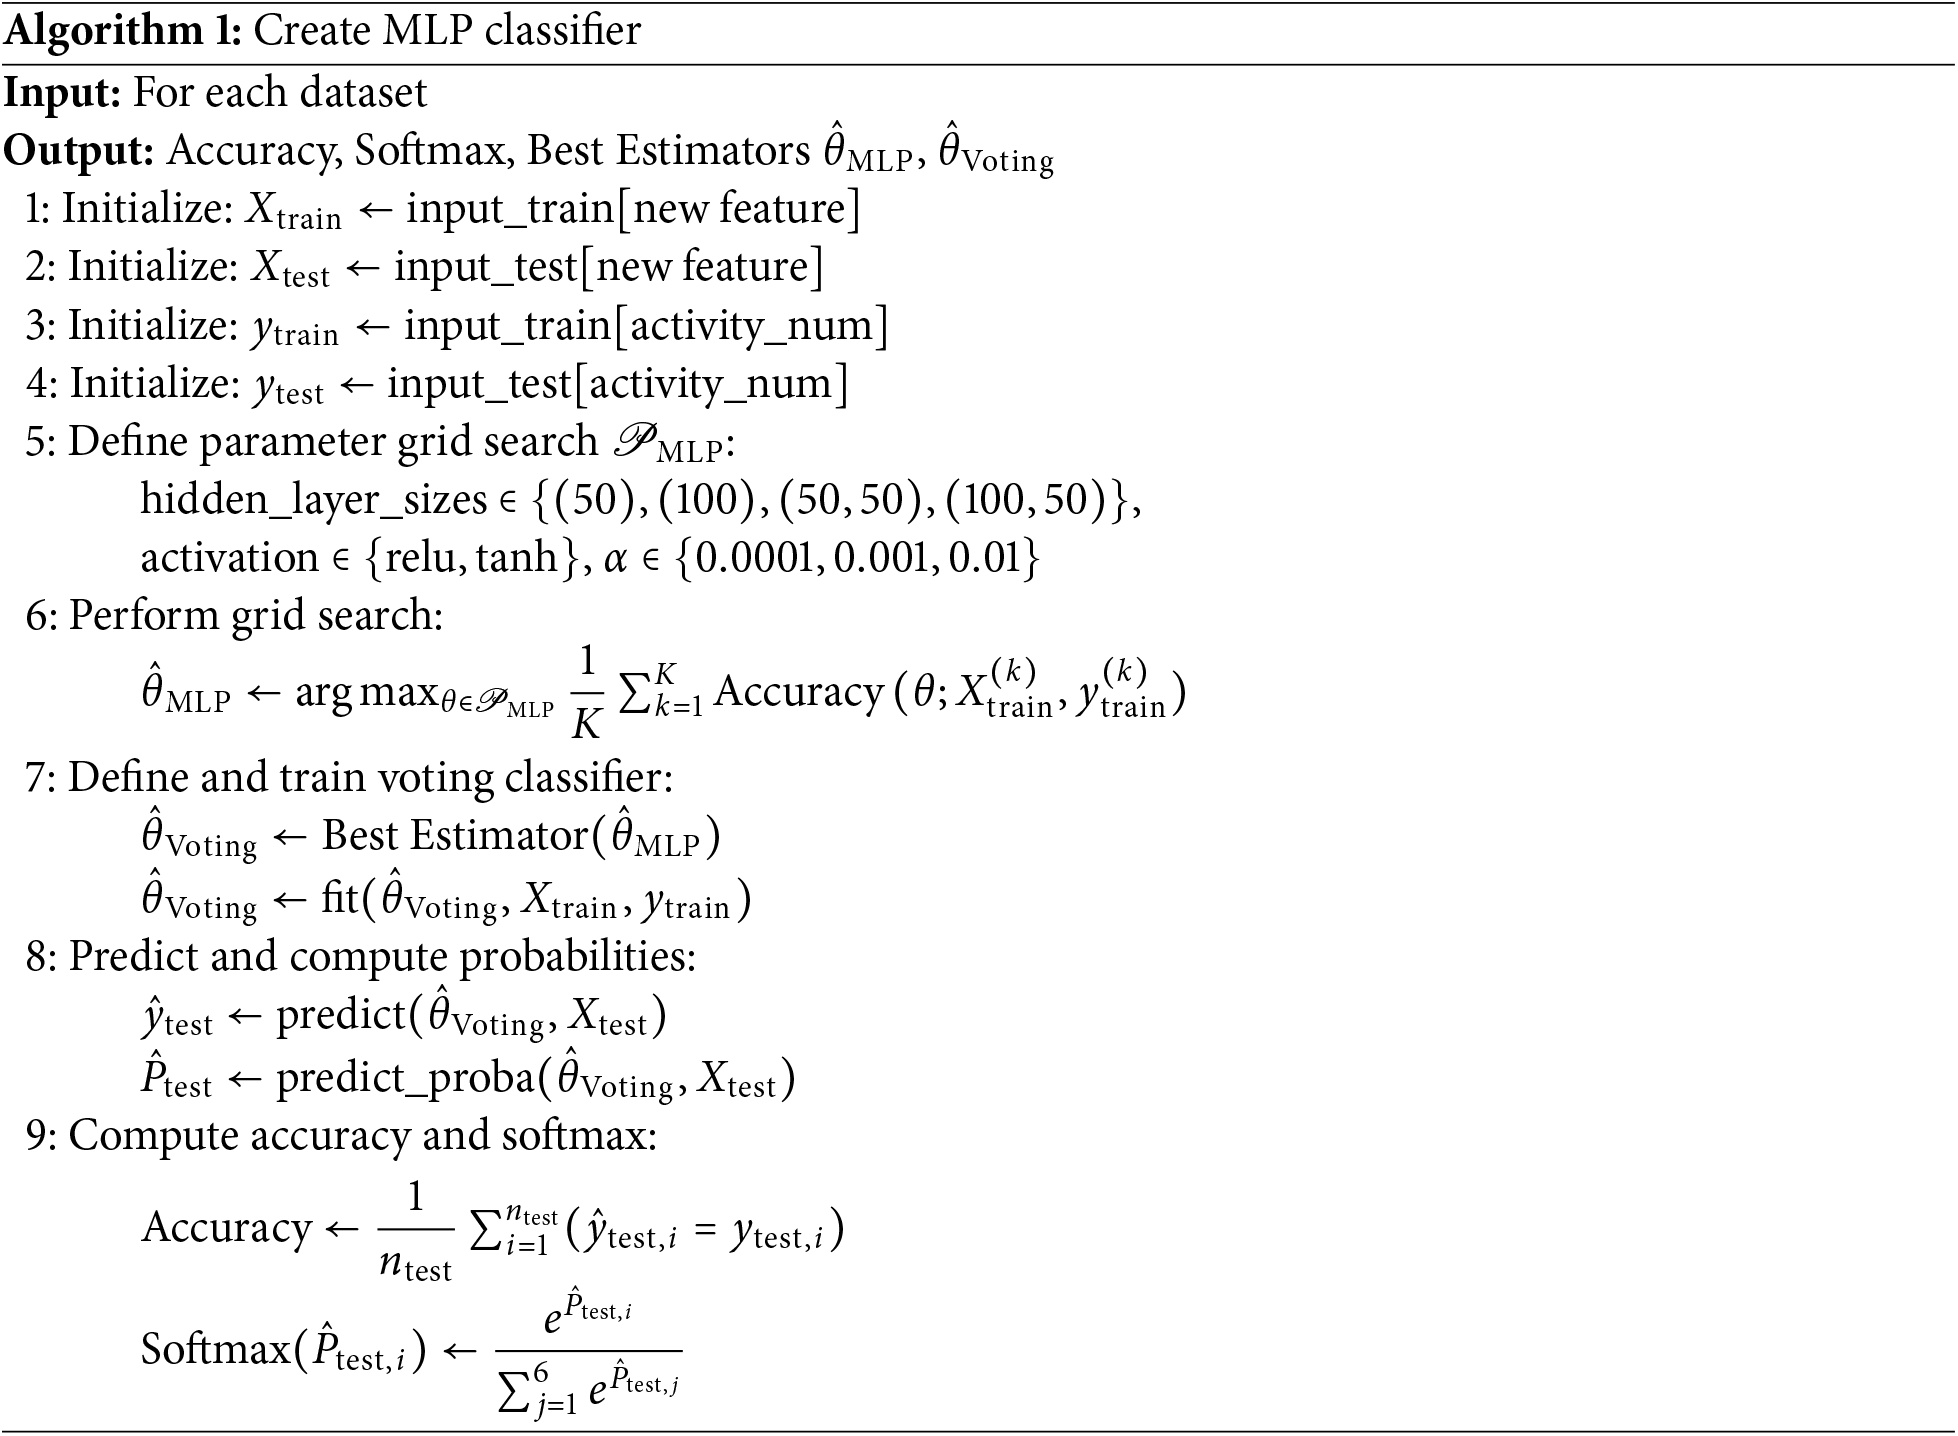
The algorithm create_mlp_classifiers in Algorithm 1 is designed to train an MLP classifier using grid search for hyperparameter optimization. The best models are then combined into a voting classifier, which is used for making predictions and evaluating performance. This process involves several key steps and variables explained in Table 2.
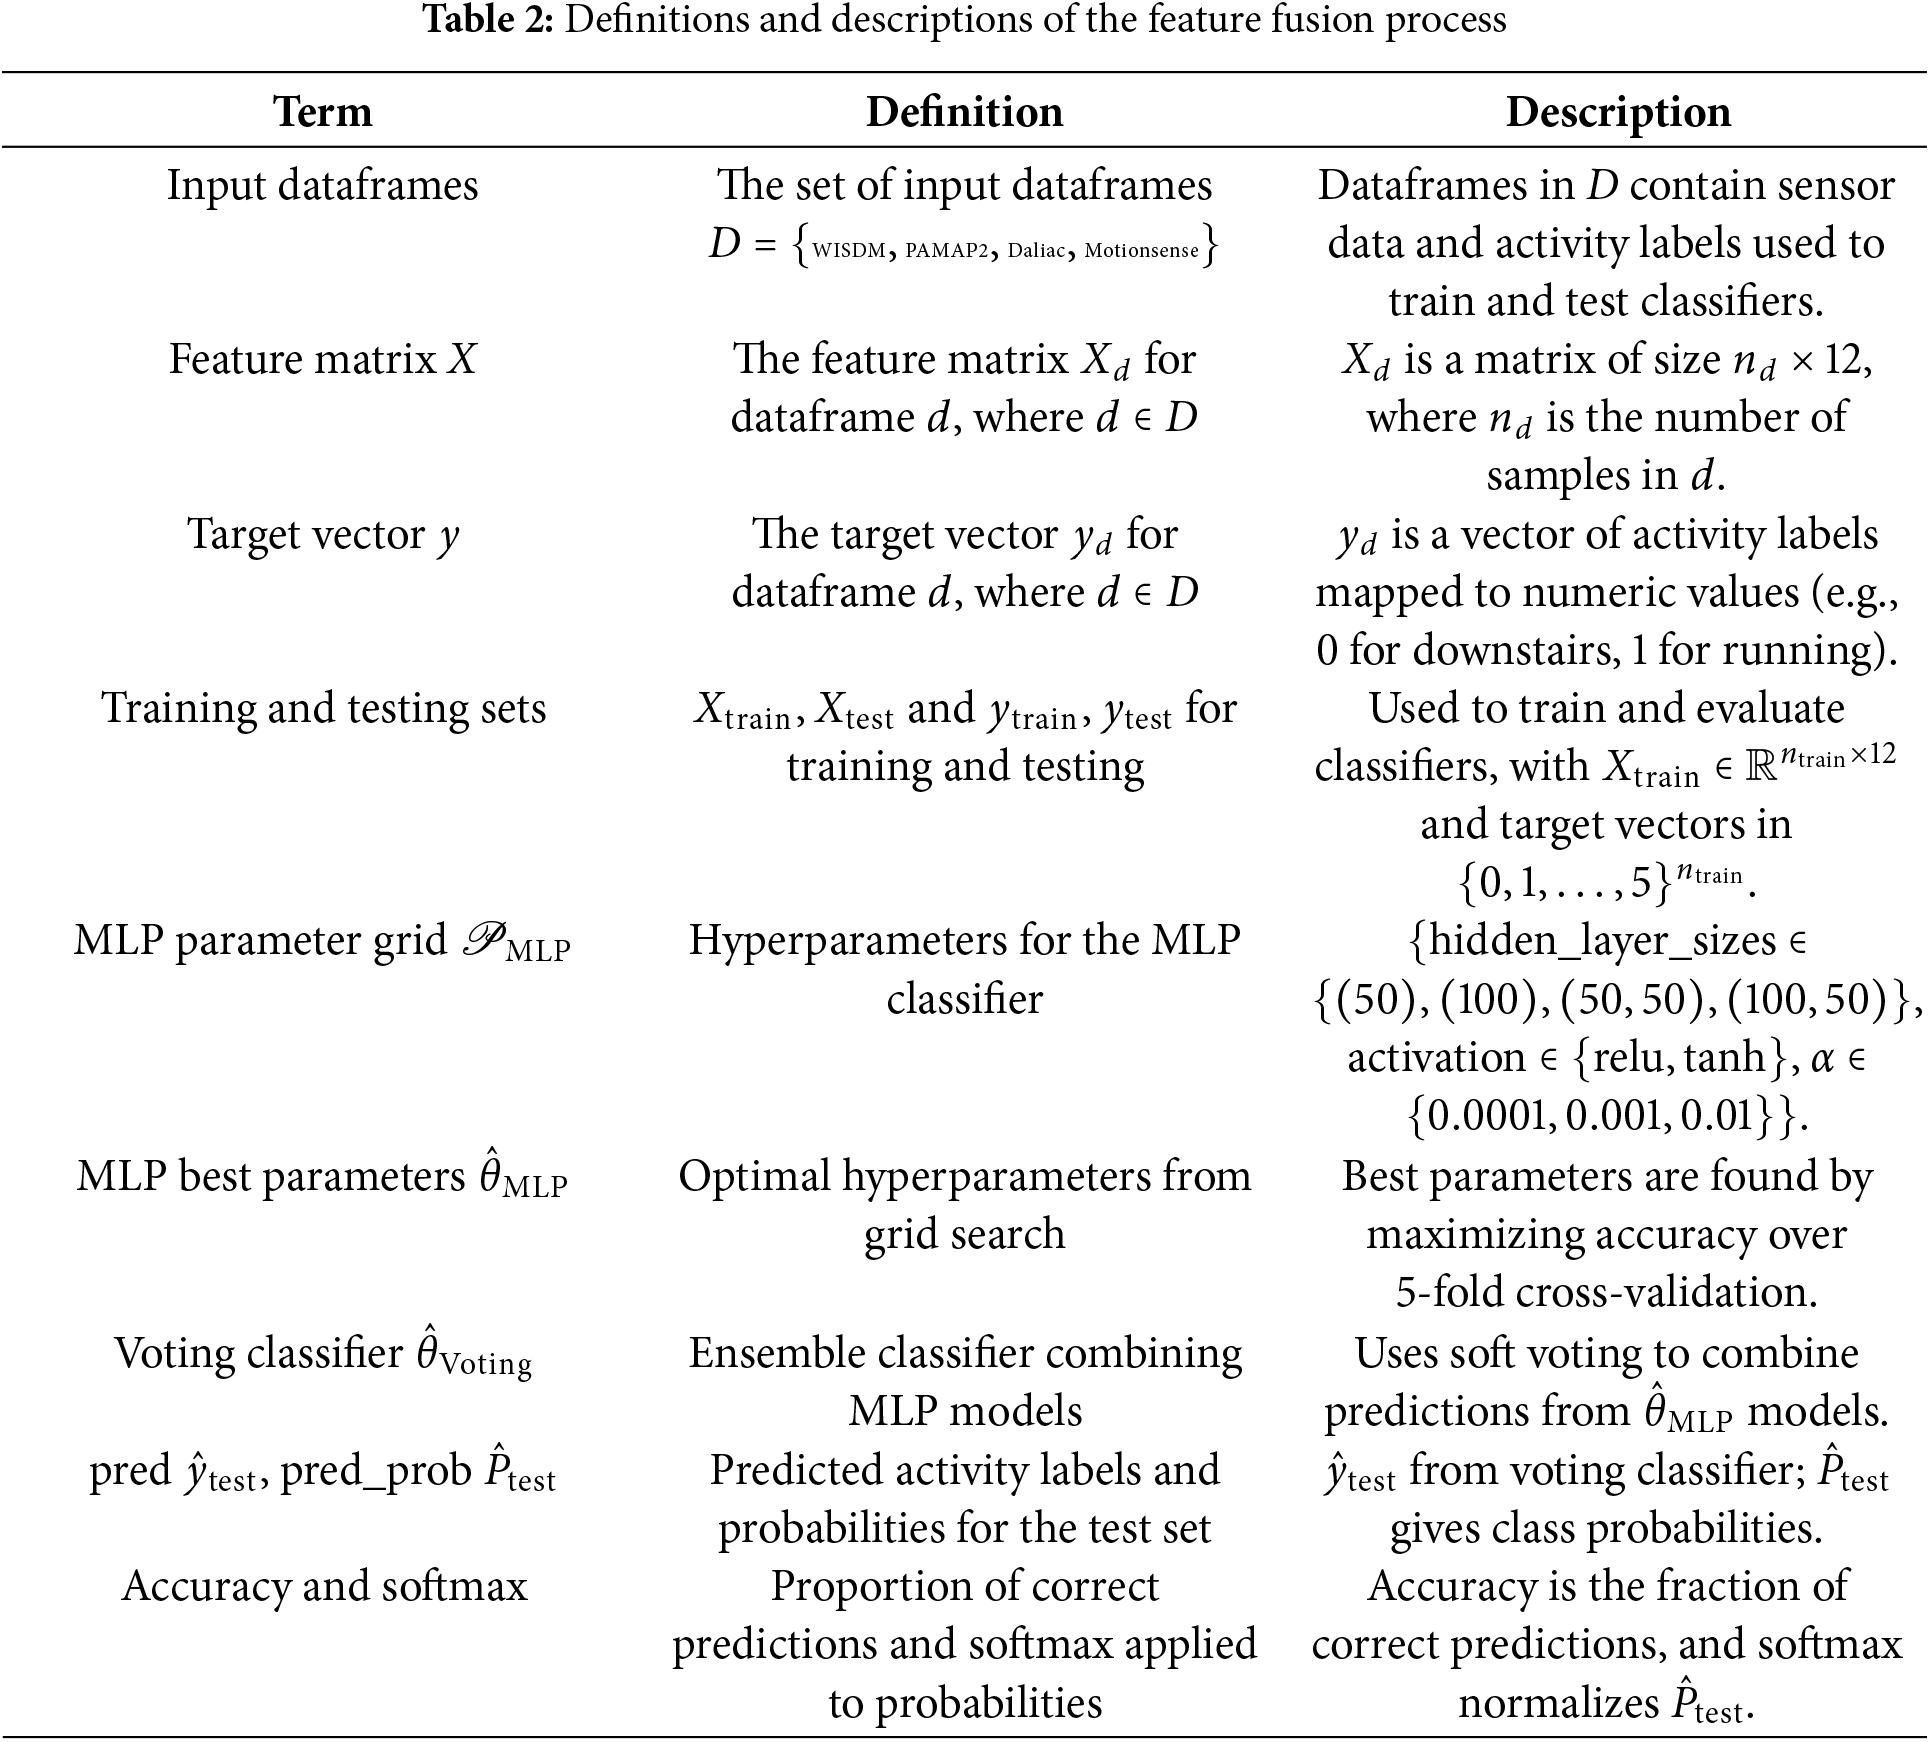
Performing a grid search for hyperparameter tuning in an MLP is crucial for optimizing model performance in a structured and rigorous way. By systematically exploring combinations of key hyperparameters, such as hidden layer sizes and regularization parameters, grid search ensures the model generalizes well to unseen data and avoids overfitting. Cross-validation is used to evaluate different configurations, providing a robust method to find the best-performing model. This careful approach enhances both the reliability and reproducibility of the results, which is critical for sound machine learning research.
Extract the best estimators. This is the step where MLP models are trained using grid search to find the best hyperparameters. Once trained, the best configurations of MLP models are selected based on the Grid Search results. Combine the best models using a soft voting classifier: The VotingClassifier is an ensemble learning method that combines multiple machine learning models to improve overall performance and robustness compared to individual models. It depends on the voting type ‘soft’, it either uses class probabilities or majority voting to make final predictions, which means it will average the predicted class probabilities of the individual classifiers to make the final prediction on the test data. By using the MLP models, the voting classifier can leverage the strengths of each model. The MLP might capture complex patterns due to its neural network architecture.
Compute the softmax values of the predicted probabilities: The voting classifier predicts outputs for the test data and computes softmax probabilities from the predicted probabilities. Softmax probabilities are computed from the raw output of the VotingClassifier pred_proba method. These probabilities indicate the model confidence in each predicted class, which is useful for understanding the certainty of predictions and can be particularly important in applications requiring probabilistic outputs.
3.6 Integration of Features Fusion from Multiple Sources
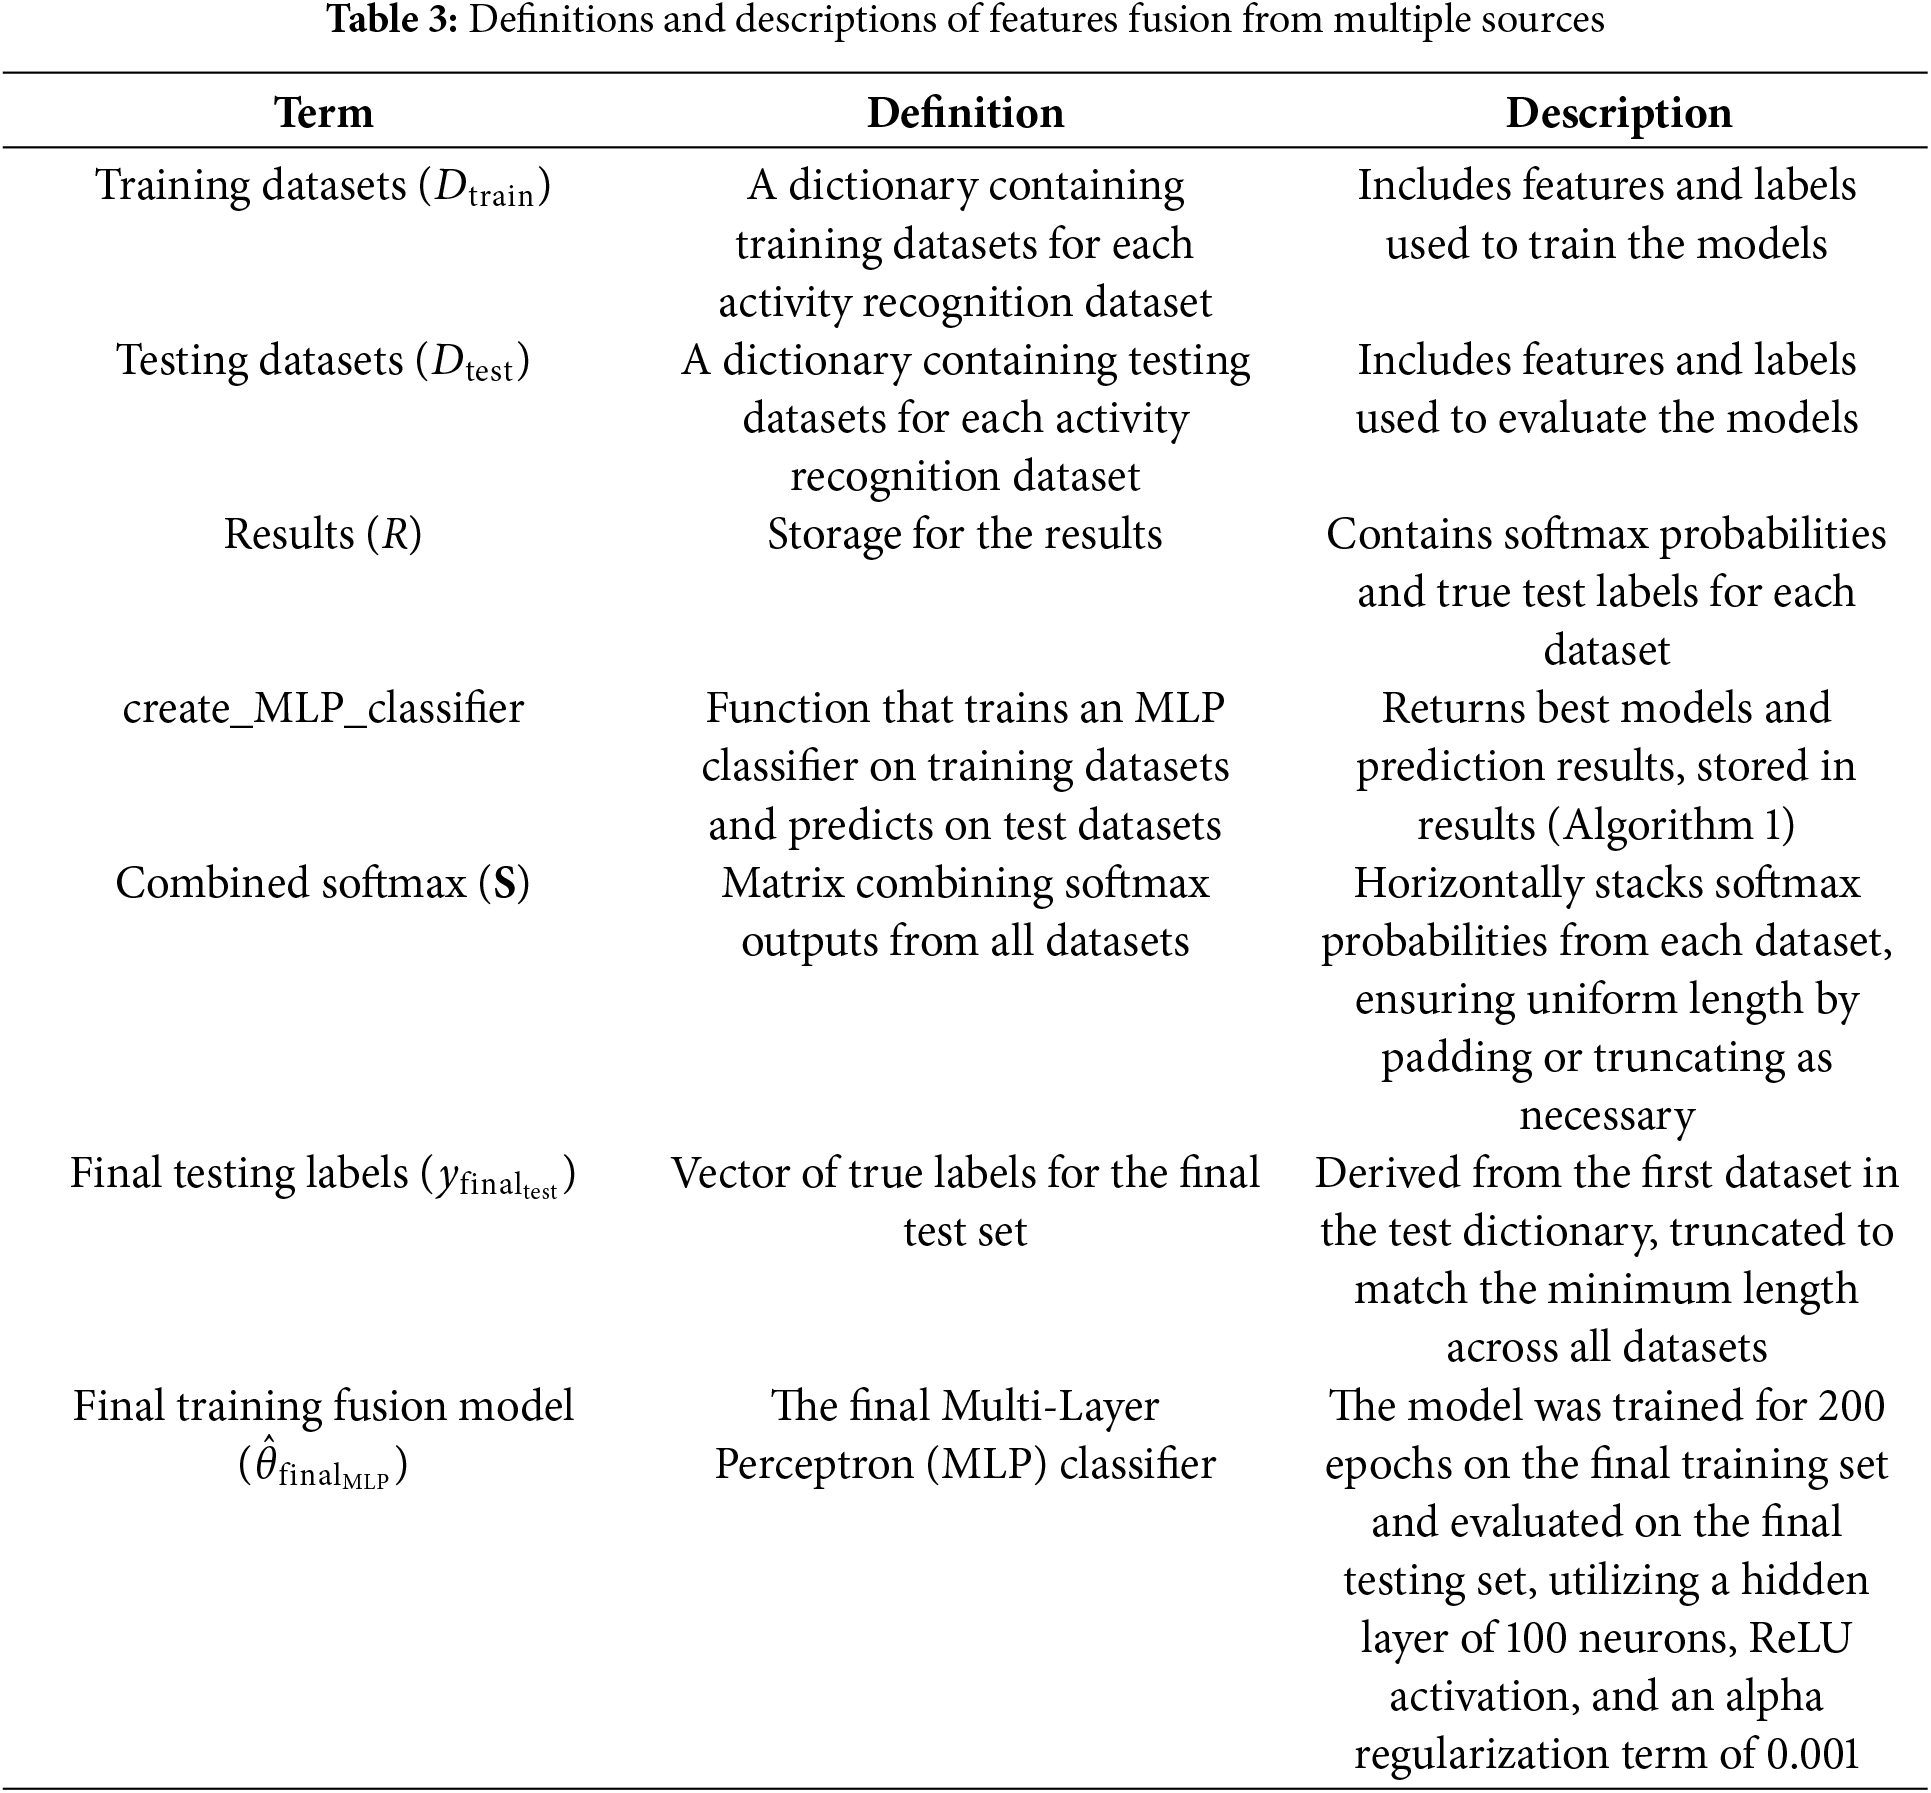
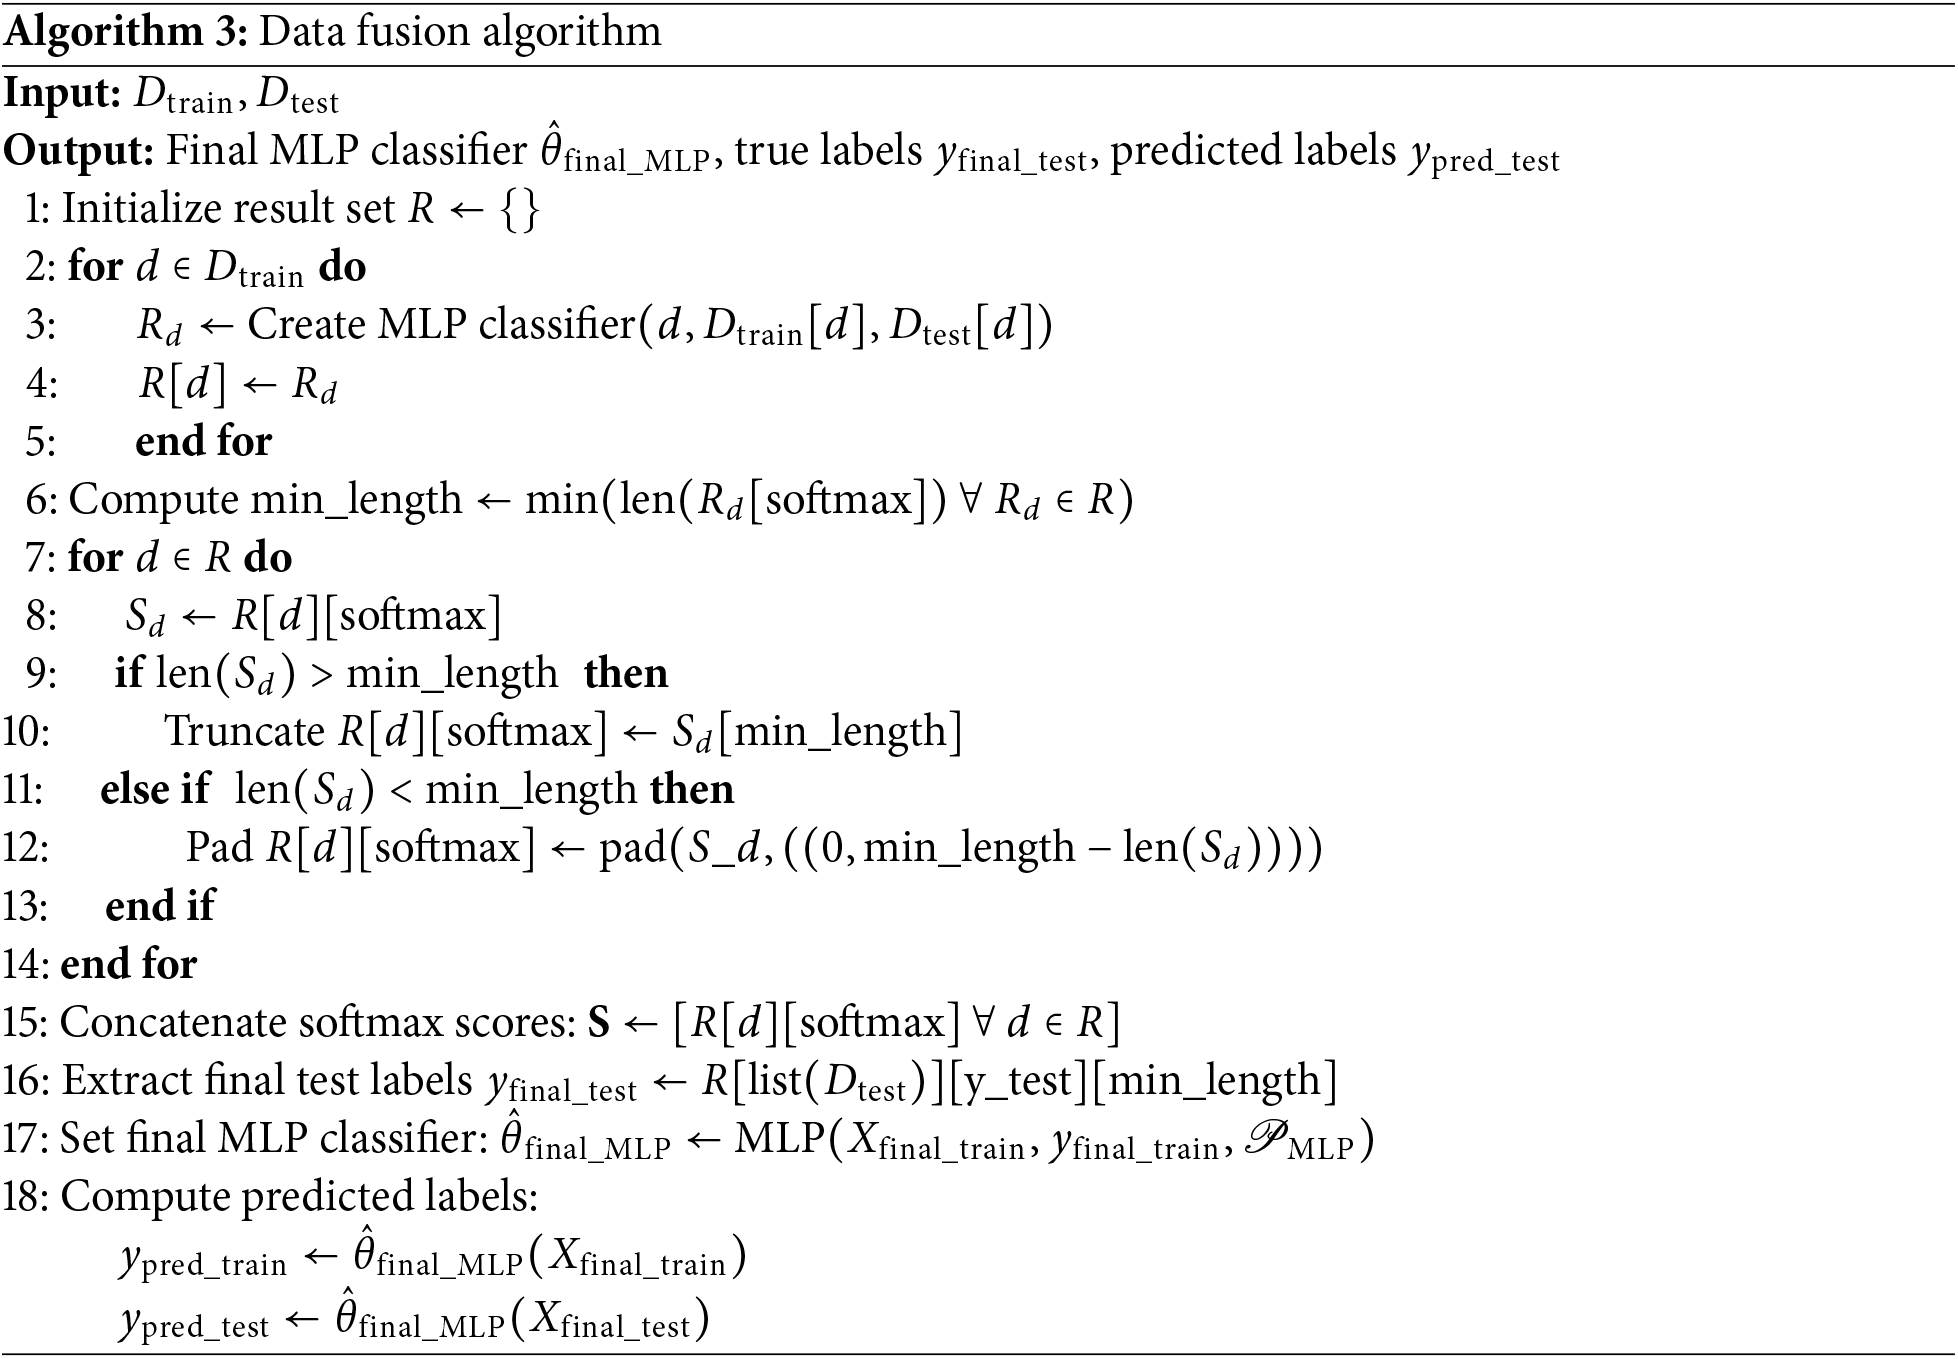
Integrating features from multiple data sources is essential for enhancing model performance and generalization in HAR work. By combining diverse datasets, the model captures a widr rage of activity patterns and sensor variations, leading to improved predictive accuracy. In this work, we employ an MLP for feature fusion, as it is capable of modeling complex, non-linear relationships between input features, which is critical when working with datasets that vary in sensor placement and activity types. The softmax function is utilized in the output layer to convert the model’s raw predictions into probability distributions, making it particularly effective for multiclass classification tasks. This approach enables the model to generalize across different datasets, adapting to variations in sensor setups and activity contexts, which improves its robustness and effectiveness in real-world applications. The data fusion process involves several essential steps to integrate features from multiple sources effectively, as outlined in Algorithm 3 and detailed in Table 3.
Our proposed MLP model is configured with carefully selected parameters, including the number of hidden layers, neurons per layer, activation functions, and learning rate. These parameters are optimized to enhance the model’s ability to capture complex patterns in HAR data. We specifically use Tanh and ReLU activation functions in the hidden layers to introduce nonlinearity, while the Softmax function in the output layer enables multi-class classification. The key parameter, tuned through grid search, prevents overfitting and ensures efficient learning. This configuration allows the MLP to generalize well across multiple datasets, as demonstrated by its strong performance within the ensemble model.
With the proposed methodology and model architecture established, we now move to Section 4, where we present and critically analyze the experimental results. This analysis provides insights into the model’s performance across various datasets and highlights the advantages of the data fusion approach in Human Activity Recognition.
Google Colab Pro Plus facilitated the experiments in this study by providing enhanced computational resources, particularly the NVIDIA Tesla T4 GPU. This GPU, equipped with 16 GB of memory and optimized for AI tasks, significantly accelerated the training of deep learning models by delivering high computational performance and efficient energy utilization. The environment was configured with Python 3, and the following libraries were employed for data processing, model development, and evaluation:
• Pandas: Utilized for comprehensive data manipulation and analysis, including loading datasets, handling missing data, and performing essential exploratory data analysis (EDA).
• NumPy: Essential for high-performance numerical computations, enabling efficient handling of large arrays and matrix operations integral to feature engineering and preprocessing.
• Scikit-learn: Deployed for a variety of machine learning tasks, providing tools for data splitting, normalization, and model evaluation through cross-validation and performance metrics.
• TensorFlow: Served as the primary framework for deep learning model construction, training, and evaluation. TensorFlow ’s Keras API enabled the design and optimization of neural networks.
4.1 Detailed Description and Analysis
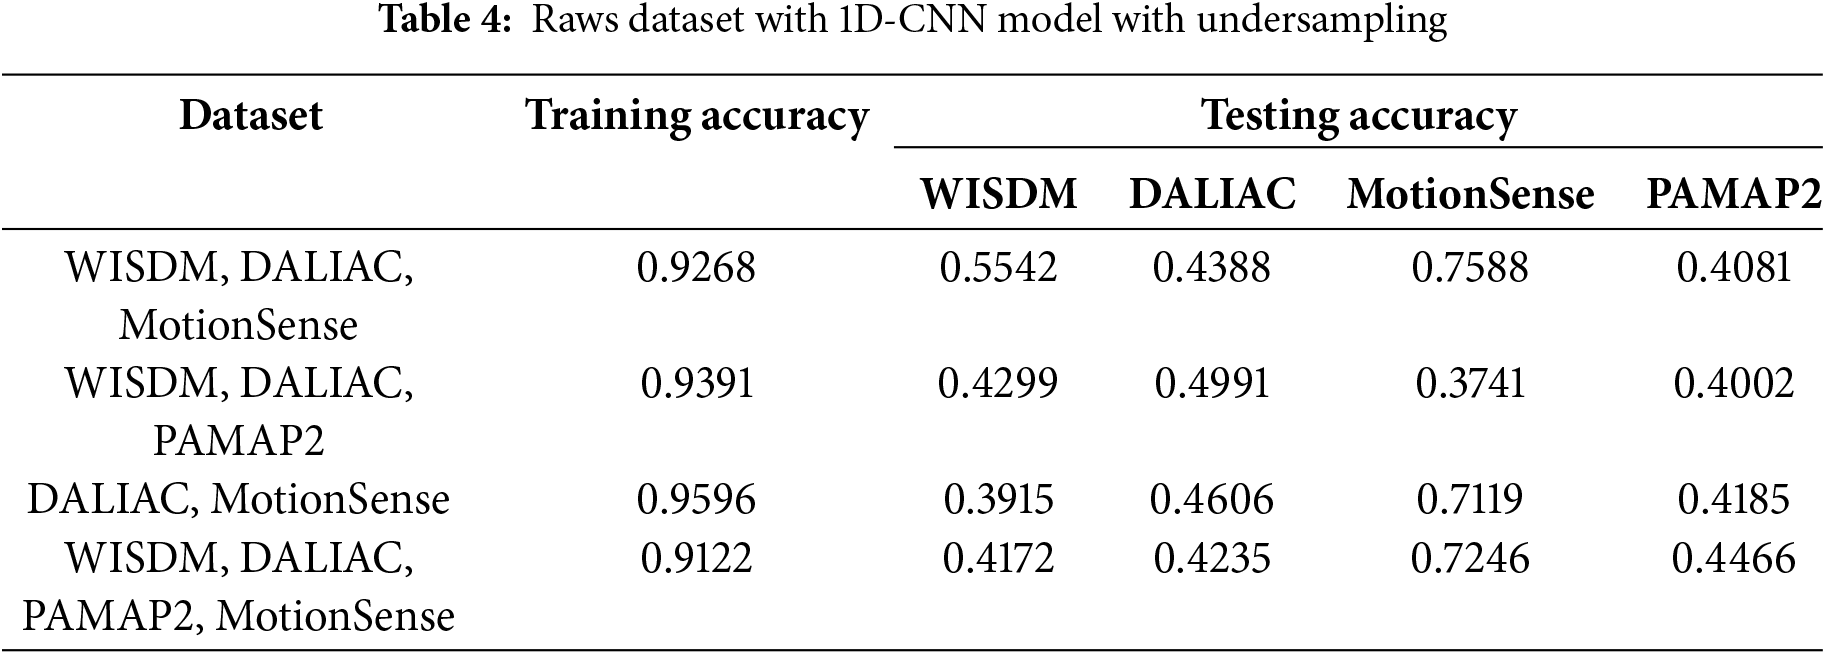
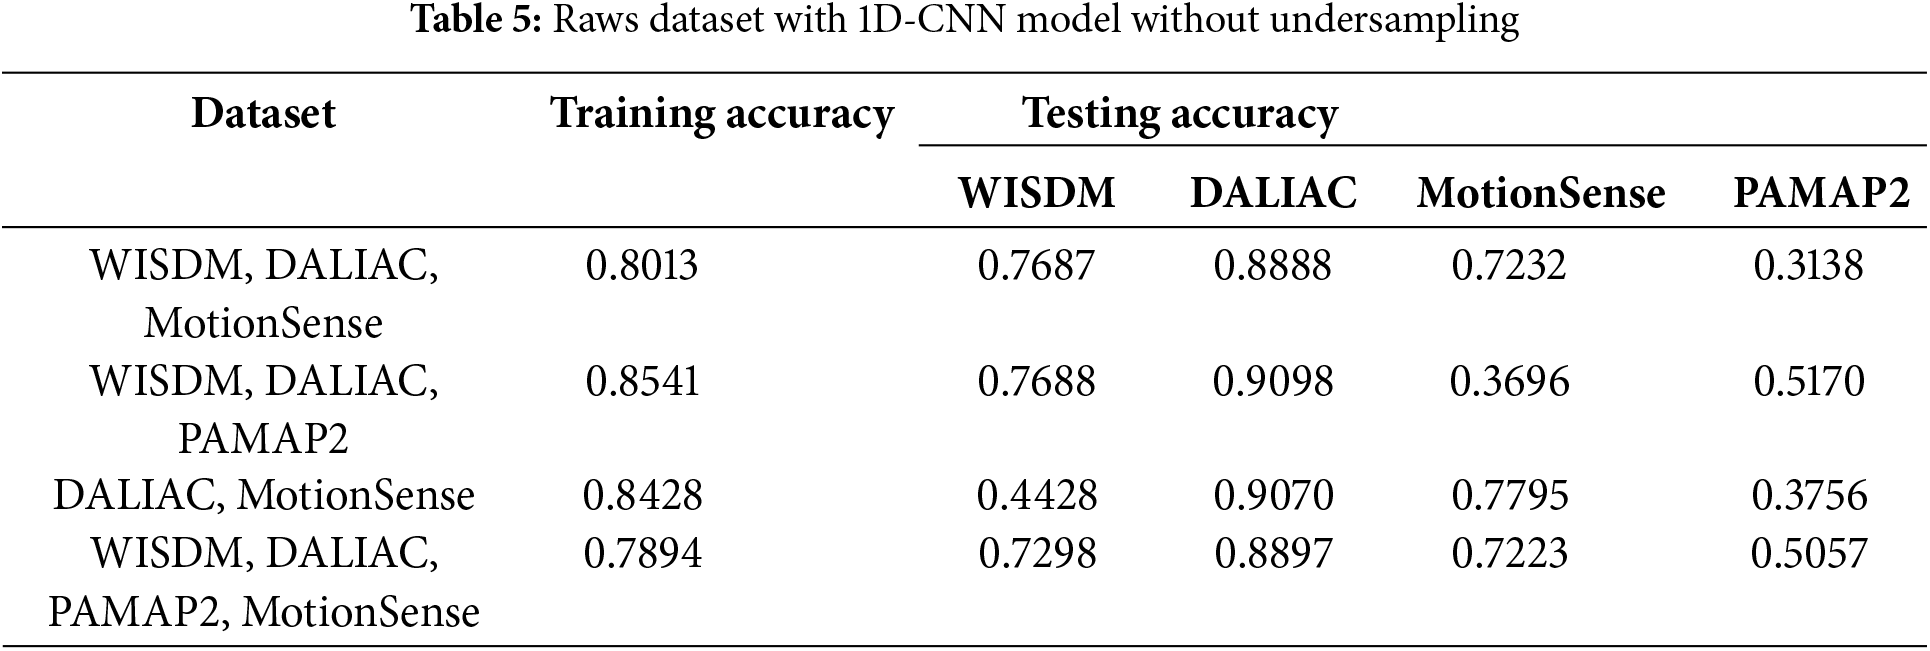
We have provided a comparative analysis of the performance of a one-dimensional convolutional neural network (1D-CNN) model on two different training regimes: with undersampling (Table 4) and without undersampling (Table 5). Both tables include combinations of four datasets: WISDM, DALIAC, MotionSense, and PAMAP2. The goal is to evaluate the impact of undersampling on the training and testing model accuracies. The table reports the accuracy of the model across these datasets during both the training and testing phases. In both tables, the training accuracies reflect how well the model has learned from the training data.
The 1D-CNN model architecture was optimized through a grid search approach, where key hyperparameters were varied to identify the optimal configuration. The primary components of the model include a convolutional layer, pooling layer, and multiple fully connected (Dense) layers. Grid search is a critical tool for optimizing the 1D-CNN model architecture in HAR [26]. By systematically exploring hyperparameter combinations, it ensures that the model captures the temporal and spatial patterns present in the data, generalizes well across different activities, and is robust enough to handle variations in sensor readings. This process is essential for building high-performing HAR models that are accurate. The hyperparameters subjected to optimization are defined as follows:
Filters (
Kernel Size (
Activation Function (
Dropout Rate (
Dense Layers (L): Number of dense layers, where
Dense Nodes (
Batch Size (
Epochs (
The model structure is mathematically represented as:
The grid search identified the optimal combination of these parameters to maximize the model’s accuracy, leading to a well-tuned 1D-CNN architecture suitable for the task at hand. The model can learn from complex time-series patterns. Properly configured parameters ensure the model efficiently captures the temporal dependencies in the raw data, leading to a more accurate activity classification.
4.1.1 Raw Dataset Combinations
The first column lists, for both tables, the combinations of datasets used for training, while the second column provides the corresponding training accuracies. The training accuracy is consistently high across all combinations, indicating effective learning from the training data. A focus on both tables found that the training accuracies are consistently higher with undersampling, indicating that this technique helps the model fit better to the training data. This might suggest that undersampling balances the class distributions, reducing the bias model towards more frequent classes. The testing accuracies provide insights into the ability to generalize to testing data. A comparison across the datasets reveals significant differences between the two tables.
4.1.2 Analysis and Interpretation
The 1D-CNN model demonstrates consistently lower performance on the PAMAP2 dataset compared to other datasets such as WISDM and MotionSense, as observed in Tables 4 and 5. This reduced performance can be attributed to the differing feature distributions and ranges within PAMAP2, which lead to poor generalization when combined with other datasets. For instance, in the undersampling scenario (Table 4), PAMAP2 achieves a testing accuracy of only 0.4002, while WISDM and MotionSense reach significantly higher values, indicating that PAMAP2’s feature characteristics are less compatible with those datasets. Even without undersampling (Table 5), while PAMAP2 shows slight improvement (with a testing accuracy of 0.5170), its performance remains notably lower than that of other datasets, such as WISDM and DaLiAc.
The statistical comparison between models trained with and without undersampling, presented in Tables 4 and 5, was conducted to compare the training and testing accuracies, highlighting distinct effects across datasets. In the WISDM dataset, the paired t-test results showing a significant p-value of 0.0388 suggest that undersampling substantially impacts model performance, typically hindering its generalization capabilities, as evidenced by better performance without undersampling. In contrast, the DALIAC dataset’s extremely low p-value (0.00004) indicates that undersampling dramatically changes model accuracy, reflecting the dataset’s unique demands on model features. For MotionSense and PAMAP2, the lack of significant p-values (0.7914 and 0.8527, respectively) reveals that undersampling does not notably influence performance, showcasing its variable effectiveness based on dataset specifics.
These results underscore the importance of tailoring data preprocessing techniques like undersampling to each dataset’s characteristics to optimize HAR models. This approach highlights the need for adopting advanced data fusion methods that could mitigate the limitations of simple undersampling, thereby improving model robustness and adaptability in HAR applications.
At this stage, the study transitions to exploring feature fusion in multisource data, with the results detailed in Table 6. The data fusion technique improves the model’s performance by integrating multiple datasets, capitalizing on the strengths of each dataset to achieve better generalization and robustness.
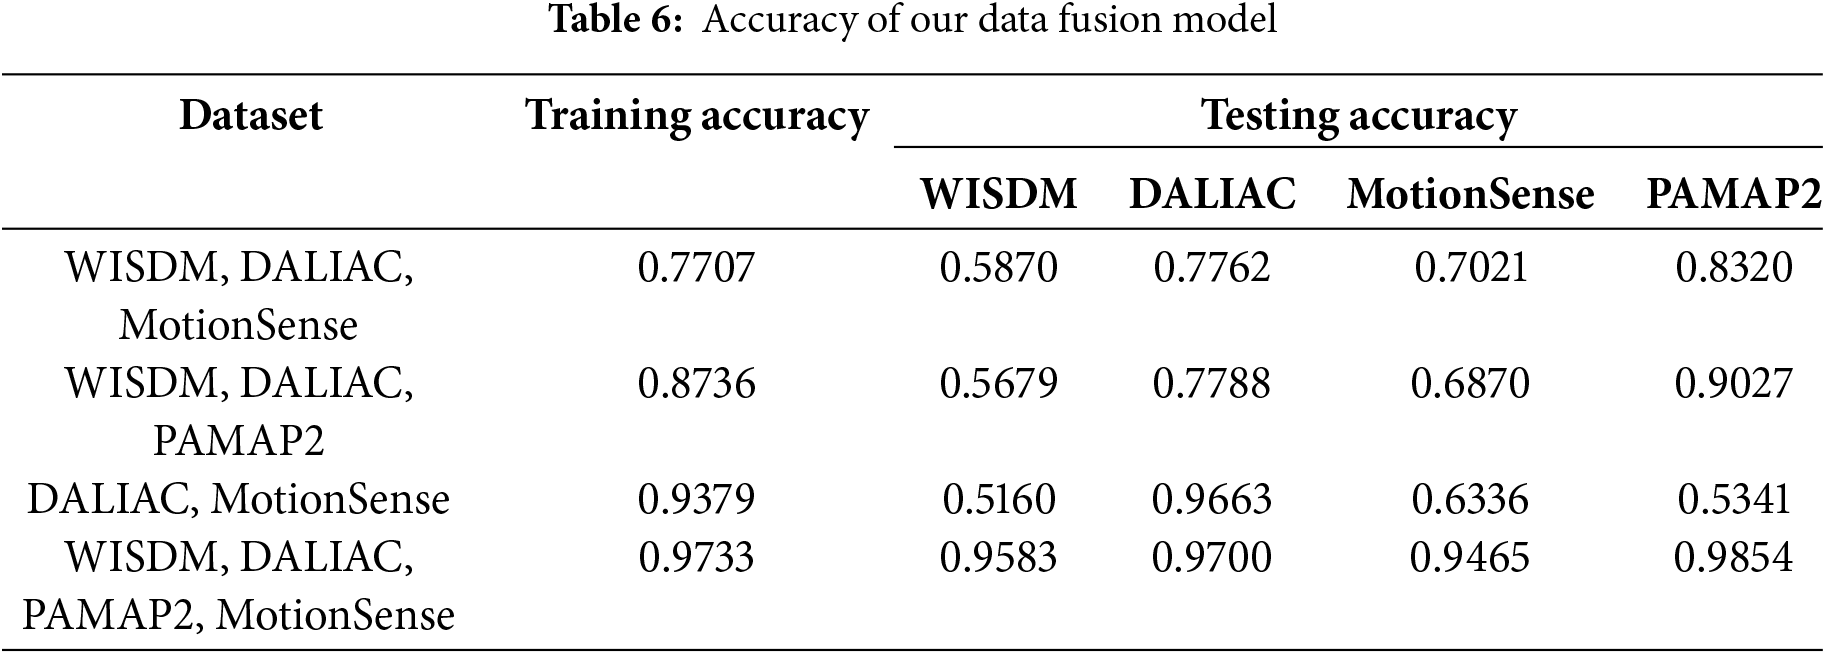
As illustrated in Fig. 5, the model trained on fused datasets achieves high testing accuracies across individual datasets, with values such as 0.9583 for WISDM, 0.9700 for DaLiAc, 0.9465 for MotionSense, and 0.9854 for PAMAP2, as shown in Table 6. These high accuracies, along with low loss values, highlight the model’s enhanced generalization ability and stability across diverse datasets. The minimal differences in loss between training and testing further suggest that the model effectively avoids overfitting, underscoring data fusion as a robust strategy for building adaptable HAR models that can perform consistently across varying environments and user groups.
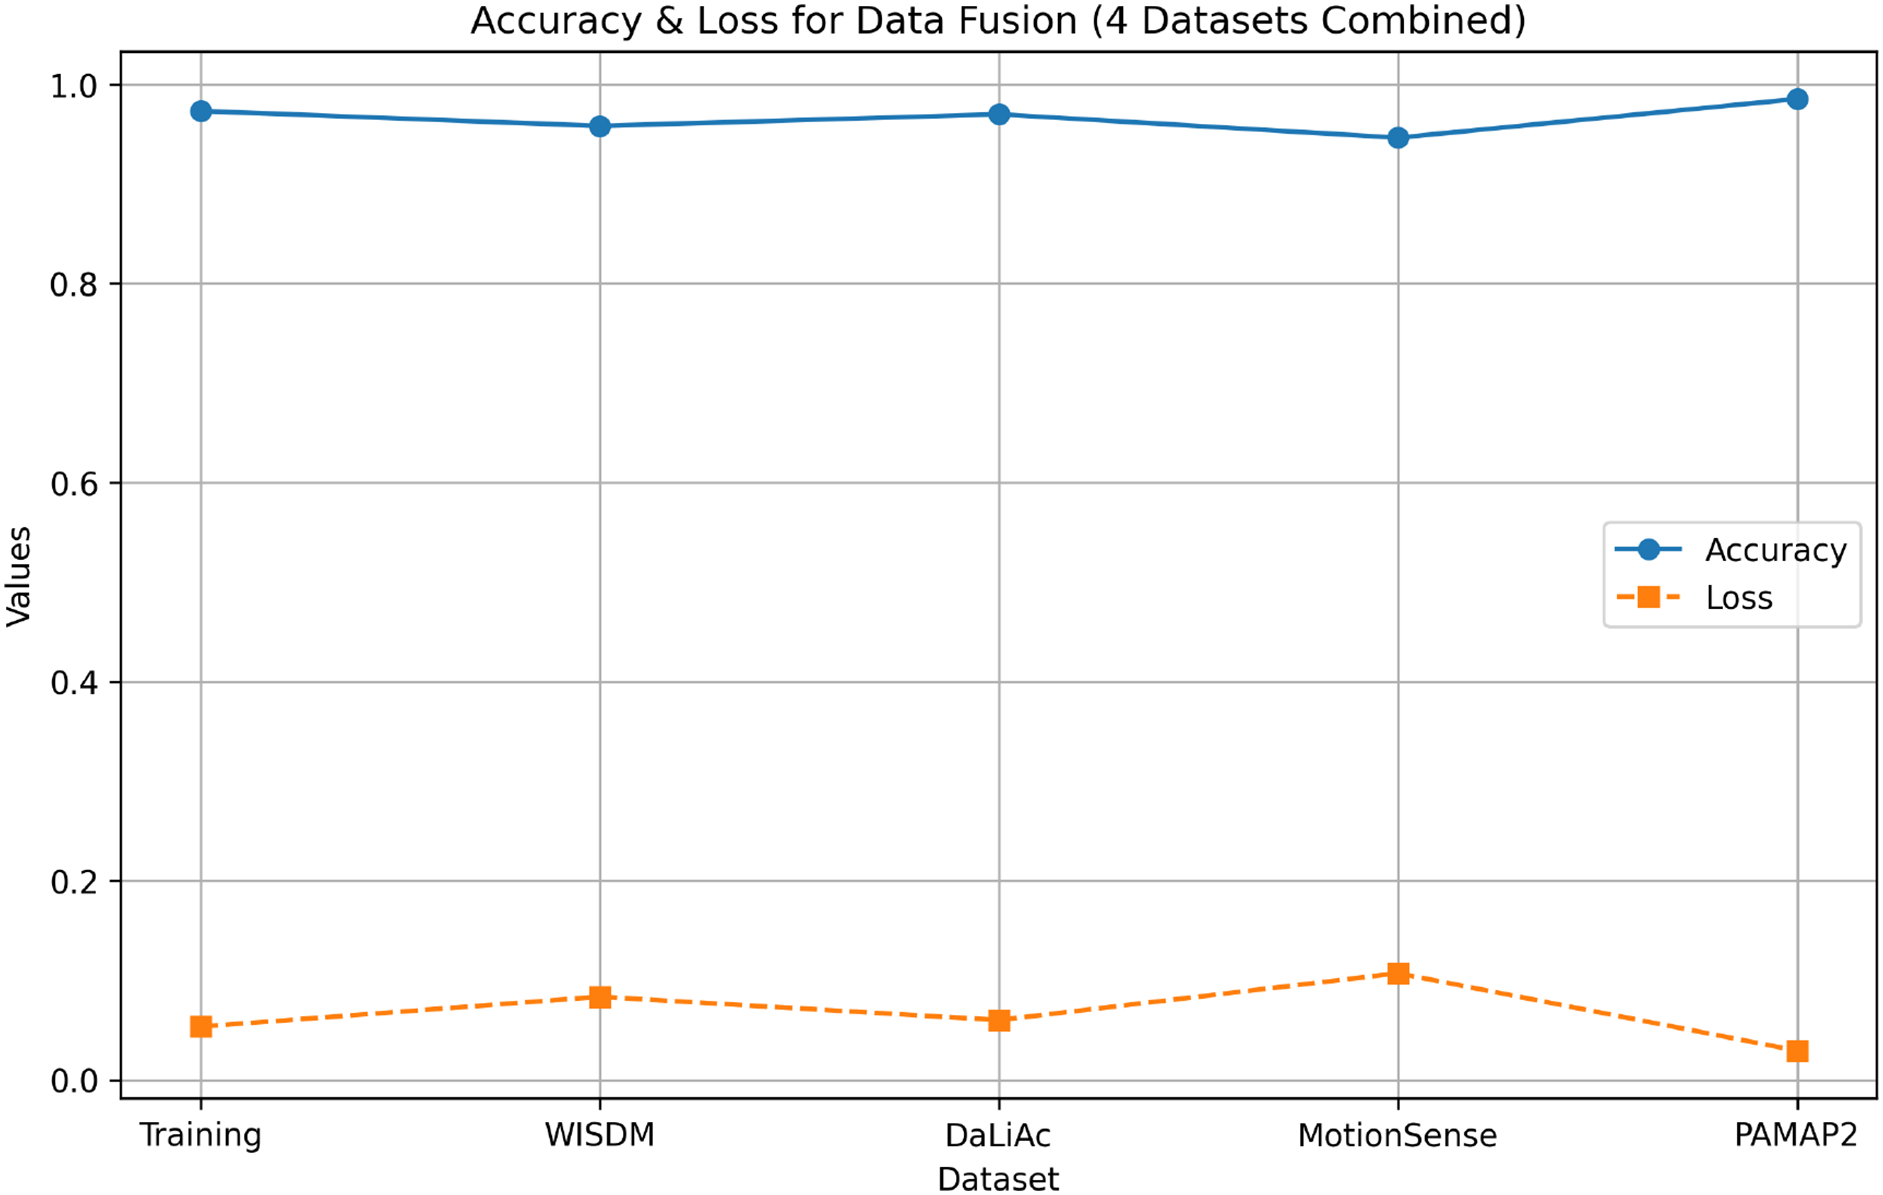
Figure 5: Accuracy and loss for data fusion (WISDM, DALIAC, PAMAP2 and MotionSense combined)
The data fusion method described in Algorithm 3 effectively mitigates the variability and biases inherent in individual datasets. This approach leads to more robust and consistent performance, as demonstrated by the comparative analysis in Tables 7 through 10 compared with other research. This approach enhances generalizability by training the model on a combination of datasets representing diverse sensor placements, environments, and activity patterns. This broader exposure allows the model to learn more general features, resulting in high testing accuracy across various datasets. Single models often excel on their specific dataset alone, but the data fusion approach achieves competitive accuracy across all datasets with minimal overfitting, as indicated by the low differential values in testing accuracy.
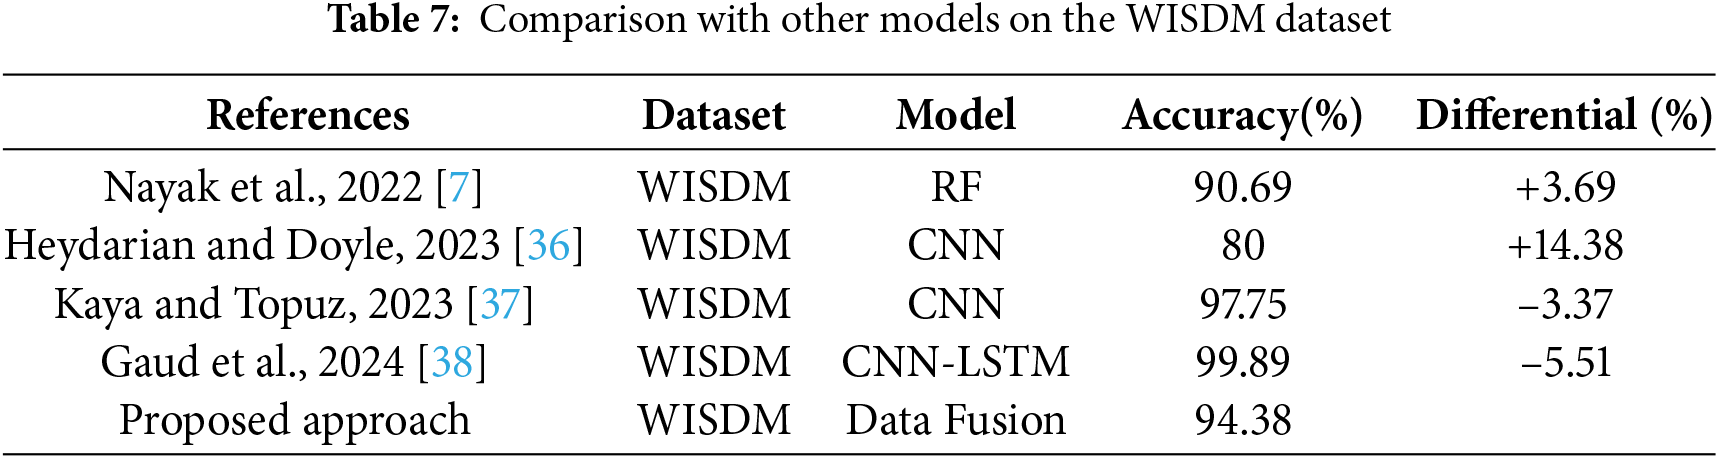
Table 7 provides a comprehensive comparison of various machine learning models applied to the WISDM dataset, notably surpassing the accuracy of the RF model by Nayak et al. and remaining competitive with the CNN model by Kaya and Topuz. However, it falls short of the accuracy achieved by Gaud et al.’s CNN-LSTM model. This comparison underscores the effectiveness of the proposed data fusion strategy, demonstrating strong performance against models trained solely on the WISDM dataset. There remains potential for further optimization, especially in closing the gap with more advanced architectures like CNN-LSTM. The multisource data fusion approach offers a promising direction for improving model generalizability and performance across diverse datasets in human activity recognition.
Table 8 provides a comparative analysis of the accuracy performance of various models applied to the DaLiAc dataset. The table includes results from Debache et al., Nhan D. Nguyen et al., and the proposed approach. This analysis aims to elucidate the effectiveness of our proposed model, which utilizes a data fusion technique against established methods such as Logistic Regression (LR) and K-Nearest Neighbors (KNN). The data fusion technique used in our model appears to strike a balance between the simplicity and effectiveness of LR and the versatility of KNN. Despite not achieving the highest accuracy compared to LR (−1.47%), the proposed approach significantly outperforms KNN (+6.6%) and provides a competitive accuracy rate of 95.83%.
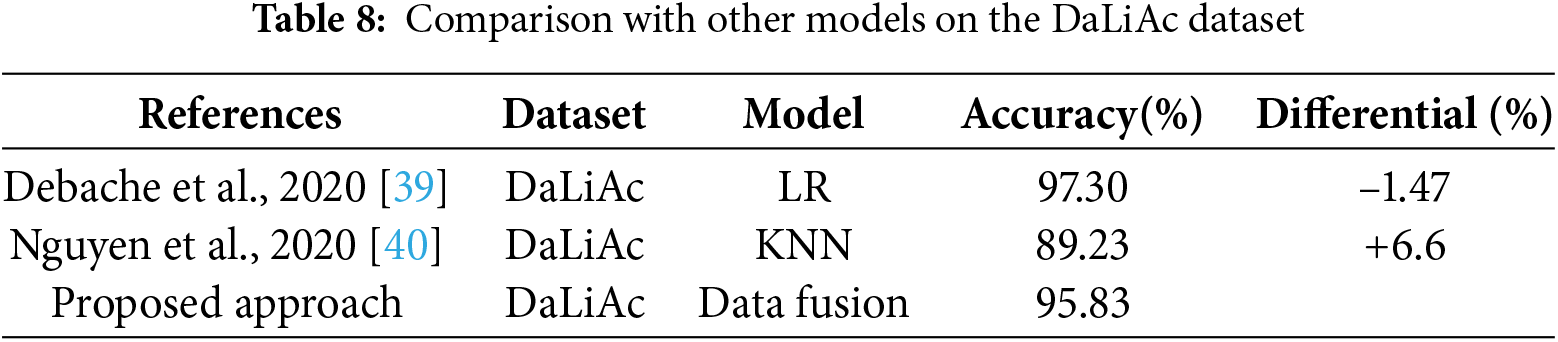
Table 9 presents a comparative analysis of different models applied to the PAMAP2 dataset, showcasing the accuracy achieved by each approach. The comparative analysis indicates that the data fusion approach outperforms the traditional CNN and DWCNN models and demonstrates a significant improvement over the advanced CNN–LSTM hybrid model. This highlights the potential of data fusion in enhancing model performance by leveraging diverse data sources. The considerable accuracy gain observed (98.54%) underscores the robustness and generalizability of the proposed method.
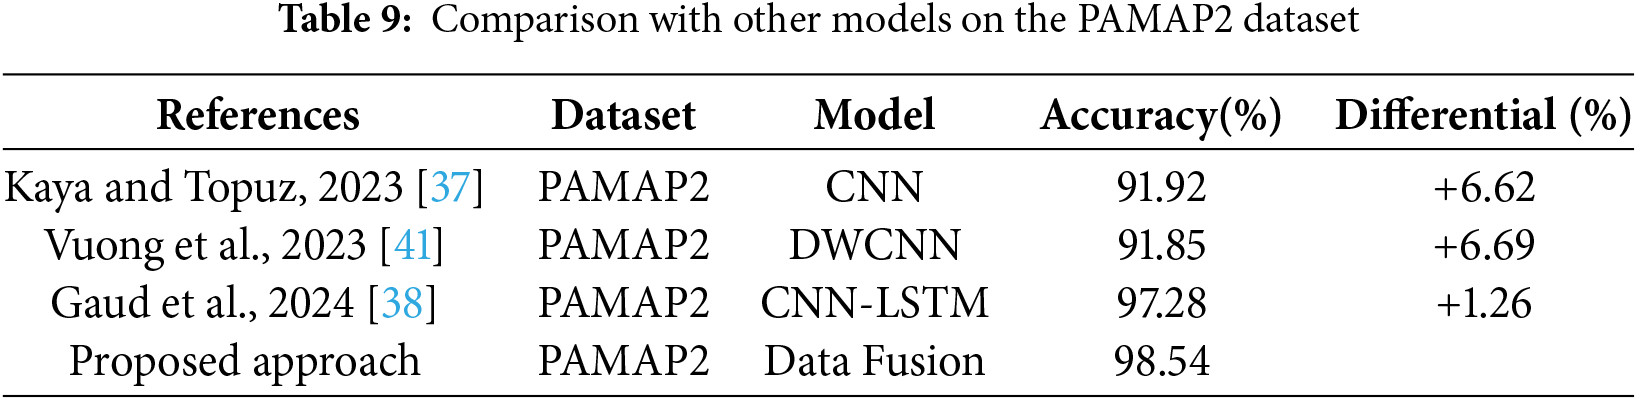
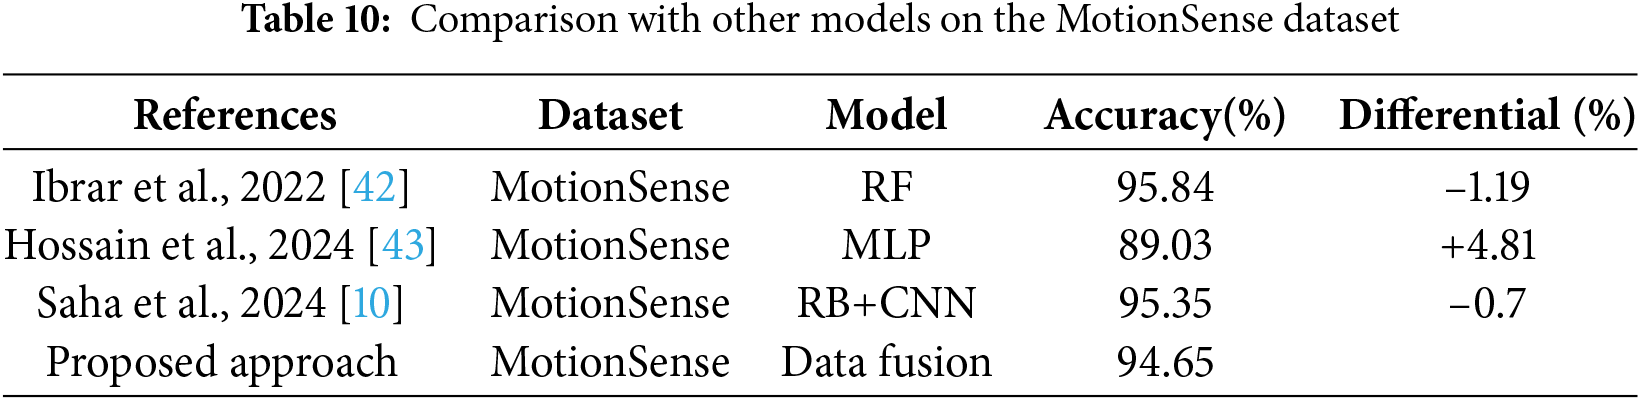
Table 10 presents a comparative analysis of different models on the MotionSense dataset. This ensemble learning method used by Ibrar et al. combines multiple decision trees to improve classification performance. RF is known for its robustness and ability to handle overfitting, which likely contributed to its high accuracy. The MLP model utilized by Hossain et al. is a feedforward artificial neural network that consists of multiple layers of nodes. Despite its simplicity compared to more complex architectures, its performance on the MotionSense dataset is relatively lower at 89.03%. Saha et al. employed a combination of residual blocks and CNNs. Residual blocks help mitigate the vanishing gradient problem, enhancing the learning capability of deep networks. This sophisticated model achieved a high accuracy rate of 95.35%. The proposed approach integrates data from multiple sources (a combination of four datasets) to enhance model performance. Data fusion techniques often provide a more comprehensive representation of the input data, potentially capturing more nuanced patterns. This approach achieved an accuracy rate of 94.65%, which is competitive with the top-performing methods.
Data fusion also increases robustness across different environments, a crucial factor for real-world applications in HAR. By combining datasets with different sensor modalities and data distributions, the model becomes less sensitive to specific variations found in individual datasets. This robustness is valuable when deploying HAR models in diverse contexts where environmental conditions or sensor placements may differ from those seen during training.
Finally, data fusion provides adaptability to multiple datasets, highlighting its potential for scalable HAR solutions. Unlike single-dataset models that may require retraining or fine-tuning for new environments, the data fusion approach performs consistently across new data sources without significant performance loss. This adaptability makes data fusion a suitable choice for applications that demand reliable performance across varied user populations and settings, supporting its practical use in heterogeneous environments.
Fig. 6 showcases confusion matrices for four different datasets—WISDM, DaLiAc, PAMAP2, and MotionSense–using a multi–layer perceptron (MLP) classifier trained on a fused dataset and tested individually on each dataset. Each confusion matrix visualizes the classifier’s performance in terms of true positive rates for each activity class, highlighting both the strengths and weaknesses of the model. In Fig. 6a, the classifier shows moderate accuracy, particularly struggling with distinguishing between downstairs and upstairs, walking and running. The WISDM dataset sensor placement in a pants pocket occasionally results in the model misclassifying “downstairs” as “upstairs”. Although both activities share similar locomotive patterns, a hip–level sensor may not fully capture subtle distinctions in leg angles, foot strikes, or posture. These misclassifications suggest that the extracted features may overlap or lack sufficient specificity to differentiate between these closely related activities. Consequently, refining feature extraction techniques or considering alternative sensor placements may improve the model’s ability to distinguish between such activities accurately.
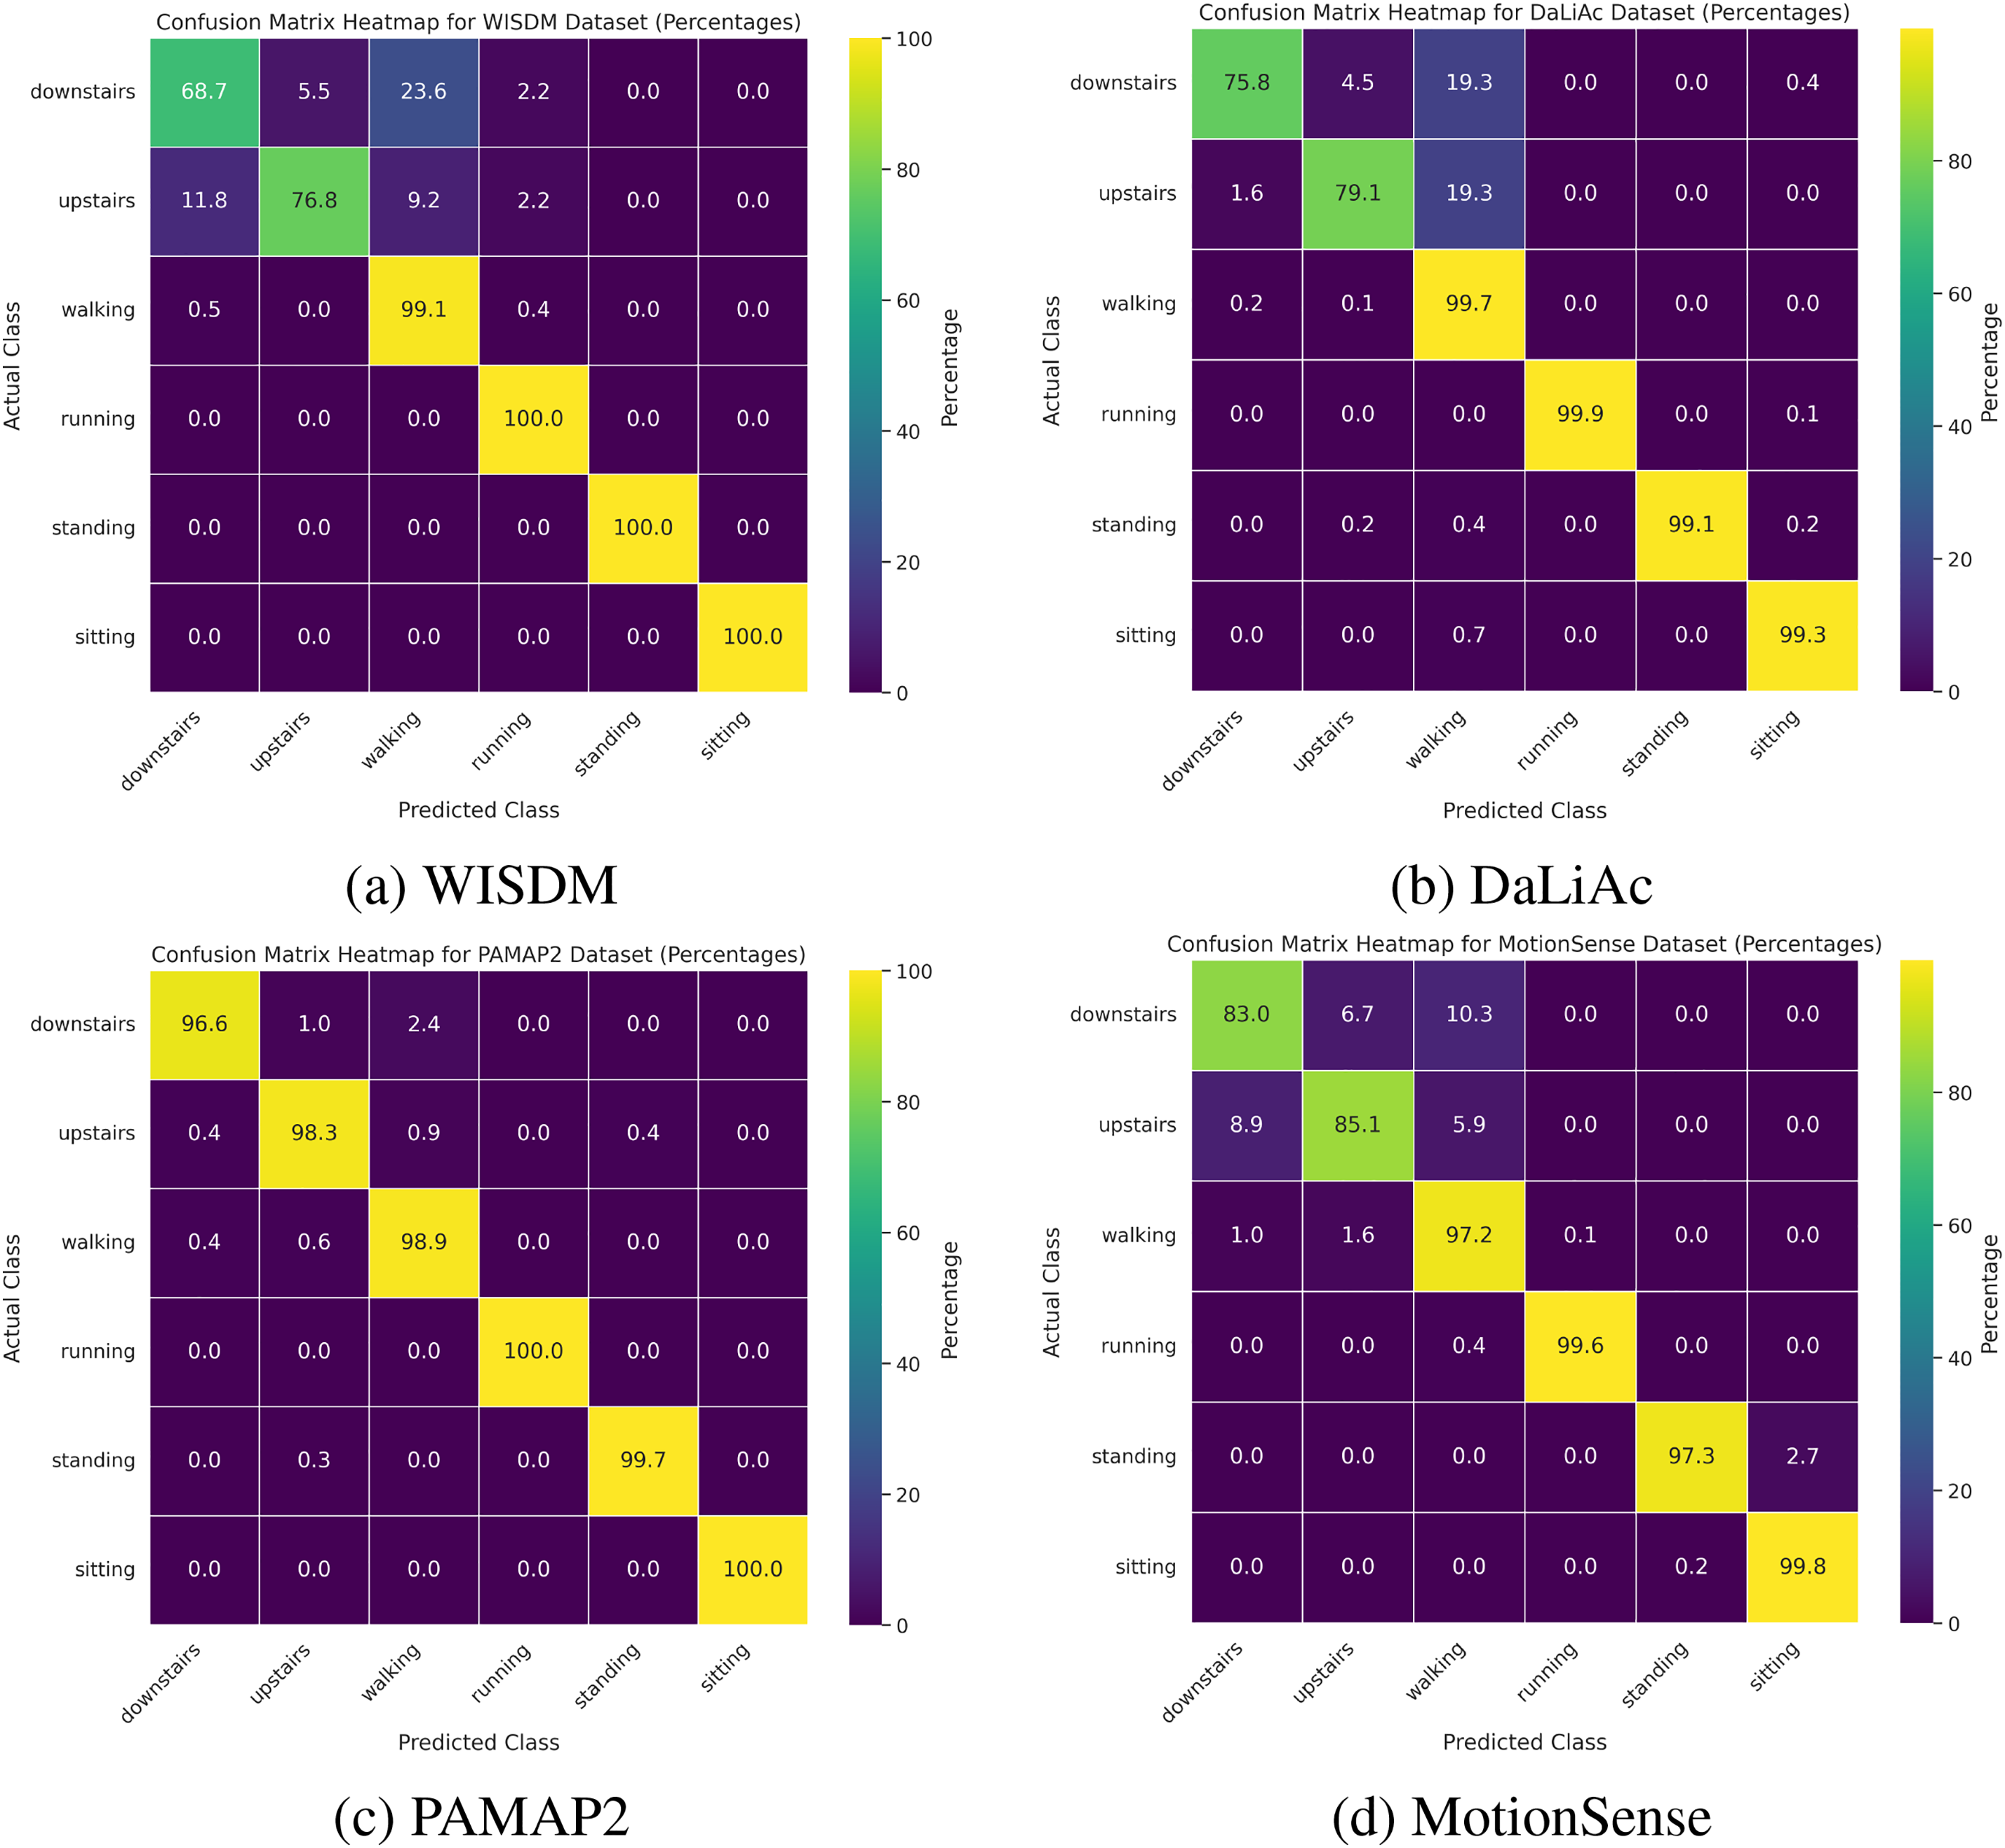
Figure 6: Confusion matrix for (a) WISDM, (b) DaLiAc, (c) PAMAP2, and (d) MotionSense datasets tested by the data fusion model
In contrast, regarding the DaLiAc dataset shown in Fig. 6b, the model demonstrates significantly better performance, particularly for dynamic activities such as walking and running, which are almost perfectly classified. This suggests that the features in the DaLiAc dataset are more distinctive or that the model generalizes better with this dataset. In Fig. 6c, the PAMAP2 dataset exhibits the highest overall performance, with nearly perfect classification across all activities. This suggests that PAMAP2 has the most distinctive and well–represented features for the activities, making it easier for the model to distinguish between classes.
Lastly, regarding the MotionSense dataset shown in Fig. 6d, the model also shows strong performance, though it does not match the near-perfect accuracy of the PAMAP2 dataset. These minor confusions between similar activities suggest that, although the dataset generally provides a solid basis for feature extraction, there remains potential to enhance the model accuracy or adjust the belt–level sensor placement to minimize misclassifications. For instance, a small proportion of “downstairs” steps are misclassified as “walking”, likely due to the subtlety of vertical displacement cues at waist height. Additionally, slight misalignments between “upstairs” and “downstairs” may arise from participant–specific differences in speed, stride length, and overall intensity. These results highlight the variability in model performance across different datasets and emphasize the importance of feature representation, sensor placement, and data quality in developing robust activity recognition models.
Following the analysis of experimental results and the demonstrated effectiveness of our approach, we conclude with Section 5, which summarizes the key findings, discusses the implications of this study, and suggests directions for future research in the HAR task.
Our research demonstrates the effectiveness of a multisource data fusion approach using MLP for HAR, significantly enhancing both training and testing performance across diverse datasets. This study leverages the complementary information inherent in multiple data sources, which results in a richer and more comprehensive training set, ultimately enabling the model to learn more discriminative features essential for accurate activity recognition.
Key Contributions and Experimental Insights:
• Enhanced Model Performance: The integration of datasets such as WISDM, DALIAC, MotionSense, and PAMAP2 through our fusion approach has been shown to improve model robustness and adaptability. Statistical analyses reveal that models employing data fusion notably outperform those using single-source data, particularly in complex activities where subtle distinctions are crucial. For example, our fusion model achieved a marked improvement in testing accuracy on the PAMAP2 dataset (p = 0.0174), indicating its superior capability in handling complex data distributions.
• Statistical Feature Extraction: The extraction of statistical features-Mean, Median, Amplitude, and SMA–plays a critical role in summarizing and reducing the complexity of raw data. This reduction strategy simplifies the input to the model and maintains essential informational cues critical for accurately recognizing various activities.
• Strategic Undersampling: Our approach includes strategic undersampling to balance the dataset, which is essential for preventing model bias towards more frequent activities. This methodological choice has been validated through statistical testing, which indicates that undersampling contributes to the balanced performance across different classes, enhancing the generalizability of the model.
• Robustness and Generalizability: The data fusion method has proven robust and generalizable across different real-world settings. It successfully captures the complex temporal dependencies of sequence data, which is pivotal for deploying HAR systems in dynamic environments.
While this study demonstrates promising results, several limitations require acknowledgment. Variations in sensor placement, sampling rates, and participant demographics across datasets may impact the model’s ability to generalize effectively to new or real–world scenarios. Furthermore, the framework’s applicability to low sampling rate data and resource-constrained environments remains insufficiently explored. Addressing these challenges presents significant opportunities for future research.
Future efforts should focus on integrating additional sensor modalities, such as magnetometers or gyroscopes, to enhance robustness across diverse configurations. Investigating advanced fusion techniques and incorporating larger, more diverse datasets will further refine the capabilities of HAR systems. Moreover, leveraging state-of-the-art architectures, such as transformer-based models or self-supervised learning approaches, could improve the model’s adaptability and generalization to unseen conditions. Expanding this work into real–time applications by assessing model performance under streaming data and dynamic environmental conditions will be critical. Finally, the development of incremental learning strategies and domain adaptation techniques will extend the framework’s applicability to evolving, real-world scenarios.
In conclusion, our multisource data fusion approach using MLP provides a powerful framework for enhancing the accuracy and reliability of HAR systems. By addressing the challenges posed by dataset variability and model adaptability, this study contributes significantly to the field, offering a pathway toward more sophisticated and adaptable HAR solutions.
Acknowledgement: The authors would like to thank Li Guo for their invaluable assistance in improving the academic writing style. Special thanks to Nasir Memon for facilitating collaboration with the Computer Science, Data Science, and Engineering departments at NYU Shanghai. We also extend our gratitude to Michael Cote for his thorough proofreading of the manuscript.
Funding Statement: This paper was supported by the Royal Golden Jubilee (RGJ) Ph.D. Programme (Grant No. PHD/0079/2561), through the National Research Council of Thailand (NRCT) and Thailand Research Fund (TRF).
Author Contributions: The authors confirm contribution to the paper as follows: study conception and design: Sujittra Sarakon, Kreangsak Tamee, and Wansuree Massagram; methodology, Sujittra Sarakon; analysis and interpretation of results: Sujittra Sarakon, Kreangsak Tamee; draft manuscript preparation: Sujittra Sarakon. All authors reviewed the results and approved the final version of the manuscript.
Availability of Data and Materials: The datasets used in this study are publicly available at the following links: WISDM (https://www.cis.fordham.edu/wisdm/includes/datasets/latest/WISDM_ar_latest.tar.gz), MotionSense (https://github.com/mmalekzadeh/motion-sense), DaLiAc (https://www.mad.tf.fau.de/research/activitynet/daliac-daily-life-activities/), and PAMAP2 (https://archive.ics.uci.edu/static/public/231/pamap2+physical+activity+monitoring.zip). These datasets are open for research and were utilized in compliance with their respective terms, accessed in January 2024. The implementation for this study is available at: https://github.com/sujittra/Data-Fusion.git.
Ethics Approval: This research utilized publicly available datasets (WISDM, MotionSense, DaLiAc, and PAMAP2), which contain anonymized sensor data from human participants. As the data are fully anonymized and publicly accessible, no additional ethics approval was required for this study.
Conflicts of Interest: The authors declare no conflicts of interest to report regarding the present study.
References
1. Zhang S, Li Y, Zhang S, Shahabi F, Xia S, Deng Y, et al. Deep learning in human activity recognition with wearable sensors: a review on advances. Sensors. 2022;22(4):1476. doi:10.3390/s22041476. [Google Scholar] [PubMed] [CrossRef]
2. Vidya B, Sasikumar P. Wearable multi-sensor data fusion approach for human activity recognition using machine learning algorithms. Sens Actuators A Phys. 2022 Jul;341:113557. doi:10.1016/j.sna.2022.113557. [Google Scholar] [CrossRef]
3. Wang Y, Cang S, Yu H. A survey on wearable sensor modality centred human activity recognition in health care. Expert Syst Appl. 2019 Dec;137:167–90. doi:10.1016/j.eswa.2019.04.057. [Google Scholar] [CrossRef]
4. Ali F, El-Sappagh S, Islam SR, Kwak D, Ali A, Imran M, et al. A smart healthcare monitoring system for heart disease prediction based on ensemble deep learning and feature fusion. Inf Fusion. 2020;63:208–22. doi:10.1016/j.inffus.2020.06.008. [Google Scholar] [CrossRef]
5. Majidzadeh Gorjani O, Byrtus R, Dohnal J, Bilik P, Koziorek J, Martinek R. Human activity classification using multilayer perceptron. Sensors. 2021 Jan;21(18):6207. doi:10.3390/s21186207. [Google Scholar] [PubMed] [CrossRef]
6. Jalal A, Quaid MAK, Tahir SB, Kim K. A study of accelerometer and gyroscope measurements in physical life-log activities detection systems. Sensors. 2020 Nov;20(22):6670. doi:10.3390/s20226670. [Google Scholar] [PubMed] [CrossRef]
7. Nayak S, Panigrahi C, Pati B, Nanda S, Hsieh M-Y. Comparative analysis of HAR datasets using classification algorithms. Comput Sci Inf Syst. 2022;19(1):47–63. doi:10.2298/CSIS201221043N. [Google Scholar] [CrossRef]
8. Haresamudram H, Essa I, Plötz T. Assessing the state of self-supervised human activity recognition using wearables. Proc ACM Interact Mobile Wearable Ubiquitous Technol. 2022 Sep;6(3):1–47. doi:10.1145/3550299. [Google Scholar] [CrossRef]
9. Yuan G, Wang Z, Meng F, Yan Q, Xia S. An overview of human activity recognition based on smartphone. Sens Rev. 2019;39(2):288–306. doi:10.1108/SR-11-2017-0245. [Google Scholar] [CrossRef]
10. Saha U, Saha S, Kabir T, Fattah SA, Saquib M. Decoding human activities: analyzing wearable accelerometer and gyroscope data for activity recognition. arXiv:2310.02011. 2024. doi:10.48550/arXiv.2310.02011. [Google Scholar] [CrossRef]
11. Wan S, Qi L, Xu X, Tong C, Gu Z. Deep learning models for real-time human activity recognition with smartphones. Mob Netw Appl. 2020 Apr;25(2):743–55. doi:10.1007/s11036-019-01445-x. [Google Scholar] [CrossRef]
12. Lai Y, Chiang S, Kan Y, Lin H. Smart healthcare activity recognition using statistical regression and intelligent learning. Comput Mater Continua. 2024;78(1):1189–205. doi:10.32604/cmc.2023.034815. [Google Scholar] [CrossRef]
13. Nweke HF, Teh YW, Mujtaba G, Alo UR, Al-garadi MA. Multi-sensor fusion based on multiple classifier systems for human activity identification. Hum Centric Comput Inf Sci. 2019 Dec;9(1):34. doi:10.1186/s13673-019-0194-5. [Google Scholar] [CrossRef]
14. Adaimi R, Bedri A, Gong J, Kang R, Arreaza-Taylor J, Pascual G-M, et al. Advancing location-invariant and device-agnostic motion activity recognition on wearable devices. arXiv:2402.03714. 2024. doi:10.48550/arXiv.2402.03714. [Google Scholar] [CrossRef]
15. Lai Y-C, Chiang S-Y, Kan Y-C, Lin H-C. Coupling analysis of multiple machine learning models for human activity recognition. Comput Mater Continua. 2024;79(3):3783–803. doi:10.32604/cmc.2024.050376. [Google Scholar] [CrossRef]
16. Mishra S, Pal S. EAR: an energy efficient human activity recognition from wearable devices. In: 2023 IEEE Globecom Workshops (GC Wkshps); 2023 Dec; IEEE; p. 1826–31. [Google Scholar]
17. Liu M. Impedance sensing-centered pervasive and wearable activity recognition on edge devices. In: 2024 IEEE International Conference on Pervasive Computing and Communications Workshops and other Affiliated Events (PerCom Workshops); 2024 Mar; IEEE; p. 368–9. [Google Scholar]
18. Hutabarat JP, Ahmadi N, Adiono T. Human activity recognition based on wearable devices and feedforward neural networks. In: 2023 International Conference on Electrical Engineering and Informatics (ICEEI); 2023 Oct. p. 1–4. [Google Scholar]
19. Gkountelos D, Kokhazadeh M, Bournas C, Keramidas G, Kelefouras V. Towards highly compressed CNN models for human activity recognition in wearable devices. In: 2023 Signal Processing: Algorithms, Architectures, Arrangements, and Applications (SPA); 2023 Sep. p. 83–8. [Google Scholar]
20. Dirgová Luptáková I, Kubovčík M, Pospíchal J. Wearable sensor-based human activity recognition with transformer model. Sensors. 2022 Mar;22(5):1911. doi:10.3390/s22051911. [Google Scholar] [PubMed] [CrossRef]
21. Mazzia V, Angarano S, Salvetti F, Angelini F, Chiaberge M. Action transformer: a self-attention model for short-time pose-based human action recognition. Pattern Recognit. 2022 Apr;124:108487. doi:10.1016/j.patcog.2021.108487. [Google Scholar] [CrossRef]
22. Mario M-O. Human activity recognition based on single sensor square HV acceleration images and convolutional neural networks. IEEE Sens J. 2019 Feb;19(4):1487–98. doi:10.1109/JSEN.2018.2882943. [Google Scholar] [CrossRef]
23. Parida L, Parida BR, Mishra MR, Jayasingh SK, Samal T, Ray S. A novel approach for human activity recognition using vision based method. In: 2023 1st International Conference on Circuits, Power and Intelligent Systems (CCPIS); 2023 Sep; IEEE. p. 1–5. [Google Scholar]
24. Browne D, Gierin M, Prestwich S. Deep learning human activity recognition. In: Curry E, Keane M, Ojo A, Salwala D, editors. Proceedings for the 27th AIAI Irish Conference on Artificial Intelligence and Cognitive Science, ser. CEUR Workshop Proceedings. vol. 2563. Galway, Ireland: CEUR; 2019 Dec. p. 76–87. [Google Scholar]
25. Jannat M, Karim R, Islam NZ, Chy AN, Muhammad Masum AK. Human activity recognition using ensemble of CNN-based transfer learning models. In: IEEE International Conference on Computing (ICOCO); 2023 Oct; IEEE; p. 112–7. [Google Scholar]
26. Yu Z, Zahid A, Taha A, Taylor W, Kernec JL, Heidari H, et al. An intelligent implementation of multi-sensing data fusion with neuromorphic computing for human activity recognition. IEEE Internet Things J. 2023 Jan;10(2):1124–33. doi:10.1109/JIOT.2022.3204581. [Google Scholar] [CrossRef]
27. Feng X, Weng Y, Li W, Chen P, Zheng H. DAMUN: a domain adaptive human activity recognition network based on multimodal feature fusion. IEEE Sens J. 2023 Sep;23(18):22019–30. doi:10.1109/JSEN.2023.3300357. [Google Scholar] [CrossRef]
28. Meng F, Liu H, Liang Y, Tu J, Liu M. Sample fusion network: an end-to-end data augmentation network for skeleton-based human action recognition. IEEE Trans Image Process. 2019 Nov;28(11):5281–95. doi:10.1109/TIP.2019.2913544. [Google Scholar] [PubMed] [CrossRef]
29. Cengiz AB, Birant KU, Cengiz M, Birant D, Baysari K. Improving the performance and explainability of indoor human activity recognition in the internet of things environment. Symmetry. 2022 Oct;14(10):2022. doi:10.3390/sym14102022. [Google Scholar] [CrossRef]
30. Mekruksavanich S, Jitpattanakul A. Deep residual network with a CBAM mechanism for the recognition of symmetric and asymmetric human activity using wearable sensors. Symmetry. 2024 May;16(5):554. doi:10.3390/sym16050554. [Google Scholar] [CrossRef]
31. Bian S, Liu M, Zhou B, Lukowicz P. The state-of-the-art sensing techniques in human activity recognition: a survey. Sensors. 2022 Jan;22(12):4596. doi:10.3390/s22124596. [Google Scholar] [PubMed] [CrossRef]
32. Lockhart JW, Weiss GM, Xue JC, Gallagher ST, Grosner AB, Pulickal TT. Design considerations for the WISDM smart phone-based sensor mining architecture. In: Proceedings of the Fifth International Workshop on Knowledge Discovery from Sensor Data; 2011; Association for Computing Machinery. p. 25–33. [Google Scholar]
33. Malekzadeh M, Clegg RG, Cavallaro A, Haddadi H. Mobile sensor data anonymization. In: Proceedings of the International Conference on Internet of Things Design and Implementation. Montreal, QC, Canada: ACM; 2019 Apr. p. 49–58. Available from: https://dl.acm.org/doi/10.1145/3302505.3310068. [Google Scholar]
34. Leutheuser H, Schuldhaus D, Eskofier BM. Hierarchical, multi-sensor based classification of daily life activities: comparison with state-of-the-art algorithms using a benchmark dataset. PLoS One. 2013;8(10):11. doi:10.1371/journal.pone.0075196. [Google Scholar] [PubMed] [CrossRef]
35. Reiss A, Stricker D. Creating and benchmarking a new dataset for physical activity monitoring. In: Proceedings of the 5th International Conference on PErvasive Technologies Related to Assistive Environments; 2012; Association for Computing Machinery. p. 1–8. [Google Scholar]
36. Heydarian M, Doyle TE. rWISDM: repaired WISDM, a public dataset for human activity recognition. arXiv:2305.10222v1. 2023. [Google Scholar]
37. Kaya Y, Topuz EK. Human activity recognition from multiple sensors data using deep CNNs. Multimed Tools Appl. 2023 Jun;83(4):10815–38. doi:10.1007/s11042-023-15830-y. [Google Scholar] [CrossRef]
38. Gaud N, Rathore M, Suman U. Hybrid deep learning-based human activity recognition (HAR) using wearable sensors: an edge computing approach. In: Swaroop A, Polkowski Z, Correia SD, Virdee B, editors. Proceedings of Data Analytics and Management. ICDAM 2023. Lecture Notes in Networks and Systems. Singapore: Springer; 2024 Jan. Vol. 785. doi: 10.1007/978-981-99-6544-1_30. [Google Scholar] [CrossRef]
39. Debache I, Jeantet L, Chevallier D, Bergouignan A, Sueur C. A lean and performant hierarchical model for human activity recognition using body-mounted sensors. Sensors. 2020 May;20(11):3090. doi:10.3390/s20113090. [Google Scholar] [PubMed] [CrossRef]
40. Nguyen ND. Feature selection in recognizing daily living activities based on metabolic equivalent. Int J Adv Trends Comput Sci Eng. 2020 Apr;9(2):1729–31. doi:10.30534/ijatcse/2020/125922020. [Google Scholar] [CrossRef]
41. Vuong TH, Doan T, Takasu A. Deep wavelet convolutional neural networks for multimodal human activity recognition using wearable inertial sensors. Sensors. 2023 Dec;23(24):9721. doi:10.3390/s23249721. [Google Scholar] [PubMed] [CrossRef]
42. Ibrar K, Shaikh A, Zafar S. Multi attributes recognition from human gait analysis using MotionSense dataset. In: 2022 Mohammad Ali Jinnah University International Conference on Computing (MAJICC); 2022 Oct. p. 1–6. [Google Scholar]
43. Hossain MA, Ray SK, Islam N, Alamin A, Hasan MAR. Enhanced human activity recognition through deep multi-layer perceptron on the UCI-HAR dataset. Int J Adv Appl Sci. 2024 Jun;13(2):429–38. doi:10.11591/ijaas.v13.i2. [Google Scholar] [CrossRef]
Cite This Article
 Copyright © 2025 The Author(s). Published by Tech Science Press.
This work is licensed under a Creative Commons Attribution 4.0 International License , which permits unrestricted use, distribution, and reproduction in any medium, provided the original work is properly cited.
 Downloads
 Citation Tools