
 Submit a Paper
 Propose a Special lssue
 Open Access
ARTICLE

Hybrid MNLTP Texture Descriptor and PDCNN-Based OCT Image Classification for Retinal Disease Detection
1 Department of E&TC, Symbiosis Institute of Technology, Pune Campus, Symbiosis International (Deemed University), Pune, 412115, India
2 Symbiosis Skills and Professional University, School of Mechatronics, Pune, 412101, India
3 Department of Electrical Engineering, College of Engineering, Princess Nourah bint Abdulrahman University, P.O. Box 84428, Riyadh, 11671, Saudi Arabia
4 Department of Electrical Engineering, College of Engineering, King Khalid University, Abha, 61421, Saudi Arabia
5 Center for Engineering and Technology Innovations, King Khalid University, Abha, 61421, Saudi Arabia
* Corresponding Author: Anurag Mahajan. Email:
Computers, Materials & Continua 2025, 82(2), 2831-2847. https://doi.org/10.32604/cmc.2025.059350
Received 04 October 2024; Accepted 02 January 2025; Issue published 17 February 2025
 View Full Text
 Download PDF
Abstract
Retinal Optical Coherence Tomography (OCT) images, a non-invasive imaging technique, have become a standard retinal disease detection tool. Due to disease, there are morphological and textural changes in the layers of the retina. Classifying OCT images is challenging, as the morphological manifestations of different diseases may be similar. The OCT images capture the reflectivity characteristics of the retinal tissues. Retinal diseases change the reflectivity property of retinal tissues, resulting in texture variations in OCT images. We propose a hybrid approach to OCT image classification in which the Convolution Neural Network (CNN) model is trained using Multiple Neighborhood Local Ternary Pattern (MNLTP) texture descriptors of the OCT images dataset for a robust disease prediction system. Parallel deep CNN (PDCNN) is proposed to improve feature representation and generalizability. The MNLTP-PDCNN model is tested on two publicly available datasets. The parameter values Accuracy, Precision, Recall, and F1-Score are calculated. The best accuracy obtained specifying the model’s overall performance is 93.98% and 99% for the NEH and OCT2017 datasets, respectively. With the proposed architecture, comparable performance is obtained with a subset of the original OCT2017 data set and a comparatively smaller number of trainable parameters (1.6 million, 1.8 million, and 2.3 million for a single CNN branch, two parallel CNN branches, and three parallel network branches, respectively), compared to off-the-shelf CNN models. Hence, the proposed approach is suitable for real-time OCT image classification systems with fast training of the CNN model and reduced memory requirement for computations.Keywords
In ophthalmology, OCT images have become a standard tool for screening and detecting retinal eye diseases [1]. Optical Coherence Tomography (OCT) is a non-invasive, comparatively recent tool used by ophthalmologists to get information about deformation in retinal structure due to any retinal pathology and the effect of treatment, the pattern of disease advancement, etc. The literature study on retinal OCT image analysis shows that a large volume of OCT image data is being generated due to the availability of cost-effective portable OCT machines and increasing awareness for screening of the retina to detect diseases. As the number of OCT image acquisitions increases, manually evaluating a large volume of OCT data is tedious [2] and subject to intra- and inter-observer variability. It has drawn the attention of researchers to develop an automated retinal disease detection system that will be less prone to human factors such as fatigue, mindset, and bias to assist the ophthalmologist in screening and eye disease detection.
Diabetic macular edema (DME) and age-related macular degeneration (AMD) are the two most common diseases by which the world’s majority population is affected. The deformation of the retinal structure is apparent in OCT images before the symptoms appear. AMD is declared a priority eye disease by the World Health Organization. Due to the aging population, the number of people suffering from eye diseases is rising. WHO strongly recommends frequent and early screening to prevent vision loss. If left untreated, the most common retinal diseases that can cause severe vision loss are DRUSEN/AMD, CNV (choroidal neovascularization), and DME. Drusen is the early stage AMD, where yellow protein deposition occurs, which can be very small or medium. In DME, glucose buildup occurs between the layers of the retina. In the case of CNV, also known as wet AMD, blood vessels grow in the retinal layers [3].
The majority of the OCT image classification work is focused on using deep learning for the segmentation of retinal layers and using changes in the thickness of layers due to diseases as a marker for diseases. However, the segmentation of layers is challenging in the case of a damaged retina due to disease. Also, the scale and shape of lesions vary in the case of the same diseases, So classifying grayscale OCT images for retinal disease detection is challenging. The retinal diseases change the reflectivity property of the retinal tissues. The texture descriptors encode local intensity or brightness variation between the neighborhood pixels. It gives information about smoothness/roughness or regularity as human eyes perceive. The texture variation in the OCT images due to diseases can be considered a robust marker for disease detection. For the texture analysis of the images, the various methods used are LBP (local binary pattern), GLCM (grey level co-occurrence matrix), Gabor filter, Histogram of oriented gradients (HOG), and fractal dimensions based, etc. [4].
This study proposed A hybrid model with a modified LTP (Local Ternary Patterns) texture descriptor, MNLTP, and parallel deep convolutional neural network (PDCNN) for multiclass OCT image classification.
1. The proposed MNLTP texture descriptor can encode complex localized texture information with three levels of coding 0, 1, and −1 and investigate the effect of neighboring pixels at different radii.
2. The PDCNN model, with low complexity and a small number of trainable parameters, is directly trained with two-channel texture descriptors (Upper and lower MNLTP) of the OCT images for robust classification. PDCNN architecture helps to improve the feature representation and generalizability of the CNN model.
The paper is organized as follows: Section 2 presents the review of related works, Section 3 presents methods and material, and Sections 4 and 5 give details of datasets and experimentation performed, respectively. Section 6 contains the results and discussion, and the conclusion is given in Section 7.
In Traditional image classification with machine learning, handcrafted features are extracted from the OCT images and given as input to different classifiers It requires domain expertise, and the distinctive classification features vary with the datasets. The effective classifiers used for classification using handcrafted features are the Random Forest algorithm and the Support Vector machine.
Apart from the feature engineering-based approach, nowadays, CNN-based classification has gained attention [5,6] as it eliminates the need for domain expertise to extract features. CNN models automatically build the feature map from the training data provided. CNN is sensitive to illumination, rotation, etc., and learns the structural features from computationally intense training [5]. In some published work, CNN models are used for feature extraction. Then, the most distinctive features for classification are selected using an algorithm like ant colony optimization. Thus, the best-selected features are given to traditional classifiers like support vector machine and k-NN (K-Nearest Neighbor) etc. [5]. This approach combines Deep learning as the first stage and traditional machine learning as the second or output stage. In recent years, the classification of OCT images into four classes (Normal, Drusen, CNV, and DME) using deep learning models has been the most researched topic using the large public dataset available OCT2017 (84,485 images). The deep learning models are generally selected from popular pre-trained models: ResNet-50, DenseNet, InceptionV3, GoogleNet, ResNet, etc. [7]. These are fine-tuned to the OCT dataset, as in transfer learning [8,9]. The other deep learning approach is the ensemble of classifiers, which extract different types of features. Finally, the fusion of the extracted features by different CNN classifiers is carried out to classify the OCT images. multiscale feature extraction is also helpful in improving the performance of the OCT images, as distinctive features may be available at different scales [10–12]. Initial work on OCT image classification considered binary classification problems like the prevalence of only AMD or DME [5,13]. If sufficient data of a particular pathology is unavailable for training, Data augmentation using GAN (Generative Adversarial Network) is also researched [14]. These models yield good results but require large datasets and should be trained for a large number of trainable parameters.
Texture analysis helps to get inside localized spatial relationships among the pixels of the image and find any particular pattern in the arrangement of the pixels. The texture of an image gives more information than the other features of the image [15]. In general terms, texture analysis provides quantitative information about the degree of smoothness and roughness of images. For this, It mainly considers the variation of intensities of the pixels on the grey scale levels.
Local Binary Pattern (LBP) [16] is a prevalent tool for statistical texture analysis, generally used for grayscale images. LBP represents an image’s local features by encoding the relationship between the pixel and its neighboring pixels.
In LBP, the relationship between the pixels and the central pixel of the selected window is encoded by using two value representations, 0 or 1. i.e., encoding the texture feature uses two-level, binary encoding, which may not be sufficient to encode the detailed or complex texture information. It is also more susceptible to noise in the images. So, the three-level encoding, i.e., Local Ternary Pattern (LTP), was proposed [15]. LBP is used in many medical image analyses for classification and anomaly detection [17]. In [17], binary classification was implemented to classify the normal and other macular diseases like AMD, MH (macular hole), and ME (macular edema) using a histogram of LBP with PCA (Principal Component Analysis). Then, the SVM (Support Vector Machine) is used to identify each disease using a binary classification model. In [18], the LBP is used with linear and non-linear classifiers, and the effect of various pre-processing methods is studied.
Initially, LTP was introduced as a solution to the noise sensitivity of the LBP texture feature descriptor [19]. It uses three levels to encode the relationship between neighboring pixels, unlike two levels in LBP. So, it is capable of encoding more complex texture information. In LTP, the neighborhood (1 to n) pixel values of a central pixel of the selected window are replaced by three values as 0, 1, and −1 as follows:
where the
OCT images capture the reflectivity characteristics of retinal tissues, expressed in the B-scans by the brightness of the individual pixels. The different retinal layers have different refractive indices. The comparison between OCT scans of a healthy retina and a diseased retina can show two differences. First, it shows shape or structural deformations in the retinal layers of the diseased retina that are generally captured by segmentation or by global feature extraction by the CNN model. Secondly, there can be variations in the texture of the images due to changes in “contrast” or “intensity” of the different layers with healthy and diseased retinas.
Texture analysis refers to locating pixels with different intensity values in an image neighborhood. Texture descriptors explore the relationship between specific pixels and their neighbors and evaluate the homogeneity of the structure. Thus, differences in texture descriptors of normal and abnormal retinal tissue provide distinctive additional information for disease detection.
In healthy retinal OCT images, generally, nine layers are visible. However, due to pathology, the retinal layer structure is damaged, like a change in the thickness of retinal layers, the inability to determine the boundaries of the retinal layers, and the segmentation of retinal layers is also challenging [11].
The changes that happen due to specific diseases cannot be clearly defined. In the case of diseases like DME and CNV, manifestations are very similar. Also, manifestations of early Drusen, compared to normal, are not easily distinguishable. In the problem of classification, extracting prominent discriminative features is an important task and CNN models are very popular for automatically extracting features from the training data [21]. In deep CNN models, initial layers capture low-level features, and then high-level features are extracted from the last few layers; these high-level features, also known as global features of the class, are used for classification tasks. Majorly, it learns the global features, which are generally morphological or structural deformations in the retinal layers due to the different diseases [20]. In such cases, besides the structural changes, if we consider the texture changes due to various diseases, it can be a more robust way of classifying OCT images.
The generalized framework of the work implementation is given in Fig. 1. Based on the quality of the dataset, required dataset cleaning, selection/sampling from the dataset and resizing of the images can be carried out. The OCT images are resized to
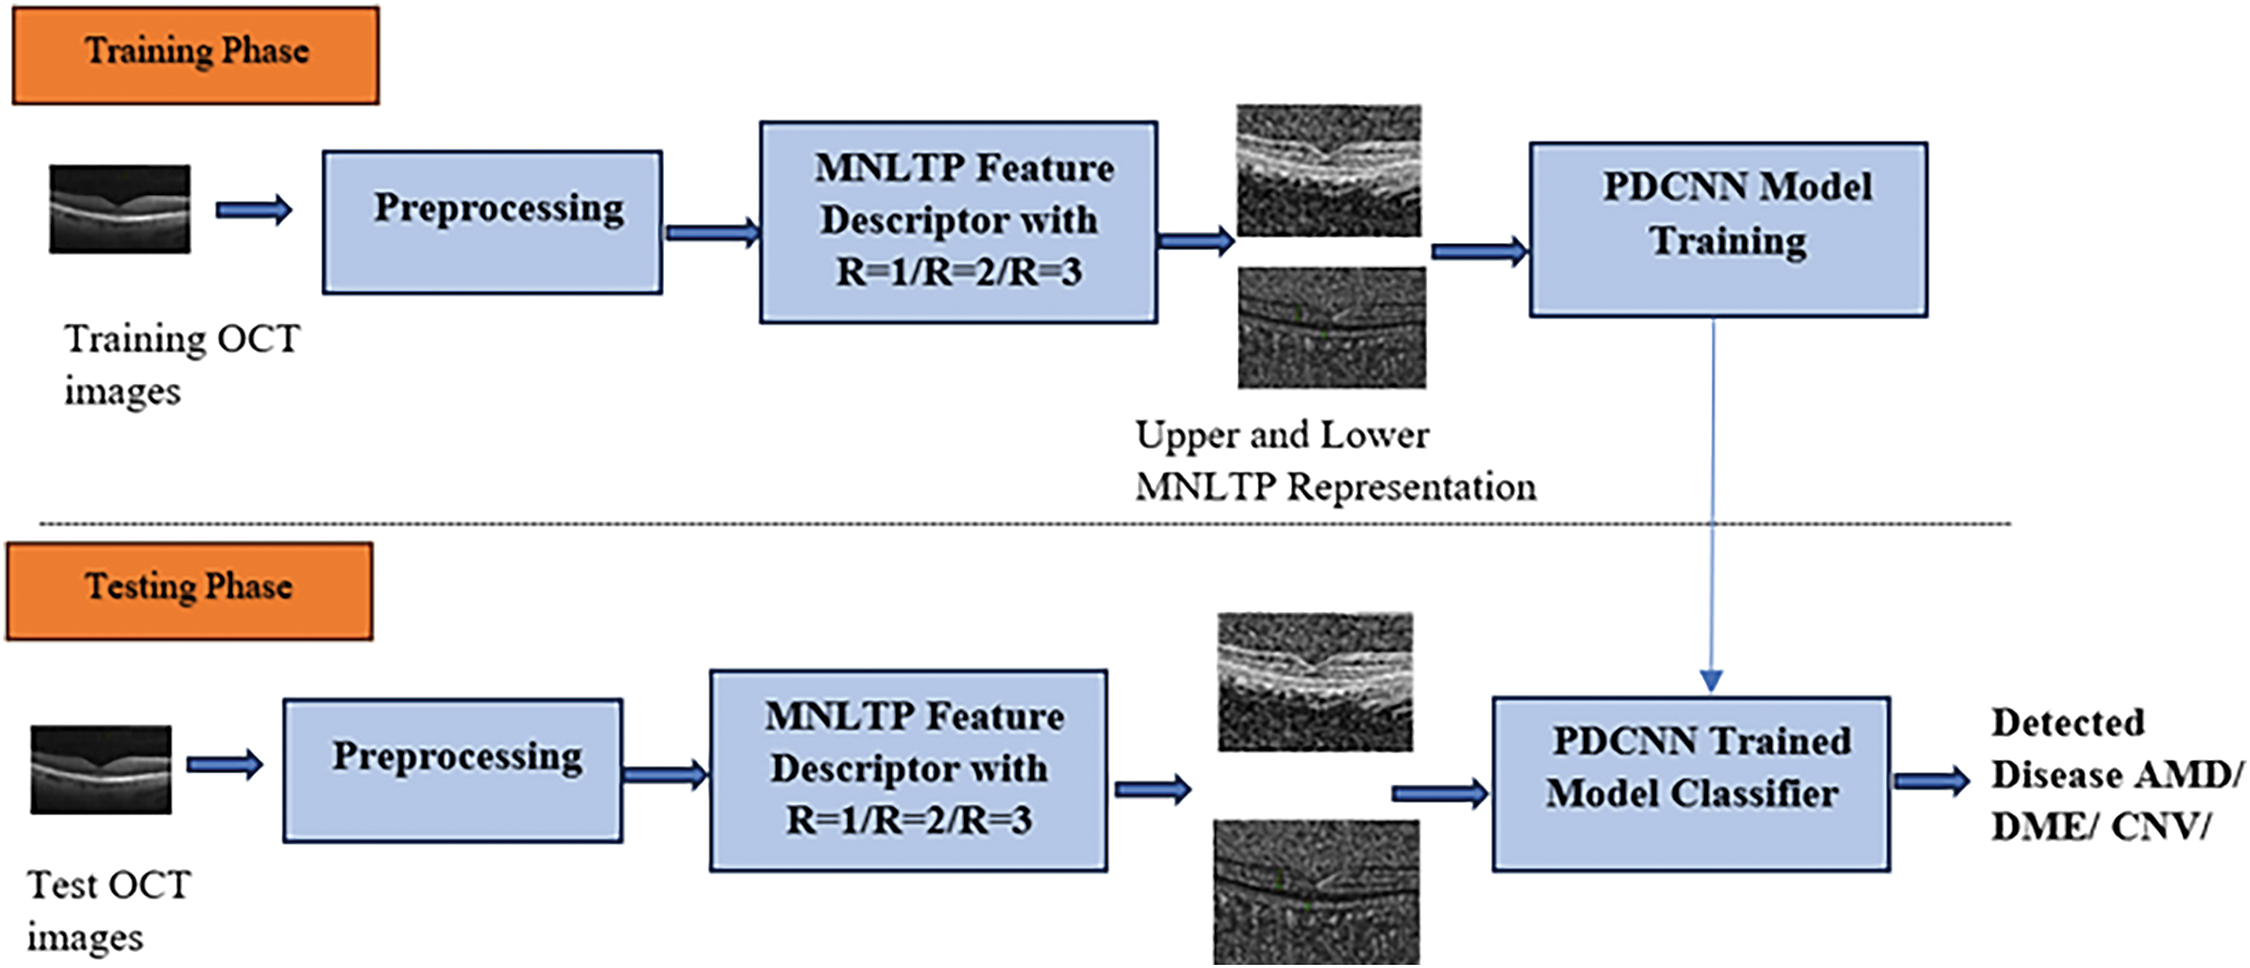
Figure 1: Generalized framework of MNLTP and PDCNN based OCT image classification
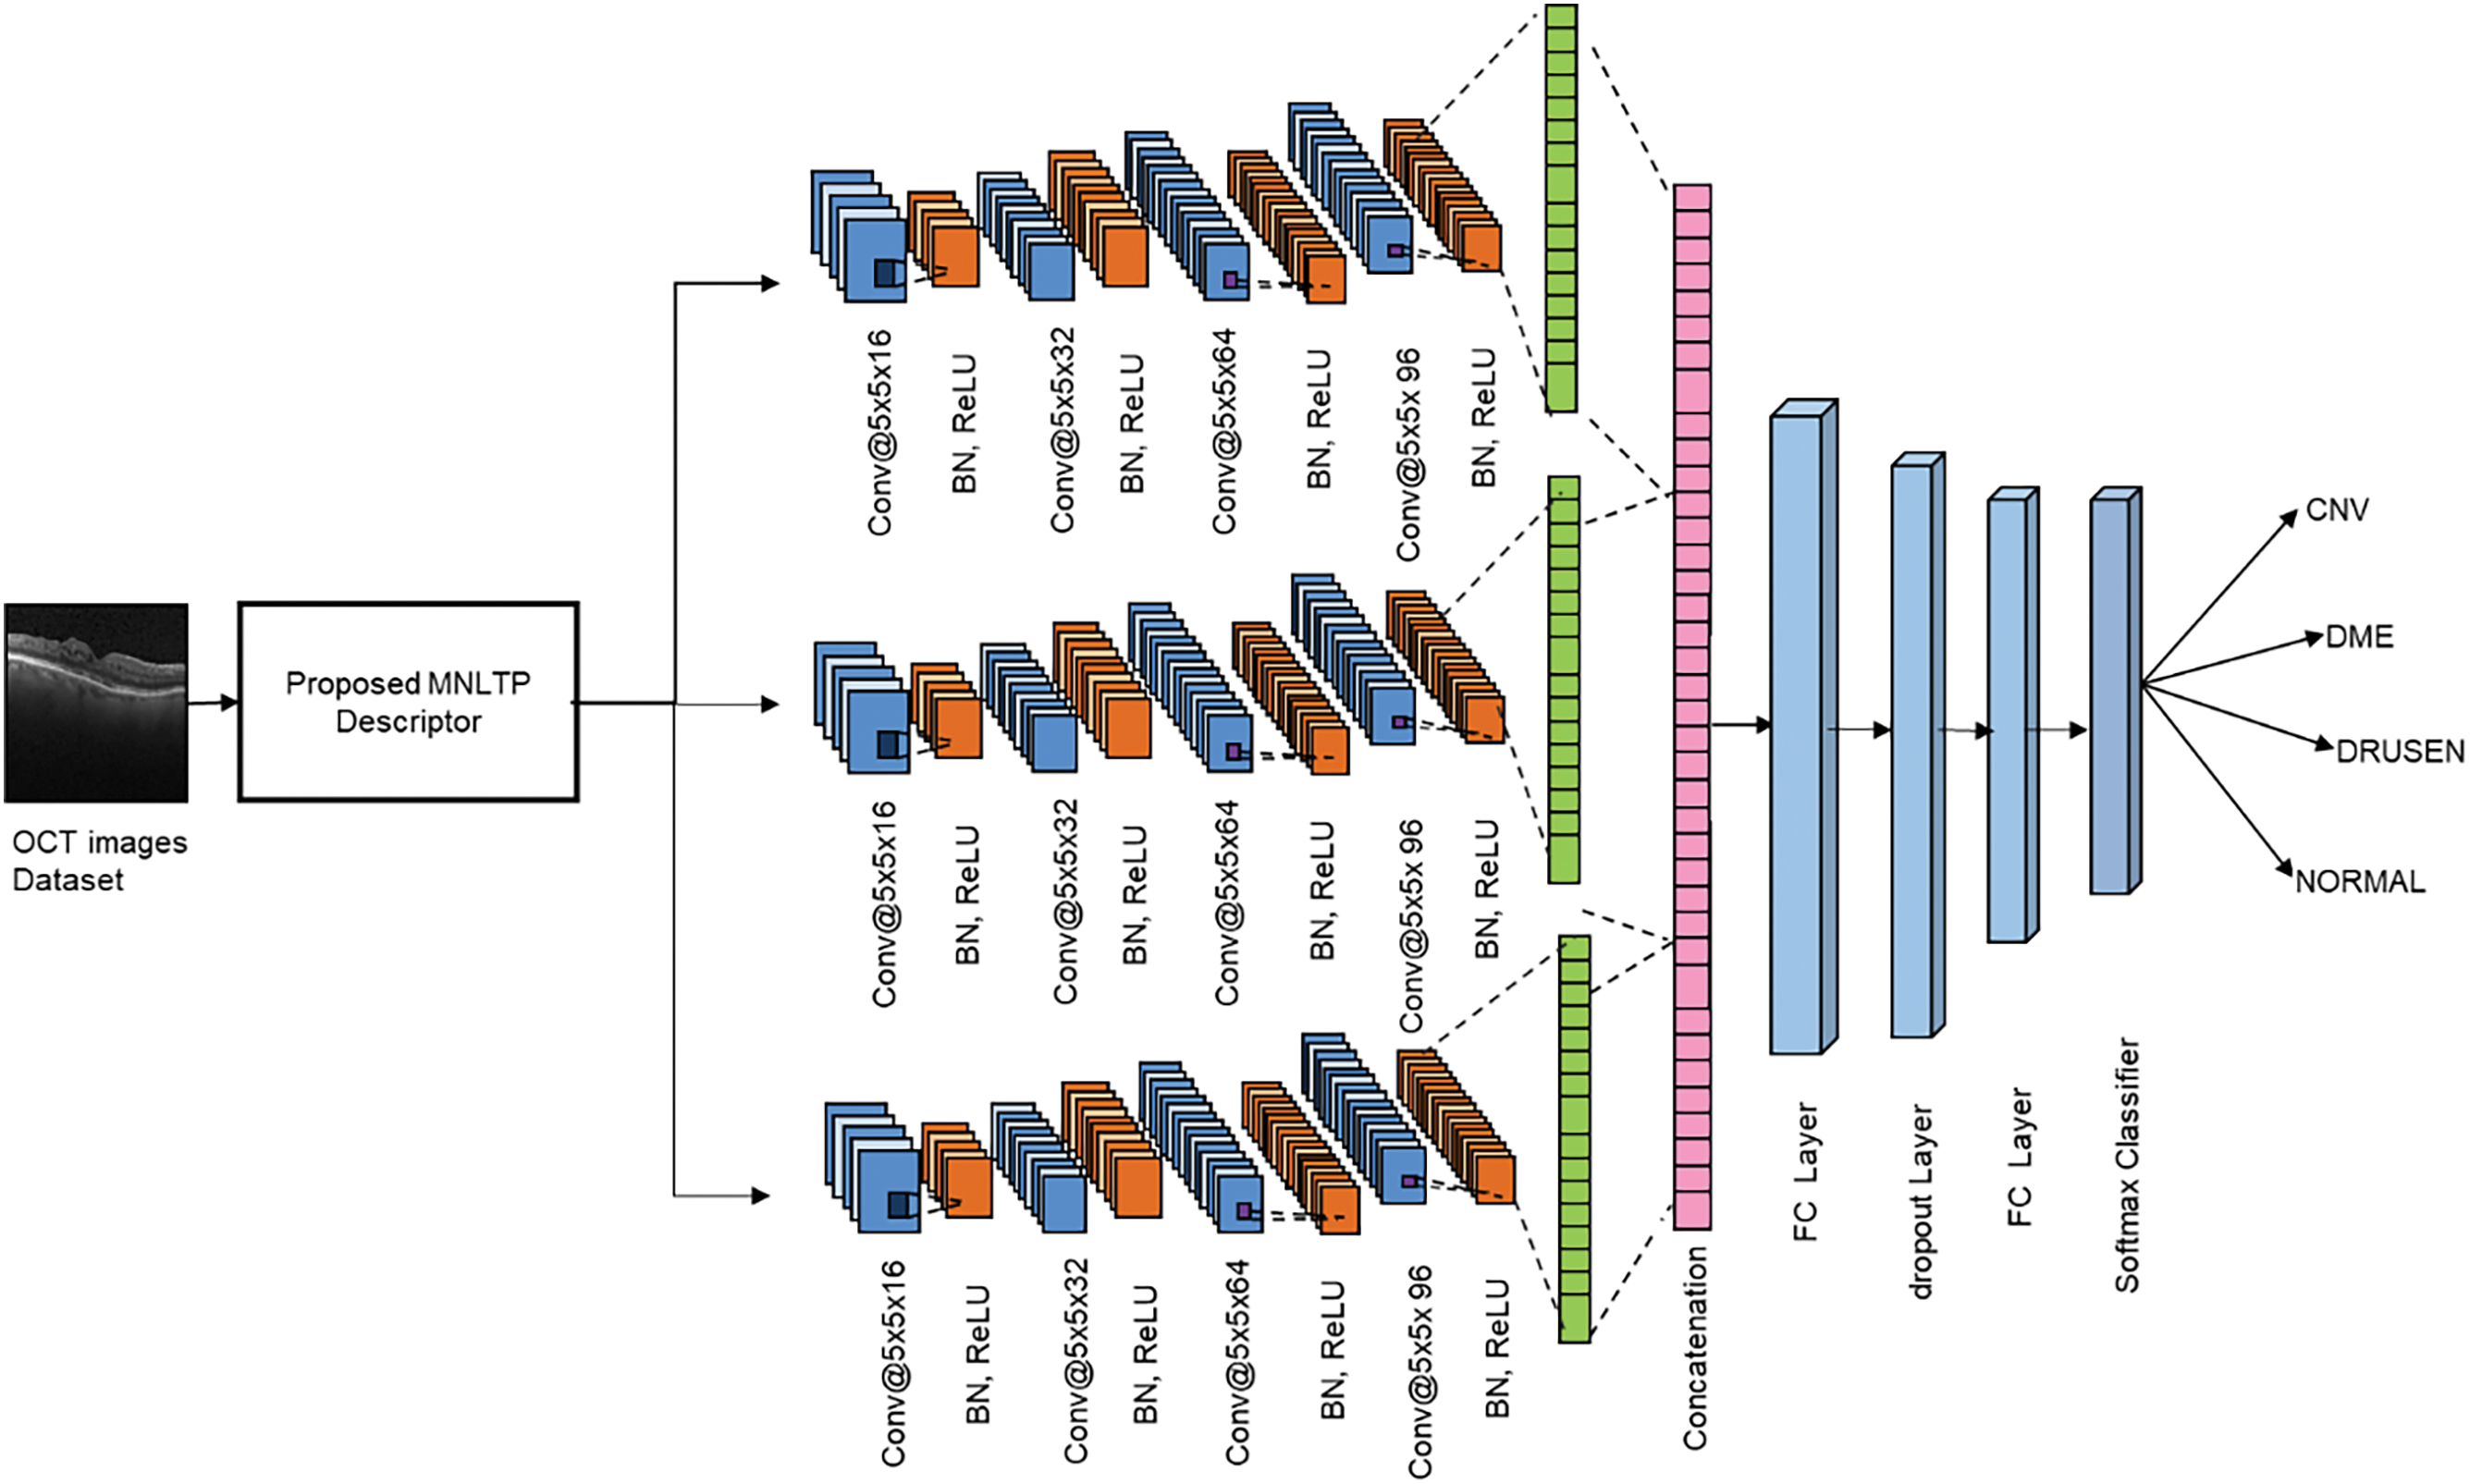
Figure 2: Proposed PDCNN architecture
3.1 Multiple Neighborhood Local Ternary Pattern (MNLTP)
In local ternary pattern, texture information is encoded using three levels of intensities (+1, 0 and −1). It has finer texture analysis capabilities, allowing for more detailed texture discrimination. So, capturing subtle variations carries diagnostic significance. The ability of LTP to provide fine-grained texture information is very useful in medical imaging (like OCT images), where subtle variations may have diagnostic relevance.
Texture descriptors of images using LTP can be obtained by considering different levels of the central pixel’s neighborhood (radius R) pixels, as shown in Figs. 3 and 4. The LTP operator with a window of
where
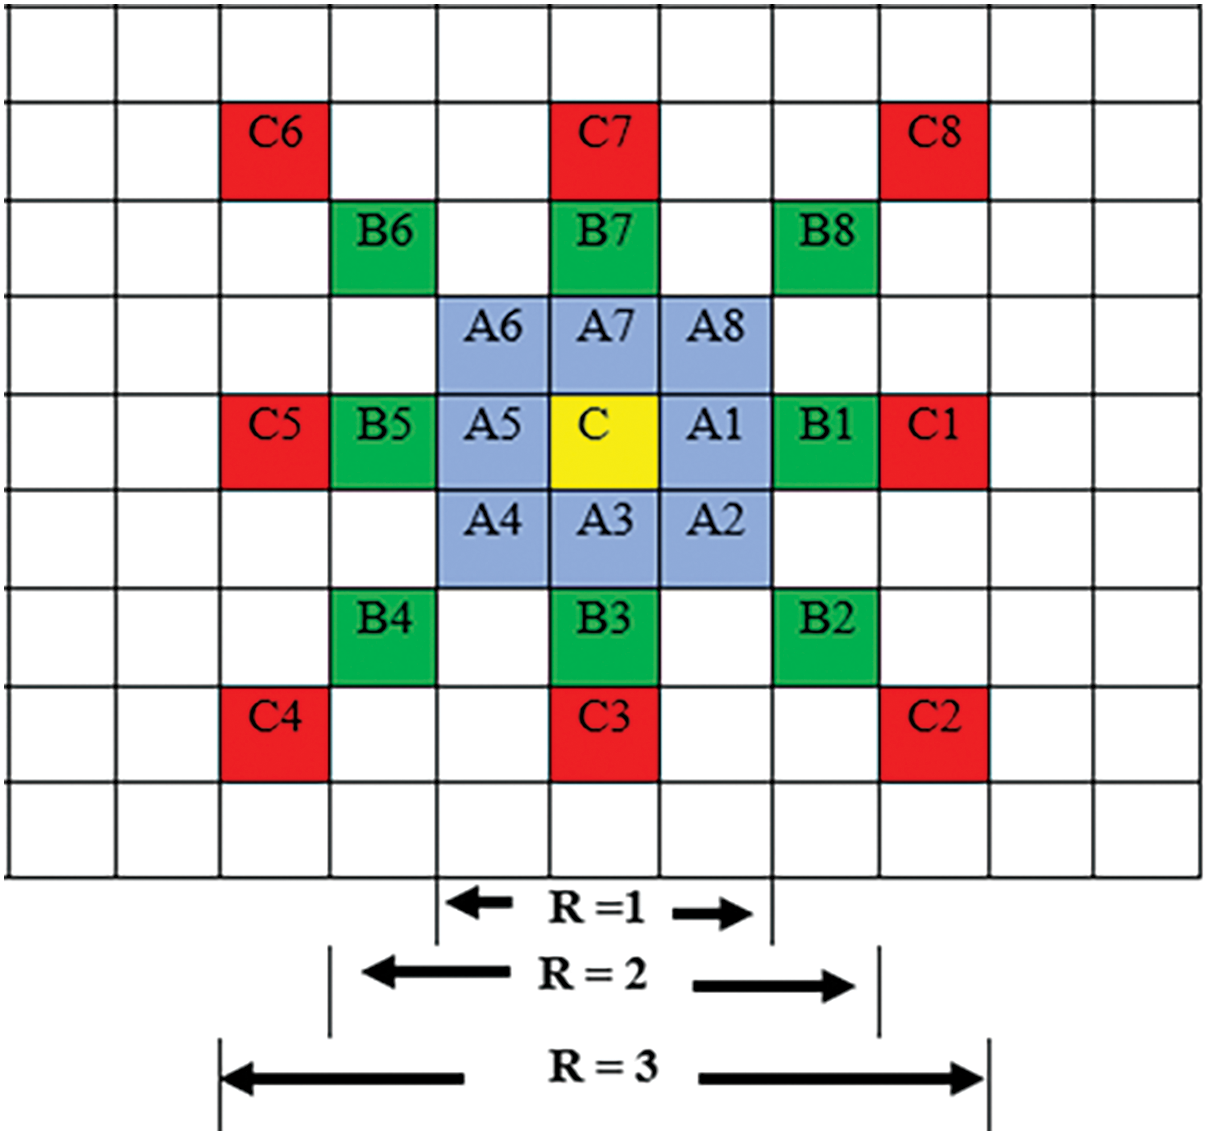
Figure 3: Multiple neighborhoods for R = 1, 2, and 3 for central pixel C in 8 directions (windows
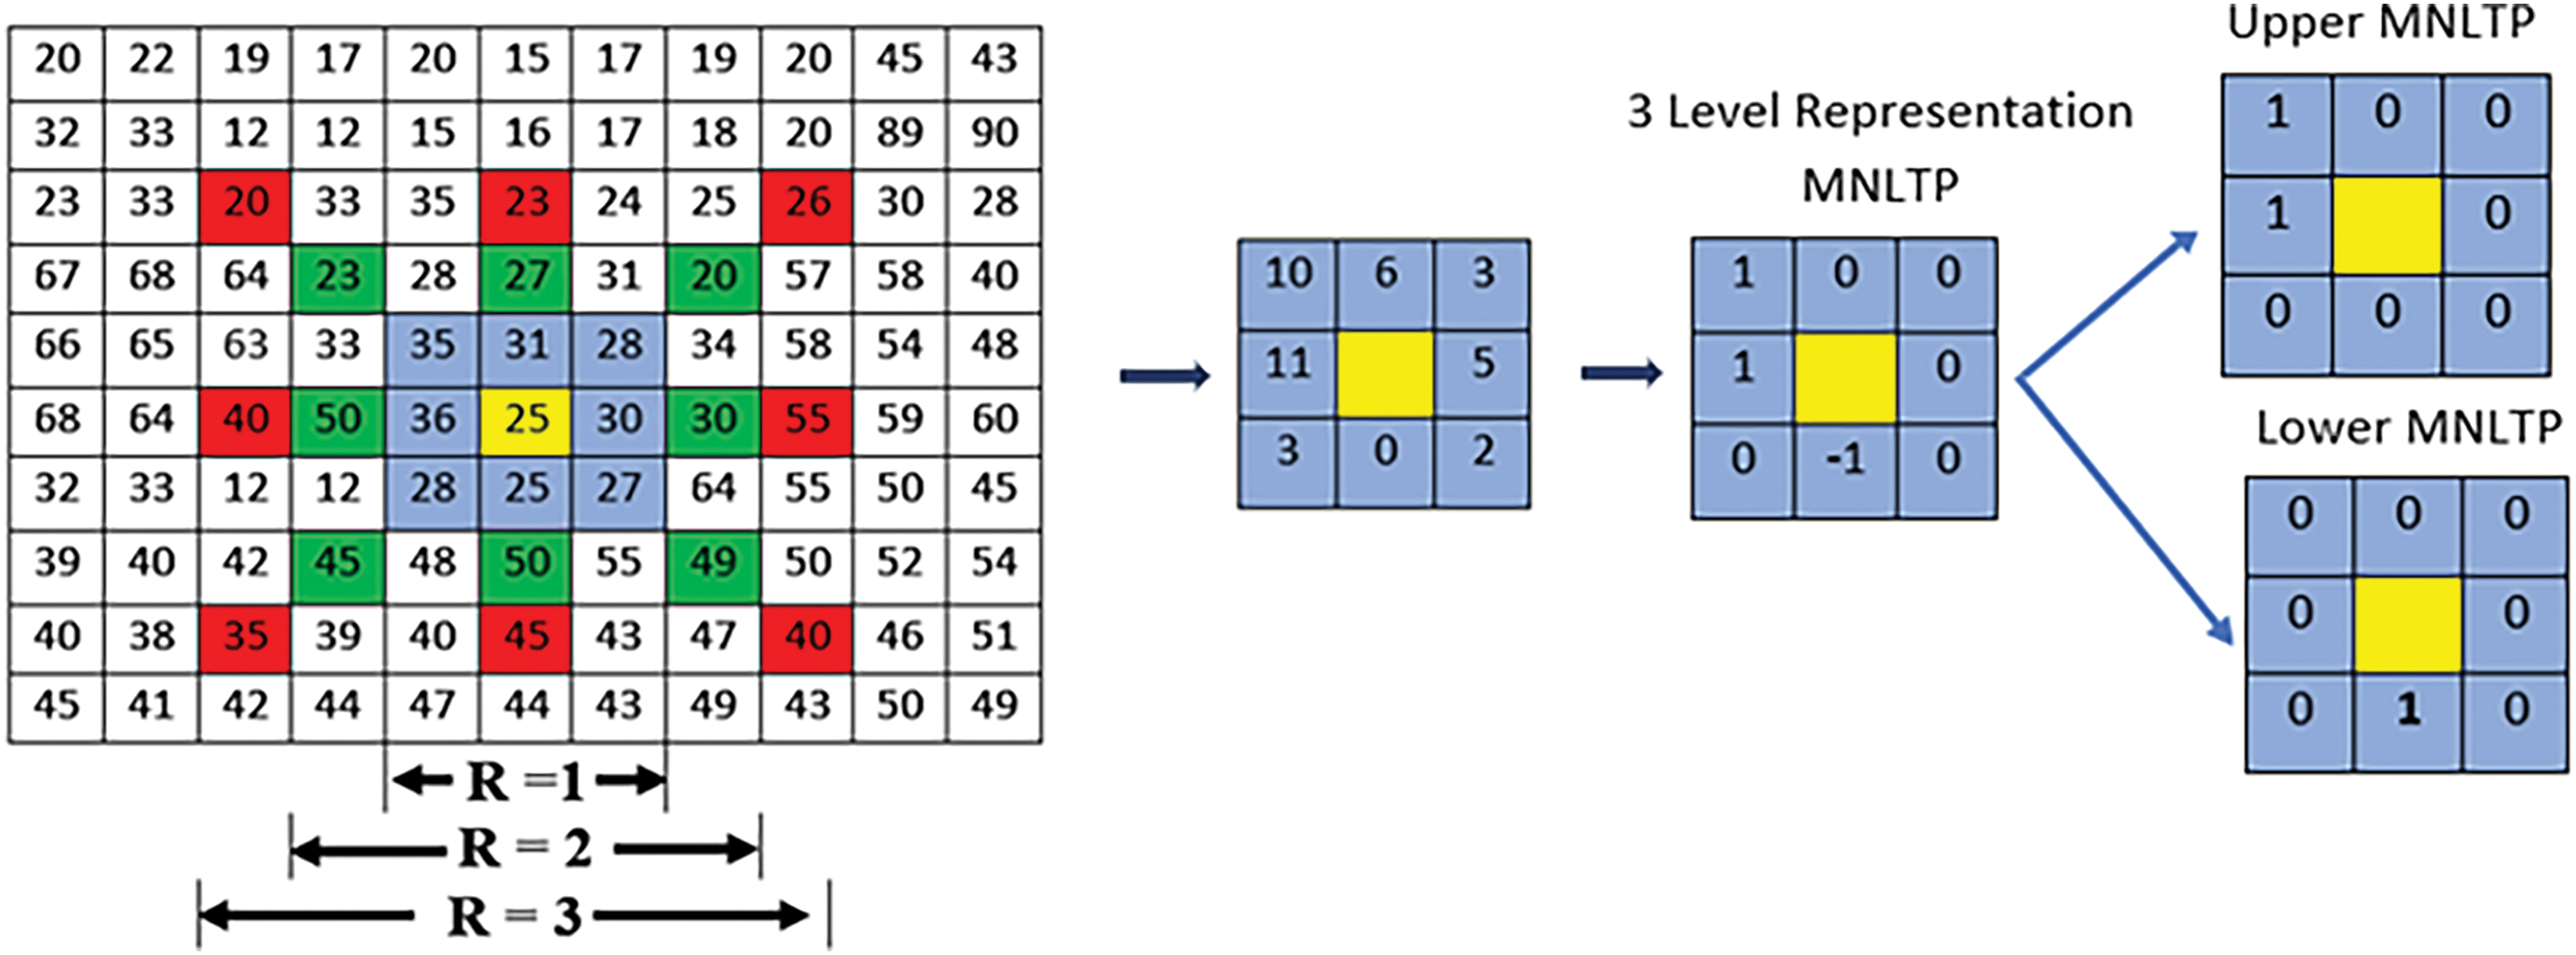
Figure 4: An example to calculate MNLTP
Upper LTP is obtained by retaining +1 as 1, 0 and −1 are replaced by 0. Lastly, the Central value is replaced by the decimal value of the binary sequence obtained by concatenating 1’s and 0’ s in a clockwise direction.
Lower LTP is obtained by replacing −1 as 1, 1 and 0 are replaced by 0. Lastly, the central value is replaced by the decimal value of the binary pattern. This process is repeated for every image pixel to obtain a Lower LTP representation and Upper LTP representation of the image. The details of implementation are given in Algorithm 1.

3.2 Parallel Deep Convolution Neural Network (PDCNN)
The obtained MNLTP feature descriptor is used to train the deep CNN architecture, as shown in Fig. 2. The experimentations are done with a single CNN network, two parallel CNN networks, and three parallel CNN network architectures. Each CNN network branch has four convolutional layers. Each layer has one convolutional layer, batch Normalization, ReLU (Rectified Linear Unit), and maxPooling layer. The convolutions are performed with different parameters like kernel size, number of kernels, and padding. Due to the convolution operation between activations and kernel, the size of the layer’s output decreases. When building deep CNN, we must preserve the size so zero padding is done. The number of kernels in each CNN branch is 16, 32, 64, and 96, respectively, for four hidden layers.
The increasing size of the filters in successive layers helps to improve the connectivity between local and global features extracted through the CNN layers. The filter size in a single CNN branch architecture is
where I is input activation of size (
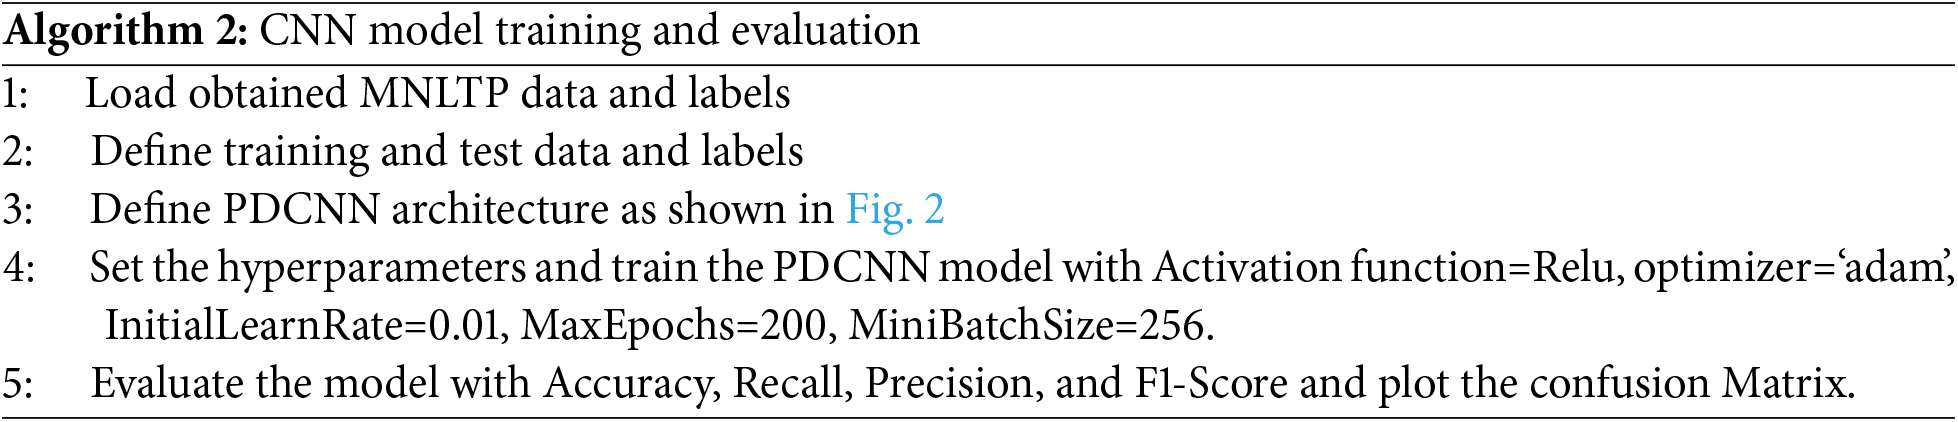
The learnable parameters for the fully connected network with 256 nodes are 1.6 million, 1.8 million, and 2.3 million for single CNN branches, two parallel CNN branches, and three parallel branches, respectively. So, the considerable reduction in the learnable parameters makes a very lightweight CNN model, which will be trained on the MNLTP image texture descriptor data. The training hyperparameters are set as given in Algorithm 2.
The details of two public datasets used for evaluation are given in the Table 1. The first public dataset is obtained at Noor Eye Hospital, Tehran [12]. The dataset was downloaded on 16 June 2024.
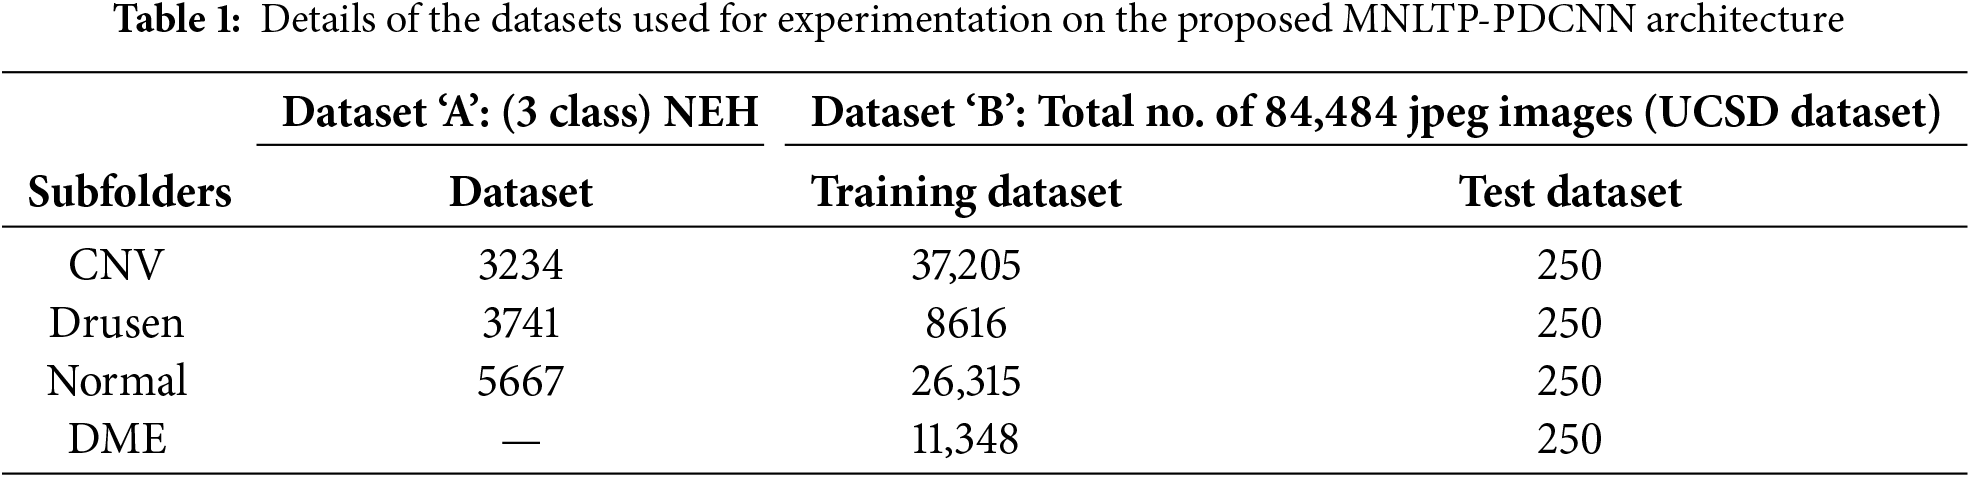
The Dataset ‘A’ has 16,822 images for three classes; after cleaning using the worst-case condition given by the dataset provider with the database, the total number of images selected is 12,642. No separate training and testing dataset is provided. The LTP of all 12,642 files is obtained in a MAT file. These are divided into 80:20 ratio randomly to get the training and test dataset. So, the training dataset size is 10,114, and the test dataset is 2528.
For Dataset ‘B,’ i.e., OCT2017 (UCSD dataset also used in [22], there are 83,384 images in the training folder and 1000 in the test folder (250 images for each class). Training on such a large dataset requires high computational power. Also, the dataset is highly imbalanced, with 37,205 images of Class CNV and only 8616 images for the class ‘Drusen’. So, 8000 images from each class, CNV, DME, DRUSEN, and NORMAL, were selected randomly. i.e., only
All the experimentations are done using the workstation with RTXA4000 GPU running MATLAB R2023b. The experimentation is as follows: Texture descriptor LTP is obtained with R = 1, and CNN models are trained with Single CNN architecture, with two parallel CNN architecture and three parallel CNN architecture. The same is repeated with texture descriptors MNLTP for R = 2 and MNLTP for R = 3.
From the literature [8,22,23], and training process observations, the Adam optimizer is selected with an initial learning rate = 0.01. In the Adam optimizer, the learning rate for the epoch is adjusted automatically with the advancement of training. Based on observations during some initial trial training process and observations of the training curve, the number of epochs considered is 200. The mini-batch size of 256 for fast training is selected based on the availability of memory of the GPU (Graphics Processing Unit). The effectiveness of the MNLTP for encoding the feature descriptor can be observed from the MNLTP images as shown in Fig. 5. Row 1 shows the descriptor image representation for the R = 1 is one level of neighborhood, row 2 images for R = 2 two levels of neighborhood, and row 3. R = 3, three levels of neighborhood for each pixel. The performance of the models is evaluated using parameters such as Accuracy, Recall, Precision, and F1-Score. These values are calculated from True Positive (TP), True Negative (TN), False Positive (FP), and False Negative (FN) values from the multiclass Confusion Matrix. Accuracy gives the overall performance of the model (TP and TN).
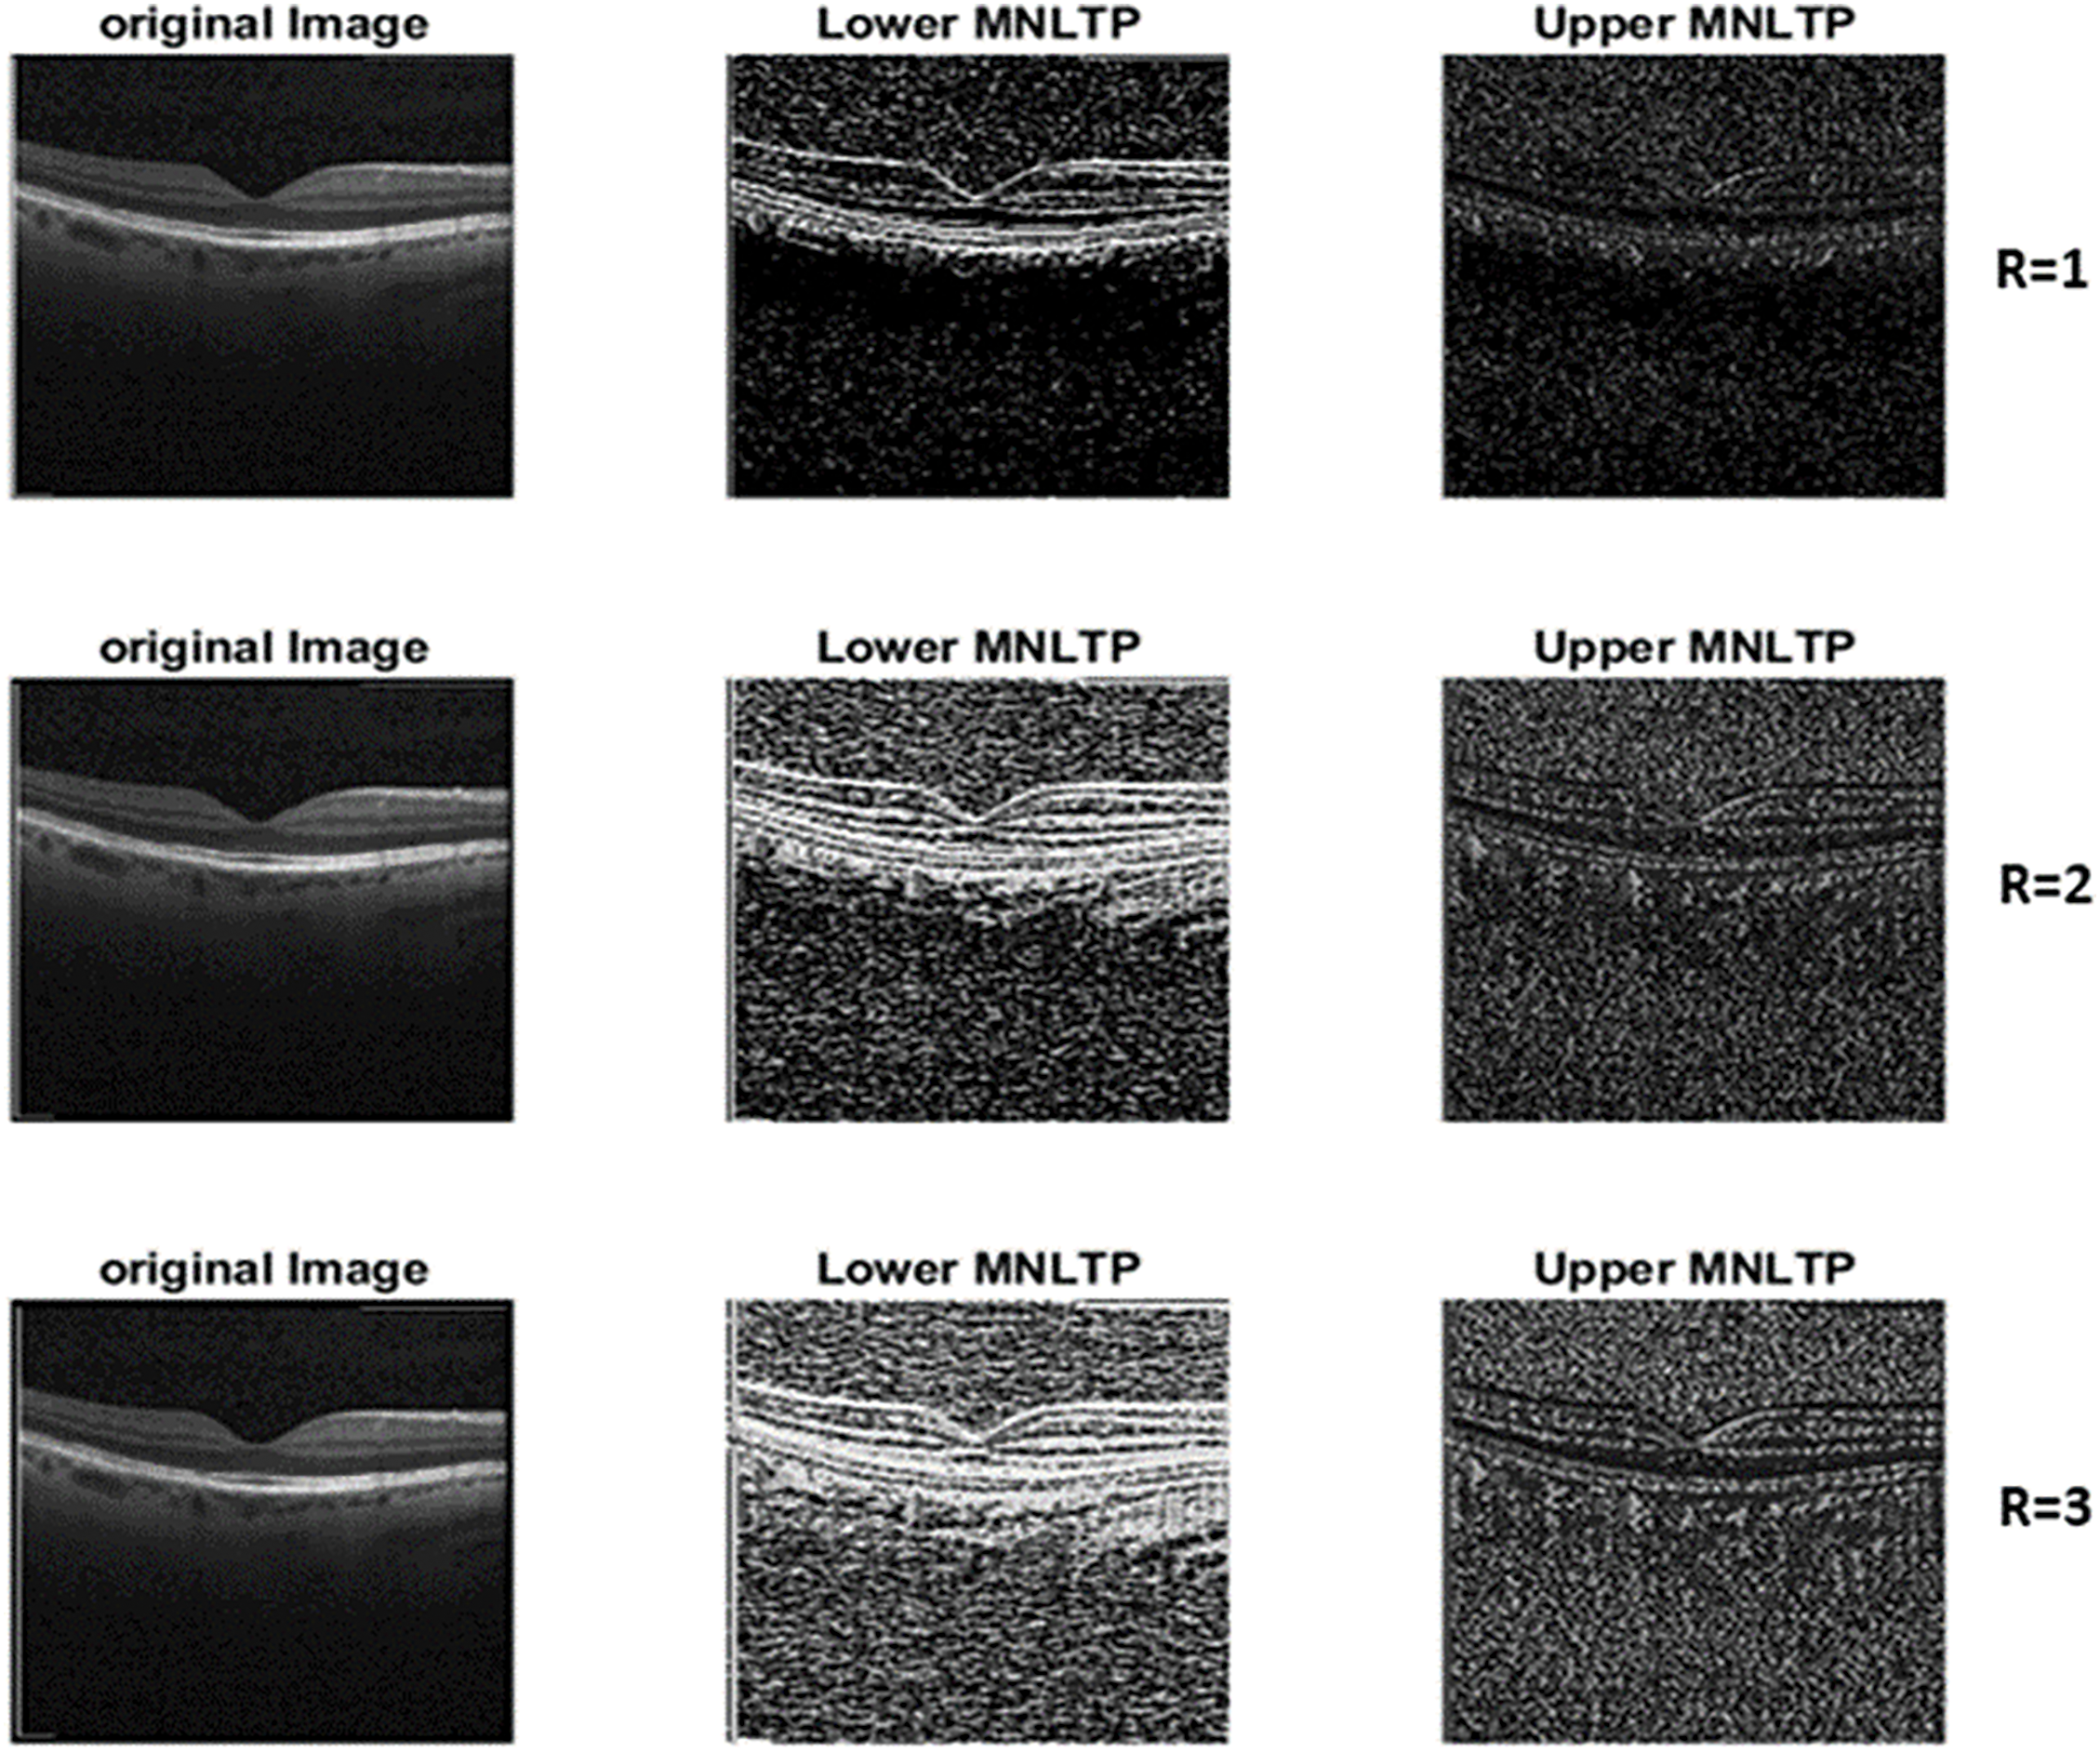
Figure 5: Upper and lower LTP representation of OCT images for different values of (R = 1, 2,3)
Recall specifies the model’s capability to minimize FN predictions and correctly classify the positive instances. The precision specifies the model’s ability to minimize FP instances and maximize TP. The F1-Score is defined as the harmonic mean of recall and precision. When the F1-Score improves, it might be due to an improvement in recall or precision.
For each dataset, nine experiments are carried out. For the Dataset ‘A’, effect of various configurations (with R = 0, R = 1, and R = 3) is presented in Table 2. The overall effect on the model’s performance for considering multiple neighborhoods and multiple parallel CNN branches in different model configurations can be seen in Fig. 6a,b.
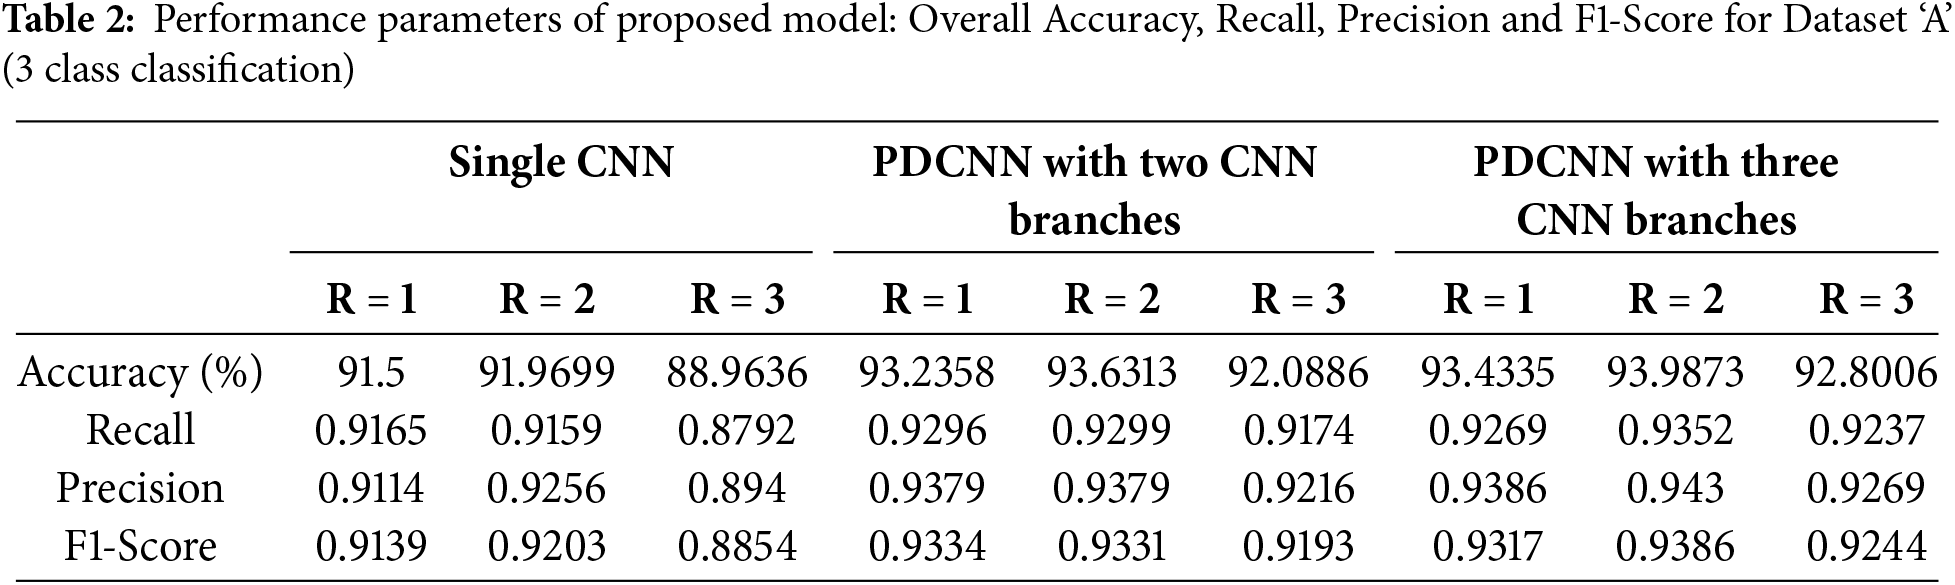
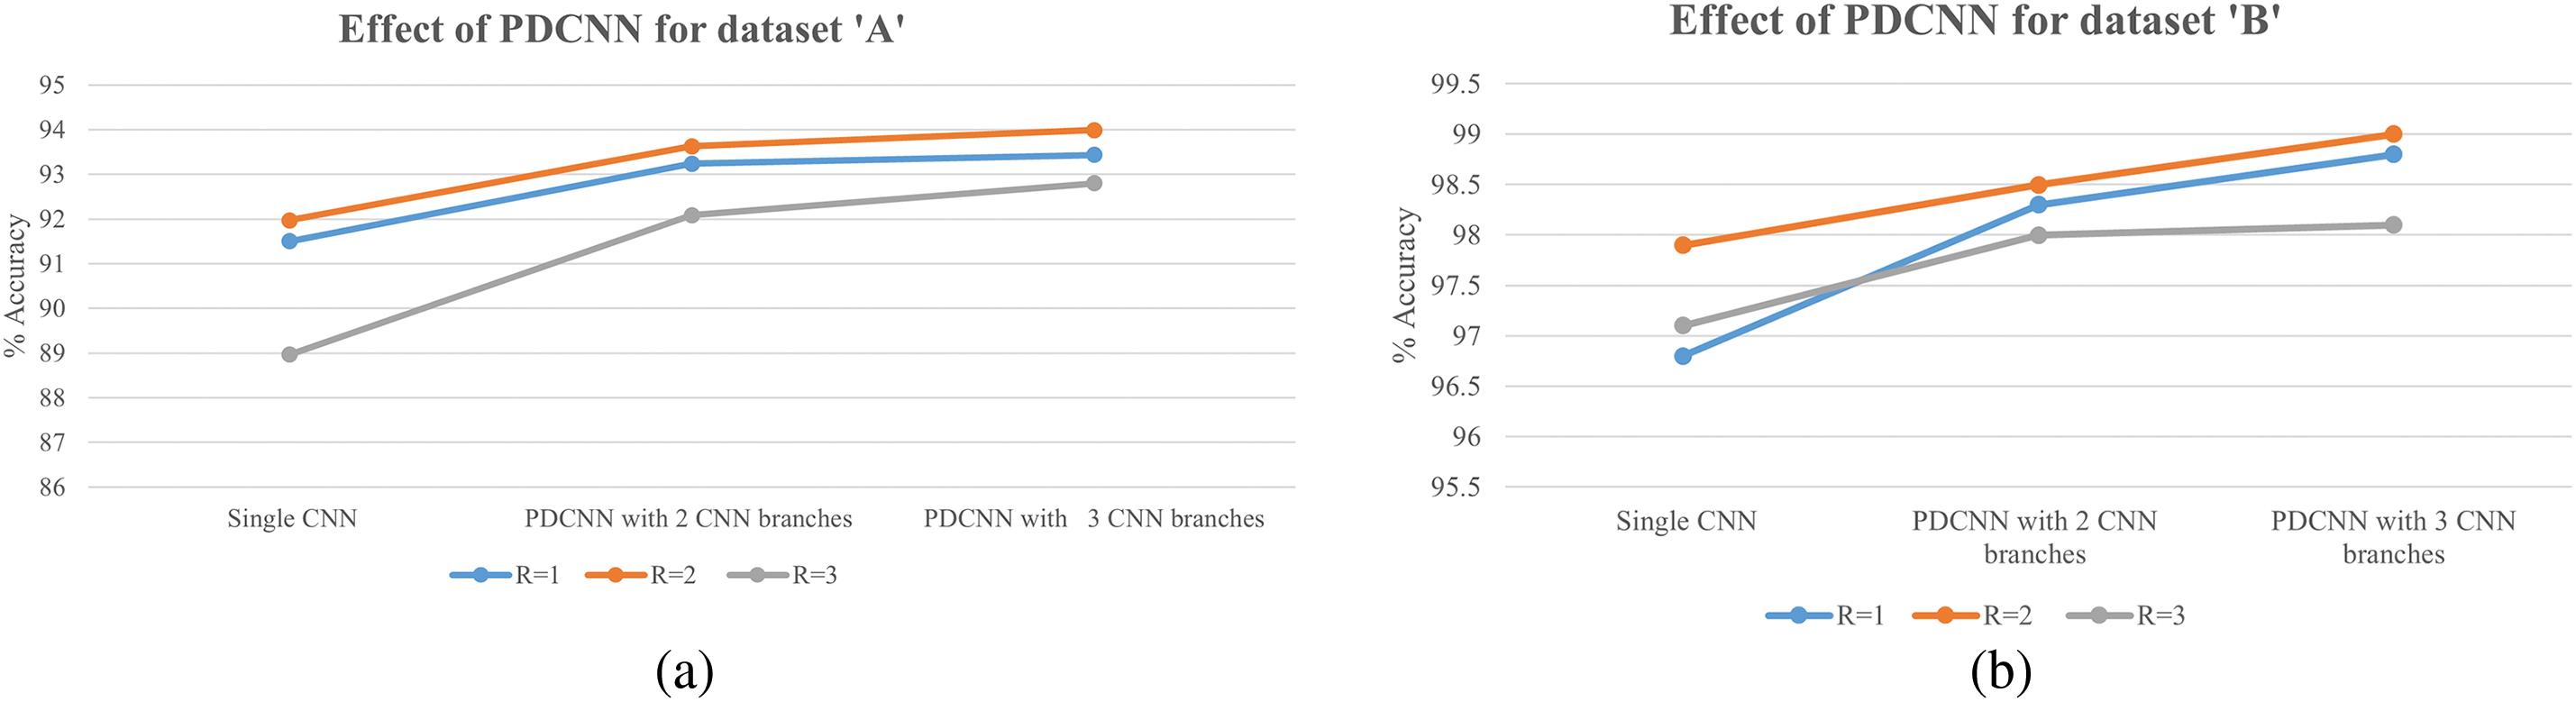
Figure 6: Effect of parallel deep CNN (PDCNN)
For Dataset ‘A’ from Table 2, when multiple neighborhoods with windows
Besides accuracy, precision and recall are considered, which can give information in case of class imbalance and the model’s performance for a particular class performance on positive predictions. The precision values decreases when the model’s false positive classification increases. The Recall decreases when the model’s false negative classification increases. So low values of precision and recall indicate the model’s performance under imbalanced data or error rate in the classification of certain classes. With Dataset ‘A’, the dataset is made of approximately 25.59% of class CNV, 29.6% of Drusen, and 44.5% of Normal Class samples. From the confusion matrix for overall accuracy of 94%, maximum good performance comes from the majority class, Normal as 96.8%. Drusen is the early-stage AMD with very small depositions, making it challenging to differentiate it from NORMAL samples. The combined effect has reduced the model’s performance for the class Drusen (in the given confusion matrix, it’s 87.8%). The data imbalance problem can be solved by incorporating strategies like weight balancing by penalizing the majority class, artificially generating samples of minority classes, resampling the dataset, Data augmentation, etc.
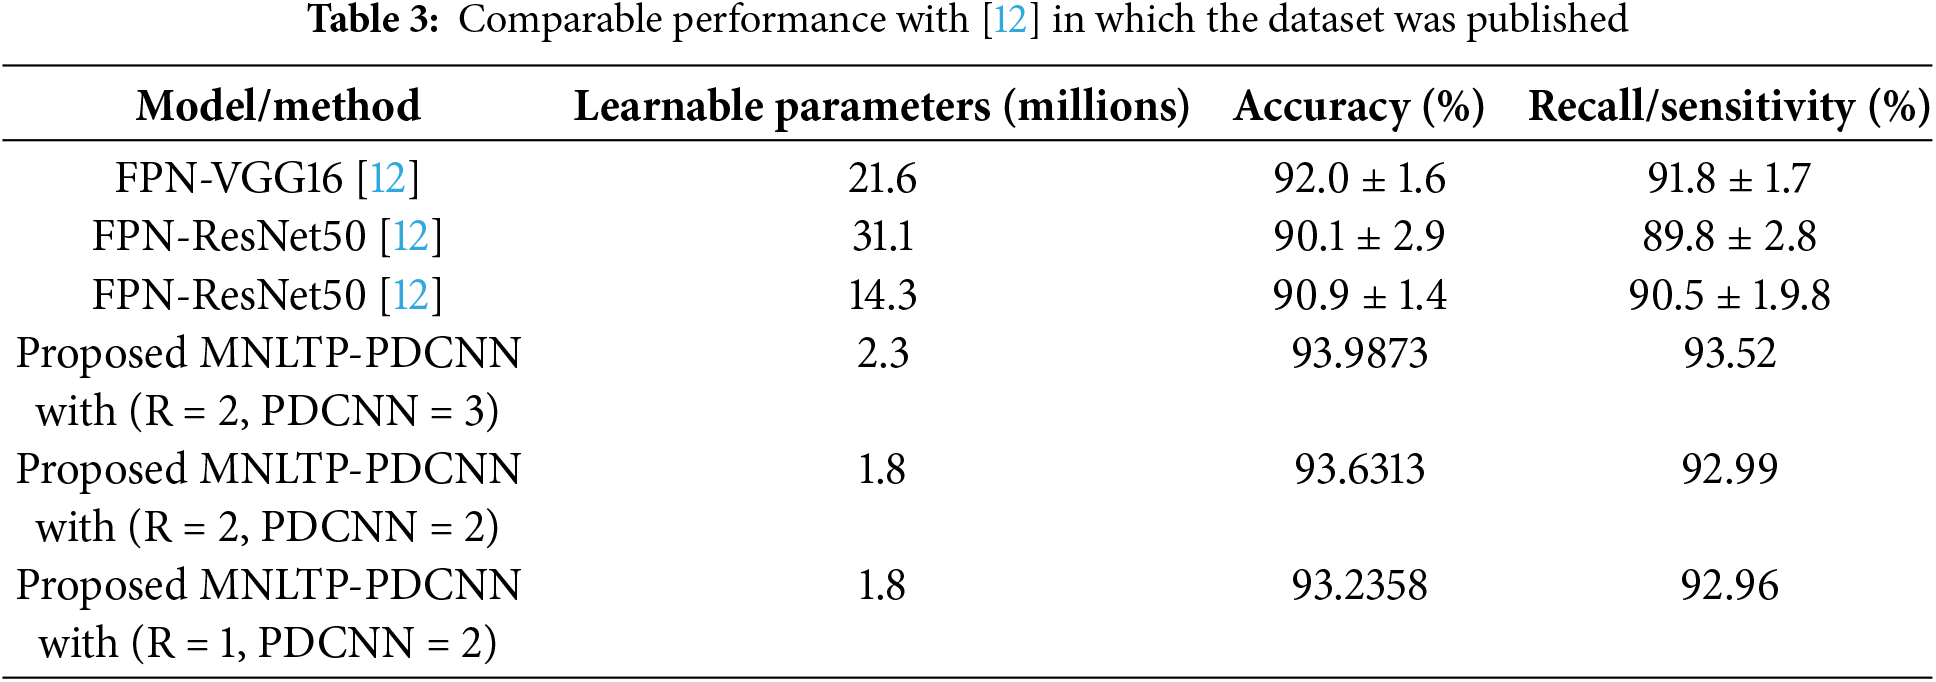
The comparable results are obtained with the [12] in which the Dataset ‘A’ was released, given in Table 3. With the proposed model number of trainable parameters was reduced considerably. The comparable results are obtained with 1.8 and 2.3 million parameters as compared to 14.3, 21.6, lightweight and 31.1 million parameters in [12]. So, a lightweight CNN network is sufficient to yield comparable results when trained with the texture descriptor for the classification of OCT images.
For experimentation with Dataset ‘B’ as mentioned in the Dataset section, 32,000 (8000 each class × 4 classes) images are randomly selected, and MNLTP texture descriptor is obtained, as upper and lower LTP. The Proposed MNLTP- PDCNN model is trained, and model performance is tested on a provided test dataset of 1000 OCT images, with 250 test images from each of the four classes. The results are presented in Table 4. When the window size for calculating texture descriptor is
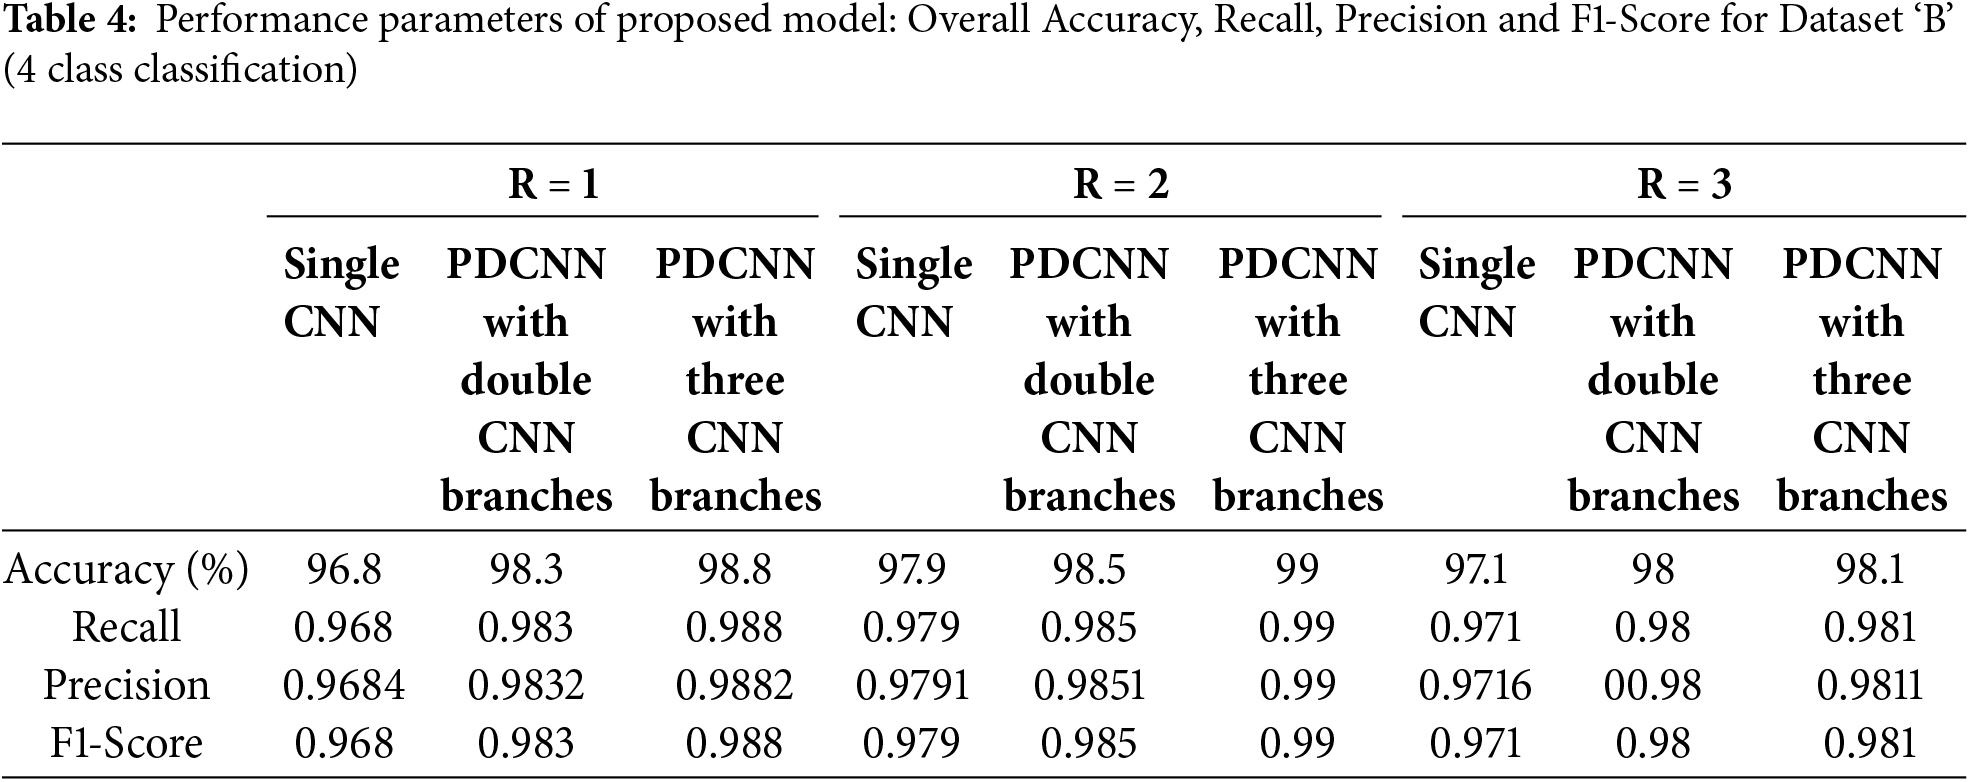
For Dataset ‘B’, the improvement in accuracy is also achieved with increasing parallel branches in CNN architecture due to improved feature presentation and generalizability of the model.
Considering the lowest number of samples of class ‘Drusen’ (8616), only 8000 samples of each class are selected randomly. The model’s performance for each of the classes is similar (as can be seen in the confusion matrix for Dataset ‘B’, 98.8% for class CNV, 98.4% for class DME, 100% for class DRUSEN, and 98.8% for class NORMAL resulting in 99% overall accuracy). So, as there is no data imbalance problem, the model can give balanced performance for all the classes. A similar pattern can be observed for the confusion matrix for R = 1 and R = 3.
The proposed Parallel CNN model with different kernel sizes,
The total learnable parameters (1.6 million, 1.8 million, and 2.3 million for a single CNN branch, two parallel CNN networks, and three parallel network branches, respectively) are significantly less than the off-the-shelf models and standard pre-trained models like VGGNet19, ResNet18, MobileNetV1, etc. [25]. Thus, the proposed CNN architecture with significantly fewer trainable parameters is a lightweight architecture suitable for real-time fast training of the model with available OCT dataset and with reduced memory requirement for computations.
The proposed PDCNN trained with MNLTP feature descriptor data provides better feature representation capability and improvement in overall accuracy considering the effect of neighborhood pixels and parallel CNN model. The model performance is best up to R = 2 and three CNN parallel branches, where it considers two neighborhood levels. For R greater than 2, the spatial connectivity decreases and shows a slight decrease in performance, so experimentation beyond r = 3 is not considered. The kernel size for the single CNN is
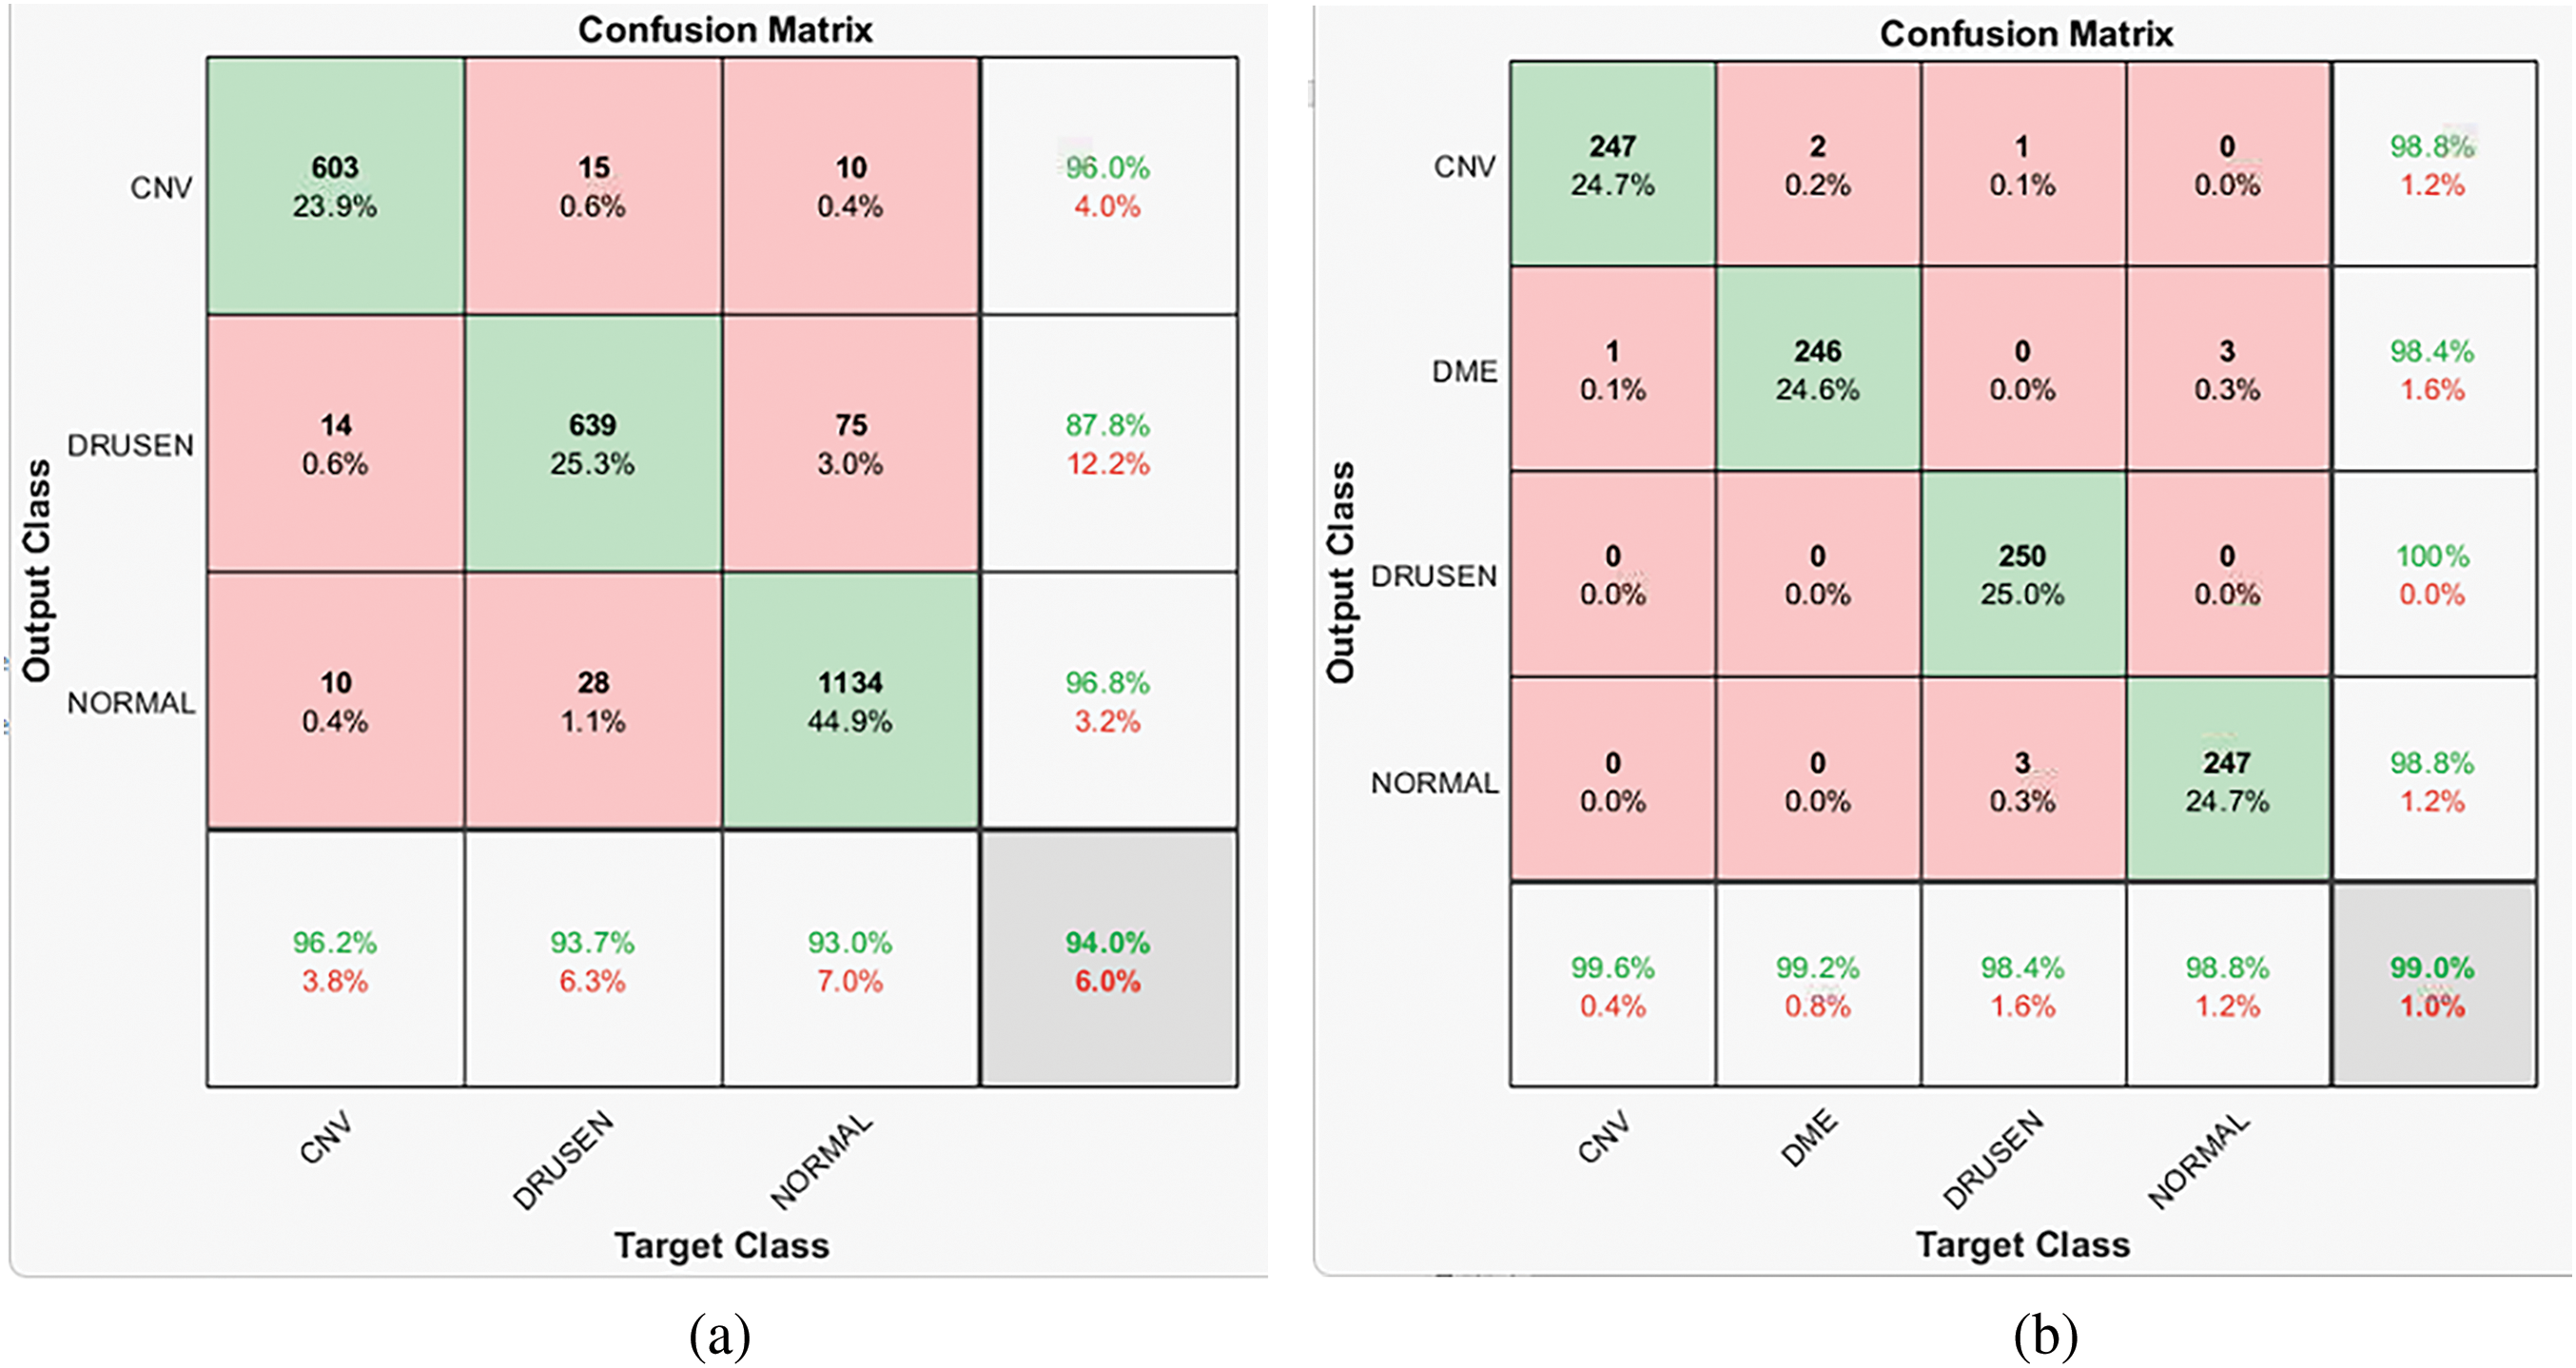
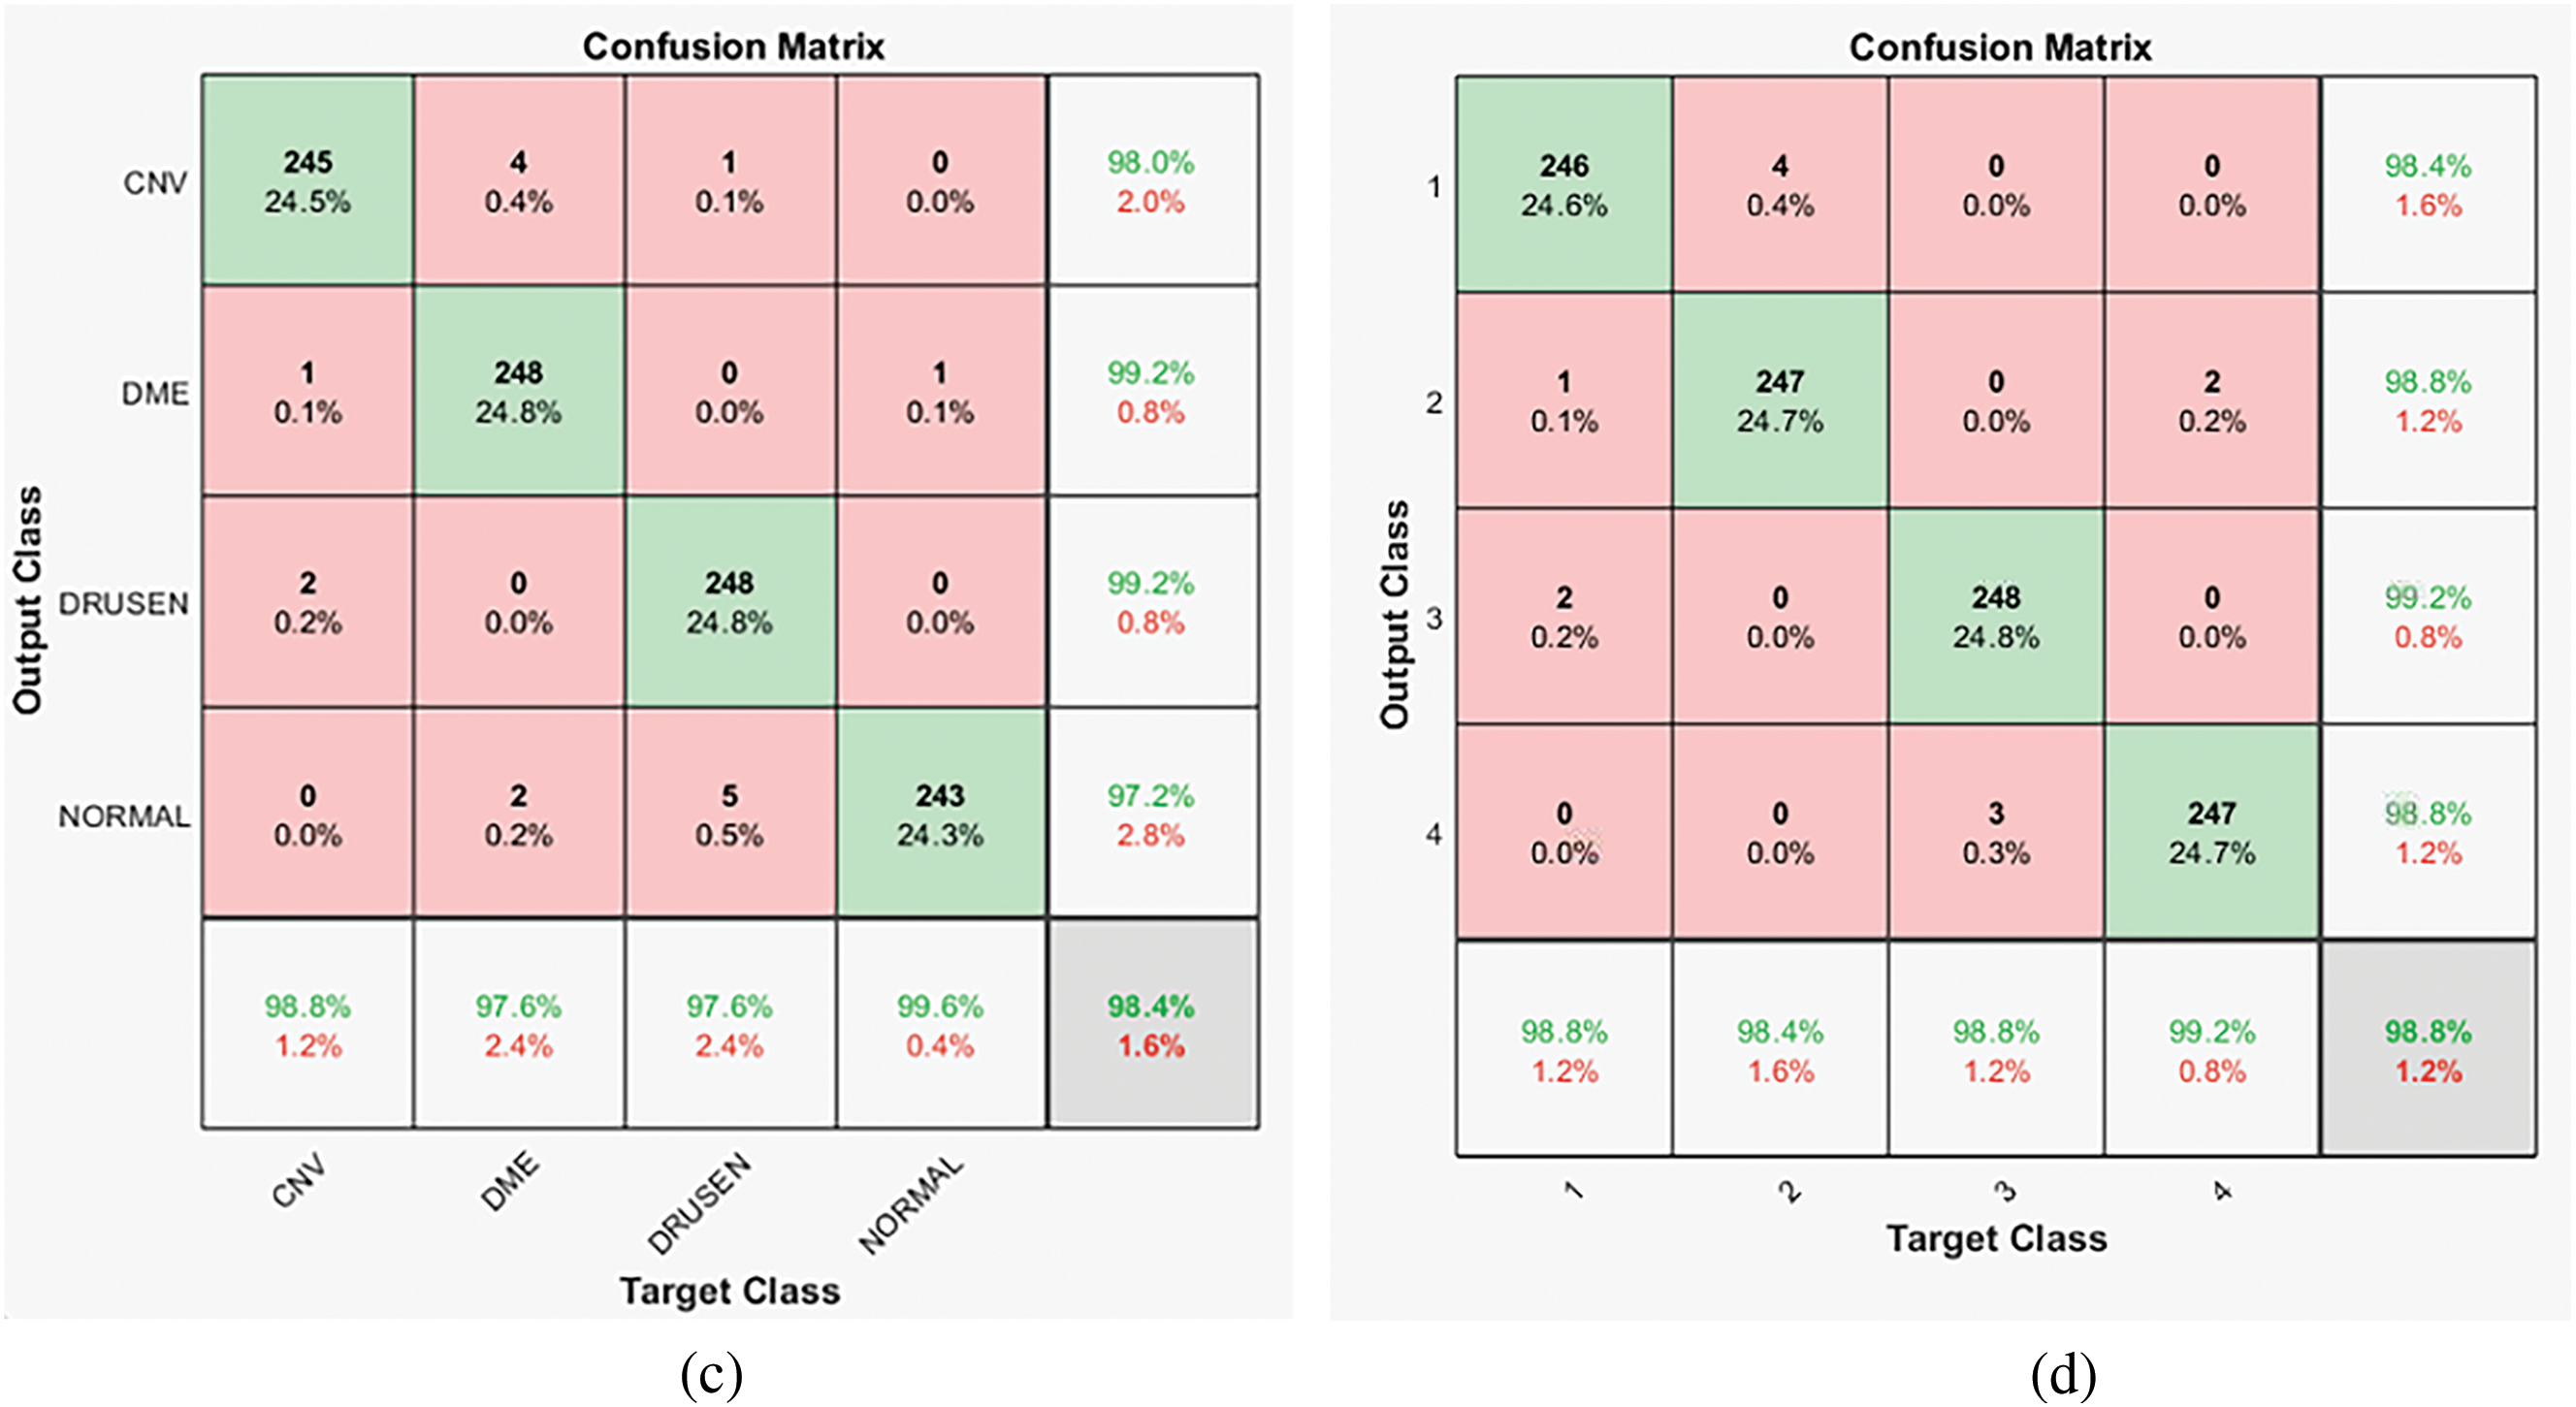
Figure 7: (a) Dataset ‘A’ confusion matrix for R = 2 and three parallel CNN branches (b) Dataset ‘B’ confusion matrix for R = 2 and three parallel CNN branches (c) Dataset ‘B’ confusion matrix for R = 2 and two parallel CNN branches (d) Dataset ‘B’ confusion matrix for R = 1 and three parallel CNN branches (class 1 is CNV, 2 is DME, 3 is DRUSEN, 4 is NOTMAL)
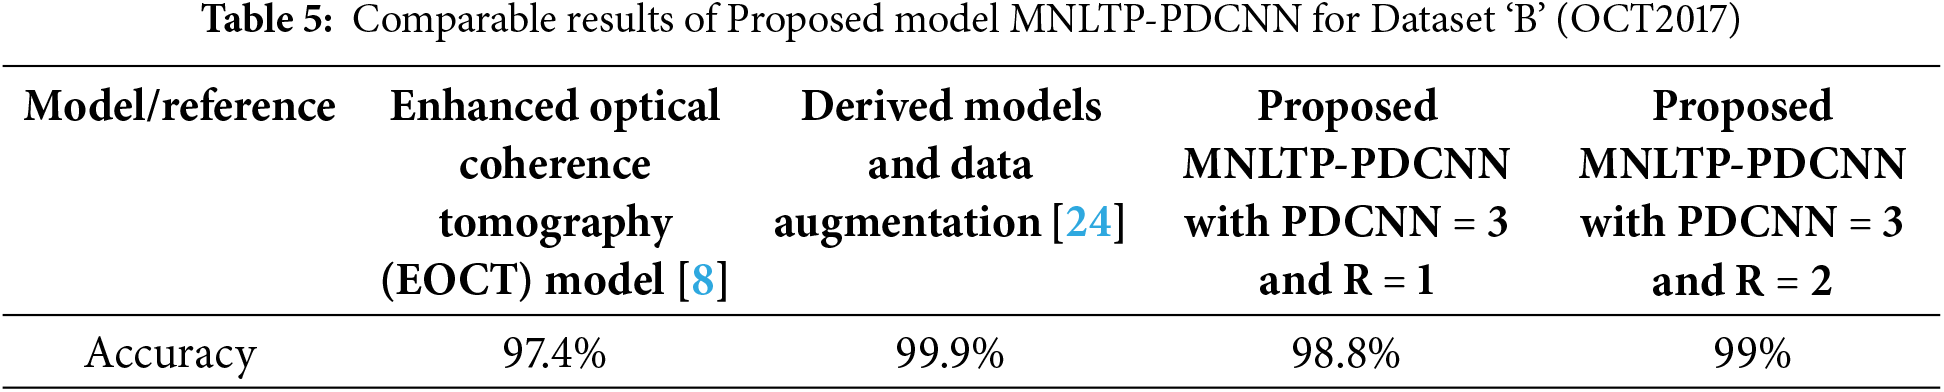
For Dataset ‘B’, comparable results are obtained with fewer training samples of the large dataset, as against the off-the-shelf model where either the complexity of the CNN model is increased, or training data is increased multiple times the original dataset size by data augmentation [24]. This indicated that better results can be obtained with multiple neighborhood LTP descriptors with comparatively simple CNN model. The performance of the model with Dataset ‘B’ compared with the other two models is given in Table 5.
The higher values (0.985 and 99 for R = 2 with two and three CNN parallel branches, respectively) for Recall, Precision, and F1-Score parameters indicate good performance against False Positive (FP) and False Negative (FN) classification. In the case of false positive classification, the model detects the images with the disease when retinal layers are not affected by the detected disease. In case of a false negative, the image is of a particular disease; the model detects it as unaffected by that disease. In medical image analysis, avoiding false positive and false negative predictions is of utmost importance.
Beyond three CNN parallel branches, complexity is increased more, compared to improvement in performance, so it is not considered. In the proposed model, a simple CNN model with comparatively fewer learning parameters is trained using the texture descriptor of images. For medical images like OCT images, texture-based classification can be more robust as the OCT images are constructed using the reflectivity property of the tissues of retinal layers. The damage to the tissues due to different diseases can affect the tissues’ reflectivity in different ways; hence, the texture of the OCT images varies. Therefore, the texture descriptor of images training the CNN model can be a useful distinctive approach for image classification.
The performance of the off-the-shelf CNN models has proved very effective in image classifications. However, disease detection using OCT images, based on structural deformation in the retinal layers using CNN, can be challenging, as structural changes can be similar for different diseases. This paper presents a hybrid approach MNLTP-PDCNN, focusing on texture variations rather than structural deformation of retinal layers (due to diseases) to classify the OCT images. The proposed MNLTP, capable of capturing complex texture information, is used to obtain texture descriptors. A pixel along low radius R cannot capture the low-frequency textural pattern changes within the image. So, to improve the spatial feature connectivity, neighborhood pixels at multiple radii are added. Instead of single neighborhood pixels, a group of pixels at different radii can give a more distinctive, robust texture descriptor. In the proposed MNLTP-PDCNN model, PDCNN model is directly trained with MNLTP texture data instead of images. The proposed PDCNN is comparatively lighter model with 1.6 million for a single CNN network, 1.8 million for two parallel CNN networks and 2.3 million learnable parameters. The model is tested on two public datasets. The proposed model has given comparable results with the lightweight CNN model, i.e., a few learnable parameters: 1.6 million for a single CNN network, 1.8 million for two parallel CNN networks, and 2.3 million for three parallel networks when trained with MNLTP texture data. The proposed parallel CNN network with a
The proposed model is also analysed for Dataset ‘B’, trained using only 32000 images instead of using the complete dataset of 83,384 images. The model performance is evaluated on the entire test dataset (1000 OCT images from 4 classes). It has better comparable performance with the highest accuracy of 99% ( for configuration R = 2 with three parallel branch CNN). First, it requires time to compute MNLTP when the dataset is large. For the higher values of R, spatial connectivity decreases and shows a slight decrease in performance, so experimentation beyond R = 3 is not considered.
The reduced learnable parameters make the proposed CNN model lightweight, so it is very useful for real-time system development, as training time, computational requirement, and memory requirements are reduced.
The textural variations due to diseases in the OCT images can be effectively used to classify the images. So, the proposed MNLTP, textural descriptor-based CNN training, and classification is a promising approach for real-time OCT image classification systems.
Acknowledgement: The authors are grateful to their respective organizations for their help and support.
Funding Statement: Deanship of Research and Graduate Studies at King Khalid University funded this work through Large Research Project under grant number RGP2/54/45.
Author Contributions: The authors confirm their contribution to the paper as follows: study conception and design, data collection, analysis and interpretation of results, and draft manuscript preparation by Jahida Subhedar. Anurag Mahajan and Shabana Urooj have reviewed the manuscript and Neeraj Kumar Shukla corrected the manuscript. All authors reviewed the results and approved the final version of the manuscript.
Availability of Data and Materials: Data openly available in a public repository, Dataset ‘A’: https://data.mendeley.com/datasets/8kt969dhx6/1, accessed on 16 June 2024. Dataset ‘B’: https://data.mendeley.com/datasets/rscbjbr9sj/2, accessed on 16 June 2024.
Ethics Approval: Not applicable.
Conflicts of Interest: The authors declare no conflicts of interest to report regarding the present study.
References
1. Montazerin M, Sajjadifar Z, Khalili Pour E, Riazi-Esfahani H, Mahmoudi T, Rabbani H, et al. Livelayer: a semi-automatic software program for segmentation of layers and diabetic macular edema in optical coherence tomography images. Sci Rep. 2021;11(1):13794. doi:10.1038/s41598-021-92713-y. [Google Scholar] [PubMed] [CrossRef]
2. Pang S, Zou B, Xiao X, Peng Q, Yan J, Zhang W, et al. A novel approach for automatic classification of macular degeneration OCT images. Sci Rep. 2024;14:19285. doi:10.1038/s41598-024-70175-2. [Google Scholar] [PubMed] [CrossRef]
3. Liew SBA, Agaian S. Distinctions between choroidal neovascularization and age macular degeneration in ocular disease predictions via multi-size kernels ξcho-weighted median patterns. Diagnostics. 2023 Feb;13(4):729. doi:10.3390/diagnostics13040729. [Google Scholar] [PubMed] [CrossRef]
4. Monemian M, Irajpour M, Rabbani H. A review on texture-based methods for anomaly detection in retinal optical coherence tomography images. Optik. 2023 Oct;288:171165. doi:10.1016/j.ijleo.2023.171165. [Google Scholar] [CrossRef]
5. Motozawaz N, An G, Takagi S, Kitahata S, Mandai M, Hirami Y, et al. Optical coherence tomography-based deep-learning models for classifying normal and age-related macular degeneration and exudative and non-exudative age-related macular degeneration changes. Ophthalmol Ther. 2019;8(4):527–39. doi:10.1007/s40123-019-00207-y. [Google Scholar] [PubMed] [CrossRef]
6. Khan A, Pin K, Aziz A, Han JW, Nam Y. Optical coherence tomography image classification using hybrid deep learning and ant colony optimization. Sensors. 2023 Aug;23(15):527–39. doi:10.3390/s23156706. [Google Scholar] [PubMed] [CrossRef]
7. Lu W, Tong Y, Yu Y, Xing Y, Chen C, Shen Y. Deep learning-based automated classification of multi-categorical abnormalities from optical coherence tomography images. Transl Vis Sci Technol. 2018;7(6):0–9. doi:10.1167/tvst.7.6.41. [Google Scholar] [PubMed] [CrossRef]
8. Hassan E, Elmougy S, Ibraheem MR, Hossain MS, AlMutib K, Ghoneim A, et al. Enhanced deep learning model for classification of retinal optical coherence tomography images. Sensors. 2023 Jun;23(12):5393. doi:10.3390/s23125393. [Google Scholar] [PubMed] [CrossRef]
9. Karri SPK, Chakraborty D, Chatterjee J. Transfer learning based classification of optical coherence tomography images with diabetic macular edema and dry age-related macular degeneration. Biomed Opt Express. 2017;8(2):579. doi:10.1364/BOE.8.000579. [Google Scholar] [PubMed] [CrossRef]
10. Rasti R, Rabbani H, Mehridehnavi A, Hajizadeh F. Macular OCT classification using a multi-scale convolutional neural network ensemble. IEEE Trans Med Imaging. 2018;37(4):1024–34. doi:10.1109/TMI.2017.2780115. [Google Scholar] [PubMed] [CrossRef]
11. Das V, Dandapat S, Bora PK. Multi-scale deep feature fusion for automated classification of macular pathologies from OCT images. Biomed Signal Process Control. 2019;54:101605. doi:10.1016/j.bspc.2019.101605. [Google Scholar] [CrossRef]
12. Sotoudeh-Paima S, Jodeiri A, Hajizadeh F, Soltanian-Zadeh H. Multi-scale convolutional neural network for automated amd classification using retinal OCT images. Comput Biol Med. 2022;144:105368. [Google Scholar] [PubMed]
13. Vaghefi E, Hill S, Kersten HM, Squirrell D. Multimodal retinal image analysis via deep learning for the diagnosis of intermediate dry age-related macular degeneration: a feasibility study. J Ophthalmol. 2020;2020:7493419. [Google Scholar] [PubMed]
14. Das V, Dandapat S, Bora P. A data-efficient approach for automated classification of OCT images using generative adversarial network. IEEE Sens Lett. 2020;4(1):1–4. doi:10.1109/LSENS.2019.2963712. [Google Scholar] [CrossRef]
15. Bora G, Sadasivam V. Optimized local ternary patterns: a new texture model with set of optimal patterns for texture analysis. J Comput Sci. 2013;9(1):1–15. doi:10.3844/jcssp.2013.1.15. [Google Scholar] [CrossRef]
16. Ojala T, Pietikäinen M, Harwood D. A comparative study of texture measures with classification based on featured distributions. Pattern Recognit. 1996;29(1):51–9. doi:10.1016/0031-3203(95)00067-4. [Google Scholar] [CrossRef]
17. Liu Y, Chen M, Ishikawa H, Wollstein G, Joel Schuman S, Rehg JM. Automated macular pathology diagnosis in retinal oct images using multi-scale spatial pyramid and local binary patterns in texture and shape encoding. Med Image Anal. 2011;15(5):748–59. doi:10.1016/j.media.2011.06.005. [Google Scholar] [PubMed] [CrossRef]
18. Lemaitre G, Rastgoo M, Massich J, Cheung CY, Wong TY, Lamoureux E, et al. Classification of SD-OCT volumes using local binary patterns: experimental validation for DME detection. J Ophthalmol. 2016;2016:3298606. doi:10.1155/2016/3298606. [Google Scholar] [PubMed] [CrossRef]
19. Rachdi E, EI Khadiri I, EI Merabet Y, Rhazi Y, Meurie C. Texture and material classification with multi-scale ternary and septenary patterns. J King Saud Univ-Comput Inf Sci. 2023;35(1):405–15. doi:10.1016/j.jksuci.2022.12.009. [Google Scholar] [CrossRef]
20. Hosny KM, Magdy T, Lashin KNA, Papakostas GA. Refined color texture classification using CNN and local binary pattern. Math Probl Eng. 2021;2021:5567489. [Google Scholar]
21. Rajagopalan N, Venkateswaran N, Josephraj AN, Srithaladevi E. Diagnosis of retinal disorders from optical coherence tomography images using CNN. Biomed Signal Process Control. 2021 Jul;16(7):e0254180. doi:10.1371/journal.pone.0254180. [Google Scholar] [PubMed] [CrossRef]
22. Tsuji T, Hirose Y, Fujimori K, Hirose T, Oyama A, Saikawa Y, et al. Classification of optical coherence tomography images using a capsule network. BMC Ophthalmol. 2020 Mar;20(1):114. doi:10.1186/s12886-020-01382-4. [Google Scholar] [PubMed] [CrossRef]
23. Salehi H, Barchini M, Mahdian M. Optimization methods for deep neural networks classifying OCT images to detect dental caries. In: Proceedings of Lasers in Dentistry XXVI; 2020 Feb 1–6; San Francisco, CA, USA: SPIE. [Google Scholar]
24. Ara RK, Matiolaski A, Dziech A, Baran R, Domin P, Wieczorkiewicz A. Fast and efficient method for optical coherence tomography images classification using deep learning approach. Sensors. 2022 Jul;22(13):4675. doi:10.3390/s22134675. [Google Scholar] [PubMed] [CrossRef]
25. Zhang X, Wu X, Xiao Z, Hu L, Qiu Z, Sun Q, et al. Mixed-decomposed convolutional network: a lightweight yet efficient convolutional neural network for ocular disease recognition. CAAI Trans Intell Technol. 2024;9(2):319–32. doi:10.1049/cit2.12246. [Google Scholar] [CrossRef]
Cite This Article
 Copyright © 2025 The Author(s). Published by Tech Science Press.
This work is licensed under a Creative Commons Attribution 4.0 International License , which permits unrestricted use, distribution, and reproduction in any medium, provided the original work is properly cited.
 Downloads
 Citation Tools