
 Submit a Paper
 Propose a Special lssue
 Open Access
ARTICLE
Lightweight YOLOM-Net for Automatic Identification and Real-Time Detection of Fatigue Driving
1 School of Electronics and Control Engineering, Chang’an University, Xi’an, 710064, China
2 Digital Business Department, Shaanxi Expressway Engineering Testing Inspection & Testing Co., Ltd., Xi’an, 710086, China
3 School of Energy and Electrical Engineering, Chang’an University, Xi’an, 710064, China
* Corresponding Authors: Yaxue Peng. Email: ; Gang Li. Email:
(This article belongs to the Special Issue: Artificial Intelligence Algorithms and Applications)
Computers, Materials & Continua 2025, 82(3), 4995-5017. https://doi.org/10.32604/cmc.2025.059972
Received 21 October 2024; Accepted 23 December 2024; Issue published 06 March 2025
 View Full Text
 Download PDF
Abstract
In recent years, the country has spent significant workforce and material resources to prevent traffic accidents, particularly those caused by fatigued driving. The current studies mainly concentrate on driver physiological signals, driving behavior, and vehicle information. However, most of the approaches are computationally intensive and inconvenient for real-time detection. Therefore, this paper designs a network that combines precision, speed and lightweight and proposes an algorithm for facial fatigue detection based on multi-feature fusion. Specifically, the face detection model takes YOLOv8 (You Only Look Once version 8) as the basic framework, and replaces its backbone network with MobileNetv3. To focus on the significant regions in the image, CPCA (Channel Prior Convolution Attention) is adopted to enhance the network’s capacity for feature extraction. Meanwhile, the network training phase employs the Focal-EIOU (Focal and Efficient Intersection Over Union) loss function, which makes the network lightweight and increases the accuracy of target detection. Ultimately, the Dlib toolkit was employed to annotate 68 facial feature points. This study established an evaluation metric for facial fatigue and developed a novel fatigue detection algorithm to assess the driver’s condition. A series of comparative experiments were carried out on the self-built dataset. The suggested method’s mAP (mean Average Precision) values for object detection and fatigue detection are 96.71% and 95.75%, respectively, as well as the detection speed is 47 FPS (Frames Per Second). This method can balance the contradiction between computational complexity and model accuracy. Furthermore, it can be transplanted to NVIDIA Jetson Orin NX and quickly detect the driver’s state while maintaining a high degree of accuracy. It contributes to the development of automobile safety systems and reduces the occurrence of traffic accidents.Keywords
Road accidents have increased in frequency, with fatigued drivers accounting for a significant share of all incidents [1]. According to a report, 48% of all traffic accidents in China are caused by fatigued driving, resulting in over 60,000 injuries and fatalities as well as nearly $100,000 in economic losses [2]. According to a survey conducted by the American Automobile Association’s Traffic Safety Foundation, the fatality rate due to fatigued driving reaches 21% in the United States [3]. In general, traffic accidents caused by stressful driving are also countless worldwide [4].
There are three types of detection methods for fatigue driving so far, which are used in different scenarios:
(1) Detection based on the vehicle violations and abnormal behaviors. In order to determine the vehicle offset location, Chen et al. [5] developed a Driver Behavior Monitoring and Warning (DBMW) model that uses an image sensor to continually identify the lane lines to be monitored and computes the power spectral density of lane departure. One popular technique for identifying driver fatigue is the steering angle. For instance, McDonald et al. [6] used unfiltered steering wheel angle data and a random forest algorithm to develop a unique method for detecting lane departure behavior associated with tiredness. Using variables including steering wheel, speed, lateral position, and reaction time as input characteristics in a driving simulator, Tango et al. [7] employed several data mining algorithms to evaluate the driver’s driving distraction. Despite the non-contact benefit of vehicle-parameter-based detection technology, the high development costs of numerous hardware monitoring devices and computer support hinder its advancement and promotion.
(2) Method of detection based on the physiological characteristics [8]. The physiological characteristics of drivers refer to the finger pulse, EEG (Electroencephalogram) signal, ECG (Electrocardiogram) signal, and EOG (Electrooculogram) signal, etc. [9]. In order to identify driver fatigue, Peng et al. [10] proposed a method for constructing a Spatial-Temporal Convolutional Neural Network (STCNN) and extracting multiple features from EEG signals. Despite its relatively high accuracy, the driver is required to utilize pertinent physiological indicator detection equipment, which may impede the driver’s comfort and cause inconvenience.
(3) Deep learning and machine vision-based detection technique [11]. The method is based on the key point detection of the driver’s face, which refers to the use of algorithm technologies such as face detection and facial feature point localization in machine vision that are dependent on the driver’s facial image obtained through image sensors like cameras [12]. The driver’s facial changes, such as eyes and mouth opened or closed, as well as the angle of the head tilt, are extracted and analyzed. On this basis, determining whether the driver is fatigued [13–16]. With the increasing popularity of artificial intelligence, many target detections have begun to use deep learning. For instance, Zhang et al. utilize facial key points to extract facial status images. In general, to ascertain the level of fatigue, the image coordinates with labeled feature points are extracted and analyzed by the neural network [17–19]. A fatigue driving detection technique for embedded devices based on lightweight YOLOv5s was proposed by Qu et al. [20]. To lessen the effect of poor environmental adaptability in fatigue detection, Zheng et al. used the ShuffleNet neural network for driver face recognition [21]. Ma et al. employed the Facenet network model for feature extraction from faces, and developed a new deep learning-based algorithm for driver fatigue detection building upon the SSD (Single Shot MultiBox Detector) algorithm [22]. Researchers prefer this approach since it is low-cost and convenient; moreover, it does not require contact.
With the advancement of artificial intelligence and deep learning, neural networks have been widely applied to fatigue driving detection [23]. Although neural networks bring many benefits to image processing, these networks are becoming increasingly complex as they get bigger. Consequently, the hardware resources needed for training and prediction are steadily rising. As a result, only servers with a lot of processing power can execute some deep learning neural network models. Complex deep learning network models are challenging to operate on mobile devices due to hardware and processing power constraints. In recent years, to meet the demands of embedded device models, an increasing number of researchers have been engaged in the task of model lightweight. Jiang et al. [24] put forward a Dual 3D Convolutional Network (D3D) for real-time action recognition. Although the fast path lowers the computational complexity, the dual-path structure is still more complex than the single path, resulting in weak real-time performance. Yi et al. [25] proposed a high-performance gesture recognition method based on time modeling, whose core idea is to disassemble traditional 3D convolution into a more lightweight spatiotemporal modeling strategy. However, time modeling strategies might not be capable of capturing complex or fine-grained action patterns well, such as slow eye closing, which has limitations in feature extraction. Xu et al. proposed a lightweight network named MobileNetv3 for feature extraction as a backbone while ensuring the model’s accuracy [26,27]. The method in this paper builds on this foundation and is able to meet the basic needs of embedded devices. It enables long-term detection with high accuracy and speed.
The driver’s state detection method based on facial features operates by analyzing facial images and extracting key features. Changes in the state of the eyes or mouth are used to assess the driving condition. This non-invasive approach does not have direct contact with the human body and interferes with normal driving, offering a convenient way to monitor the driver’s state. Currently, fatigue driving detection faces two main challenges: (1) The accuracy of algorithm detection is not high; (2) Large model sizes with high computational demands, making practical implementation difficult. This paper uses YOLOv8 as the basic framework. First of all, it is combined with MobileNetv3 to replace its backbone, which greatly reduces the network’s structural layers. CPCA is introduced so that the network effectively extracts spatial relations and retains the channel prior, focusing on the important regions in the image. This approach not only improves feature extraction but also reduces computational load and model parameters. Secondly, to increase speed and accuracy, the original CIoU (Complete Intersection over Union) loss function is replaced with the Focal-EIOU loss function [28]. Lastly, the Dlib toolbox is used to label the facial feature points following YOLOM-Net (YOLOv8-MobileNetv3) face recognition. In order to calculate the values of MAR (Mouth Aspect Ratio) and EAR (Eye Aspect Ratio), the coordinates of the human mouth and eye are taken from the 68 feature points that have been identified. In order to ascertain the driver’s state, the novel technique presented in this research combines these measures. As far as we know, the proposed model reduces parameter count for faster computation while improving the accuracy and speed of face fatigue detection. Besides, it effectively meets the demands of real-time applications and shows great potential for widespread use in fatigue driving detection.
In summary, the contributions of this study are as follows:
(1) A neural network-based detection approach for lightweight face fatigue is proposed, in which the MobileNetv3 network is introduced to substitute the CSPDarkNet (Cross Stage Partial Darknet) of the original YOLOv8 backbone. Moreover, in order to satisfy the demand for real-time detection, the traditional convolutional model is changed into a depth-wise separable convolution to reduce the amount of computation and the number of parameters.
(2) The backbone network incorporates channel-prior convolutional attention. Specifically, the ability of the convolutional operation is improved by the inclusion of a multi-scale structure to capture spatial relations. As a result, the network may improve its feature extraction capabilities and dynamically distribute weights in both the channel and spatial dimensions. Additionally, it also efficiently captures important facial information.
(3) The loss function of the bounding box optimization model is introduced as Focal-EIOU, which increases the model’s rate of convergence and boosts facial feature recognition accuracy. This approach can effectively balance disequilibrium between the categories of high-quality samples (human face) and low-quality samples (no human face) in the process of face detection.
(4) A novel multi-feature fusion detection technique for fatigue driving is developed to precisely evaluate the fatigue level of drivers by calculating the mouth-eye aspect ratio value.
After providing an overall introduction to this article, the various parts of this paper have also been summarized. The second part is the method part, which introduces YOLOv8 and the lightweight network MobileNetv3, including feature point location and fatigue judgment methods. The third part is the experimental part. This article compares recent methods based on object detection speed, detection accuracy, and the speed and accuracy of fatigue detection. The fourth part makes a summary and outlook.
The method consists of three parts. First is face positioning, a real-time camera captures the original image of the driver’s face. Since neural networks are highly convenient in the field of target detection, we apply YOLOM-Net for real-time face positioning and face detection in various lighting and complex environments. The second part involves verifying the positions of feature points after face recognition by using YOLOM-Net. Then, facial feature points are annotated by using the Dlib toolkit. Next, an algorithm is created to extract the coordinates of each feature point in the picture. By using the acquired coordinates, the aspect ratio of the driver’s lips and eyes is computed. Lastly, fatigue is assessed based on whether the mouth and eyes parameters are higher or lower than the threshold value. During the procedure, the multi-feature fusion approach is used to determine the driver’s level of weariness. Fig. 1 shows the recommended approach in the flow chart of this work.
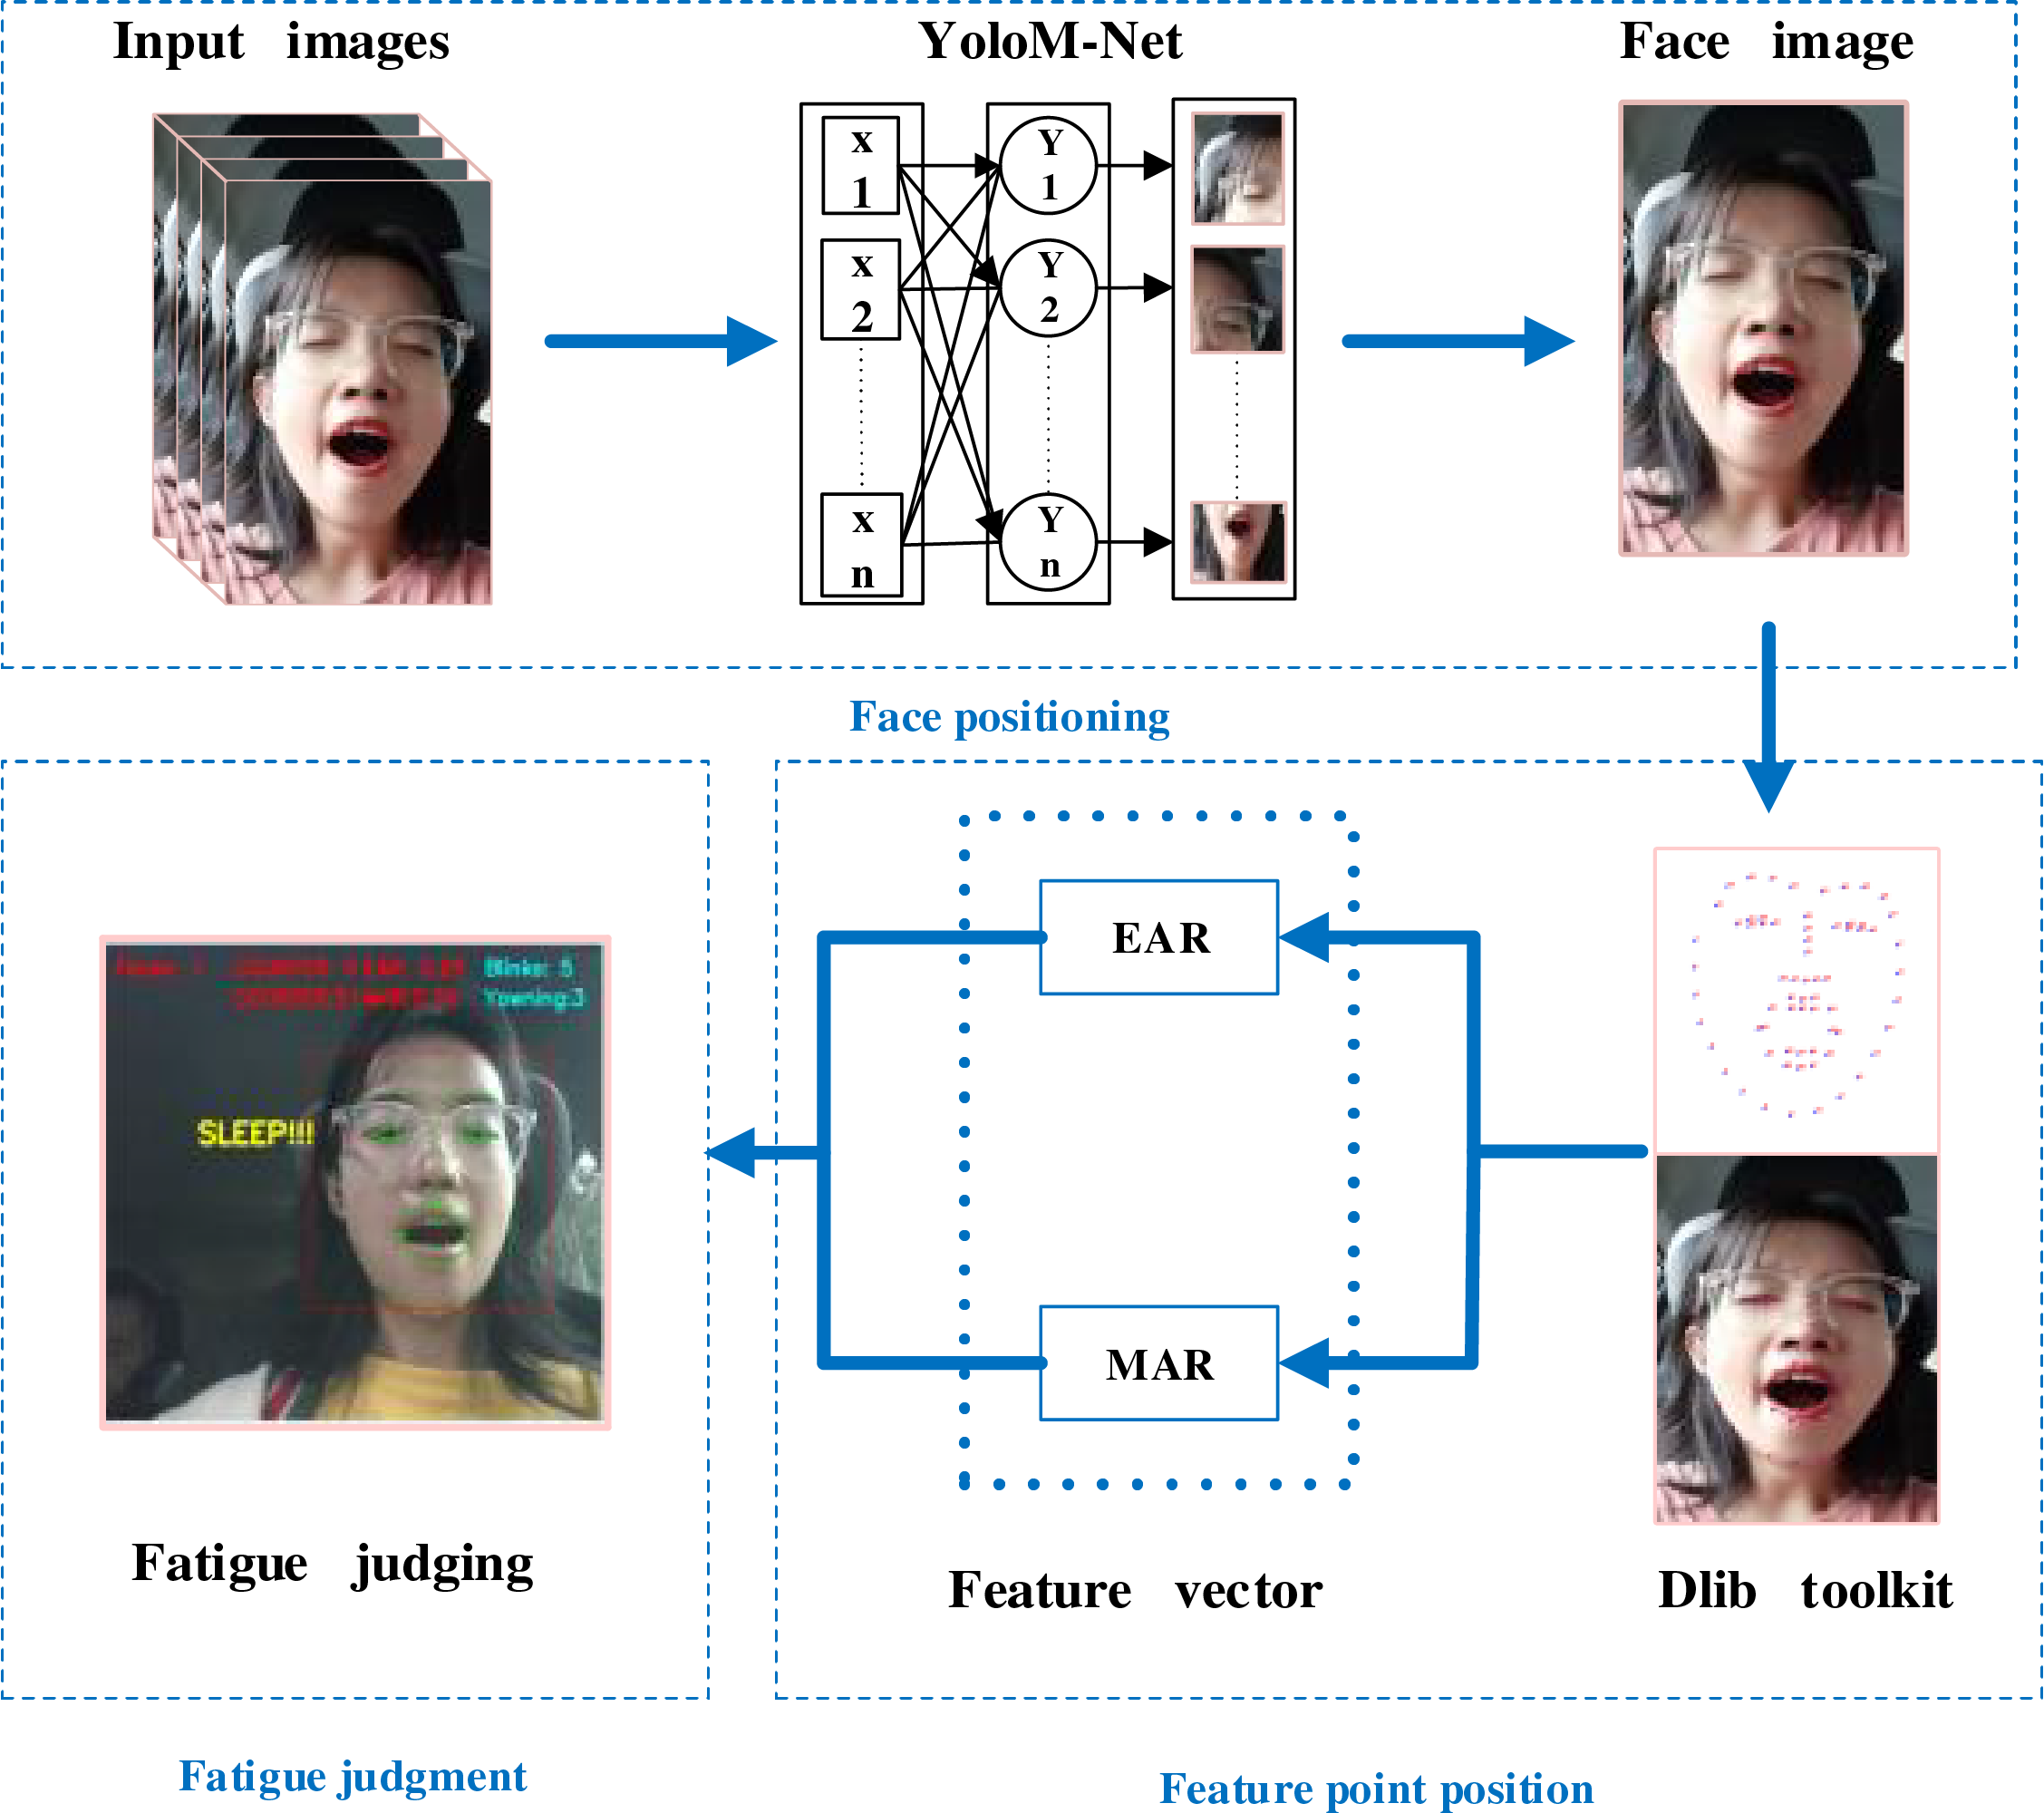
Figure 1: Overall structure diagram of fatigue detection method
At present, the classical target detection methods mainly include the single-stage and the multi-stage methods. The single-stage methods perform target detection with a single feature extraction step, offering faster detection speeds but generally lower accuracy compared to multi-stage methods. To meet the need for high detection speed, this paper adopts the YOLO (You Only Look Once) series algorithm. The core principle of YOLO involves inputting an image, processing it through a neural network, and obtaining both the bounding box positions and their corresponding categories. It is a one-stage target detection network favored because of its fast detection speed and easy realization. Three scale detection layers are used by the sophisticated object identification model YOLOv8 to handle items of various scales, taking into account the multi-scale nature of things. However, due to the limited computational capabilities of mobile devices, the model detection is slow and the face detection accuracy is low for complicated backdrops. This study uses YOLOv8 as the foundation model and optimizes it in terms of the loss function, attention mechanism, and backbone network in order to solve the aforementioned issues. In Fig. 2, the network structure is displayed.
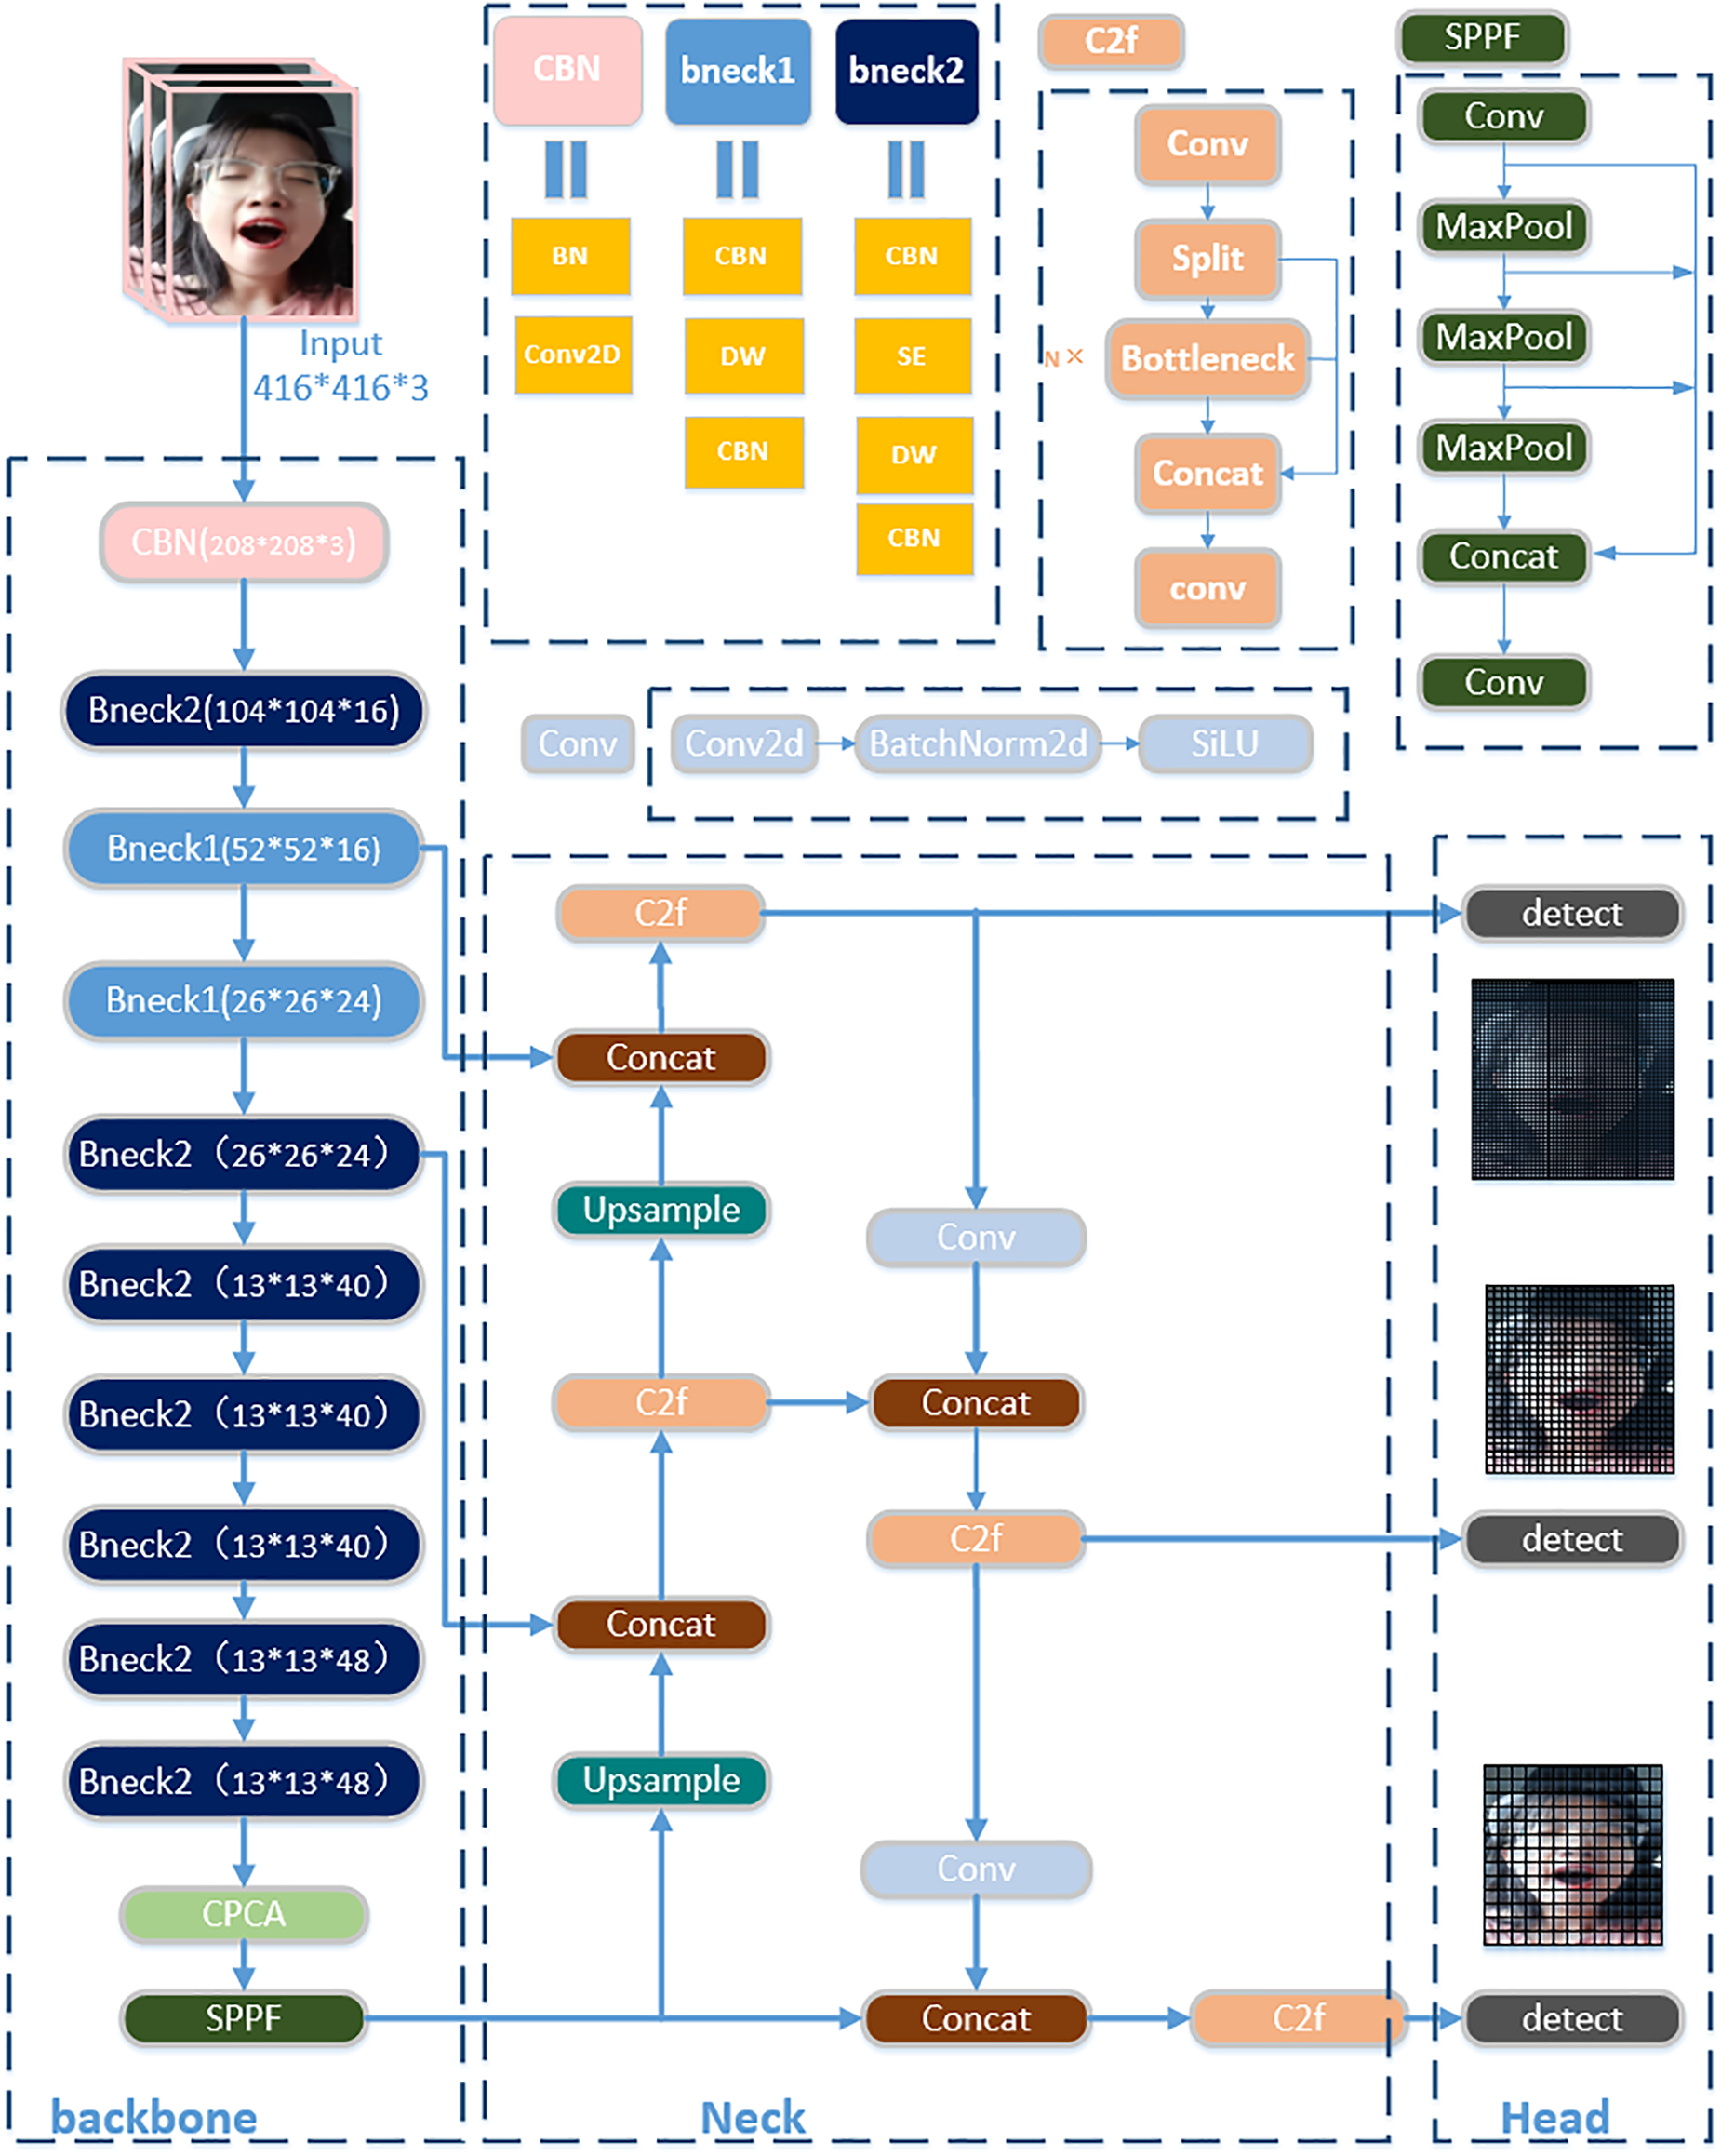
Figure 2: The network structure of YOLOM-Net
The three essential components of this paper’s network structure are the head, neck, and backbone. Based on the use of MobileNetv3 as the paper’s backbone network, the CPCA attention mechanism is presented. MobileNetv3 begins with the CBN (Convolutional and Batch Normalization) module, which primarily consists of the H-switch activation layer, Batch Normalization layer (BN), and convolutional layer. Specifically, H-switch, a nonlinear activation function, lowers computation, which contributes to the network’s increased inference speed. MobileNetv3’s fundamental module, Bneck, is primarily implemented using residual connections, Squeeze and Excitation (SE) channel attention mechanisms, and Depth-Wise separable convolution (DW). The network undergoes a
The Neck plays a connecting and fusing role, connecting the feature extraction parts at different depths and fusing these features as a way to obtain richer feature information that can make the detection head better for the regression task. The C2f (Faster Implementation of CSP Bottleneck with 2 convolutions) module is used in Neck. In particular, the C2f module adds extra layer-hopping connections, removes the convolution operation from the branches, and adds the Split operation to enhance the feature map information in order to branch the tandem Bottleneck modules across layers. A convolution module, a normalization layer, and an activation function SiLU (Sigmoid-Weighted Linear Unit) make up the Conv module. The SiLU activation function curve is better appropriate for situations when more input information must be retained because it is smoother when it approaches zero than the Leaky ReLU (Leaky Rectified Linear Unit) activation function curve.
2.1.2 Feature Extraction Network
(1) MobileNetv3
This paper uses the Bneck module of MobileNetv3 to construct a feature extraction network, furthermore, integrates efficient Point-wise and depth-wise convolution modules in the Bneck. Compared to CSPDarknet, this results in significantly fewer convolutional layers in the network while reducing the computational complexity of the model. The difference between depth-wise separable convolution and standard convolution is shown in Figs. 3 and 4.
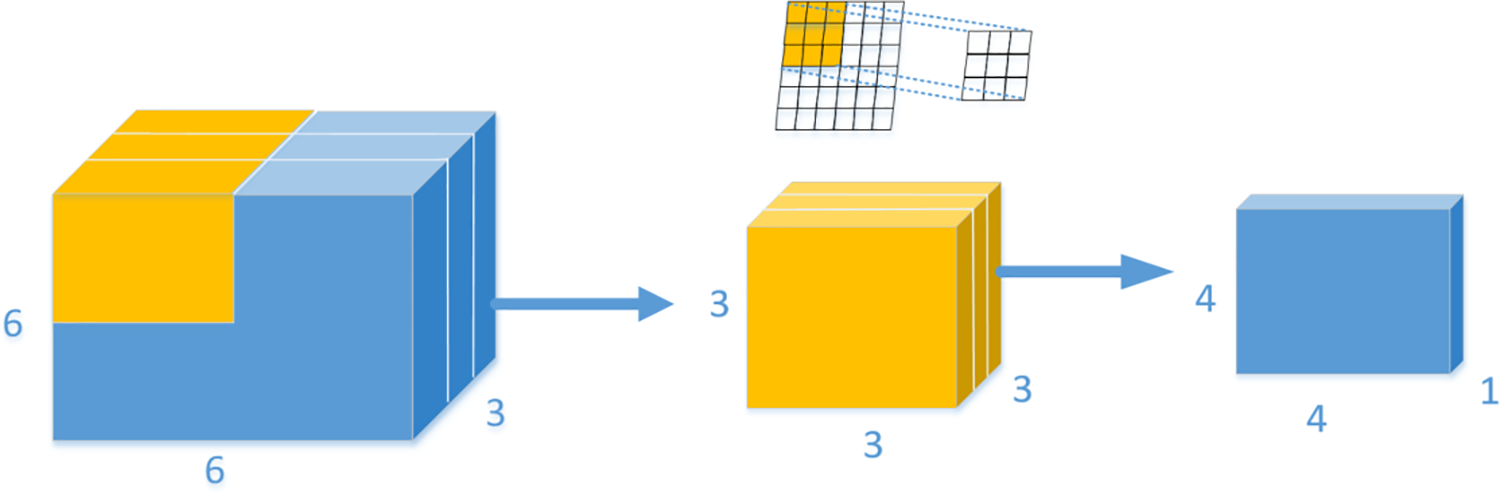
Figure 3: Standard convolution operation
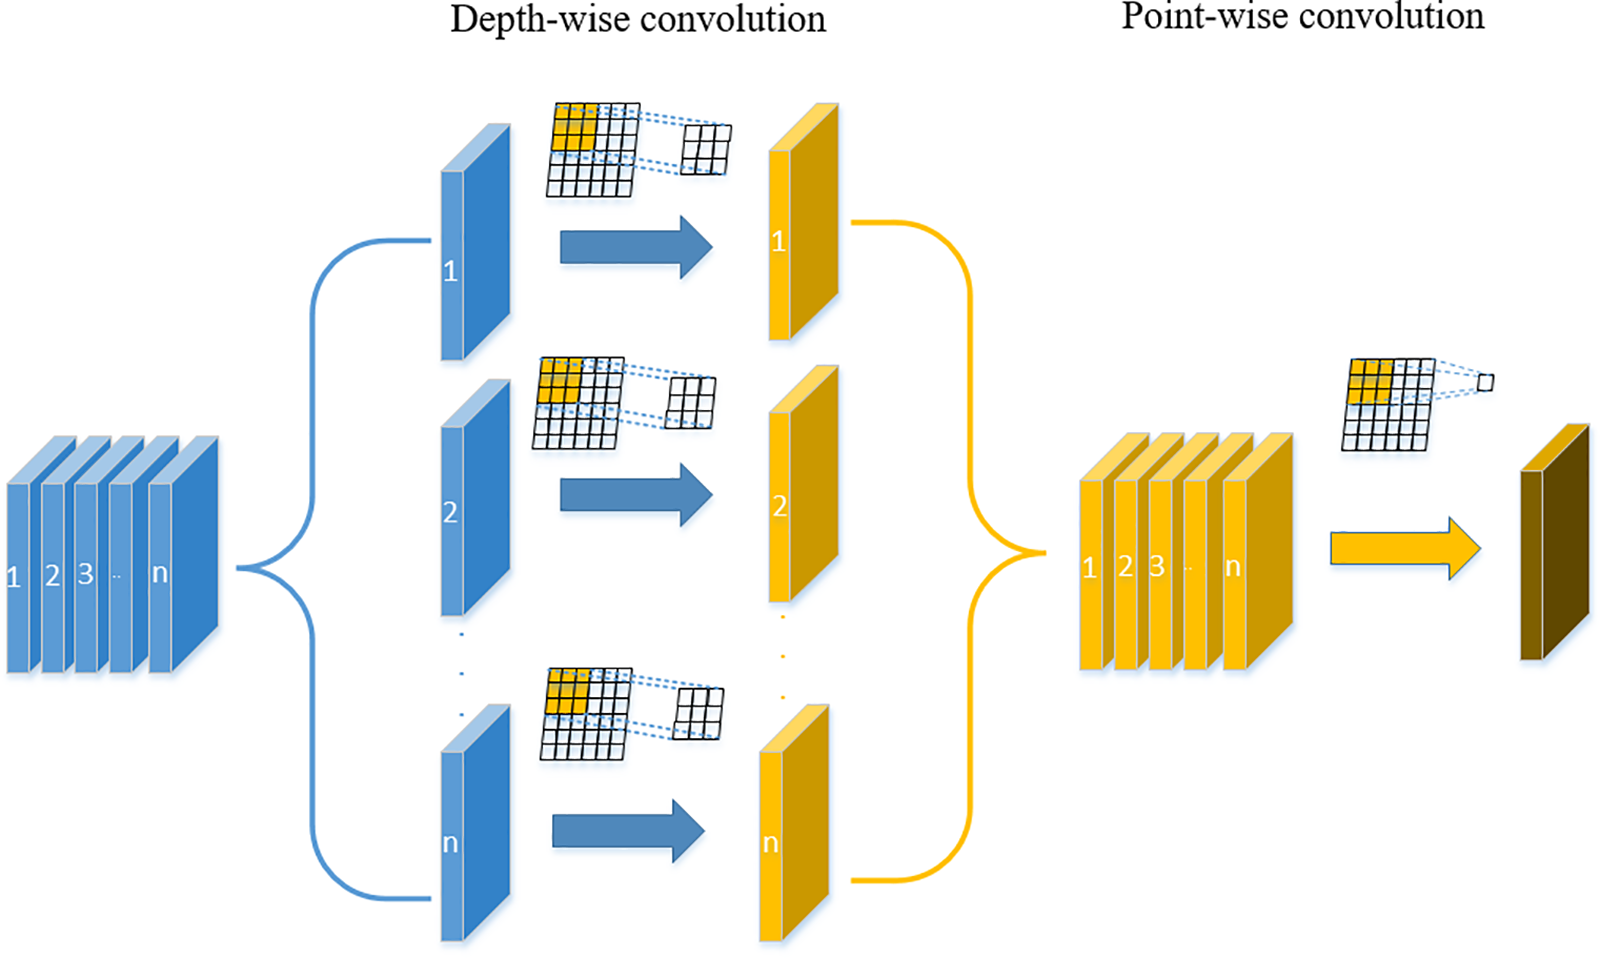
Figure 4: Depth-wise separable convolution operation
A. Standard convolution
The original image is in RGB (Red, Green, Blue) format with three channels, which is equivalent to a three-dimensional picture. As shown in Fig. 3, when the input picture format is
B. Depth-wise separable convolution
For ordinary convolution, assuming the input feature map size is
The main differences between standard convolution and depth-wise separable convolution are shown in Table 1.
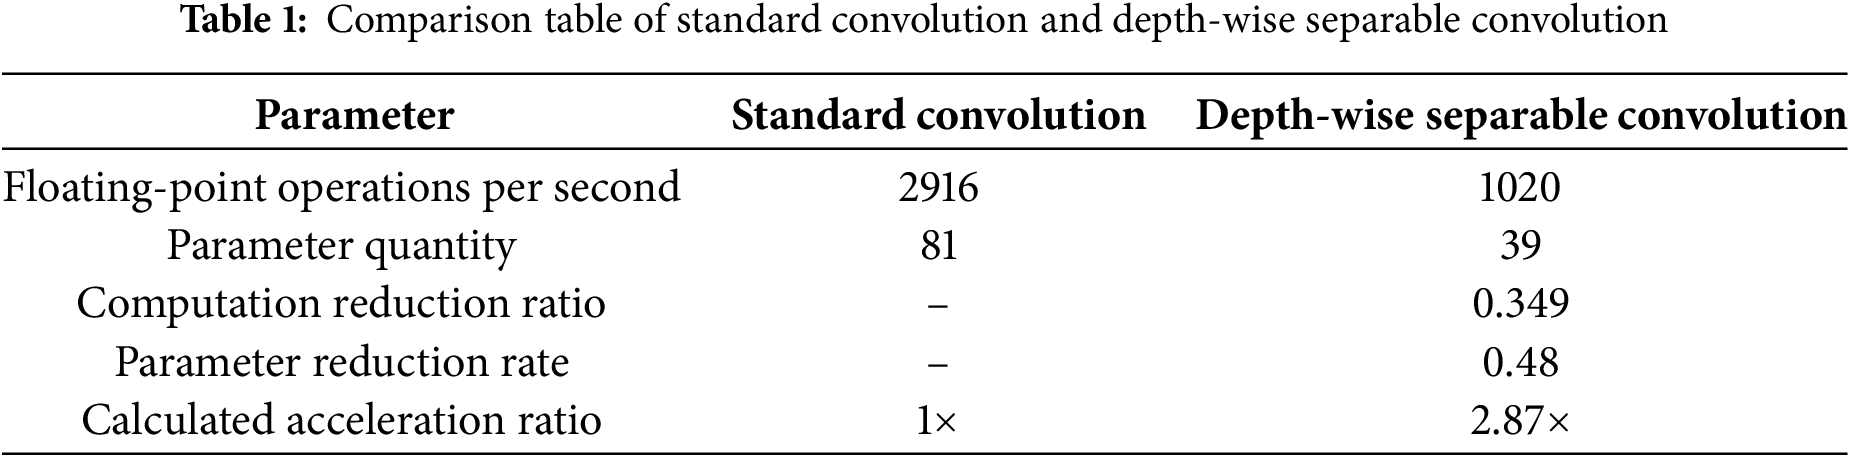
MobileNetv3 as a lightweight network, combines the advantages of MobileNetv1 and MobileNetv2. The depth-wise separable convolutions were introduced by the MobileNetv1 model, the inverted residual with linear bottleneck were introduced by the MobileNetv2 model. On the image dataset, the accuracy of MobileNet3 and VGG-16 (Visual Geometry Group 16-layer network) is almost the same, but the parameter amount is 1/32, and the calculation amount is only 1/27.
(2) Channel prior convolutional attention
The MobileNetv3 network structure can handle complex problems more efficiently during feature extraction. Nevertheless, the SE attention mechanisms do not capture attention in the spatial dimension; instead, they only take into account attention in the channel dimension. There are problems with the dimensionality reduction operation in SE, which can seriously interfere with the prediction of channel attention and negatively affect it. Therefore, in this paper, in order to improve the model’s detection accuracy while maintaining sufficiently lightweight. CPCA is introduced in this research to include two analysis dimensions: spatial attention and channel attention, together with a multi-scale deep convolution module. Fig. 5 displays the network structure diagram.
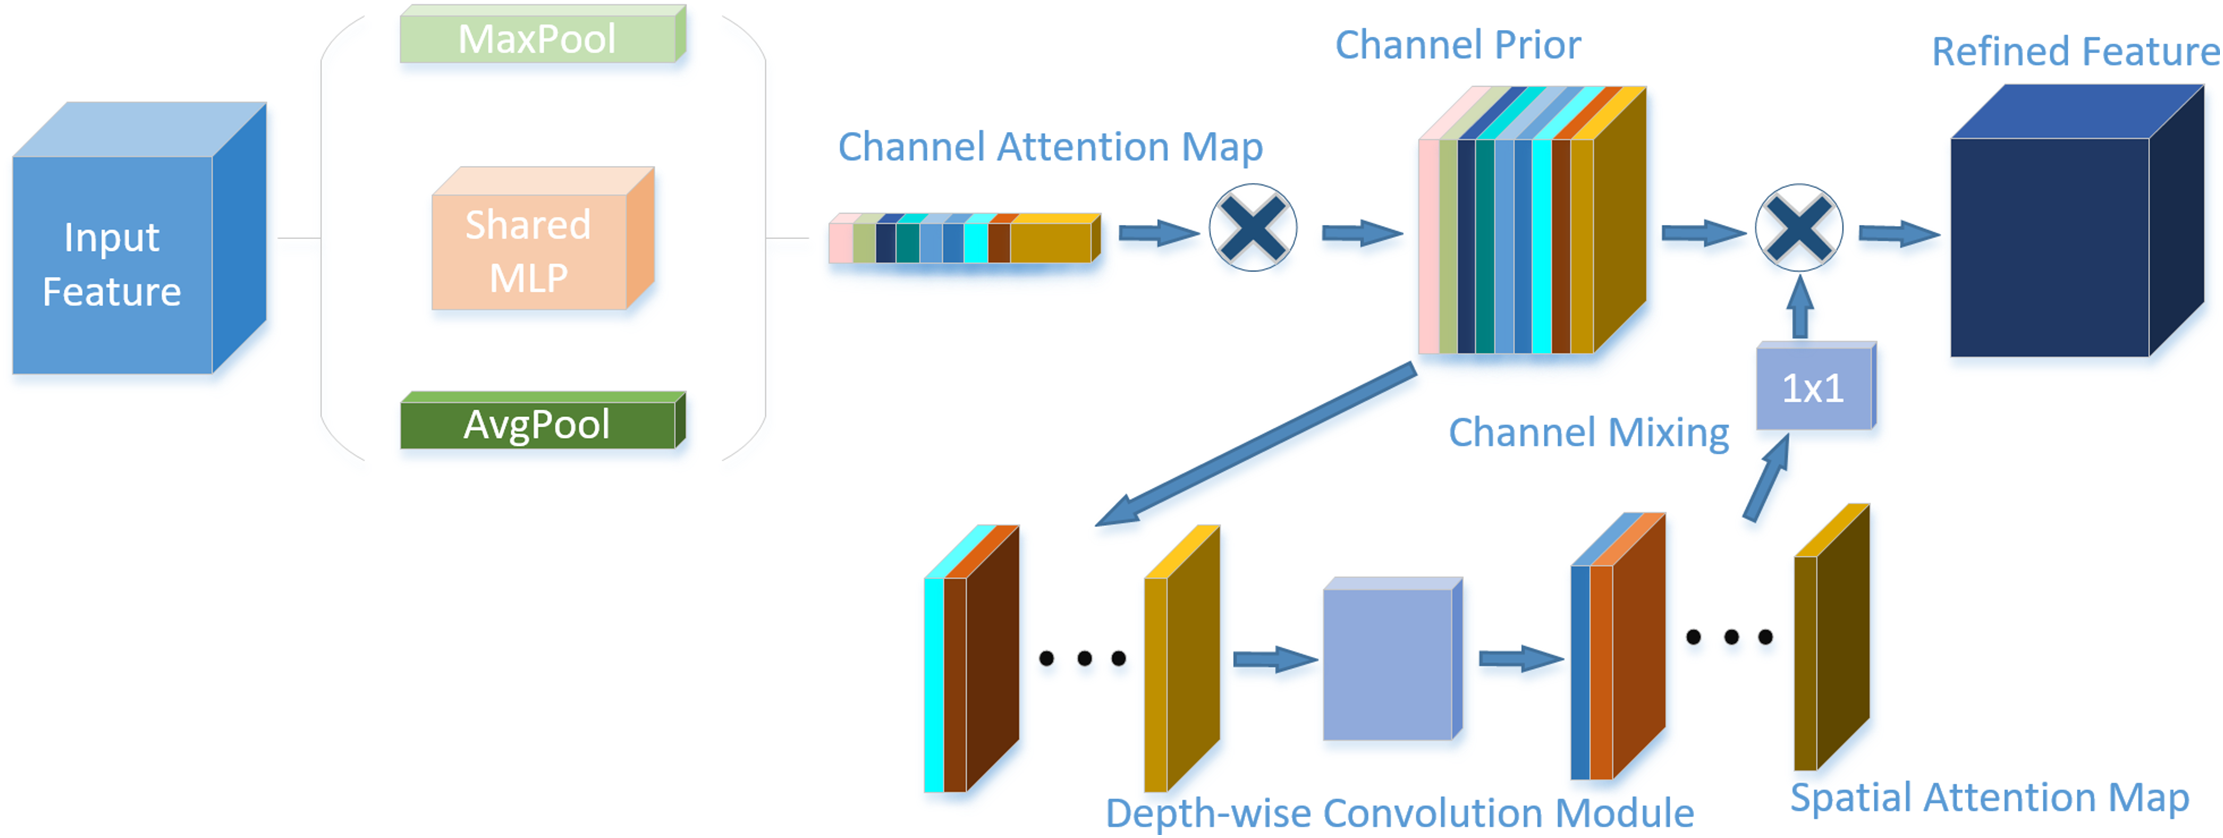
Figure 5: CPCA network structure diagram
The loss function of YOLOv8D primarily comprises regression loss and classification loss. The regression loss encompasses CIoU loss and DFL (Distribution Focal) loss, while the classification loss is VFL (Varifocal) loss. As shown in Eq. (1):
The bounding box loss function used by YOLOv8 is CIoU loss. Based on the Intersection Over Union (IOU) loss, this function considers and adds the aspect ratio of the edge lengths, the distance from the center point, and the overlapping area of the bounding box regression as the penalty term factor. CIoU loss which is defined as shown in Eq. (2):
CIoU loss uses relative ratios of the width and height of the target frame rather than the direct values of width and height. Aspect ratios can be used to describe the relative relationship between the width and height of an object. However, due to factors such as their relativity and the failure to consider the difficult sample balance issue, it may produce a certain degree of ambiguity and bias. Therefore, based on
Traditional IOU loss functions might treat simple and difficult samples identically, resulting in the necessity of more complex network structures to handle all samples. Focal-EIOU mitigates the influence of simple samples on network training through an automatic weighting mechanism, thereby reducing the requirement to learn unnecessary features by concentrating on difficult samples for the same task. Meanwhile, the optimization of the center point offset and aspect ratio of the target frame is introduced. The more precise bounding box regression decreases the generation of redundant frames and lowers the complexity of post-processing. The model can attain the same prediction accuracy with fewer parameters. The loss function formula used in this paper is shown in Eq. (3):
Enhancement based on two classical functions, Focal loss, and EIOU loss, yields Focal-EIOU loss. In particular, EIOU loss may efficiently maximize the target frame’s regression accuracy and matching degree, whereas Focal loss concentrates on resolving the category imbalance issue. The benefits of these two loss functions are combined in Focal-EIOU loss, and the γ coefficient and IOU indicator are added to further enhance model training and prediction. A parameter γ is added to Focal-EIOU loss, causing the loss to change as IOU increases. The loss is bigger when the IOU between the target and prediction frames is lower, which encourages better model regression to the target frame and raises the accuracy of the regression. Focal-EIOU loss enables models to learn key features more effectively by optimizing bounding box regression and concentrating on difficult samples. By minimizing the reliance on complex network structures and resource waste, the network becomes lightweight. The loss curve for the training process is shown in Fig. 6.
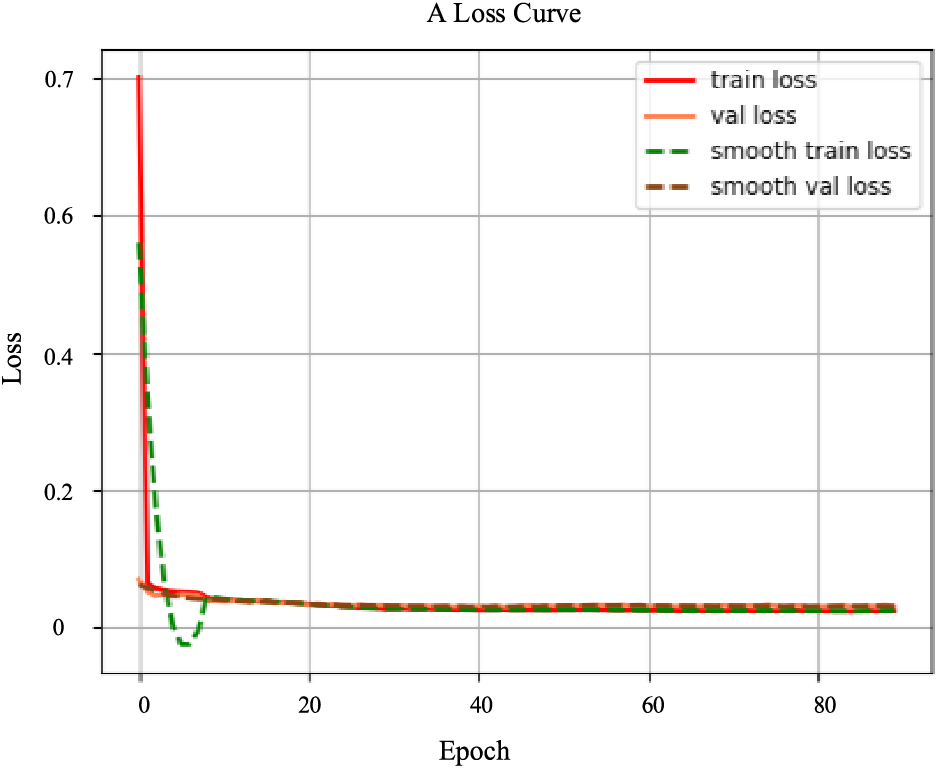
Figure 6: The loss rate of model training changes
Following face identification and positioning with YOLOM-Net, we apply facial feature point positioning using Dlib. Numerous machine learning and image processing methods are available in the C++ open-source Dlib package. It is quick and easy because it is a pre-trained machine learning model that comes with a trained model file that can be utilized immediately. Fig. 7 displays the localization of facial feature points. Fig. 7a is the 68 key points of the face utilized in the detection of this article, and Fig. 7b is the position of facial feature points through the Dlib toolkit.
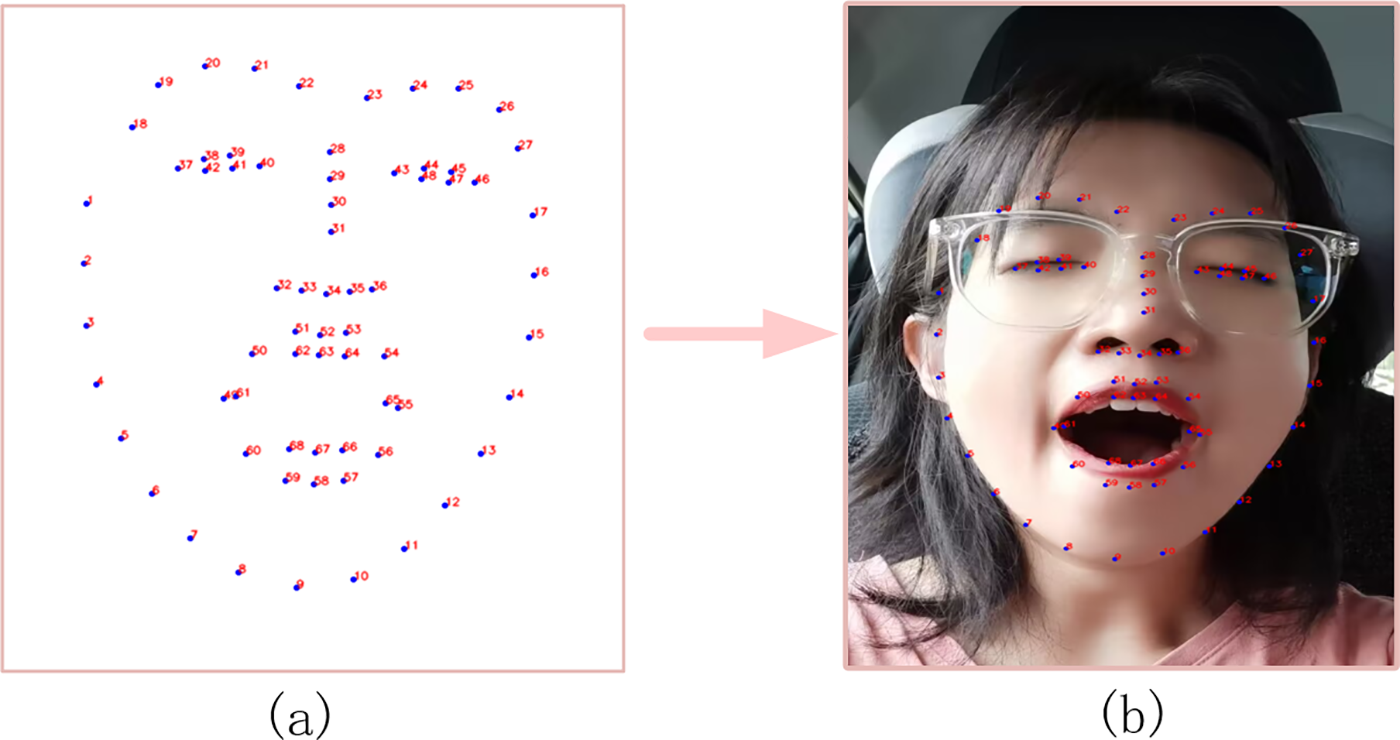
Figure 7: Driver’s face feature point acquisition based on Dlib. (a) Dlib face feature; (b) Face feature point positioning effect
The Carnegie Mellon Institute proposed the standard following numerous trials and demonstrations, and all of the earlier methods used PERCLOS (Percentage of Eyelid Closure Over the Pupil Over Time) as the standard to evaluate fatigue. Eq. (5) displays the PERCLOS calculation formula.
The closure judgment technique states that the eye is closed when the eyelid covering the pupil is more than 70%. The percentage of time spent with the eye closed is then calculated within a given time frame. However, this method is highly dependent on the eyelid-pupil coverage, which can result in imprecise measurements. To overcome this problem, this paper presents two characteristic variables: EAR and MAR, which will enhance the algorithm’s performance. The pupil size is determined using the elliptical fitting approach, whereas these two feature vectors may be produced by algorithms. By evaluating the ellipse’s long and short axes, the MAR and EAR are computed. In this article, EAR is intended to be measured and averaged independently for the left and right eyes. Determine whether the eye length-to-width ratio is higher than the threshold value for each video frame. Based on this, 0.2 is the experimentally determined EAR cutoff value. EAR is defined as shown in Eq. (6):
The coordinates of the left eye of the face are 37 to 42, and the coordinates of the right eye are 43 to 48. The coordinates of the left and right eyes correspond to P1 to P6, respectively. The meaning of
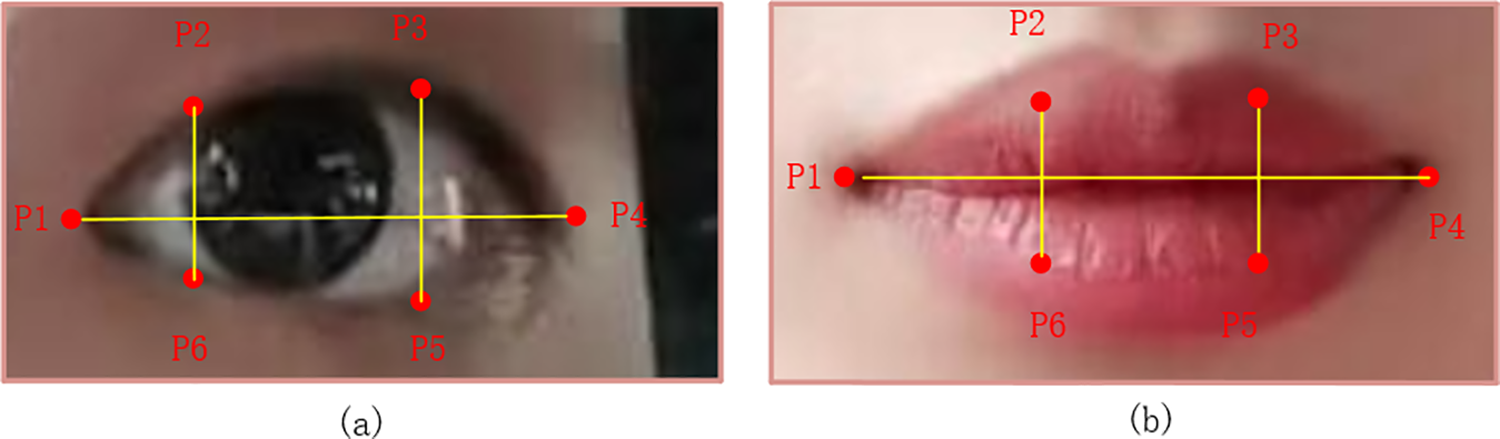
Figure 8: Schematic of key points for the eyes and mouth. (a) Key points of the eye; (b) Key points of the mouth
The second parameter is the MAR, this vector is used to judge the degree of mouth closure. The definition of this parameter is similar to EAR, and the threshold of MAR was experimentally set at 0.5. It is defined as shown in Eq. (7):
Using the vertical coordinates of 51, 53, 57, and 59, with the horizontal coordinates of 49 and 55 in the face key-point map, where the 49 and 55 coordinates correspond to P1 and P4, respectively, and the 51, 53, 57, and 59 coordinates correspond to P2, P3, P4, and P5, respectively. The meaning of
The facial feature points are initially found using the processed face image and the Dlib tool library. The coordinates of the mouth and eyes are then ascertained from the positioned feature points. The values of EAR and MAR are determined by the algorithm. Add 1 to the Ecount counter or 1 to the Mcount counter if the computed EAR
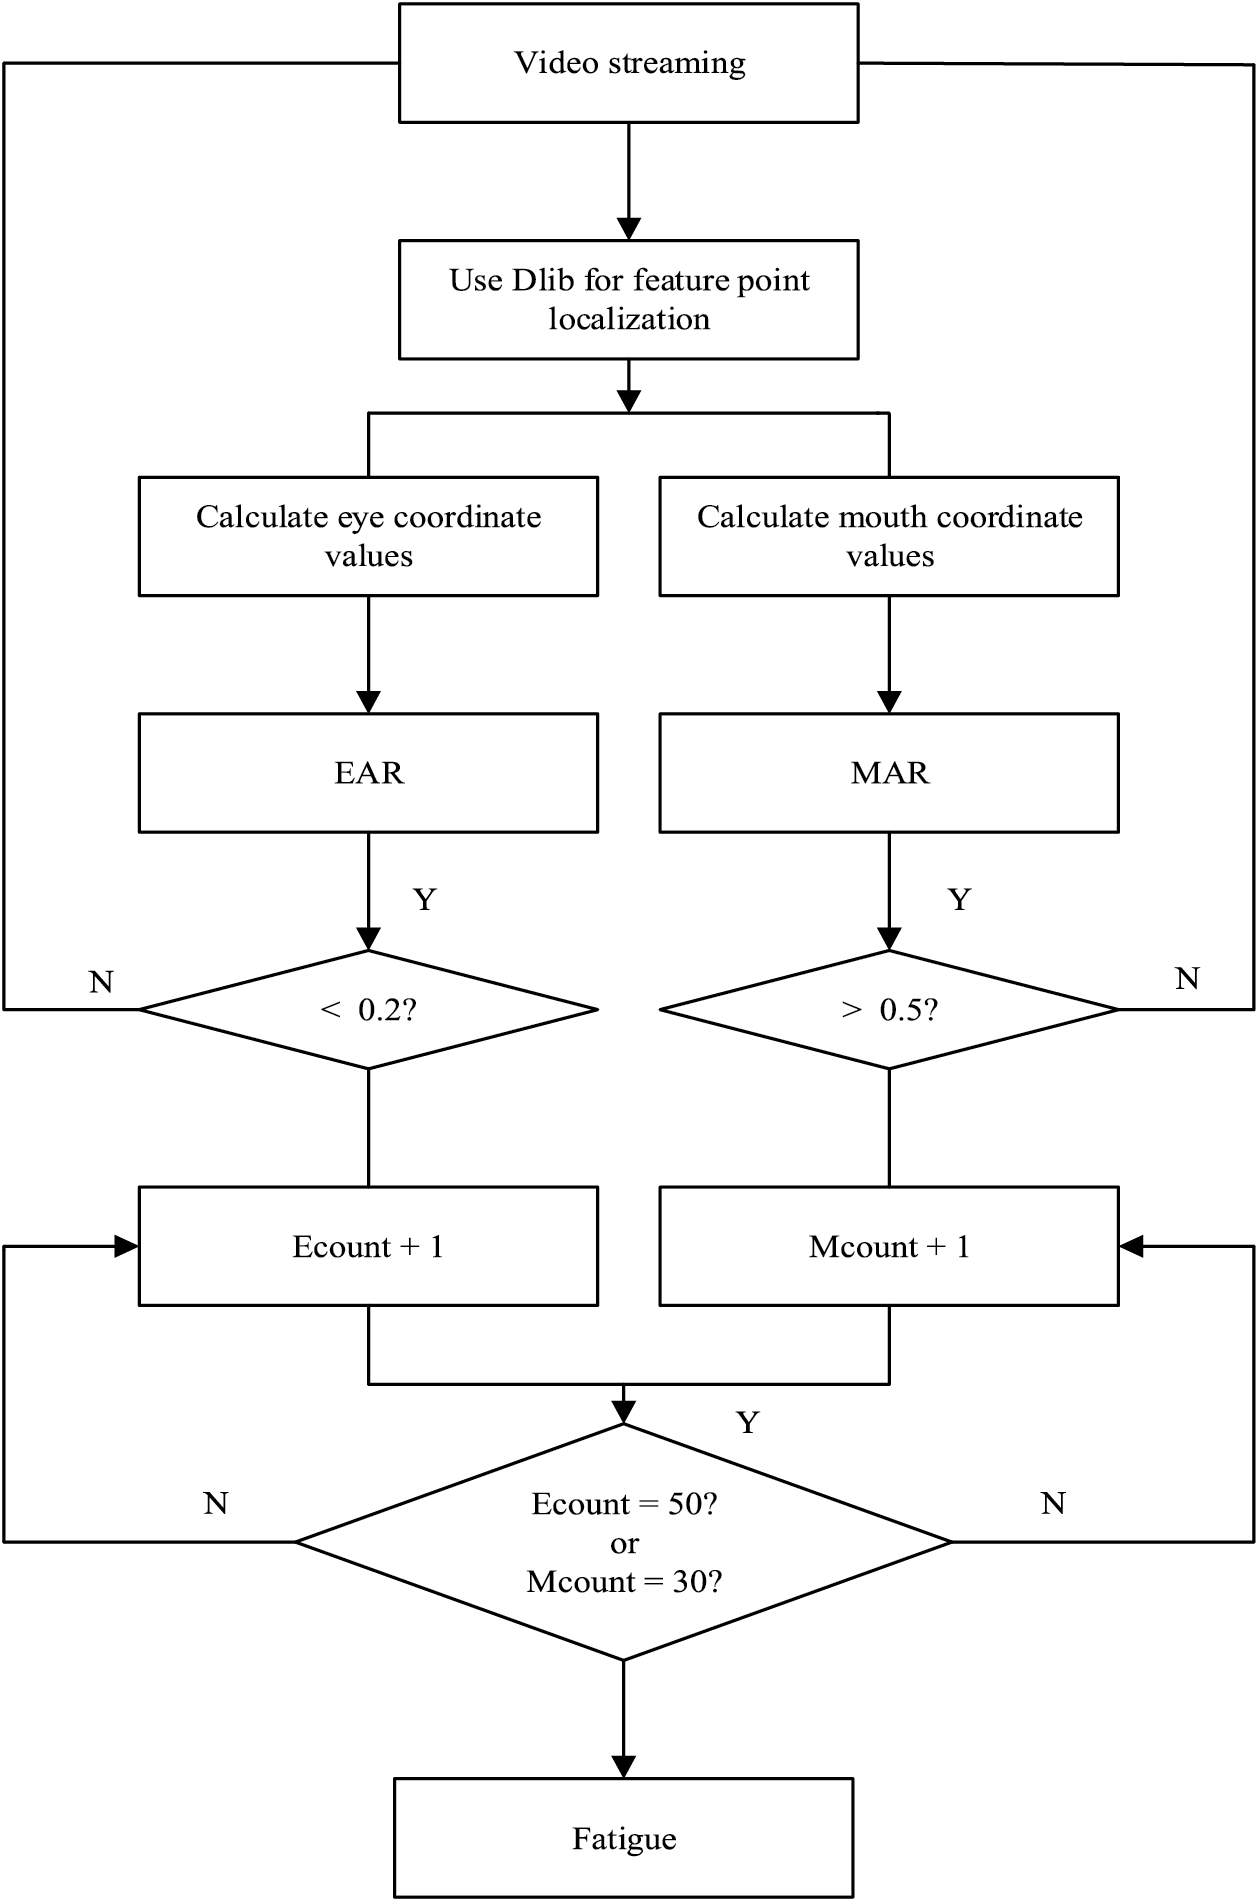
Figure 9: The steps of Judging fatigue
3.1 Experimental Environment and Datasets
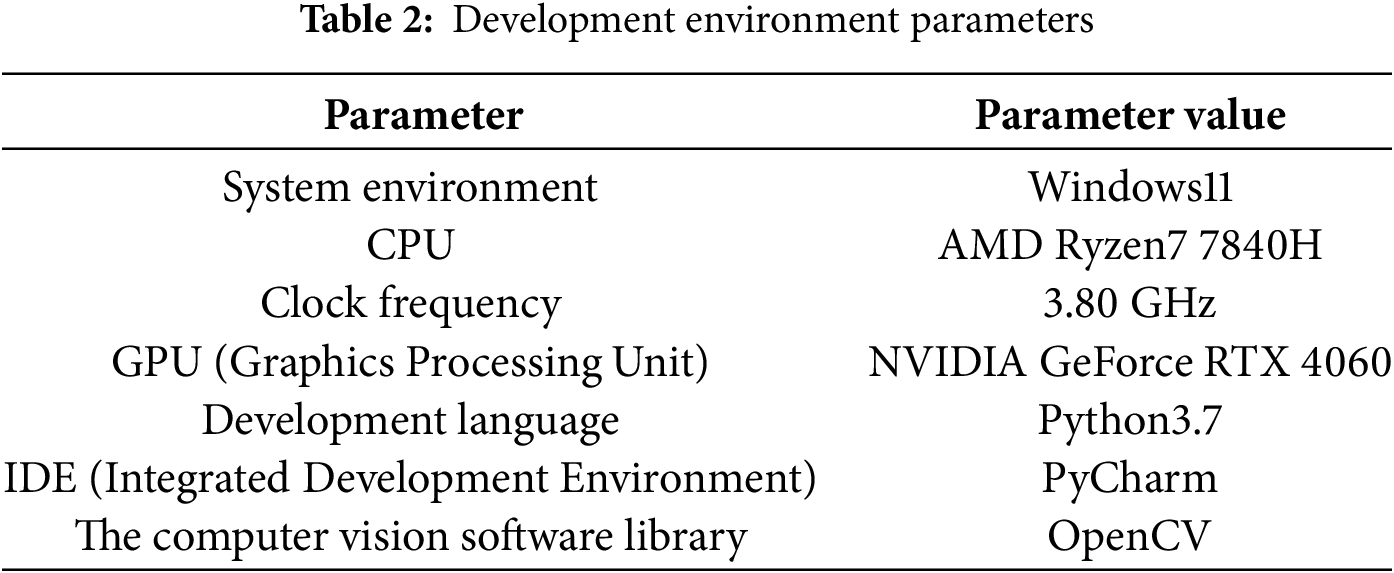
The detected algorithm model is implemented on an AMD (Advanced Micro Devices, Inc.) Ryzen 7 7840H processor with x64 architecture, and the CPU (Central Processing Unit) is clocked at 3.80 GHz. The graphics card is NVIDIA GeForce RTX (Ray Tracing Texel eXtreme) 4060. The programming environment for the implemented algorithm is Python 3.7, and the OpenCV computer vision software library is used. The following Table 2 describes the specific parameters.
The public dataset Helen FACE is used in the experiments. This dataset contains 2330 face pictures. At the same time, this article also uses the public dataset 300 W, which contains 300 indoor pictures and 300 outdoor pictures. 300 W covers a wide range of different types of images such as identity, expression, lighting conditions, pose, occlusion, and facial size, which helps to improve the robustness of model training. These pictures are applied to detect the accuracy of the model. However, these datasets contain various face pictures, and clear information about the fatigue state is hard to obtain from them. Therefore, to ensure that our network can judge the driver’s status, self-made datasets are needed to display the state information of fatigue.
In this paper, a total of 3000 images were gathered through the camera in the actual driving environment. The self-made dataset encompassed 6 drivers, consisting of 3 males and 3 females. The self-made dataset, Helen FACE, and 300 W dataset were integrated, amounting to a total of 5930 images. The dataset was divided into the training set, verification set, and test set at a ratio of 6:2:2. There were 3558 pictures in the training set, 1186 pictures in the verification set, and 1186 pictures in the test set. Fig. 10 shows the dataset we used.
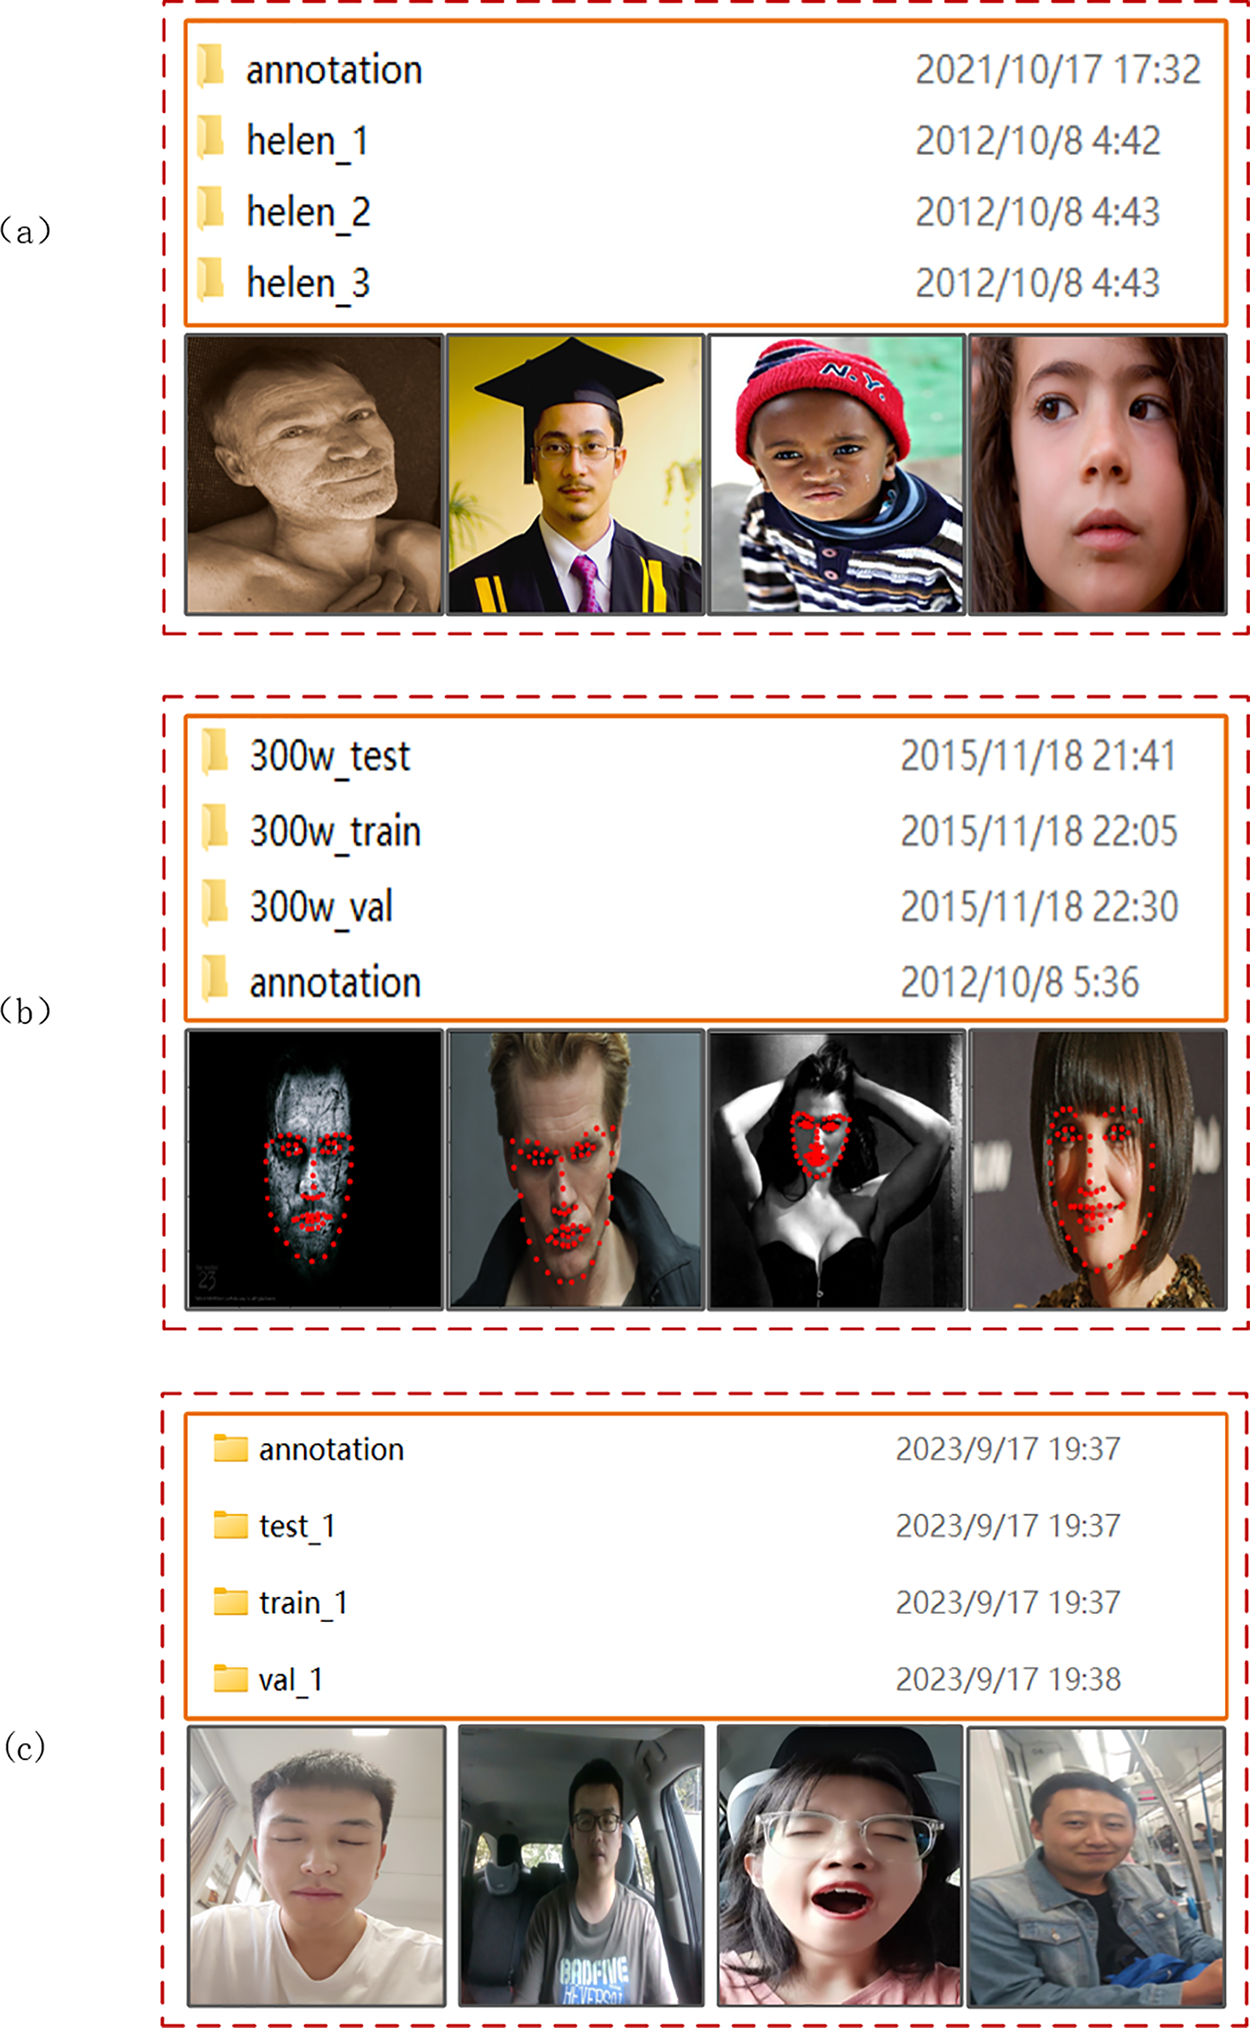
Figure 10: Sample images of datasets. (a) Helen FACE. (b) 300 W (c) Self-made dataset
(1) Precision
The so-called accuracy is used to measure the accuracy of the network’s detection results. The specific expression is shown in Eq. (8):
(2) Recall
The number of accurate forecasts as positive examples divided by the total number of positive instances is known as the recall rate. The specific expression is shown in Eq. (9):
(3) FPS
In object detection tasks, FPS represents the number of images the model can process and recognize per second. A higher FPS indicates that the model can analyze images and produce detection results more quickly, reflecting improved detection speed.
(4) F1-Score
Precision and recall are weighted averages that make up the F1-Score. Precision measures the model’s ability to correctly identify positive samples while avoiding false positives, whereas recall assesses its ability to detect all actual positive samples. The two are combined to get the F1-Score, and a higher F1 value indicates a more robust model. The specific expression is shown in Eq. (10):
(5) mAP
mAP offers a unified evaluation criterion that enables the performance of diverse models to be compared. If the IOU threshold for AP (Average Precision) values of a single category is set at 0.5, mAP is the average of AP values across all categories. AP and mAP are calculated as follows in Eqs. (11) and (12):
To verify the effectiveness of the enhanced methods in the fatigue driving recognition algorithm presented in this paper, several groups of ablation experiments with different combinations of improved methods were designed. The training parameters and optimization strategies for each group of experiments were kept exactly the same. The same dataset images were utilized to train and test the enhanced models with different combinations, while the results were compared and analyzed. The test results are presented in Table 3, where “✓” indicates that a particular improved method was used in a given group of experiments, while “
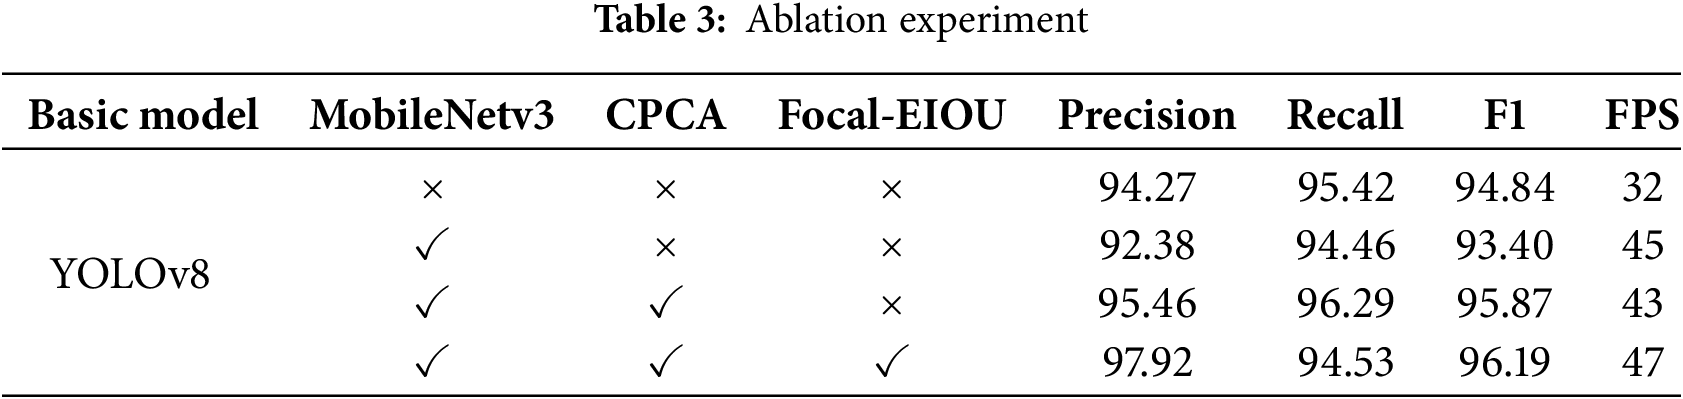
As observed in Table 3, upon introducing MobileNetv3 as the backbone network into the original YOLOv8 network, the recall rate of the model remained nearly unchanged, while the accuracy declined to some extent. Simultaneously, the speed of model detection was significantly enhanced, indicating that the number of model parameters can be effectively reduced by employing MobileNetv3. After incorporating the CPCA attention mechanism, the model’s accuracy improved, suggesting that the attention mechanism strengthens its feature extraction and expression capabilities. Finally, when the model was trained by replacing the original CIoU loss with the Focal-EIOU loss, it achieved the optimal recognition performance with an accuracy of 97.92 and FPS of 47. At this time, the model can precisely and rapidly determine the fatigue state of the driver.
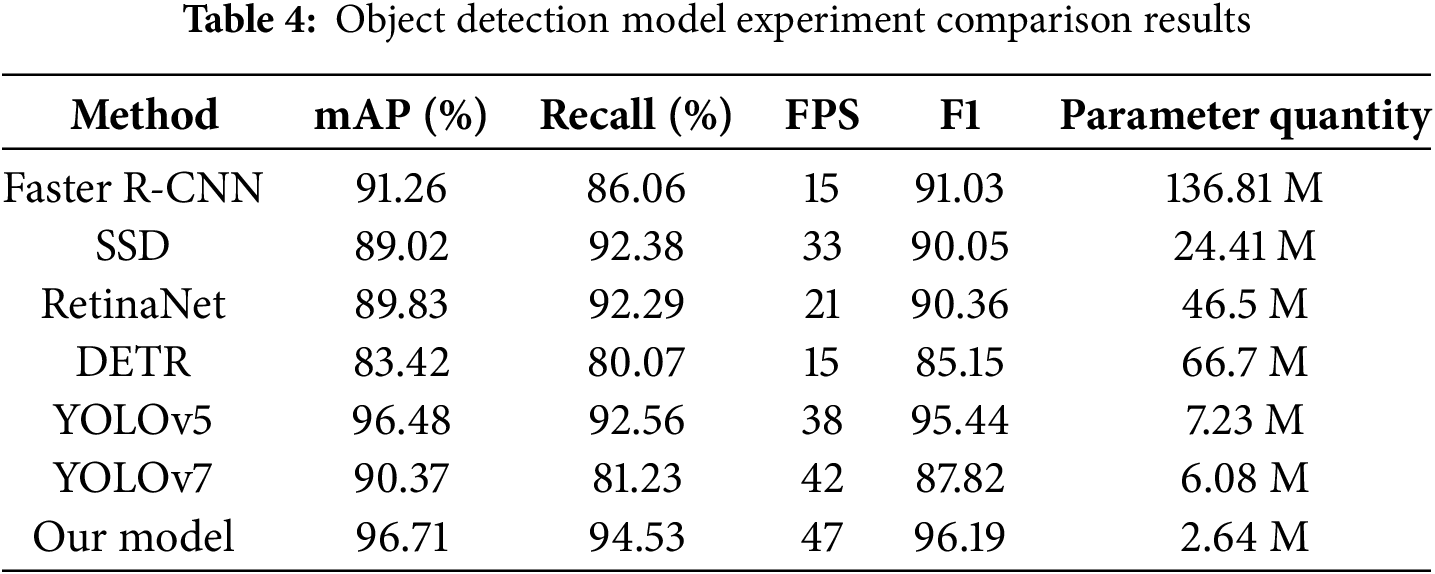
3.4 Target Detection Comparison Experiment
To verify the effectiveness and performance of this algorithm, we conducted a comparison of several models in the field of object detection. The selected comparison methods include commonly used target detection algorithms such as SSD, RetinaNet, DETR (DEtection TRansformer), YOLOv5, YOLOv7, and Faster R-CNN (Region-based Convolutional Neural Network). This paper trained, validated, and tested seven models using a combination of 4930 datasets, including the public 300 W dataset, the Helen dataset, and our own dataset. The detailed results are shown in Table 4. It is clearly observable that our model surpasses other models in terms of mAP values, recall rates, and F1 values. Meanwhile, YOLOM-Net possesses the fewest parameters and the fastest detection speed of 47 FPS. All in all, our algorithm can satisfy the expected requirements in terms of both accuracy and speed.
3.5 Fatigue Detection Comparison Experiment
In this paper, six novel approaches in the domain of fatigue driving detection are selected and compared using datasets under identical parameter settings. ShuffleNet, a lightweight convolutional neural network architecture, is combined with Dlib to determine driver fatigue. SSD can be predicted directly through only one forward propagation, when integrated with the Facenet algorithm, the driver’s status can be determined. MTCNN (Multi-Task Convolutional Neural Network) is a multi-task cascade convolutional neural network that can be employed to rapidly detect fatigue states. The Long Short-Term Memory (LSTM)+Dlib method detects the fatigue state of drivers via facial feature point extraction (Dlib) and time series analysis (LSTM). YOLOv5 and YOLOv7 are commonly utilized fatigue detection methods. The comparative experimental results are presented in Table 5.
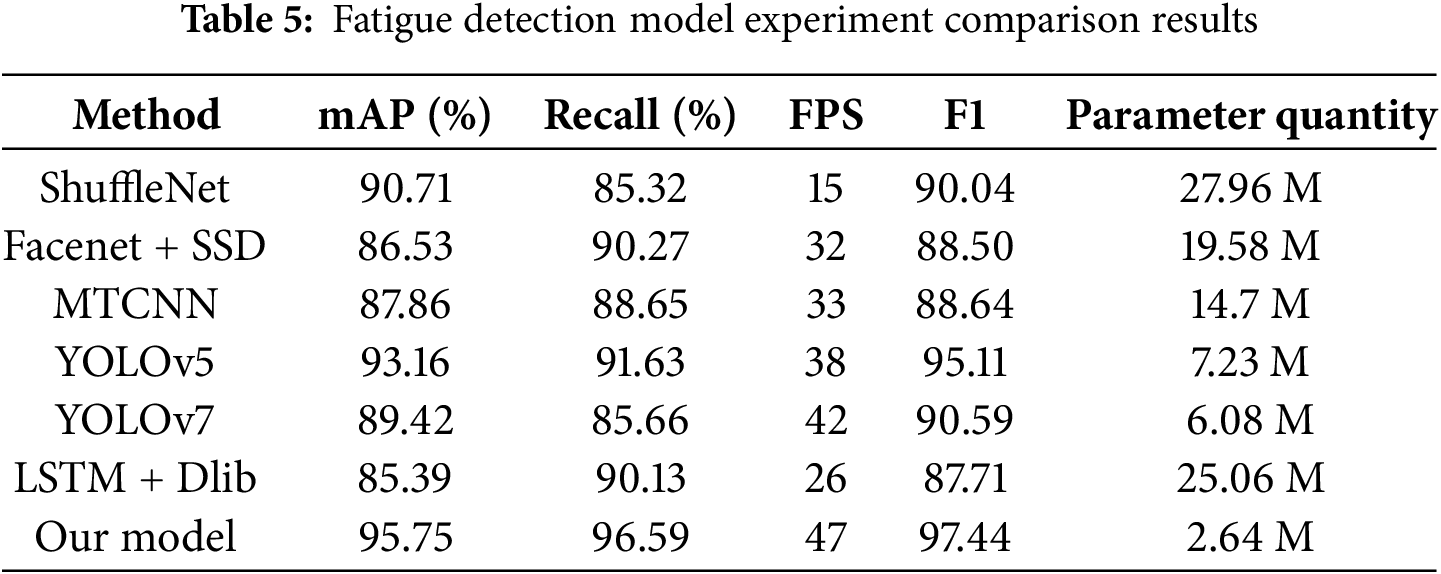
As presented in Table 5, the mAP of ShuffleNet is higher, yet its detection speed is slower. Both Facenet + SSD and MTCNN have a faster detection speed, but the model performance is significantly lower than that of other algorithms. The mAP value and speed of the YOLOv5 algorithm model are both relatively fast, but the effect is still not as good as that of the algorithm proposed in this paper. The accuracy and speed of fatigue judgment of the YOLOv7 and LSTM + Dlib detection methods are slightly lower than those proposed herein. Consequently, the method devised in this paper is the most appropriate for real-time detection of vehicle fatigue driving.
As depicted in Fig. 11, this paper also conducted a comparison of the F1 values for each method. Our model achieved a great value of 97.44% on the dataset, surpassing the performance of other methods. This indicates that the model presented in this paper outperforms other models in terms of performance and yields superior results in fatigue detection.
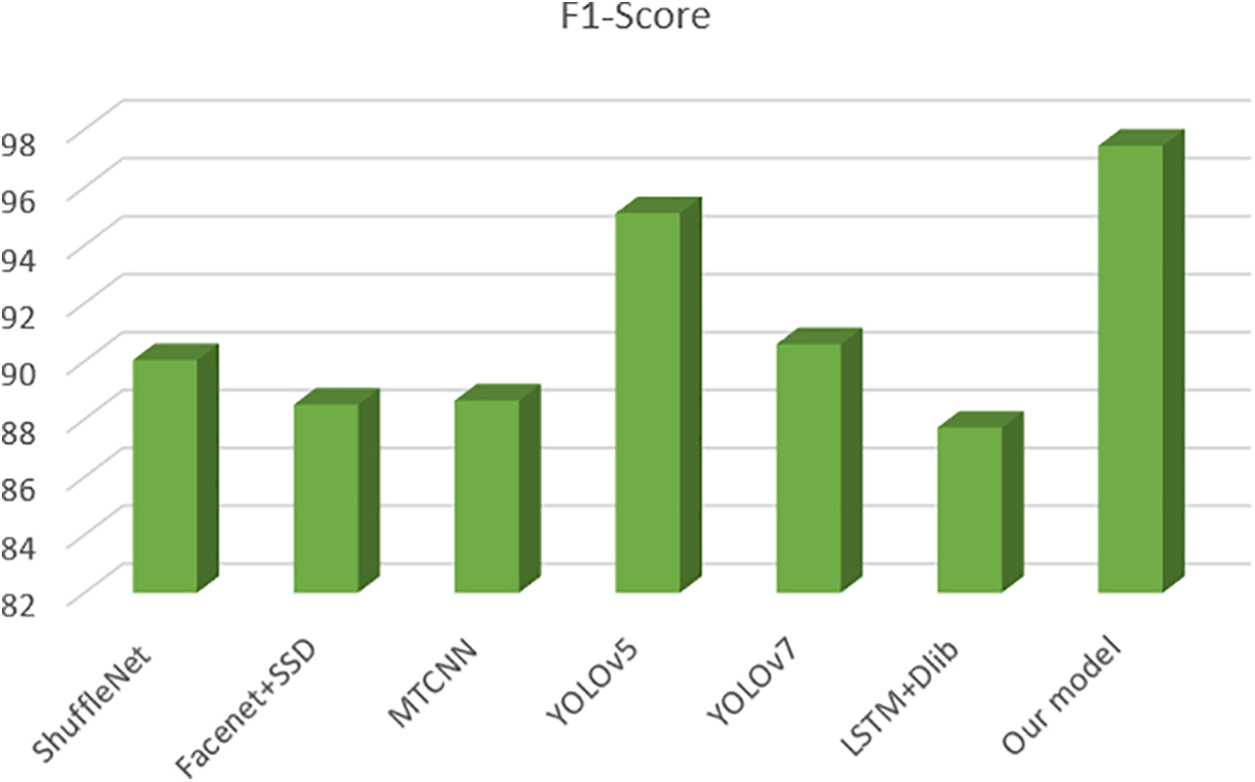
Figure 11: Fatigue detection model experiment comparison results
3.6 Actual Scene Detection Experiments
Two approaches have been developed to further validate the efficacy of the model in detecting driver fatigue under real-world conditions: video stream detection and real-time camera detection. The real-time camera detection is simulated under safe road conditions at the actual site, while video detection utilizes the Daytime public fatigue dataset and Night fatigue dataset to assess the accuracy of our model. The test environment is illustrated in Fig. 12.
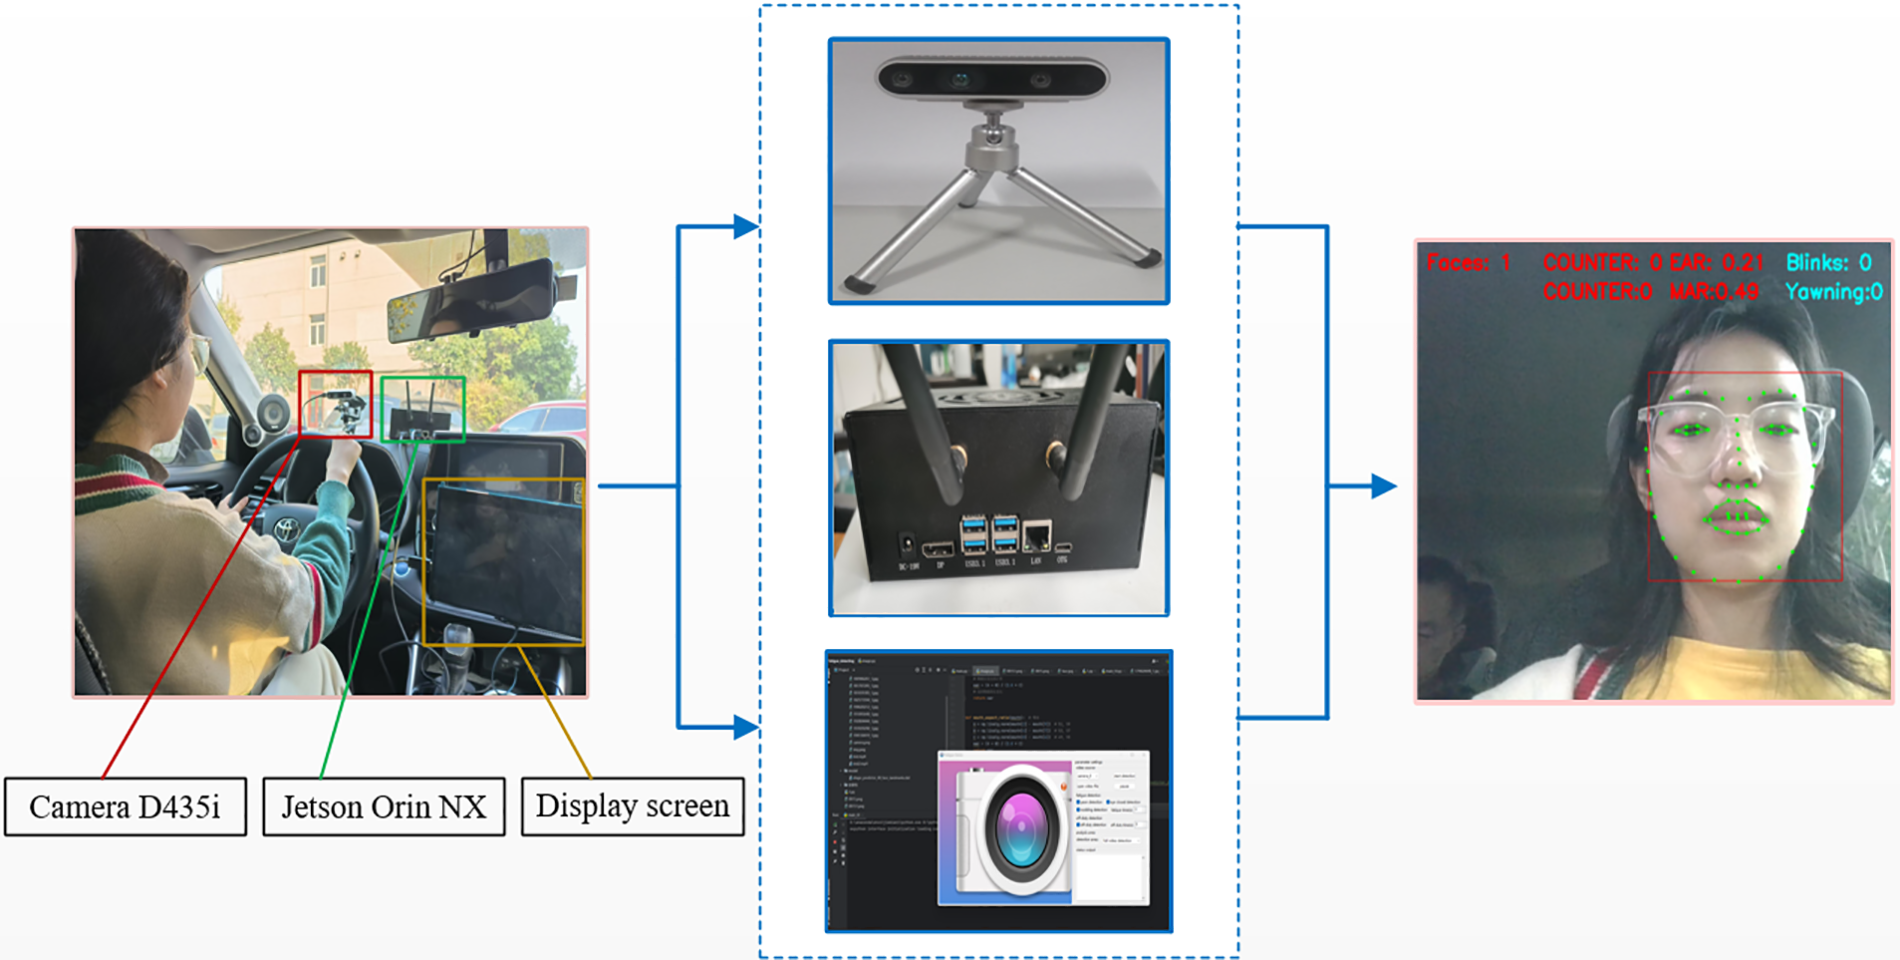
Figure 12: Actual scene construction
This paper transplants the fatigue driving model developed on the computer side to the Jetson Orin NX development component, making it capable of identifying fatigue driving behavior in real-time. The real-time detection camera uses the Intel Depth Camera D435i, which consists of a vision processor and a D400 module, also high flexibility and scalability. The specific test results are shown in Fig. 13.
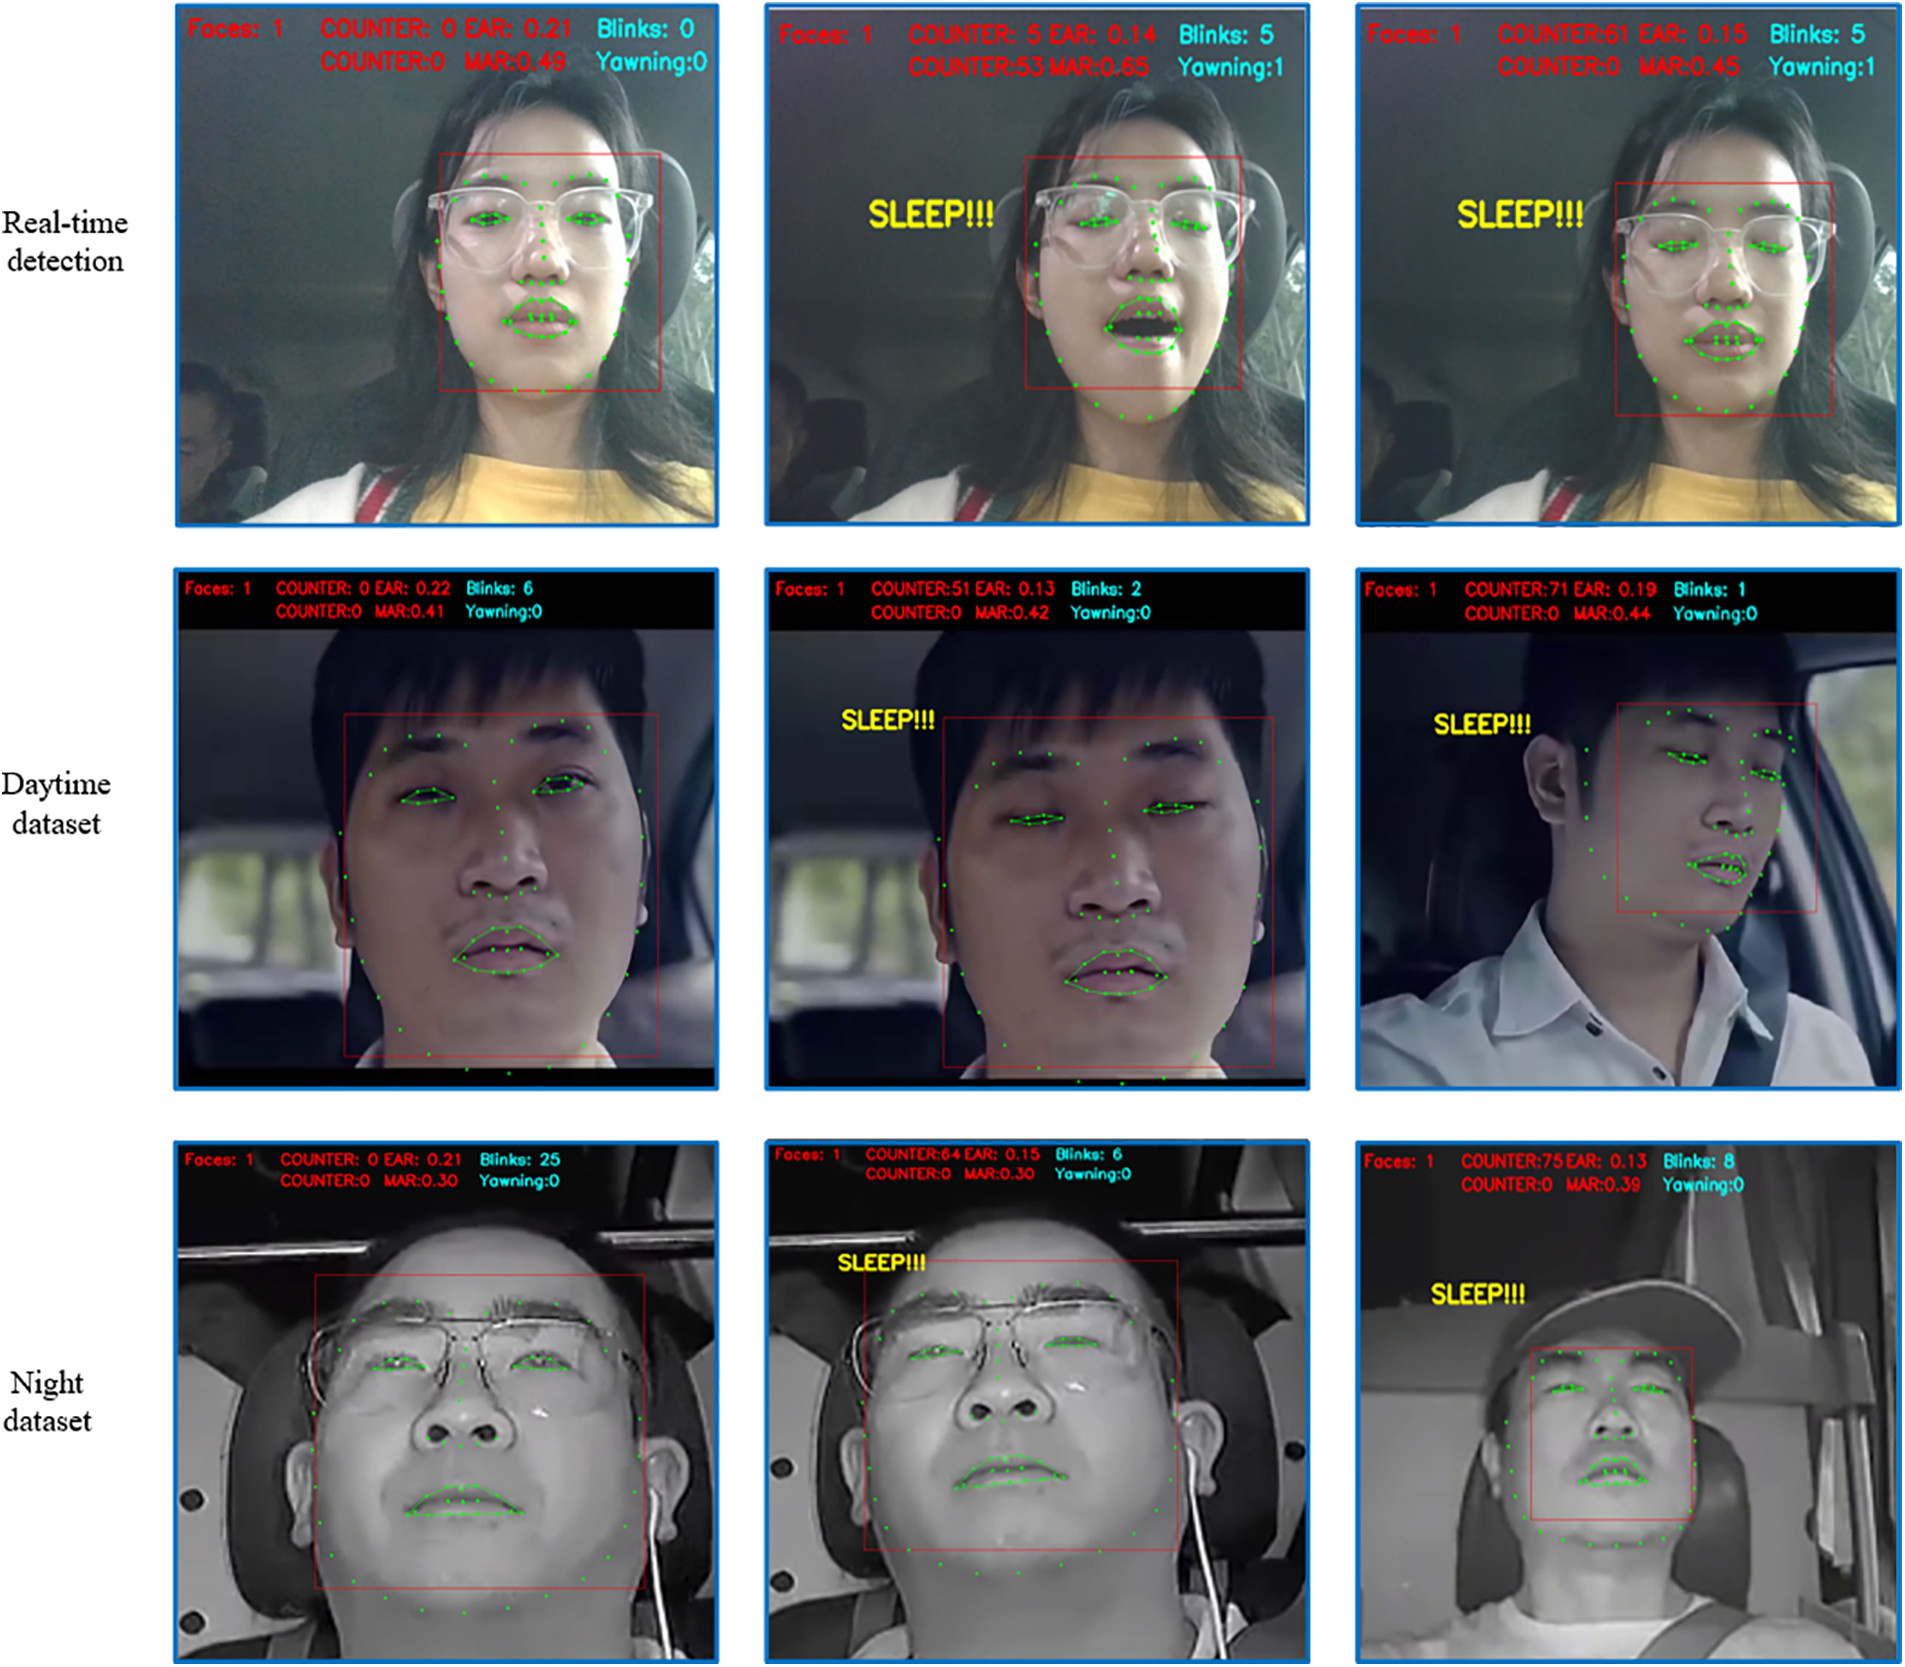
Figure 13: Effect picture of actual scene detection
The figure shows that when the driver is fatigued, the number of blinks and mouth openings increases significantly. When the threshold is exceeded, the system displays “SLEEP!!!” to determine that the driver is fatigued.
Based on the test findings, ROC (Receiver Operating Characteristic) curves are plotted in this research to further assess the model’s performance. The performance of YOLOv5 and YOLOM-Net is assessed using AUC (Area Under Curve), which is the area of the ROC curve. The more accurate the model, the higher the AUC value. Fig. 14 displays the receiver operating characteristic curves. The graphic shows that the region encircled by the red curve, which stands for YOLOM-Net, is greater than that of YOLOv5, demonstrating the superiority of our network recognition rate.
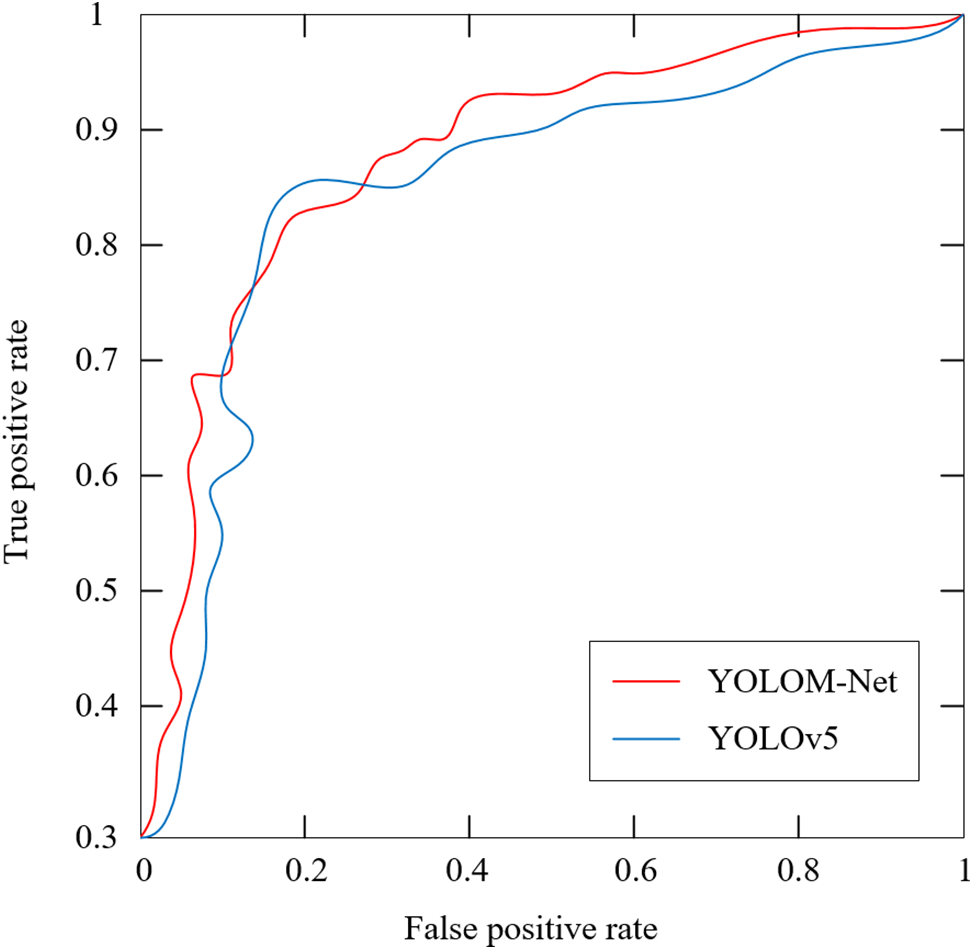
Figure 14: ROC curves of different models
Additionally, current research indicates that when assessing binary classifiers on unbalanced datasets, the PR (Precision and Recall) curve provides more information than the ROC curve, further illustrating the effectiveness of various methods. As a result, this study displayed the PR curve using the accuracy and recall of several comparison algorithms for tiredness judgment and face identification. The fact that YOLOM-Net performs the best out of all the analyzed techniques is demonstrated in Fig. 15, indicating that our algorithm has superior face identification, fatigue-driving judgment effect, and generalization capacity.
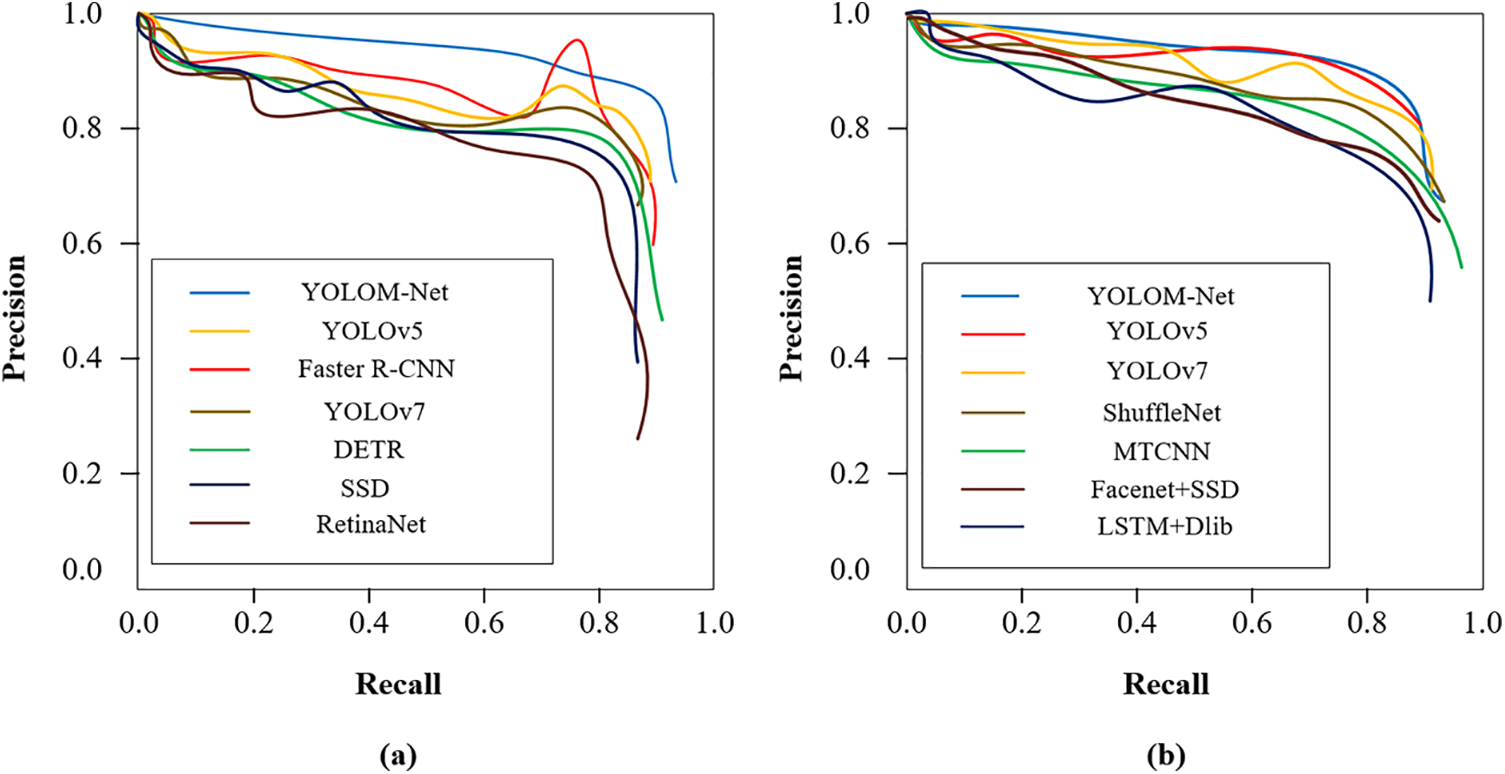
Figure 15: Precision-Recall curves on two group experiments. (a) face detection; (b) fatigue detection
This paper also designed the GUI (Graphical User Interface) interface, as shown in Fig. 16. This GUI interface contains two major functions: camera real-time detection and video stream detection. It can implement single-point detection for the eye, mouth, and other parts, at the same time record the detection time. You can also set the off-duty time, and the algorithm can complete its detection according to the set time, without human control.
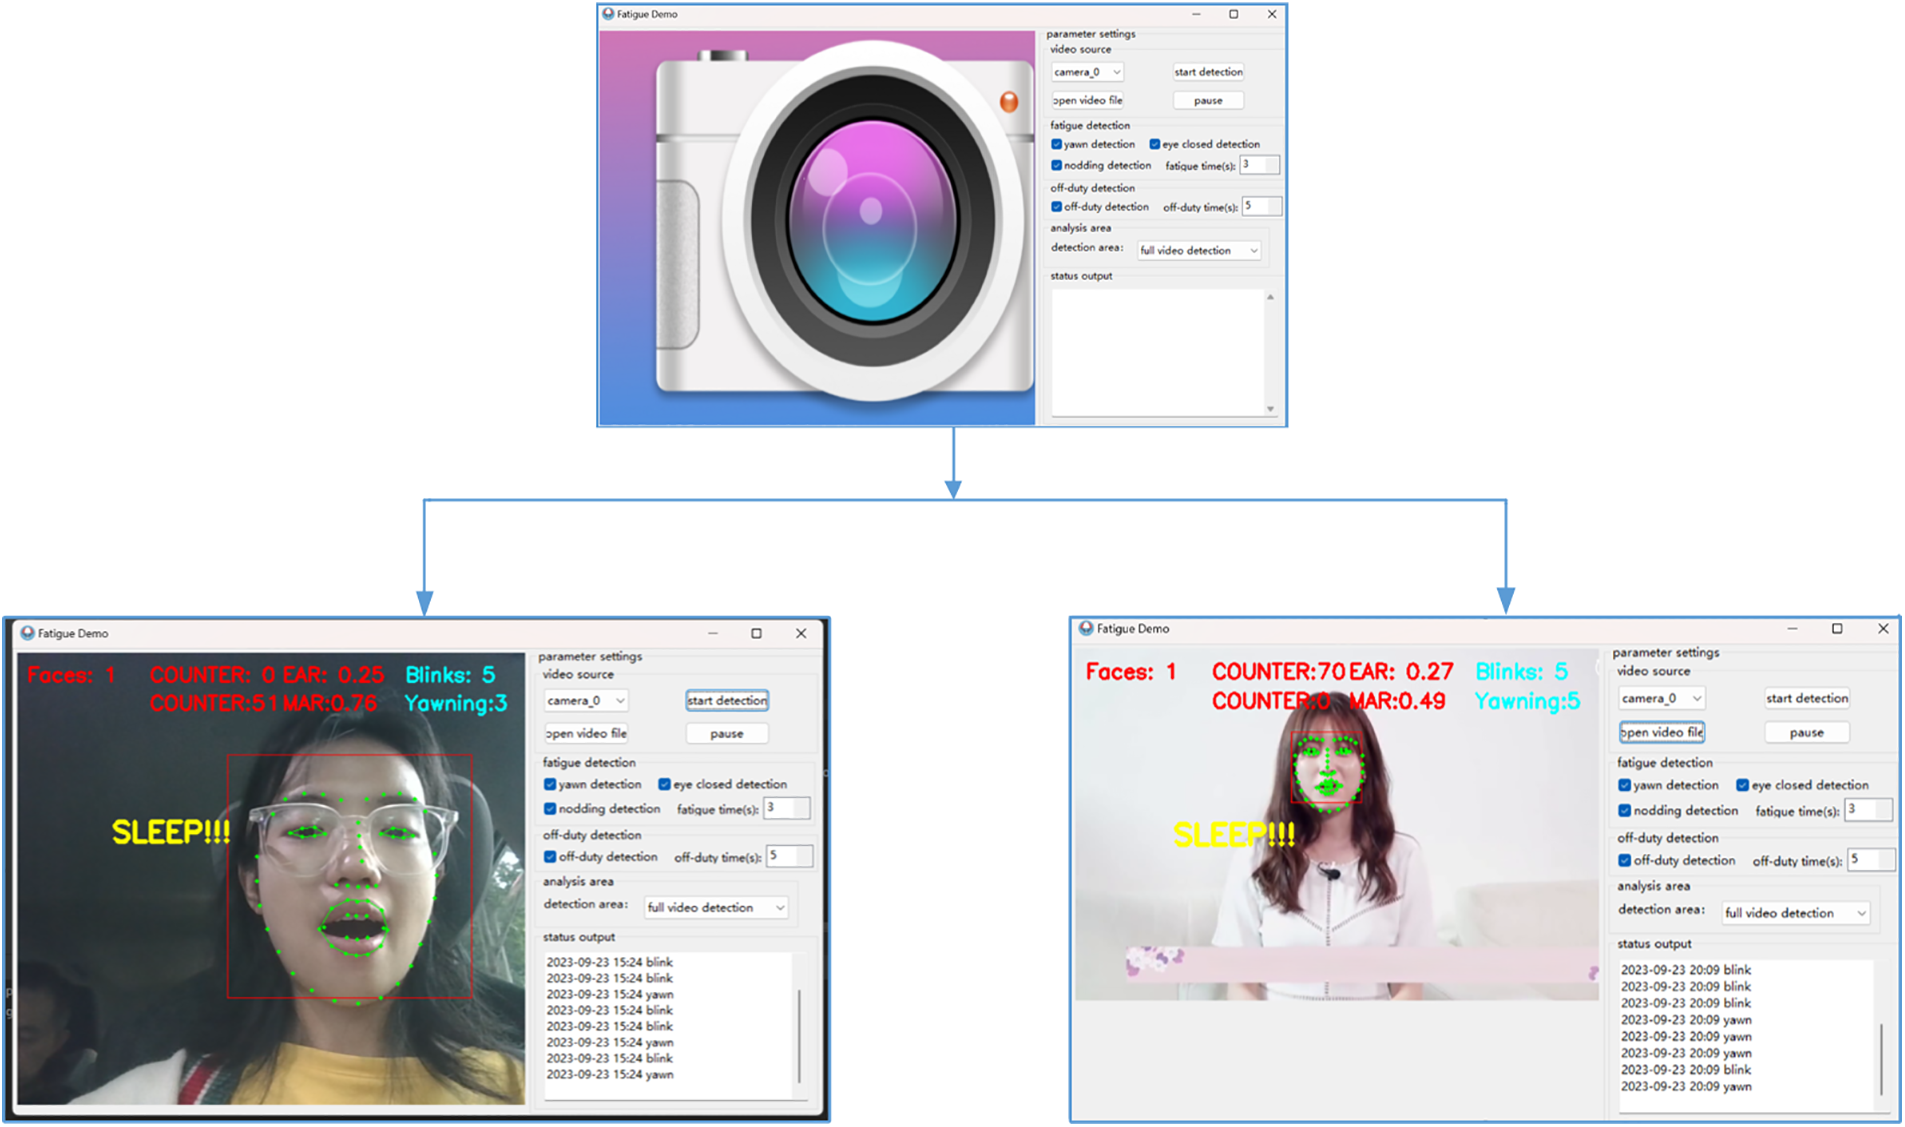
Figure 16: Fatigue driving detection GUI interface
This study proposes a lightweight neural network called YOLOM-Net to extract the face area from a complex background, which is used to accomplish face positioning. Meanwhile, the Dlib toolkit implements the positioning of the facial feature point. After that, the designed algorithm of multi-feature fusion is used to determine whether it is fatigued. In terms of object detection, it was compared with models such as Faster R-CNN and YOLOv5. On the whole, the YOLOM-Net achieves better overall performance in terms of speed and accuracy. At the same time, this provided method is compared with other methods in the field of fatigue detection, such as MTCNN, LSTM + Dlib, Facenet + SSD and so on. On the other hand, it is more suitable for real-time detection of automotive fatigue driving due to its fewer model parameters and fast detection speed. Moreover, it can be transplanted to mobile devices such as Jetson Orin NX, solving the problem of the calculation capacity and calculation speed of the current proposed model which is applied in real-time driving monitoring or video detection. The algorithm also contributes to the development of automotive safety assistance systems that effectively improve driver safety and prevent traffic accidents. However, this method is currently unable to make a warning sound when driver fatigue is detected, it only gives an alert on the screen. Therefore, it will be applied to hardware facilities such as single-chip microcomputers in the future to remind drivers through sound.
Acknowledgement: Any support not covered by the author contributions or funding section is greatly appreciated.
Funding Statement: The research is jointly supported by the Science and Technology Bureau of Xi’an project (24KGDW0049), the Key Research and Development Program of Shaanxi (2023-YBGY-264) and the Key Research and Development Program of Guangxi (GK-AB20159032).
Author Contributions: The authors confirm contribution to the paper as follows: study conception and design: Gang Li; data collection: Yaqing Wang; analysis and interpretation of results: Shanmeng Zhao and Mohammed Al-Mahbashi; draft manuscript preparation: Yaxue Peng. All authors reviewed the results and approved the final version of the manuscript.
Availability of Data and Materials: The data that support the findings of this study are available from the corresponding author upon reasonable request.
Ethics Approval: All data used in the article complies with ethical standards and informed consent was obtained from all individual participants included in the study.
Conflicts of Interest: The authors declare no conflicts of interest to report regarding the present study.
References
1. Li K, Gong Y, Ren Z. A fatigue driving detection algorithm based on facial multi-feature fusion. IEEE Access. 2020;8:101244–59. doi:10.1109/ACCESS.2020.2998363. [Google Scholar] [CrossRef]
2. Wang Y, Qu R. Research on driver fatigue state detection method based on deep learning. J Phy: Conf Series. 2021;1744(4):042242. doi:10.1088/1742-6596/1744/4/042242. [Google Scholar] [CrossRef]
3. Zhao Z, Zhou N, Zhang L, Yan H, Xu Y, Zhang Z. Driver fatigue detection based on convolutional neural networks using EM-CNN. Comput Intell Neurosci. 2020;2020(1):7251280. doi:10.1155/2020/7251280. [Google Scholar] [PubMed] [CrossRef]
4. Chen L, Zhi X, Wang H, Wang G, Zhou Z, Yazdani A, et al. Driver fatigue detection via differential evolution extreme learning machine technique. Electronics. 2020;9(11):1850. doi:10.3390/electronics9111850. [Google Scholar] [CrossRef]
5. Chen LW, Chen HM. Driver behavior monitoring and warning with dangerous driving detection based on the internet of vehicles. IEEE Trans Intell Transp Syst. Nov 2021;22(11):7232–41. doi:10.1109/TITS.2020.3004655. [Google Scholar] [CrossRef]
6. McDonald AD, Schwarz C, Lee JD, Brown TL. Real-time detection of drowsiness related lane departures using steering wheel angle. Proc Hum Factors Ergon Soc Annu Meet. 2012;56(1):2201–5. [Google Scholar]
7. Tango F, Botta M. Evaluation of distraction in a driver-vehicle-environment framework: an application of different data-mining techniques. In: Advances in Data Mining. Applications and Theoretical Aspects. Springer, Berlin, Heidelberg. doi:10.1007/978-3-642-03067-3_15. [Google Scholar] [CrossRef]
8. Hou ZW, Ou SJ, Xu DY. Research on fatigue driving feature detection algorithms of drivers based on machine learning. Syst Sci Control Eng. 2021;9(1):167–72. doi:10.1080/21642583.2021.1888819. [Google Scholar] [CrossRef]
9. Zhou Y, Zeng C, Mu Z. Optimal feature-algorithm combination research for EEG fatigue driving detection based on functional brain network. IET Biom. 2023;12(2):65–76. doi:10.1049/bme2.12108. [Google Scholar] [CrossRef]
10. Peng B, Gao D, Wang M, Zhang Y. 3D-STCNN: spatiotemporal Convolutional Neural Network based on EEG 3D features for detecting driving fatigue. J Data Sci Intell Syst. 2024;2(1):1–13. [Google Scholar]
11. Chen Z, Zhang X,Li J, Ni J,Chen G, Wang S,et al. Machine vision detection to daily facial fatigue with a nonlocal 3D attention network. arXiv:2104.10420. 2021. [Google Scholar]
12. You F, Gong Y, Tu H, Liang J, Wang H. A fatigue driving detection algorithm based on facial motion information entropy. J Adv Transport. 2020;2020:1–17. doi:10.1155/2020/8851485. [Google Scholar] [CrossRef]
13. Hien TT, Liang Q, Linh NTD. Design driver sleep warning system through image recognition and processing in python, dlib, and openCV. In: Intelligent systems and networks; 2021. p. 386–93. [Google Scholar]
14. Pan X, Li J. Eye state-based fatigue drive monitoring approach. Tongji Daxue Xuebao/J Tongji Univ. 2011;39(2):231–5. [Google Scholar]
15. Cui Z, Sun H-M, Yin R-N, Gao L, Sun H-B, Jia R-S. Real-time detection method of driver fatigue state based on deep learning of face video. Multimed Tools Appl. 2021;80(17):25495–515. doi:10.1007/s11042-021-10930-z. [Google Scholar] [CrossRef]
16. Li X, Luo J, Duan C, Zhi Y, Yin P. Real-time detection of fatigue driving based on face recognition. J Phy: Conf Series. 2021;1802(2):022044. doi:10.1088/1742-6596/1802/2/022044. [Google Scholar] [CrossRef]
17. Wang Z, Shi P, Wu C. A fatigue driving detection method based on deep learning and image processing. J Phy: Conf Series. 2020;1575(1):012035. doi:10.1088/1742-6596/1575/1/012035. [Google Scholar] [CrossRef]
18. Chen J, Yan M, Zhu F, Xu J, Li H, Sun X. Fatigue driving detection method based on combination of BP neural network and time cumulative effect. Sensors. 2022;22(13):4717. doi:10.3390/s22134717. [Google Scholar] [PubMed] [CrossRef]
19. Jia H, Xiao Z, Ji P. Real-time fatigue driving detection system based on multi-module fusion. Comput Graph. 2022;108(4):22–33. doi:10.1016/j.cag.2022.09.001. [Google Scholar] [CrossRef]
20. Qu JX, Wei ZM, Han YM. An embedded device-oriented fatigue driving detection method based on a YOLOv5s. Neural Comput Appl. 2024;36(7):3711–23. doi:10.1007/s00521-023-09255-9. [Google Scholar] [CrossRef]
21. Zheng H, Wang YD, Liu XM. Adaptive driver face feature fatigue detection algorithm research. Appl Sci. 2023;13(8):5074. doi:10.3390/app13085074. [Google Scholar] [CrossRef]
22. Ma YH, Tao Y, Gong YD, Cui WH, Wang B. Driver identification and fatigue detection algorithm based on deep learning. Math Biosci Eng. 2023;20(5):8162–89. doi:10.3934/mbe.2023355. [Google Scholar] [PubMed] [CrossRef]
23. Joo J, Li Z, Song L, Yang Q, Chen S, Chen L. Support vector machine filtering data aid on fatigue driving detection. MATEC Web Conf. 2020;309(26):03036. doi:10.1051/matecconf/202030903036. [Google Scholar] [CrossRef]
24. Jiang SQ, Qi YK, Zhang HK, Bai ZW, Lu XB, Wang P. D3D: dual 3-D convolutional network for real-time action recognition. IEEE Trans Ind Inform. 2021;17(7):4584–93. doi:10.1109/tii.2020.3018487. [Google Scholar] [CrossRef]
25. Yi Y, Ni F, Ma Y, Zhu X, Qi Y, Qiu R, et al. High performance gesture recognition via effective and efficient temporal modeling. In: Proceedings of the Twenty-Eighth International Joint Conference on Artificial Intelligence (IJCAI-19); 2019; CA, USA. p. 1003–9. [Google Scholar]
26. Howard A, Sandler M, Chu G, Chen L-C, Chen B, Tan M, et al. Searching for MobileNetV3. In: 2019 IEEE/CVF International Conference on Computer Vision (ICCV); 2020; Piscataway, New Jersey, NJ, USA. [Google Scholar]
27. Xu X, Du M, Guo H, Chang J, Zhao X. Lightweight FaceNet based on MobileNet. Int J Intell Sci. 2021;11(1):1–16. doi:10.4236/ijis.2021.111001. [Google Scholar] [CrossRef]
28. Zhang Y-F, Ren W, Zhang Z, Jia Z, Wang L, Tan T. Focal and efficient IOU loss for accurate bounding box regression. Neurocomputing. 2022;506:146–57. [Google Scholar]
Cite This Article
 Copyright © 2025 The Author(s). Published by Tech Science Press.
This work is licensed under a Creative Commons Attribution 4.0 International License , which permits unrestricted use, distribution, and reproduction in any medium, provided the original work is properly cited.
 Downloads
 Citation Tools