
 Submit a Paper
 Propose a Special lssue
 Open Access
ARTICLE

Application of Deep-Learning Potential in Simulating the Structural and Physical Characteristics of Platinum
1 Faculty of Materials Science and Engineering, Kunming University of Science and Technology, Kunming, 650093, China
2 Yunnan Key Laboratory of Integrated Computational Materials Engineering for Advanced Light Metals, Kunming, 650093, China
* Corresponding Authors: Ju Rong. Email: ; Yudong Sui. Email:
(This article belongs to the Special Issue: Advances in Computational Materials Science: Focusing on Atomic-Scale Simulations and AI-Driven Innovations)
Computers, Materials & Continua 2025, 83(1), 685-700. https://doi.org/10.32604/cmc.2025.060713
Received 07 November 2024; Accepted 03 January 2025; Issue published 26 March 2025
 View Full Text
 Download PDF
Abstract
The deep potential (DP) is an innovative approach based on deep learning that uses ab initio calculation data derived from density functional theory (DFT), to create high-accuracy potential functions for various materials. Platinum (Pt) is a rare metal with significant potential in energy and catalytic applications, However, there are challenges in accurately capturing its physical properties due to high experimental costs and the limitations of traditional empirical methods. This study employs deep learning methods to construct high-precision potential models for single-element systems of Pt and validates their predictive performance in complex environments. The newly developed DP is highly consistent with DFT results in predicting the stable phases, lattice constants, surface energies, and phonons dispersion relations of Pt, demonstrating outstanding quantum-level accuracy. Additionally, the complex phase transitions and domain formations of Pt are extensively and quantitatively analyzed. Molecular dynamic simulations utilizing the DP approach show that Pt’s face-centered cubic (FCC) structure undergoes a phase transition from solid to liquid at its melting point of 1986 K, this is in close agreement with the experimental value of 2041.5 K. Increased temperature enhances the diffusion of Pt atoms, with a self-diffusion coefficient of 1.17 × 10⁻¹¹ m2/s at the melting point, comparable to that of other FCC metals. This result can be utilized for the precise analysis of the fundamental properties of the rare metal Pt at the microscopic scale, and it facilitates the development of binary or multi-component deep potential models that include Pt.Keywords
Supplementary Material
Supplementary Material FileThe interactions of atoms, molecules, and ions are at the core of molecular dynamics (MD) studies in condensed matter, with interatomic potential energy surfaces serving as precise tools for defining these interactions. Ensuring the accuracy and applicability of potential energy surfaces across various physical conditions has long been a major challenge limiting the MD simulation applications. The development of interatomic potentials began with early empirical potentials and has now evolved towards sophisticated models constructed using advanced machine learning (ML) methods [1]. The choice of interatomic potential functions is typically based on the requirements for accuracy and computational cost. Simplified physical models often employ empirical potentials [2–4], semi-empirical potentials are used for reaction dynamics [5–7], and complex molecular system simulations increasingly adopt ML-based potentials to enhance accuracy [8–10].
Empirical potential functions are simple models derived from experimental phenomena and empirical rules, excelling in efficiency for large-scale simulations but limited in their ability to accurately describe complex interactions. Semi-empirical potentials, which combine physical foundations with experimental fitting, can handle multi-body interactions more accurately but come with lower computational efficiency. Clearly, while ab initio methods offer high accuracy, they are computationally expensive, and empirical force field methods, although efficient, may lack precision. Therefore, it is essential to develop a potential energy model that achieves an optimal balance between accuracy and computational practicality and is widely applicable. ML has emerged as an alternative approach, leveraging Density Functional Theory (DFT) data as a training set to map complex relationships between features, energies, and forces, enabling the development of ML potentials [11–13]. With further optimization of ML algorithms and increased computational resources, ML potentials have been widely applied in fields like computational physics, chemistry, and materials science [14]. Zhang et al. first pioneered the Deep Potential (DP) model, successfully bridging ab initio calculations, ML methods, and classical force fields [15]. The DP model, built with deep neural networks, combines the advantages of deep learning techniques with first-principles calculations. It efficiently and accurately simulates complex material systems, precisely describing the intricate many-body interactions and potential energy surface characteristics of Pt atoms. The key distinction between this approach and DFT calculations lies in its ability to maintain accuracy comparable to ab initio calculations while retaining the computational efficiency of empirical potential models. This fully meets our requirements for high-precision and large-scale simulations. The DP potential energy surface model, driven by the DP-GEN package, combines rapid data sampling and optimization advantages while being compatible with first-principles calculation software, such as VASP [15] and Quantum ESPRESSO [16,17], gradually becoming a mainstream approach in deep learning-based potential surface construction. To date, the DP model has been widely applied to various material systems, including pure metals [18–20], alloys [21–24] and compounds [25–28], significantly advancing MD simulation studies. However, MD simulations based on deep potential models via DP-GEN in the field of single-element Pt systems are still limited.
Pt is a rare, corrosion-resistant metal with excellent catalytic properties [29–32]. Incorporating Pt into automotive exhaust systems can effectively purify harmful emissions [33], and its good biocompatibility makes it suitable as an electrode material for pacemakers [34], reducing the risk of rejection in patients. Given Pt’s scarcity in nature and the high cost of experimental validation due to the complexities of extraction, inspired by the work of Elkoua et al. [35] and Belhamra et al. [36], who explored material properties through simulation calculations, a reasonable solution is to conduct preliminary studies through simulation calculations. Clearly, the DP method has achieved remarkable success, and as its application to single-element Pt systems has yet to be thoroughly explored, this study will employ deep potential function fitting techniques to further optimize and extend a DP potential model tailored to Pt.
In this study, a comprehensive dataset containing rich structural information along with energy, mechanical, and simulation data will be used to train the DP potential, aiming to achieve accurate descriptions of the physical and mechanical properties of Pt. DP potential simulations will be performed using this data, with simulation results verified by comparison with DFT calculations. The research scope comprehensively covers the physical properties of Pt (such as lattice constants, surface energy, vacancy and interstitial formation energies), Mechanical characteristics (such as elastic constants, lattice thermal conductivity), and dynamic properties (such as phase transition temperatures). The findings of this study will provide a high-quality DP potential for the single-element Pt system in future computational simulations and lay a foundation for developing binary or multi-element potentials related to Pt.
The DP-GEN framework [37] integrates the Init, Run, and Autotest processes to iteratively construct, train, test, and refine deep neural network potential functions, which can then be deployed for molecular dynamics simulations using DP-kit [38]. During the Init phase, a multi-layered data generation process is conducted, comprising structural optimization, configuration perturbation, and ab initio molecular dynamics (AIMD) simulations. At each AIMD simulation step, critical data—such as atomic coordinates, stress tensors, forces, and energy—are gathered to form a comprehensive initial training dataset (Table S1). In this study, initial structure preparation and perturbation steps are applied to three Pt crystal phases: hexagonal close-packed (HCP), face-centered cubic (FCC), and body-centered cubic (BCC). Each unit cell is first relaxed to obtain stable, low-energy configurations, then expanded into 2 × 2 × 2 supercells. Atomic coordinates and cell boundaries are perturbed by 0.01 and 0.03 Å, respectively, to disrupt perfect crystalline symmetry. For every crystal structure, 40 modified configurations are produced. Moreover, the configurations are subjected to 15 distinct pressures, with scaling factors ranging between 0.7 and 0.95, resulting in 150 unique configurations. Finally, AIMD simulations at 50 K for 20 fs are performed on these perturbed structures to capture detailed data on their dynamic evolution, thus completing the foundational dataset (Table S2). The ‘Run’ phase involves executing DP-GEN cycles a total of 32 times, producing a highly accurate deep neural network potential function capable of effective performance under varied conditions.
The DP-GEN active learning cycle comprises three main stages: training, exploration, and labeling (Table S3). This cycle continues until a specified number of iterations is reached or the desired accuracy is attained. Training begins with the initial dataset from the Init stage or the most recently expanded dataset from the previous labeling stage. Four potential function models are created, each initialized with a distinct random seed. In the exploration phase, the deep neural network potential from the previous iteration is used in molecular dynamics simulations, where configurations are selected based on uncertainty and structural diversity criteria. These configurations are then labeled with high-accuracy data from DFT calculations, providing precise information on energy, forces, and stress (Table S4) This labeled dataset improves the diversity and accuracy of the training samples. During the training stage, new data samples are incorporated to retrain the model, with parameters initialized by different random seeds to generate four slightly varied potential functions (Table S5). In the subsequent Autotest phase, these DP models are evaluated against metrics such as equations of state and elastic moduli to confirm their applicability. Fig. 1 shows a flowchart of molecular dynamics simulations using a deep neural network-based DP model. For further details, refer to the supporting information S1.
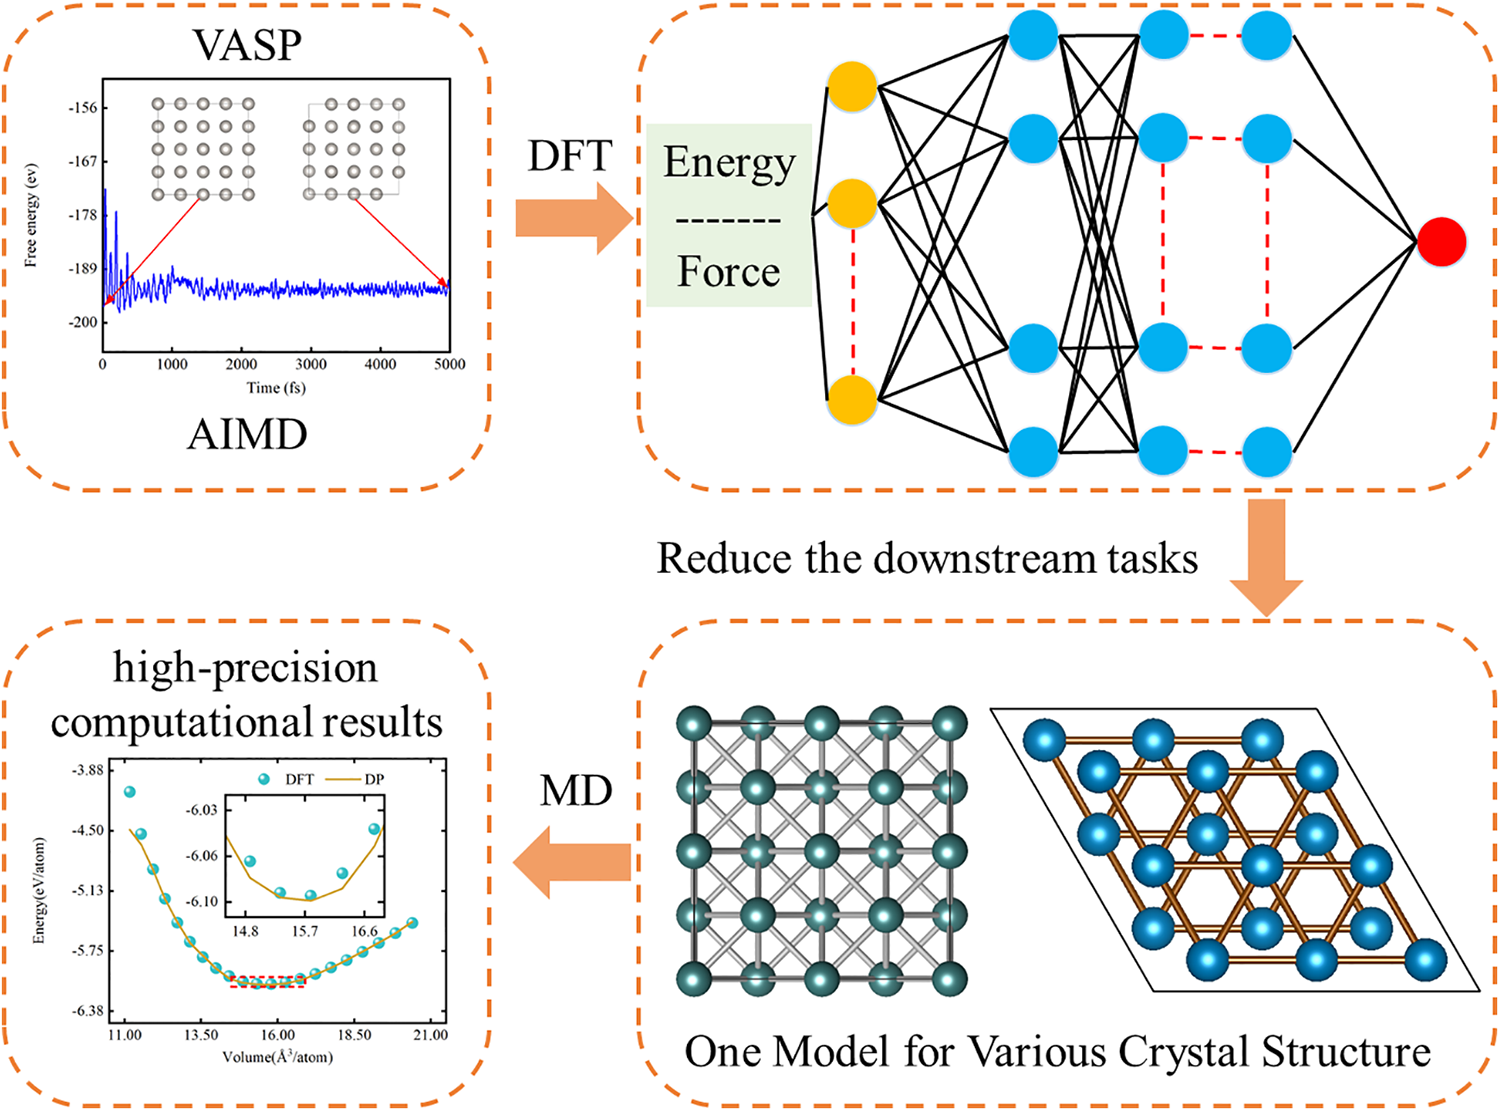
Figure 1: Flowchart of molecular dynamics simulations based on a deep neural network DP model
3.1 Evaluation of the DP Model’s Performance
As shown in Fig. 2, a comparison of potential energy and predicted interaction forces for Pt atoms between the DP and DFT models reveals a strong linear correlation, highlighting the consistent accuracy of both models. The data distribution shows that predictions from the DP model align closely with those from the DFT model, with points clustering along the line of DP = DFT. This result highlights the strong correlation between the predictions of DP and DFT calculations, as supported by the maximum deviation analysis illustrated in Fig. S1. Overall, for single-element systems modeled with DP, the root-mean-square error (RMSE) remains below 2 meV/atom for energy and 55 meV/Å for atomic forces [39]. Specifically, for Pt atoms, the trained DP model quantified potential energy and interaction forces with RMSE values of 0.348 meV/atom and 4.76 meV/Å, confirming the model’s reliability in reproducibility and accuracy.
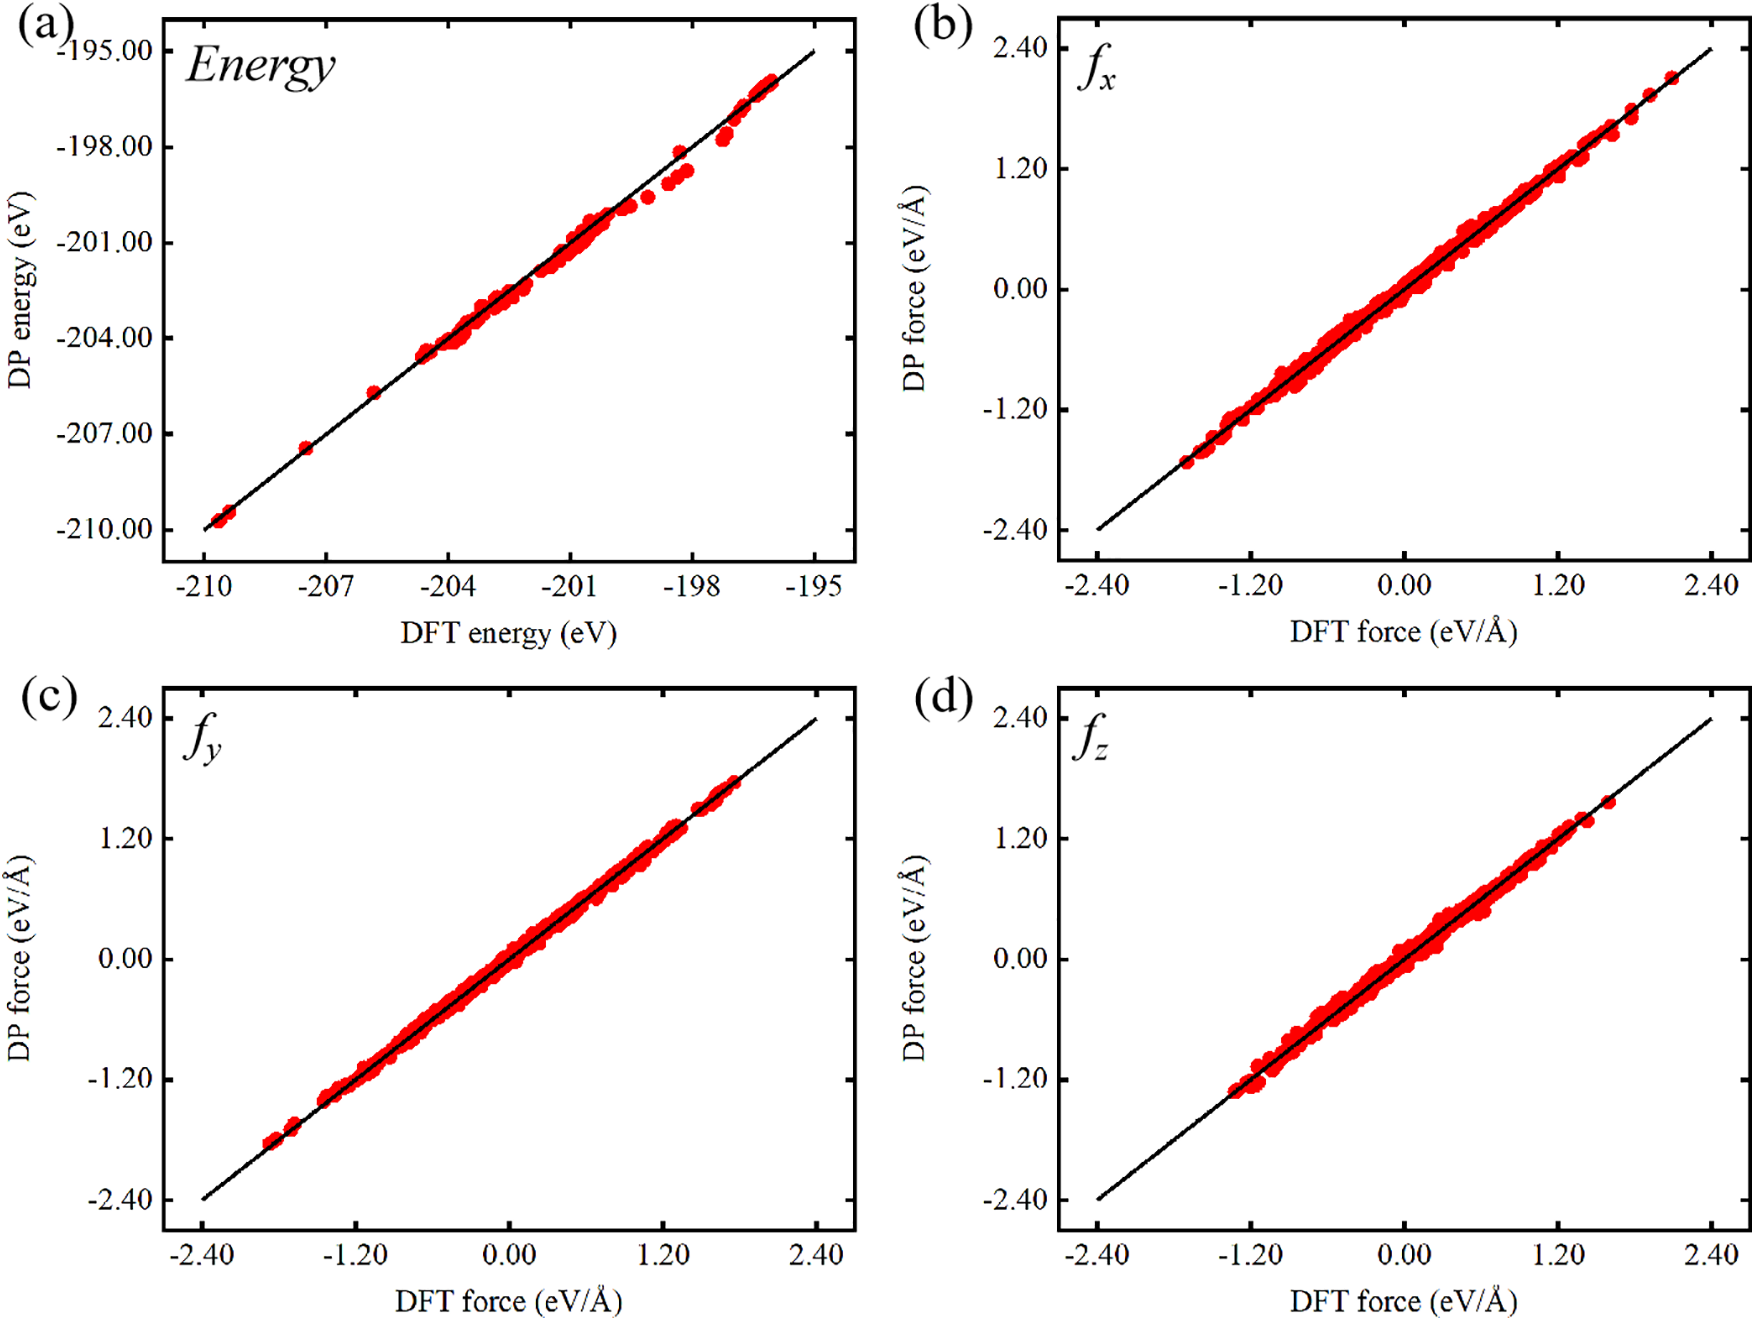
Figure 2: Comparison of DFT and DP predictions: (a) energy of Pt, and (b–d) atomic forces of Pt in the x, y, and z components
3.2.1 Lattice Constants and Equation of State of Pt
To evaluate the DP model’s effectiveness in simulating the physical properties of complex systems, we characterized key properties of Pt atoms using the energy-volume (EV) curve and validated them against DFT results. Fig. 3 illustrates the EV curve for FCC-Pt, as indicated. DP molecular dynamics simulations effectively capture the energy response of different crystal structures across varying volumes. In the 14.8–16.6 Å3/atom range, the EV curve aligns closely with the ±27% volume strain predicted by first-principles methods. We also calculated the energy-volume curves for the FCC-and BCC-Pt structures (see Fig. S2). Stability comparisons among the three structures reveal that FCC is the most stable, given its lowest energy, consistent with the principle that lower energy correlates with higher stability [40–42]. In contrast, the BCC structure, a high-temperature phase, is the least stable.
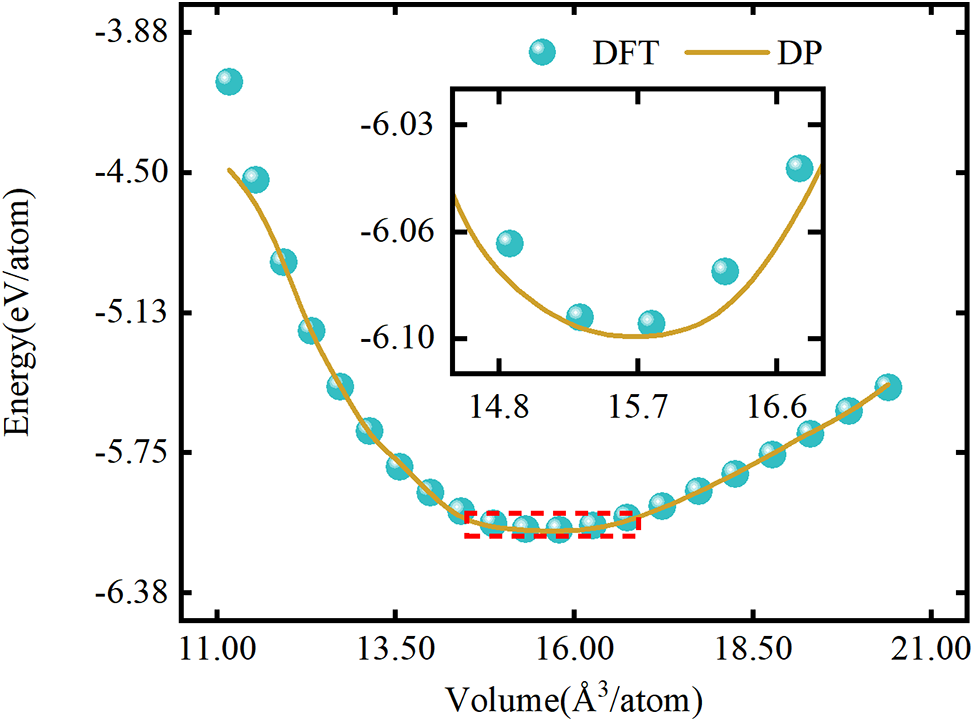
Figure 3: The EV curve (energy as a function of volume) for FCC-Pt. DFT represents ab initio results, and DP indicates predictions from the deep potential model for Pt
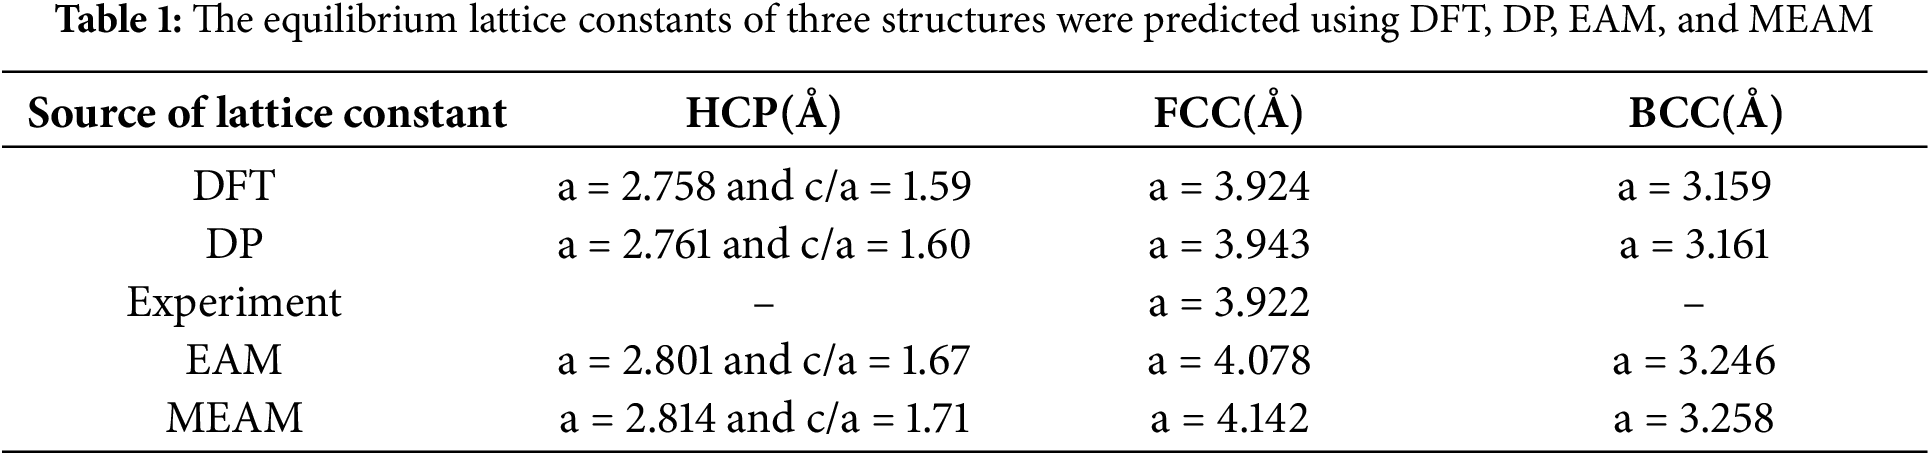
The equilibrium volume, essential for determining optimal material volume, is typically derived from a compression curve or a third-order equation of state [43,44]. Here, the Birch-Murnaghan equation of state was used to calculate Pt-related parameters. Table 1 shows that the DP model accurately captures equilibrium constants for various crystal structures, with an error margin within 0.25% compared to first-principles data [45]. Additionally, we compared the lattice constants calculated using the Embedded Atom Method (EAM) and the Modified Embedded Atom Method (MEAM) with the DFT values. Notably, FCC-Pt results align closely with experimental data [46]. Overall, the DP model demonstrates performance comparable to DFT methods in predicting stable phases and lattice constants.
3.2.2 Formation Energy of Lattice Defects of Pt
As shown in Fig. 4a, the formation energy of self-interstitials and vacancies in FCC-Pt reveals that the DP model’s self-interstitial formation energy is 3.93 eV, with a discrepancy of up to 1.27 eV from DFT calculation results, approximately 47% of the total energy. Meanwhile, the vacancy formation energy differs by 0.25 eV, a 4.6% deviation. Notably, the dataset used for training does not include vacancy and self-interstitial configurations or configuration-specific potential energy and interaction forces. In high-throughput computational screening, assessing vacancy/self-interstitial formation energies demonstrates the important role of the DP model in accelerating the discovery and optimization of new materials [47]. Fig. 4b–d displays the surface energies of three Pt crystal structures (FCC, BCC, HCP). The DP model’s predicted values closely align with DFT results. Sakong et al. [48] reported a surface energy of 1.49 J/m2 for the BCC (111) plane of Pt, and our DFT model produced a test value of 1.56 J/m2, showing near-identical results. For the (210) plane, we calculated a test value of 2.16 J/m2, closely matching Yoo et al. [49] value of 2.0 J/m2. Both DP molecular dynamics simulations and DFT calculations converge on similar results. Among the FCC, BCC, and HCP structures, the (111) plane consistently exhibits the lowest surface energy, while the (210), (211), and (211) planes show the highest, confirming that FCC (111), BCC (111), and HCP (111) structures possess the lowest surface energy values. For FCC metals, the surface energy order, ranked from lowest to highest, is (111) < (100) < (110), and FCC-Pt follows this trend [50]. Across surface energy calculations for the three structures, the maximum deviation between DP and DFT methods reaches 11.76%, particularly notable on the BCC (211) surface. Overall, the DP model demonstrates high accuracy in predicting the thermodynamic properties and surface energies of different Pt structures.
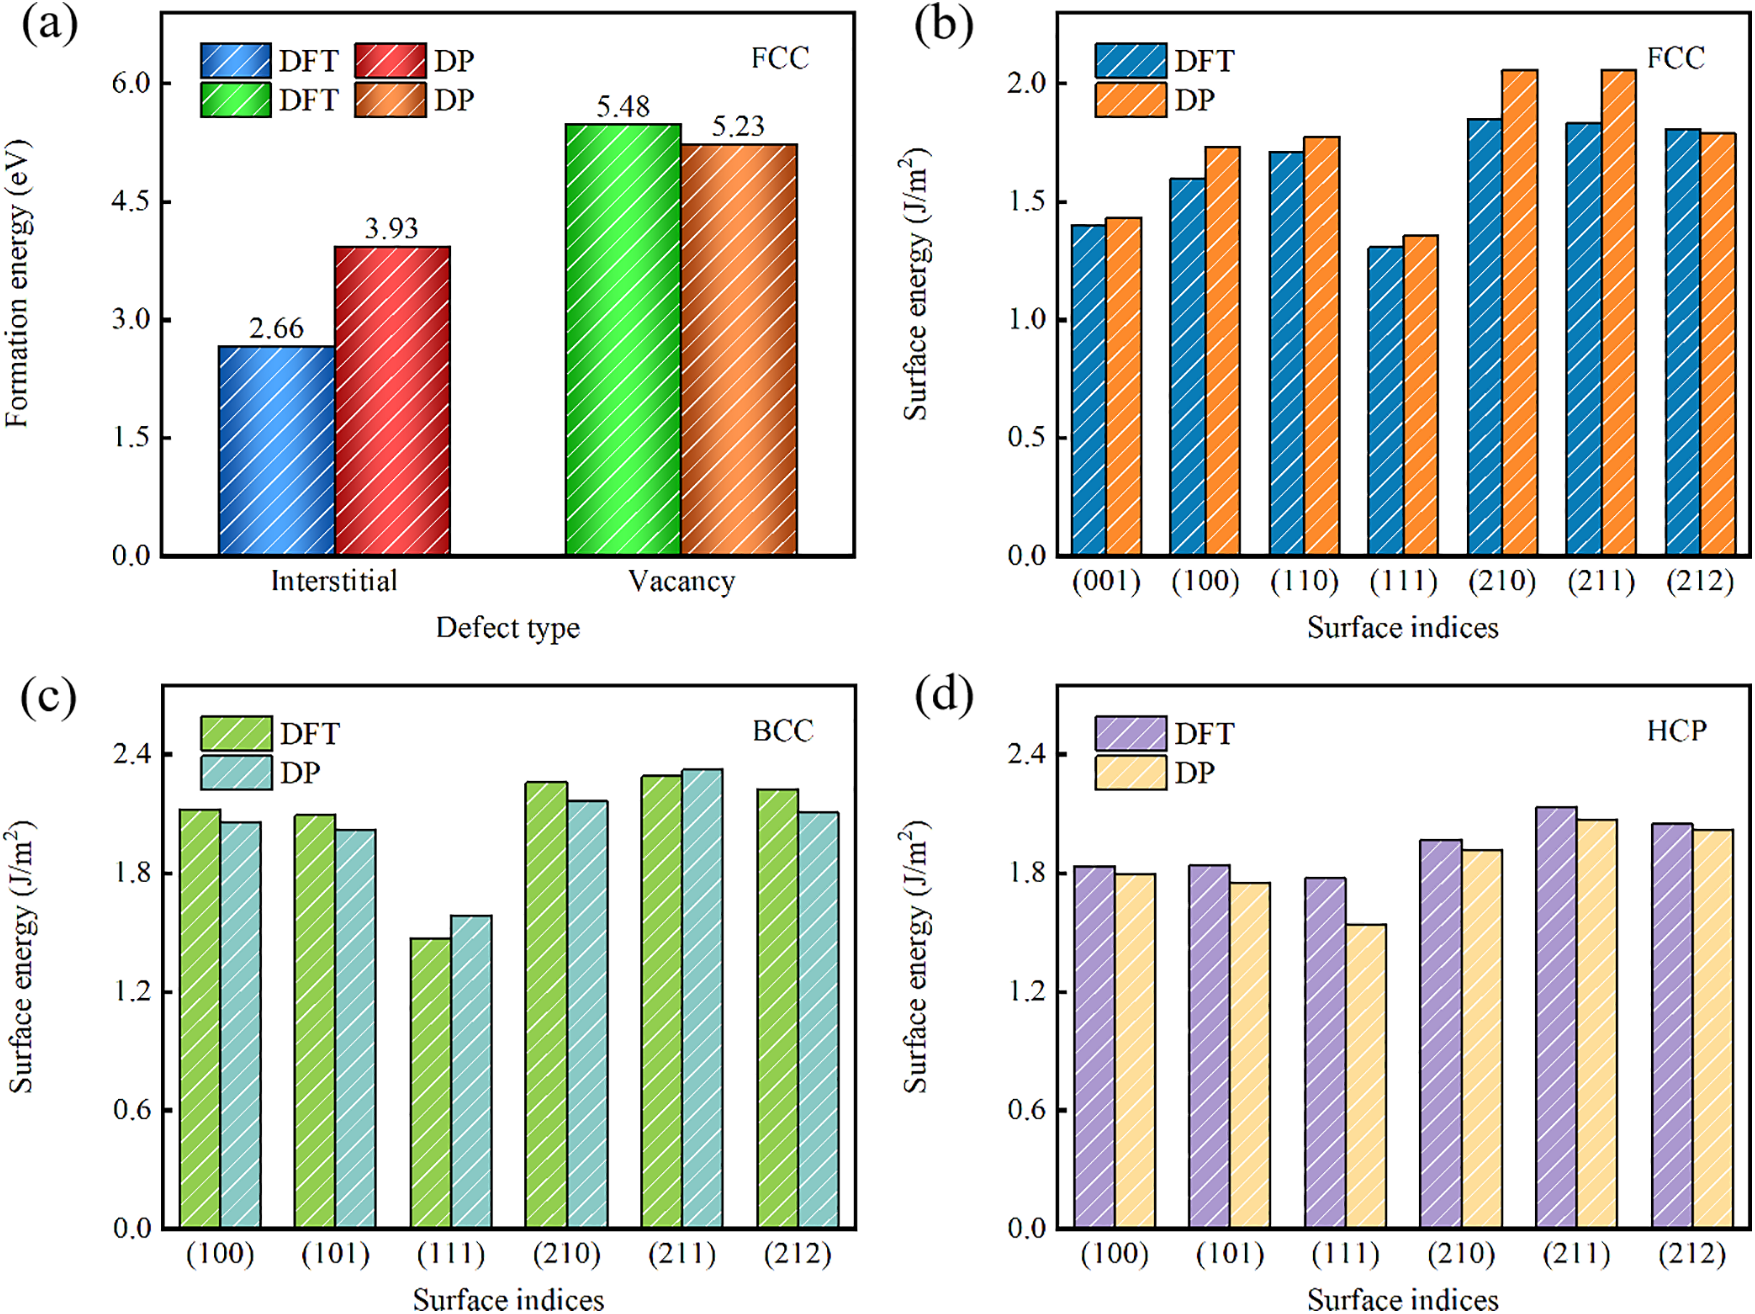
Figure 4: Defect Energies and Surface Energies of Pt. (a) Energies of formation for self-interstitials and vacancies (point defects) in FCC-Pt, and (b–d) surface energies in FCC-, BCC-, and HCP-Pt
3.2.3 Phase Transition Temperature of Pt
In a 2021 study, Smirnov et al. [51] used ab initio methods to simulate the thermodynamic properties and stability of Pt, observing that the melting point of FCC-Pt at standard atmospheric pressure—indicating the temperature at which the FCC structure transitions from solid to liquid—is 1986 K. This finding led us to apply DP-based molecular dynamics simulations to investigate phase stability and identify the melting temperature threshold, thereby assessing the DP model’s applicability. Fig. 5a presents the temperature-energy relationship for the FCC-Pt crystal structure under standard atmospheric pressure, obtained using the DP model and analyzed via the constant Number of particles, Pressure, and Temperature (NPT) ensemble. The curve reveals a steady rise in total atomic energy from low to moderate temperatures (below 1986 K), likely due to increased atomic vibrations from thermal expansion. At 1986 K, a noticeable energy fluctuation occurs, representing latent heat absorption during the phase transition, suggesting the onset of melting for Pt atoms. To maintain thermal continuity, we employed continuous heating to determine the melting point. In the NPT molecular dynamics simulations, periodic boundaries were set for the computational region, and a lattice system with 4000 atomic environments was constructed. After 500 ps of equilibrium, the BCC structure of Pt was gradually heated from 300 K at 1.53 × 10¹³ K/s, reaching a temperature of 3000 K. Fig. 5b displays the volume changes in the FCC-Pt structure near 1986 K, where volume expands gradually with temperature due to typical thermal expansion, indicating a solid state with strong atomic binding forces. As the temperature approaches 1986 K, volume fluctuations increase, signaling a transition from the ordered solid to the disordered liquid state. Above 1986 K, the volume curve shows irregular fluctuations, consistent with liquid metal properties and indicating a complete phase transition in Pt atoms. This further confirms the occurrence of the solid-liquid transition behavior of Pt. The melting point of Pt is determined to be 1986 K, based on the significant fluctuations in the volume and energy curves as a function of temperature, with a deviation of 2.7% from the experimental value of 2041.5 K [52]. Additionally, the melting points predicted using EAM and MEAM show deviations of 3.2% and 3.1%, respectively, from the experimental value, as shown in Table S6. Given that Du et al.’s DP model-based melting point prediction for element Cu was 8.6% above experimental data [53], and Xue et al. [54] and Liu et al.'s [55] melting point predictions showed deviations of 2.9% and 5.2%, we conclude that the DP model demonstrates strong accuracy in predicting the melting point of Pt. Evaluation results indicate that the DP model’s simulations effectively capture the phase transition behavior of Pt atoms. The observed energy and volume trends align with thermodynamic properties, accurately reproducing the melting process of Pt and validating the DP model’s effectiveness in analyzing high-temperature phase transitions and phase stability in solid materials. This accuracy is attributed to the extensive consideration of high-temperature phase reactions during potential energy training.
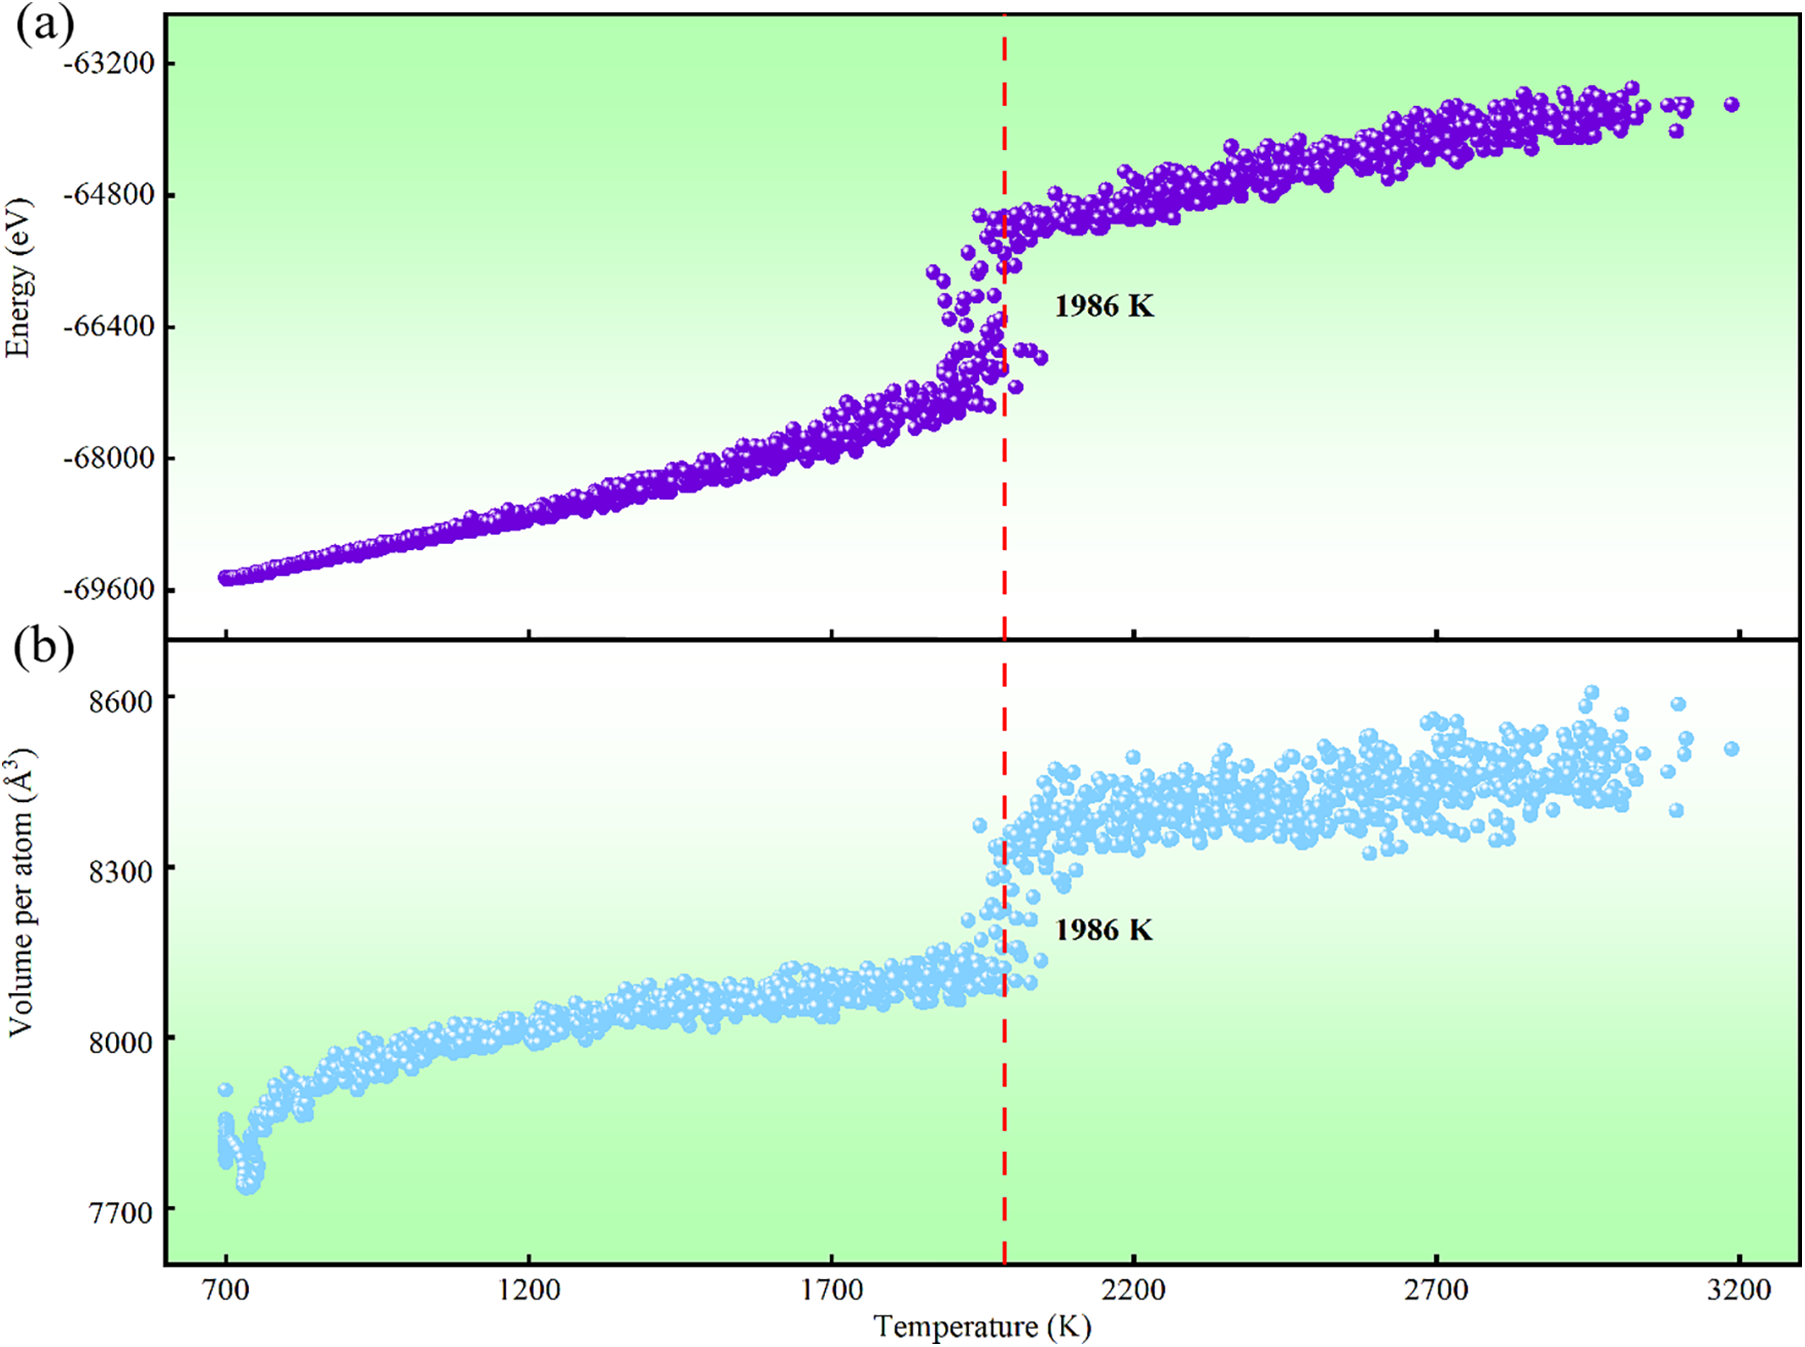
Figure 5: Energy and Volume Characteristics of FCC-Pt. (a) Energy-temperature curves for FCC-Pt and (b) volume-temperature curves for FCC-Pt obtained from molecular dynamics simulations based on the DP model
3.2.4 Self-Diffusion Coefficient of Pt
As shown in Fig. 6, the prediction of the self-diffusion coefficient of FCC-Pt by the DP model indicates that this coefficient significantly increases with rising temperature. The self-diffusion coefficient was evaluated using DP molecular dynamics simulations within the constant Number of particles, Volume, and Temperature (NVT) ensemble, with a calculation time of 200 ps. Temperature changes directly affect the self-diffusion coefficient: as temperature rises, the vibration frequency and activation energy of Pt atoms shift, leading to an increase in the self-diffusion coefficient. Specifically, higher temperatures enhance atomic vibration frequency, accelerating atomic migration within the crystal and further increasing the self-diffusion coefficient. Additionally, elevated temperatures reduce activation energy, facilitating atomic migration and thus boosting the self-diffusion coefficient. Under high-temperature and high-pressure conditions, the α-FCC structure of Pt can transition into β-BCC or β-HCP structures, ensuring Pt’s adaptability and heat resistance in extreme environments. Within a certain temperature range, Pt atoms retain thermodynamic stability in the system, indicating that Pt can regulate thermal stability through atomic diffusion and phase transition mechanisms at elevated temperatures, effectively adapting to varying environmental demands. Due to the scarcity of self-diffusion data for Pt atoms, we referenced coefficients from FCC-Ti, Zr, and Hf, which exhibit similar phase transition characteristics and have more available data. Comparing the predicted temperature-dependent self-diffusion coefficient of Pt atoms with experimentally observed trends in FCC-Ti, Zr, and Hf, we find comparable diffusion characteristics [56–59]. Empirical data indicate that, for FCC metals near melting conditions, the self-diffusion coefficient typically reaches an order of magnitude of 10−11 m2/s [60]. At Pt’s melting point of 1986 K, the measured self-diffusion coefficient is approximately 1.17 × 10⁻¹¹ m2/s, matching this expected magnitude. After comparing the data predicted by the DP model with the experimental values [61], As shown in Table S7, it was found that the overall trend was generally consistent with the variation pattern of the experimental results. Above the melting point, weakened atomic interactions within Pt lead to a shift from an ordered solid to a disordered liquid state, causing a sharp increase in the diffusion coefficient to a range of 10−9 to 10−11 m2/s. Thus, the DP simulation results for the self-diffusion coefficient are both scientifically consistent and reliable.
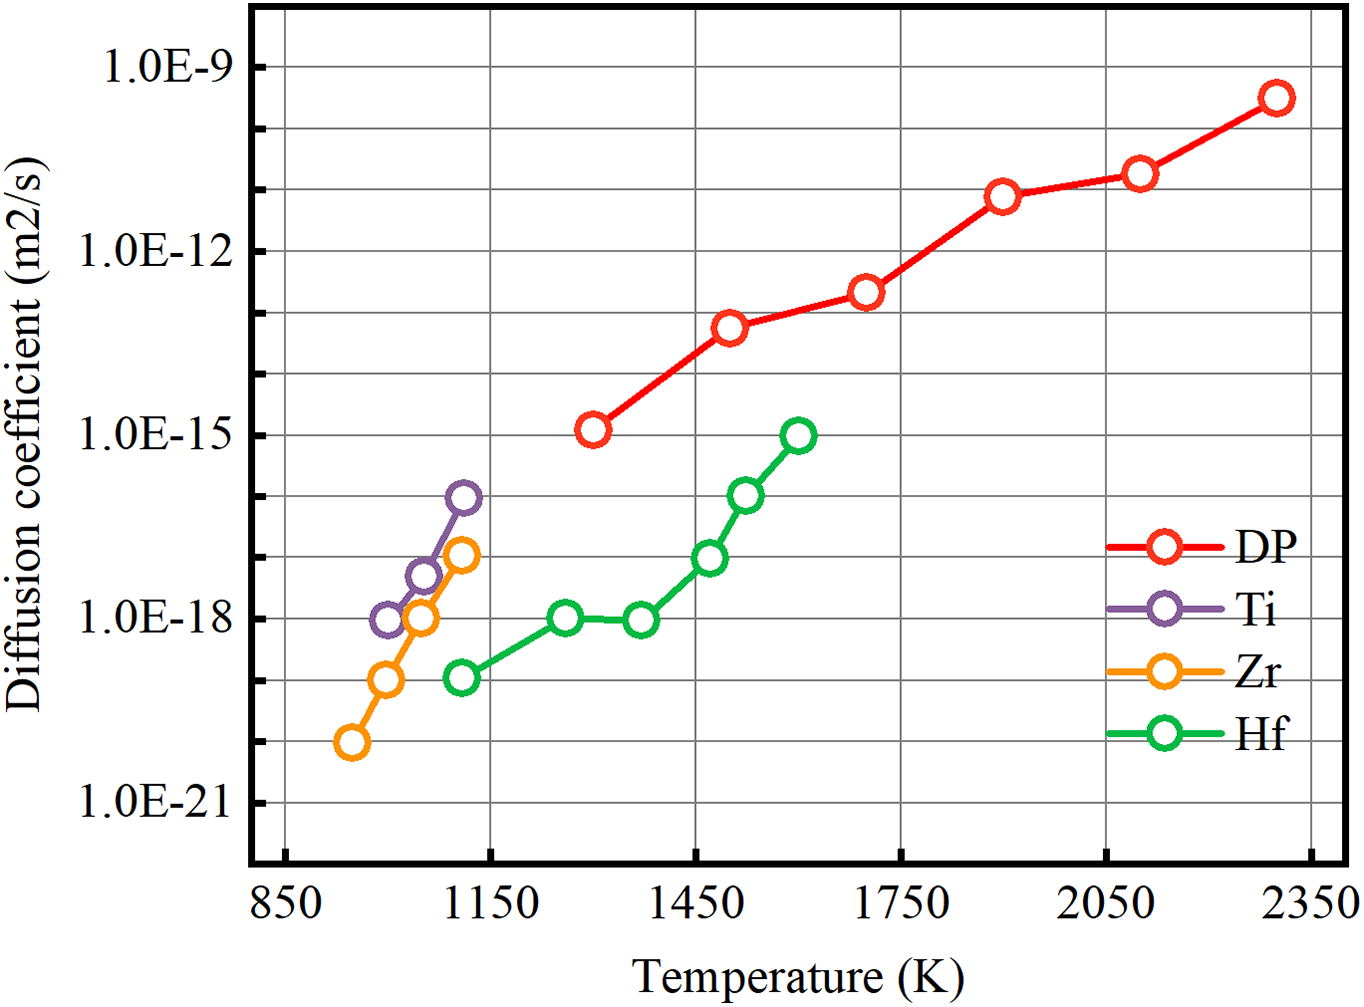
Figure 6: Temperature-dependent self-diffusion coefficient of FCC-Pt predicted by the DP model
The theoretical value of the FCC-Pt self-diffusion coefficient as a function of temperature follows the Arrhenius formula, and the expression for this coefficient is as follows:
3.3 Elastic Properties (Elastic Modulus) of Pt
Pt atoms typically exhibit HCP, BCC, and FCC crystal structures, each with specific elastic tensors. However, evaluating HCP and BCC structures requires extreme conditions, such as high pressure or high temperature [62,63]. Consequently, we employed DP/DFT techniques for simulation calculations to test the accuracy of DP in replicating DFT data. Small deformations of 1% were applied to normal strains (
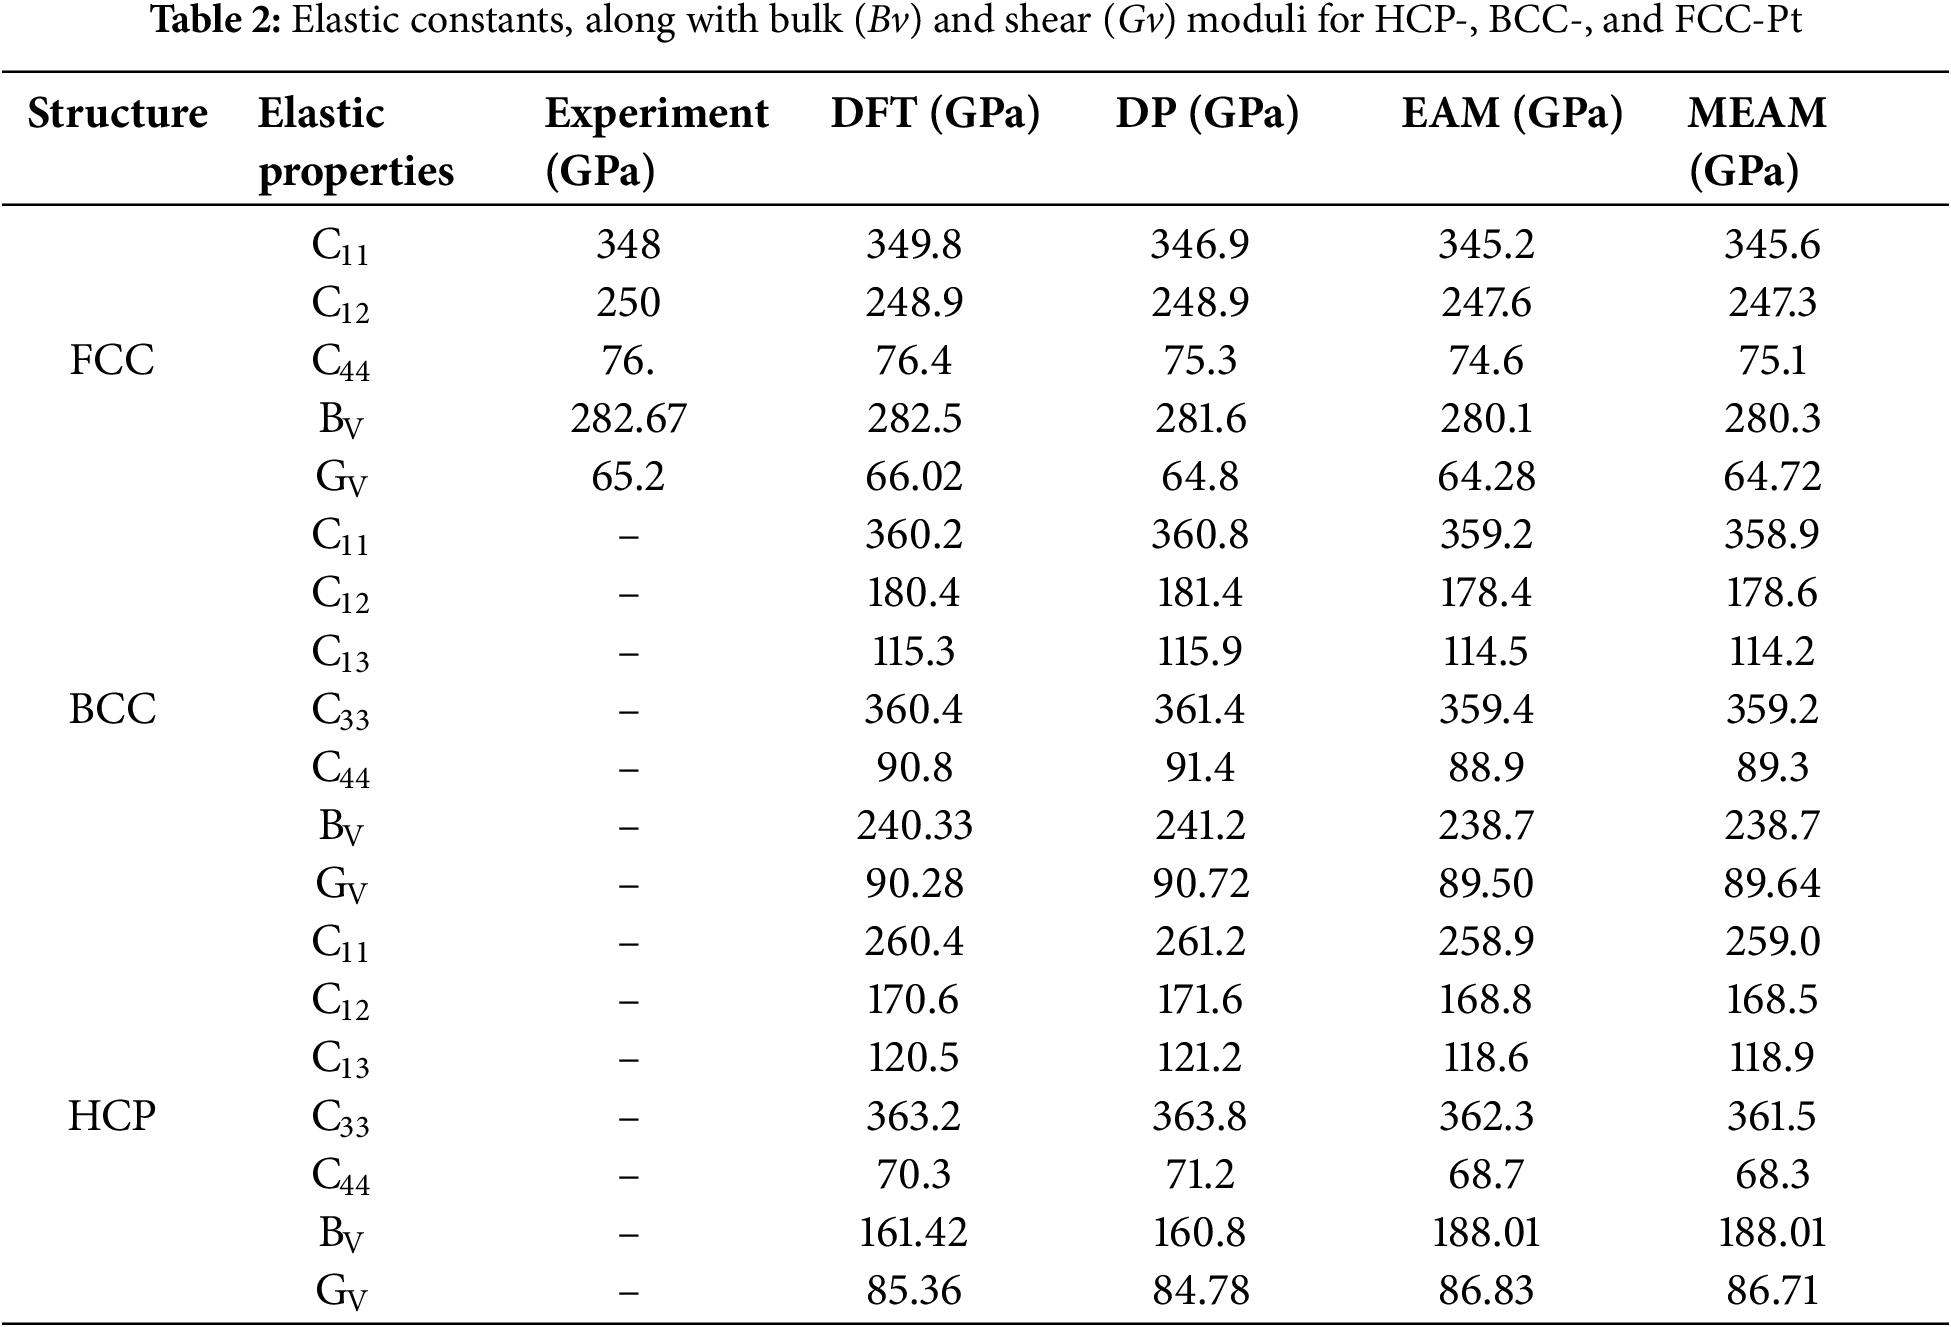
Using the Voigt equations and elastic constants, we also calculated the shear modulus and bulk modulus for Pt’s three structures: FCC, BCC, and HCP.
HCP-Pt:
FCC- and BCC-Pt:
Analysis of the data in Table 2 shows that, while some differences exist between the bulk modulus (Bv) and shear modulus (Gv) of Pt atoms across different crystal structures when evaluated using DP molecular dynamics and DFT simulations, EAM, and MEAM methods, the DP model performs exceptionally well. Specifically, for FCC-Pt, the bulk and shear moduli predicted by the DP model deviate by less than 1% from both experimental values [64] and DFT calculations. For HCP-Pt, the discrepancies are 0.39% and 0.68%, respectively. This precise prediction of bulk and shear moduli suggests that the DP model effectively captures the overall elastic response of Pt atoms.
3.4 Thermal Transport Properties of Pt
Lattice thermal conductivity reflects a material’s heat conduction efficiency, making it a key parameter for evaluating thermal management applications. Accurately assessing thermal conductivity data is essential for validating the DP model. By examining phonons propagation characteristics, we can predict and understand a material’s lattice thermal conductivity. A primary criterion for assessing the potential energy model’s validity is achieving an accurate phonons dispersion relation [65].Using both DP and DFT methods, we systematically calculated and evaluated the phonons dispersion relations for Pt atoms along high-symmetry directions in the Brillouin zone (detailed DFT calculations are provided in supporting literature). According to Fig. 7a, the phonons dispersion relation of Pt, calculated using the phonons dispersion method, shows that the DP model closely aligns with the DFT curve in the high-frequency region. Additionally, in the low-frequency region, the dispersion results from MD simulations are consistent with DFT calculations, further verifying the DP model’s reliability in replicating DFT-calculated performance. We initially calculated third-order interatomic force constants. Based on these, we analyzed temperature effects (300 to 1000 K) on the thermal conductivity of Pt in detail. First-principles calculations, combined with the open-source code ShengBTE, were used to compute lattice thermal conductivity. This approach often requires numerous single-point DFT calculations on extended lattice cells, reaching hundreds or thousands of instances. To capture third-order anharmonic interatomic force constants, we considered interactions up to the eighth nearest neighbors. Force constants were calculated up to the third order on a 2 × 2 × 2 supercell using first-principles. A negative correlation exists between lattice thermal conductivity and temperature. As shown in Fig. 7b, within the range of 300 to 1000 K, the lattice thermal conductivity of Pt atoms increases significantly from 74.2 to 82.1 Wm−1K−1. After comparing the data predicted by the DP model with the experimental values [62], as shown in Table S8, it was found that the overall trend was generally consistent with the variation pattern of the experimental results. Thus, the DP simulation results align closely with DFT calculations, confirming their accuracy and feasibility.
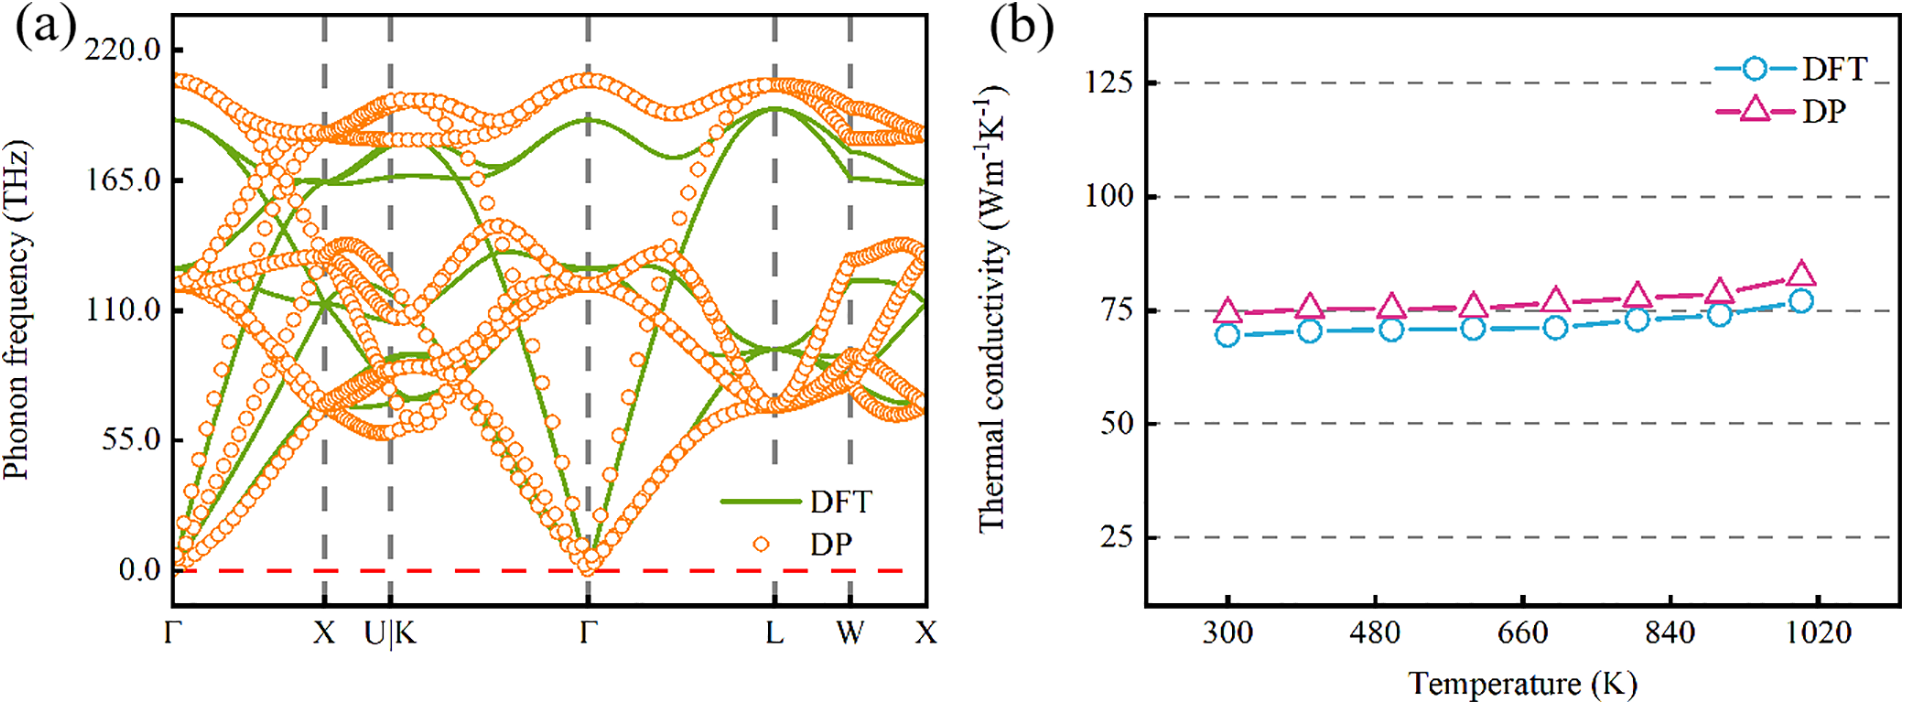
Figure 7: Phonon Dispersion and Thermal Conductivity of Pt. (a) The DFT and DP results of phonon dispersion relations for Pt are calculated by phonopy with the supercell size being 2 × 2 × 2. (b) The thermal conductivity of Pt at different temperatures predicted
In this work, to investigate the microscopic properties and structural characteristics of metallic Pt, we established a DP model based on deep neural networks and trained it using a substantial amount of physical property data and DFT calculations to ensure high predictive accuracy. This model accurately describes the energy, atomic forces, and lattice constants of metallic Pt, and aligns closely with DFT results in terms of lattice defects, melting point, mechanical properties, elastic constants, lattice thermal conductivity, and phonons dispersion. For instance, compared to DFT calculation data, the model’s prediction error for most structural elastic constants does not exceed 1.0 GPa, demonstrating high accuracy. Additionally, the DP model precisely captures the stable phase of Pt, with errors in reproducing the HCP, FCC, and BCC lattice constants below 0.25%. The model also achieves root-mean-square errors of 0.348 meV/atom for energy and 4.76 meV/Å for atomic force predictions, further validating its reliability. Despite the absence of vacancy and interstitial configurations of FCC-Pt in the training set, the DP model successfully predicts the formation energies of these defects, demonstrating excellent transferability. Due to the extensive range of properties covered in the training data, the DP model is not only suitable for accurately predicting the microscopic behavior of metallic Pt but can also be extended to study interactions and performance evolution in multicomponent systems containing Pt.
Acknowledgement: None.
Funding Statement: This research was supported by the Kunming University of Science and Technology “Double First-Class” Joint Special Project (Grant No. 202101BE070001-011), Yunnan Fundamental Research Projects (202201BE070001-008, 202201AT0 70192), National Natural Science Foundation of China (52402077), Shaanxi Province Key R&D Program (2021ZDLGY11-08), Open Project of Shaanxi Laboratory (2021SXsyS01-05), Open Project of Yunnan Precious Metals Laboratory (YPML-2023050240), National Natural Science Foundation of China (Grant No. 52462009), Yunnan Fundamental Research Projects (Grant Nos. 202201AT070192, 202101BE070001-011).
Author Contributions: The authors confirm contribution to the paper as follows: study conception and design: Keyuan Chen, Ju Rong, Yudong Sui; data collection: Jueyi Ye, Li Ma; analysis and interpretation of results: Xingkao Zhang, Qi Qiu, Haoxiang Zhang; draft manuscript preparation: Xiaohua Yu, Jing Feng. All authors reviewed the results and approved the final version of the manuscript.
Availability of Data and Materials: The datasets generated and/or analyzed during the current study are not publicly available due to privacy concerns of the participants but are available from the corresponding author on reasonable request.
Ethics Approval: Not applicable.
Conflicts of Interest: The authors declare no conflicts of interest to report regarding the present study.
Supplementary Materials: The supplementary material is available online at http://doi.org/10.32604/cmc.2025.060713.
References
1. Marchant GA, Caro MA, Karasulu B, Partay LB. Exploring the configuration space of elemental carbon with empirical and machine learned interatomic potentials. npj Comp Mater. 2023;9(1):1081. doi:10.1038/s41524-023-01081-w. [Google Scholar] [CrossRef]
2. Fayyazuddin, Rafi M. An empirical potential function of diatomic molecules. Phys Lett A. 1995;205(5–6):383–7. doi:10.1016/0375-9601(95)00552-E. [Google Scholar] [CrossRef]
3. Li LQ, Xu M, Song WP, Ovcharenko A, Zhang GY, Jia D. The effect of empirical potential functions on modeling of amorphous carbon using molecular dynamics method. Appl Surf Sci. 2013;286(9):287–97. doi:10.1016/j.apsusc.2013.09.073. [Google Scholar] [CrossRef]
4. Steele D, Lippincott ER, Vanderslice JT. Comparative study of empirical internuclear potential functions. Rev Mod Phys. 1962;34(2):239–51. doi:10.1103/RevModPhys.34.239. [Google Scholar] [CrossRef]
5. Cook SJ, Clancy P. Comparison of semi-empirical potential functions for silicon and germanium. Phys Rev B. 1993;128(47):7686. doi:10.1103/PhysRevB.47.7686. [Google Scholar] [PubMed] [CrossRef]
6. Grebneva HA. A new semiempirical potential function for hydrogen bonds and its possible use in studying the DNA molecule. J Mol Struct. 1993;296(1–2):127–32. doi:10.1016/0022-2860(93)80126-G. [Google Scholar] [CrossRef]
7. Huler E, Warshel A. On the consistent calculation of lattice dynamics using semiempirical potential functions. Chem Phys. 1975;8(1–2):239–44. doi:10.1016/0301-0104(75)80113-3. [Google Scholar] [CrossRef]
8. Grassano JS, Pickering I, Roitberg AE, Gonzalez Lebrero MC, Estrin DA, Semelak JA. Assessment of embedding schemes in a hybrid machine learning/classical potentials (ML/MM) approach. J Chem Inf Model. 2024;64(10):4047–58. doi:10.1021/acs.jcim.4c00478. [Google Scholar] [PubMed] [CrossRef]
9. Mishin Y. Machine-learning interatomic potentials for materials science. Acta Mater. 2021;214(11):6980. doi:10.1016/j.actamat.2021.116980. [Google Scholar] [CrossRef]
10. Thomas du Toit DF, Deringer VL. Cross-platform hyperparameter optimization for machine learning interatomic potentials. J Chem Phys. 2023;159(2):5618. doi:10.1063/5.0155618. [Google Scholar] [PubMed] [CrossRef]
11. Liu K, Ni Z, Zhou Z, Tan S, Zou X, Xing H, et al. Molecular modeling with machine-learned universal potential functions. 2021. doi:10.48550/arXiv.2103.04162. [Google Scholar] [CrossRef]
12. Shen L, Wang Y, Lai W. Development of a machine learning potential for the study of crack propagation in titanium. Int J Press Vessel Piping. 2021;194(10):4514. doi:10.1016/j.ijpvp.2021.104514. [Google Scholar] [CrossRef]
13. Yang W, Ye JW, Bi P, Huang BS, Chen L, Yi Y. Mechanical properties of Mo-Re alloy based on first-principles and machine learning potential function. Mater Today Commun. 2024;38(10):7796. doi:10.1016/j.mtcomm.2023.107796. [Google Scholar] [CrossRef]
14. Mukherjee C, Chothe SS, Mukhopadhyay S. Predicting effective thermal conductivity of HGM composite using ML. Therm Sci Eng Progress. 2024;55(10):2882. doi:10.1016/j.tsep.2024.102882. [Google Scholar] [CrossRef]
15. Zhang L, Han J, Wang H, Car R, Weinan E. Deep potential molecular dynamics: a scalable model with the accuracy of quantum mechanics. Phys Rev Lett. 2018;120(14):143001. doi:10.1103/PhysRevLett.120.143001. [Google Scholar] [PubMed] [CrossRef]
16. Han JQ, Zhang LF, Car R, Weinan E. Deep potential: a general representation of a many-body potential energy surface. Commun Comput Phys. 2018;23(3):629–39. doi:10.4208/cicp.OA-2017-0213. [Google Scholar] [CrossRef]
17. Wang H, Zhang LF, Han JQ, Weinan E. DeePMD-kit: a deep learning package for many-body potential energy representation and molecular dynamics. Comput Phys Commun. 2018;228(16):178–84. doi:10.1016/j.cpc.2018.03.016. [Google Scholar] [CrossRef]
18. Dai JH, He DY, Song Y. Correlations of equilibrium properties and electronic structure of pure metals. Materials. 2019;12(18):2932. doi:10.3390/ma12182932. [Google Scholar] [PubMed] [CrossRef]
19. Xiao RL, Liu KL, Ruan Y, Wei B. Rapid acquisition of liquid thermophysical properties from pure metals to quaternary alloys by proposing a machine learning strategy. Appl Phys Lett. 2023;123(5):46. doi:10.1063/5.0160046. [Google Scholar] [CrossRef]
20. Zhang ZY, Li B, Zhou XL. Ag(111) and its doped surfaces for heavy metal atoms removal from wastewater: DFT calculation analysis. J Water Process Eng. 2023;54(10):4002. doi:10.1016/j.jwpe.2023.104002. [Google Scholar] [CrossRef]
21. Wang Y, Zhang L, Xu B, Wang X, Wang H. A generalizable machine learning potential of Ag-Au nanoalloys and its application to surface reconstruction, segregation and diffusion. Model Simul Mater Sci Eng. 2021;30(2):025003. doi:10.1088/1361-651X/ac4002. [Google Scholar] [CrossRef]
22. Zhai B, Wang HP. Accurate interatomic potential for the nucleation in liquid Ti-Al binary alloy developed by deep neural network learning method. Comput Mater Sci. 2023;216(16):111843. doi:10.1016/j.commatsci.2022.111843. [Google Scholar] [CrossRef]
23. Guo D, Li C, Li K, Shao B, Chen D, Ma Y, et al. The thermoelectric performance of new structure SnSe studied by quotient graph and deep learning potential. Mater Today Energy. 2021;20(21):100665. doi:10.1016/j.mtener.2021.100665. [Google Scholar] [CrossRef]
24. Jiang W, Zhang Y, Zhang L, Wang H. Accurate Deep Potential model for the Al–Cu–Mg alloy in the full concentration space. Chin Phys B. 2021;30(5):050706. doi:10.1088/1674-1056/abf134. [Google Scholar] [CrossRef]
25. Gartner TE, Zhang L, Piaggi PM, Car R, Panagiotopoulos AZ, Debenedetti PG. Signatures of a liquid-liquid transition in an ab initio deep neural network model for water. Proc Nat Acad Sci. 2020;117(42):26040–6. doi:10.1073/pnas.2015440117. [Google Scholar] [PubMed] [CrossRef]
26. Sousa T, Correia J, Pereira V, Rocha M. Generative deep learning for targeted compound design. J Chem Inf Model. 2021;61(11):5343–61. doi:10.1021/acs.jcim.0c01496. [Google Scholar] [PubMed] [CrossRef]
27. Wang Q, Zhai B, Wang HP, Wei B. Atomic structure of liquid refractory Nb5Si3 intermetallic compound alloy based upon deep neural network potential. J Appl Phys. 2021;130(18):7157. doi:10.1063/5.0067157. [Google Scholar] [CrossRef]
28. Wen TQ, Wang CZ, Kramer MJ, Sun Y, Ye BL, Wang HD, et al. Development of a deep machine learning interatomic potential for metalloid-containing Pd-Si compounds. Phys Rev B. 2019;100(17):4101. doi:10.1103/PhysRevB.100.174101. [Google Scholar] [CrossRef]
29. Le TPT, Nguyen TNA, Vu TT, Aubert PH, Pokpas K, Pham-Truong TN. Pt nanoparticles electrodeposited on an ultrathin nitrogen-rich underlayer for methanol sensors. ACS Appl Nano Mat. 2024;7(12):14174–84. doi:10.1021/acsanm.4c01675. [Google Scholar] [CrossRef]
30. Li S, Xin ZY, Luo Y, Pan JX, Liao GN, Li Q, et al. Recent advances in the development of single atom catalysts for oxygen evolution reaction. Int J Hydrogen Energy. 2024;82(8):1081–100. doi:10.1016/j.ijhydene.2024.08.026. [Google Scholar] [CrossRef]
31. Qin P, Yan J, Zhang W, Pan T, Zhang X, Huang W, et al. Prediction descriptor for catalytic activity of platinum nanoparticles/metal-organic framework composites. ACS Appl Mater Interfaces. 2021;13(32):38325–32. doi:10.1021/acsami.1c10140. [Google Scholar] [PubMed] [CrossRef]
32. Yashtulov NA, Zenchenko VO, Kuleshov NV, Flid VR. Synthesis and catalytic activity of platinum/porous silicon nanocomposites. Russ Chem Bull. 2016;65(10):2369–74. doi:10.1007/s11172-016-1591-9. [Google Scholar] [CrossRef]
33. de Lucas-Consuegra A, Dorado F, Jiménez-Borja C, Valverde JL. Electrochemical promotion of Pt impregnated catalyst for the treatment of automotive exhaust emissions. J Appl Electrochem. 2008;38(8):1151–7. doi:10.1007/s10800-008-9559-6. [Google Scholar] [CrossRef]
34. Gutiérrez de la Rosa SY, Muñiz Diaz R, Villalobos Gutiérrez PT, Patakfalvi R, Gutiérrez Coronado Ó. Functionalized platinum nanoparticles with biomedical applications. Int J Mol Sci. 2022;23(16):9404. doi:10.3390/ijms23169404. [Google Scholar] [PubMed] [CrossRef]
35. Elkoua IA, Masrour R. Structural, thermodynamics, optical, electronic, magnetic and thermoelectric properties of Heusler Ni2MnGa: an ab initio calculations. Opt Quantum Electron. 2022;54(10):1007. doi:10.1007/s11082-022-03999-9. [Google Scholar] [CrossRef]
36. Belhamra S, Masrour R, Hlil EK. Dynamic phase transitions, electronic, and magnetic properties of Ba2NiWO6 and Sr2NiWO6 double perovskites. J Supercond Nov Magn. 2022;35(12):3613–22. doi:10.1007/s10948-022-06405-3. [Google Scholar] [CrossRef]
37. Zhang YZ, Wang HD, Chen WJ, Zeng JZ, Zhang LF, Wang H, et al. DP-GEN: a concurrent learning platform for the generation of reliable deep learning based potential energy models. Comput Phys Commun. 2020;253(10):7206. doi:10.1016/j.cpc.2020.107206. [Google Scholar] [CrossRef]
38. Zeng JZ, Zhang D, Lu DH, Mo PH, Li ZY, Chen YX, et al. DeePMD-kit v2: a software package for deep potential models. J Chem Phys. 2023;159(5):55–60. doi:10.1063/5.0155600. [Google Scholar] [PubMed] [CrossRef]
39. Bertani M, Charpentier T, Faglioni F, Pedone A. Accurate and transferable machine learning potential for molecular dynamics simulation of sodium silicate glasses. J Chem Theory Comput. 2024;20(3):1358–70. doi:10.1021/acs.jctc.3c01115. [Google Scholar] [PubMed] [CrossRef]
40. Cui TT, Li JC, Gao W, Hermann J, Tkatchenko A, Jiang Q. Nonlocal electronic correlations in the cohesive properties of high-pressure hydrogen solids. J Phys Chem Lett. 2020;11(4):1521–7. doi:10.1021/acs.jpclett.9b03716. [Google Scholar] [PubMed] [CrossRef]
41. Hageman T, Martínez-Pañeda E. A phase field-based framework for electro-chemo-mechanical fracture: crack-contained electrolytes, chemical reactions and stabilisation. Comput Methods Appl Mech Eng. 2023;415(11):6235. doi:10.1016/j.cma.2023.116235. [Google Scholar] [CrossRef]
42. Zhang J, Li X, Dong X, Dong H, Oganov AR, McMahon JM. Theoretical study of the crystal structure, stability, and properties of phases in the V-N system. Phys Rev B. 2021;104(13):4111. doi:10.1103/PhysRevB.104.134111. [Google Scholar] [CrossRef]
43. Ouyang W, Azuri I, Mandelli D, Tkatchenko A, Kronik L, Urbakh M, et al. Mechanical and tribological properties of layered materials under high pressure: assessing the importance of many-body dispersion effects. J Chem Theory Comput. 2020;16(1):666–76. doi:10.1021/acs.jctc.9b00908. [Google Scholar] [PubMed] [CrossRef]
44. Song J, Feng S, Xiong R, Ouyang Y, Zeng Q, Zhu J, et al. Mechanical properties, pozzolanic activity and volume stability of copper slag-filled cementitious materials. Mater Sci. 2019;26(2):218–24. doi:10.5755/j01.ms.26.2.21447. [Google Scholar] [CrossRef]
45. Niu H, Xia C, Huang L, Zaman S, Maiyalagan T, Guo W, et al. Rational design and synthesis of one-dimensional platinum-based nanostructures for oxygen-reduction electrocatalysis. Chin J Catal. 2022;43(6):1459–72. doi:10.1016/s1872-2067(21)63862-7. [Google Scholar] [CrossRef]
46. Seiji K, Hiroshi F, Akira Y, Hitoshi G, Fumiya M, Satoshi T, et al. Elastic constants of single-crystal Pt measured up to 20 GPa based on inelastic X-ray scattering: implication for the establishment of an equation of state. Comptes Rendus Géoscience. 2019;351(2–3):236–42. doi:10.1016/j.crte.2018.11.003. [Google Scholar] [CrossRef]
47. Zhao HT, Ezeh CI, Ren WJ, Li WT, Pang CH, Zheng CH, et al. Integration of machine learning approaches for accelerated discovery of transition-metal dichalcogenides as Hg sensing materials. Appl Energy. 2019;254(11):3651. doi:10.1016/j.apenergy.2019.113651. [Google Scholar] [CrossRef]
48. Sakong S, Gross A, Behm RJ. Interface, compression and formation energies of bimetallic Ag/Pt(111) and Ag/Pd(111) surfaces from first-principles. J Phys Chem C. 2024;128(32):13558–67. doi:10.1021/acs.jpcc.4c02619. [Google Scholar] [CrossRef]
49. Yoo SH, Lee JH, Jung YK, Soon A. Exploring stereographic surface energy maps of cubic metals via an effective pair-potential approach. Phys Rev B. 2016;93(3):5434. doi:10.1103/PhysRevB.93.035434. [Google Scholar] [CrossRef]
50. Zhang WB, Chen C, Zhang SY. Equilibrium crystal shape of Ni from first principles. J Phys Chem C. 2013;117(41):21274–80. doi:10.1021/jp404569m. [Google Scholar] [CrossRef]
51. Smirnov NA. Relative stability of Cu, Ag, and Pt at high pressures and temperatures from ab initio calculations. Phys Rev B. 2021;103(6):4107. doi:10.1103/PhysRevB.103.064107. [Google Scholar] [CrossRef]
52. Lee HB, Park DG, Park J, Kim YH, Kang JK. Amorphized defective fullerene with a single-atom platinum for room-temperature hydrogen storage. Adv Energy Mater. 2023;13(20):41. doi:10.1002/aenm.202300041. [Google Scholar] [CrossRef]
53. Du Y, Meng Z, Yan Q, Wang C, Tian Y, Duan W, et al. Deep potential for a face-centered cubic Cu system at finite temperatures. Phys Chem Chem Phys. 2022;24(30):18361–9. doi:10.1039/d2cp02758e. [Google Scholar] [PubMed] [CrossRef]
54. Xue H-T, Chang Z, Li J, Yang Y-H, Ren J-Q, Zhang Y, et al. Molecular dynamics simulations of the shear and tensile mechanical properties of rare-earth metal erbium based on deep-learning potential. Mater Today Commun. 2024;41(11):0485. doi:10.1016/j.mtcomm.2024.110485. [Google Scholar] [CrossRef]
55. Liu J, Zhang G, Wang J, Zhang H, Han Y. Research on Cu-Sn machine learning interatomic potential with active learning strategy. Comput Mater Sci. 2025;246(11):3450. doi:10.1016/j.commatsci.2024.113450. [Google Scholar] [CrossRef]
56. Horváth J, Dyment F, Mehrer H. Anomalous self-diffusion in a single crystal of α-zirconium. J Nucl Mater. 1984;126(3):206–14. doi:10.1016/0022-3115(84)90030-8. [Google Scholar] [CrossRef]
57. Herzig C, Mishin Y, Divinski S. Bulk and interface boundary diffusion in group IV hexagonal close-packed metals and alloys. Metall Mat Transact A-Phy Metall Mat Sci. 2002;33(3):765–75. doi:10.1007/s11661-002-0143-0. [Google Scholar] [CrossRef]
58. Balogh Z, Schmitz G. Diffusion in metals and alloys. In: Laughlin DE, Hono K, editor. Physical metallurgy. Oxford: Elsevier; 2014. p. 387–559. [Google Scholar]
59. Köppers M, Herzig C, Friesel M, Mishin Y. Intrinsic self-diffusion and substitutional Al diffusion in α-Ti. Acta Mater. 1997;45(10):4181–91. doi:10.1016/s1359-6454(97)00078-5. [Google Scholar] [CrossRef]
60. Hargather CZ, O’Connell JM. A systematic first-principles study of computational parameters affecting self-diffusion coefficients in FCC Ag, Cu, and Ni. J Phase Equilibria Diffus. 2022;43(6):764–79. doi:10.1007/s11669-022-00991-4. [Google Scholar] [CrossRef]
61. Konorev SI, Kozubski R, Albrecht M, Vladymyrskyi IA. Self-diffusion of Fe and Pt in L10-Ordered FePt: molecular dynamics simulation. Comput Mater Sci. 2021;192(11):110337. doi:10.1016/j.commatsci.2021.110337. [Google Scholar] [CrossRef]
62. Gomi H, Yoshino T. Resistivity, Seebeck coefficient, and thermal conductivity of platinum at high pressure and temperature. Phys Rev B. 2019;100(21):4302. doi:10.1103/PhysRevB.100.214302. [Google Scholar] [CrossRef]
63. Hasegawa A, Ohta K, Yagi T, Hirose K. Thermal conductivity of platinum and periclase under extreme conditions of pressure and temperature. High Press Res. 2023;43(1):68–80. doi:10.1080/08957959.2023.2193892. [Google Scholar] [CrossRef]
64. Menéndez-Proupin E, Singh AK. Ab initio calculations of elastic properties of compressed Pt. Phys Rev B. 2007;76(5):4117. doi:10.1103/PhysRevB.76.054117. [Google Scholar] [CrossRef]
65. Chen ZW, Zhang XY, Lin SQ, Chen LD, Pei YZ. Rationalizing phonon dispersion for lattice thermal conductivity of solids. Natl Sci Rev. 2018;5(6):888–94. doi:10.1093/nsr/nwy097. [Google Scholar] [CrossRef]
Supplementary Materials
Figure S1. For Pt, distribution of maximum deviation of force (σ_f^max) from iteration 1–4. Distribution of deviation values at four temperatures is plotted, and the two vertical lines (dashed) correspond to the lower and upper bound of the selection criteria (0.03 eV/Å and 0.13 eV/Å).
Figure S2. The EV curve (energy as a function of volume) for (a) HCP-Pt and (b) BCC-Pt. DFT represents ab initio results, and DP indicates predictions from the deep potential model for Pt.
Cite This Article
 Copyright © 2025 The Author(s). Published by Tech Science Press.
This work is licensed under a Creative Commons Attribution 4.0 International License , which permits unrestricted use, distribution, and reproduction in any medium, provided the original work is properly cited.
 Downloads
 Citation Tools