
 Submit a Paper
 Propose a Special lssue
 Open Access
ARTICLE
A Transformer Based on Feedback Attention Mechanism for Diagnosis of Coronary Heart Disease Using Echocardiographic Images
1 School of Information Science and Technology, North China University of Technology, Beijing, 100144, China
2 Department of Computer Science, University of Illinois Springfield, Springfield, IL 62703, USA
3 Department of Ultrasound, Sun Yat-sen Memorial Hospital, Sun Yat-sen University, Guangzhou, 510120, China
* Corresponding Authors: Yanhui Guo. Email: ; Guoqing Du. Email:
# These authors contributed equally to this work
(This article belongs to the Special Issue: Cutting-Edge Machine Learning and AI Innovations in Medical Imaging Diagnosis)
Computers, Materials & Continua 2025, 83(2), 3435-3450. https://doi.org/10.32604/cmc.2025.060212
Received 26 October 2024; Accepted 04 March 2025; Issue published 16 April 2025
 View Full Text
 Download PDF
Abstract
Coronary artery disease is a highly lethal cardiovascular condition, making early diagnosis crucial for patients. Echocardiograph is employed to identify coronary heart disease (CHD). However, due to issues such as fuzzy object boundaries, complex tissue structures, and motion artifacts in ultrasound images, it is challenging to detect CHD accurately. This paper proposes an improved Transformer model based on the Feedback Self-Attention Mechanism (FSAM) for classification of ultrasound images. The model enhances attention weights, making it easier to capture complex features. Experimental results show that the proposed method achieves high levels of accuracy, recall, precision, F1 score, and area under the receiver operating characteristic curve (72.3%, 79.5%, 82.0%, 81.0%, and 0.73%, respectively). The proposed model was compared with widely used models, including convolutional neural network and visual Transformer model, and the results show that our model outperforms others in the above evaluation metrics. In conclusion, the proposed model provides a promising approach for diagnosing CHD using echocardiogram.Keywords
Coronary heart disease (CHD) is a highly fatal condition. According to World Health Organization’s statistics, approximately 17.9 million people die from cardiovascular diseases annually, accounting for about 31% of total global mortality [1]. Cardiovascular diseases refer to a variety of conditions that impact the heart and blood vessels, such as coronary artery disease, heart failure, and other related abnormalities. In light of the challenges associated with these diseases, ultrasound imaging has gained substantial recognition as a valuable tool. It is increasingly regarded as crucial in aiding radiologists with image analysis and other diagnostic procedures. Its ability to enhance detection accuracy and lower false-positive rates is noteworthy, demonstrating considerable potential for broad application.
With the ongoing advancements in deep learning, integrating ultrasound images with Artificial Intelligence (AI) has become a key trend in medical image analysis. This collaboration is expected to significantly improve the accuracy and efficiency of coronary heart disease detection. Research on the use of ultrasound images for detecting coronary heart disease is advancing rapidly, presenting new opportunities to enhance diagnostic precision and efficiency. For instance, a study by Alonso-Gonzalez et al. highlighted that the integration of artificial intelligence methods into ultrasound imaging allows for the automatic identification of intricate scanning patterns, offering quantitative evaluations that ultimately improve both diagnostic accuracy and reproducibility [2]. Similarly, Rana and Bhushan mentioned in their study that the use of deep learning techniques for coronary heart disease detection can greatly improve the efficiency of image processing and diagnostic accuracy. However, they also pointed out that the current study still faces challenges in global information acquisition and processing complexity [3].
Conventional depth models and some visual Transformer architectures often struggle with specific challenges, such as boundary blurring, intricate information structures, and motion artifacts in input images. These issues can cause the model to overlook crucial data, leading to a drop in performance. To overcome these limitations, we introduce a novel model designed to tackle these challenges, enhancing performance in complex image environments.
To address the challenges encountered by existing models in recognizing ultrasound images, we developed a Transformer-based backbone network tailored for computer vision tasks, with the following key contributions:
(1) We propose an extraction algorithm, FSAM, designed to process ultrasound images of coronary heart disease by extracting deep, complex features. Experimental results show that the algorithm is highly effective in capturing these intricate features, significantly enhancing the model’s performance.
(2) A Transformer model based on the Feedback Self-Attention Mechanism (FSAM) is proposed, which shows excellent results on relevant datasets and provides a new approach for identifying features and biomarkers related to different types of cardiogenic diseases.
(3) Our experiments with the FSAM Transformer model show significant improvements over other visual Transformer and traditional deep models in terms of accuracy, recall, precision, F1 score, and AUC, promising better diagnosis and treatment of coronary artery disease and positively impacting healthcare.
In the following sections, we will first discuss related work in Section 2 and describe the proposed method in Section 3. Next, in Sections 4 and 5, we present experimental results and comparative analysis, followed by a detailed discussion. Finally, in Section 6, we draw comprehensive conclusions.
With the emergence of models such as Convolutional Neural Networks (CNN) and Transformer, the performance of analyzing and recognizing medical ultrasound images has been greatly improved.
The development of artificial intelligence technology has facilitated research on its application in echocardiography [4], and early examples of the combined application of echocardiography and machine learning date back to 1978, when Fourier transforms were used to analyze M-mode ultrasound to assess anterior mitral valve leaflet function and to confirm the effectiveness of this method for the adjunctive diagnosis of mitral valve prolapse [5]. Prior to the introduction of deep learning in 2006, a large number of machine learning algorithms had already been applied in the form of software or cutting-edge technologies for the assessment of cardiac function in echocardiography, optimization of ultrasound images, and observation of cardiac structure [6–8].
Arsanjani et al. [9] predicted hemodynamic reconstruction in patients with suspected coronary artery disease by investigating machine learning methods to extract features from SPECT myocardial perfusion images. Motwani et al. [10] predicted 5-year all-cause mortality from suspected coronary artery disease with significantly higher accuracy than clinical or coronary computed tomographic angiography (CCTA) alone predictors by machine learning methods. Khamis et al. [11] utilized a multi-stage classification algorithm to recognize apical two-chamber, apical four-chamber, and apical long-axis images, with a significant improvement in recognition rate. Dezaki et al. [12] borrowed the research of Kong et al. [13] on the detection of end-diastolic (ED) and end-systolic (ES) frames in magnetic resonance imaging (MRI), and combined ResNet [14] and long short-term memory (LSTM) [15] to propose a deep residual recurrent neural network to extract the spatio-temporal features of the fixed-length cardiac ultrasound image sequences, and to realize the detection of ED and ES frame detection. Taheri et al. [16] improved on this by feeding variable-length ultrasound sequences into a module combining DenseNet and a gating unit and proposed a global extreme loss function to further improve the ED and ES frame detection performance. Fiorito et al. [17] applied a hybrid model of 3D CNN and LSTM to spatio-temporal feature extraction of echocardiography videos, classifying each frame in diastole and systole, and identifying the ED and ES frames as toggle frames between the two states, which can be used for sequences of arbitrary lengths. Lane et al. [18] combined ResNet and LSTM to extract the spatio-temporal information of ultrasound sequences and demonstrated the feasibility of the DL technique for the recognition of ED and ES frames of arbitrarily-length ultrasound sequences that contain multiple cardiac cycles, but it is computationally relatively complex and time-consuming to reason. Sofka et al. [19] proposed a fully convolutional regression network for the detection of measurement points in cardiac parasternal long-axis views, which consists of a Fully Convolutional Neural Network (FCN) for regressing the position of the measurement points and an LSTM unit for optimizing the position of the estimated points. Østvik et al. [20] collected 2D echocardiographic data from 470 patients and applied CNN to build a classification model, while 3D echocardiographic data from 60 patients were collected for training the model, and it was found that the classification model could predict up to seven different cardiac views. A team of researchers at the University of California, San Francisco used a deep learning approach to classify and label both static and dynamic raw images, using 15 standard cuts as classification criteria to construct an automatic cut recognition model.
The primary challenges in classifying ultrasound coronary images involve effectively capturing relevant information and ensuring computational efficiency. The ability to accurately capture critical lesion features in coronary ultrasound images is crucial, which can be addressed by developing advanced feature extraction algorithms or employing deep learning models to automatically learn these features. To maintain high accuracy, it is also essential to design lightweight model architectures that minimize model parameters and computational complexity, thereby enhancing the algorithm’s real-time performance and efficiency in practical applications.
Another significant challenge in ultrasound coronary image classification is the presence of noise and artifacts, which can negatively impact classification accuracy. To mitigate these issues, several techniques have been proposed, including transfer learning, image decomposition and fusion, as well as convolutional neural networks (CNNs).
However, models that employ transformer architectures, despite their breakthroughs in establishing inter-data connections, still encounter challenges such as limitations on sequence length, high computational demands, visual noise, and difficulties with memory management when handling high-definition images and noise. Consequently, future research should focus on enhancing the efficiency and accuracy of models for ultrasound coronary image detection.
Due to the ultrasound image itself, there are problems such as blurred boundaries, com plex information structure, and motion artifacts. This will make some visual Transformers have the problem of poor recognition accuracy. To address this problem, we propose the FSAM (Feedback Self-Attention Mechanism) Transformer model, as shown in Fig. 1. The corresponding layers and parameter settings are shown in Table 1.

Figure 1: FSAM transformer structure

The model adopts a design strategy that consists of a series of FSAM mechanisms to ensure that information transfer is not “forgotten”, and the flow of information in the model is as follows:
The stage 1 pixel block embedding (patch embedding) module divides the input image rules into non-overlapping equal-sized 3D pixel blocks notated as
where
A fully connected layer is inserted at the tail of the network as a classification head for image classification based on the number of dataset categories.
Images are further preprocessed on the dataset before being sent to model training, including data enhancement, data normalization processing, resize into a 2D matrix suitable for the model in this paper, and each process is described as follows:
Data Enhancement: In this paper, we have used on-line enhancement, i.e., performing data enhancement operations on small batches of images before they are fed into the model for training. Data enhancement can produce more data and improve the robustness of the model. In the actual ultrasound image acquisition process, the different acquisition methods may lead to different positions and brightnesses of the signs in the ultrasound images. In the medical field, it is difficult to have a sufficiently large number of datasets. Considering the practical factors, using data enhancement methods to randomly change the training samples can reduce the model’s dependence on the attributes such as the position of the signs in the ultrasound images and the brightness in the ultrasound images. The data enhancement methods used in this paper include the following:
(1) Random cropping after filling around the image, filling 0 around the image first and then randomly cropping the image to a size of 512 × 512;
(2) Flipping the image horizontally with a probability of 50%;
(3) Randomly rotating the image by an arbitrary integer angle between −360 and 360 to change the orientation of the ultrasound signs in the image.
Normalization: normalization is an operation applied to an image before it is fed into the network to start training. In this paper, the standard normalization method is used, where the processed data is normalized, the mean is 0 and the standard deviation is 1. The data
Feedback-Block in the FSAM Transformer model is an important part of the local and global interaction of image features, and information feedback. It achieves deep iteration and a comprehensive understanding of image information. W-MSA facilitates the interaction and integration of local information through windowing. The proposed Feedback Self-Attention Mechanism realizes the capture of historical dependencies of the current image block region by introducing iterative information enhancement. Fig. 2 shows the internal structure of the feedback block.

Figure 2: Structure of the feedback-block
The information flows as follows: where
3.4 Feedback Self-Attention Mechanism in Our Model
In this chapter, we introduce a novel attention mechanism called the Feedback Self-Attention Mechanism (FSAM). This method aims to enhance the model’s capability to capture information and understand the current block region by providing stronger attention. FSAM employs cyclic attention to enhance the current attention information. We define the current epoch attention information as
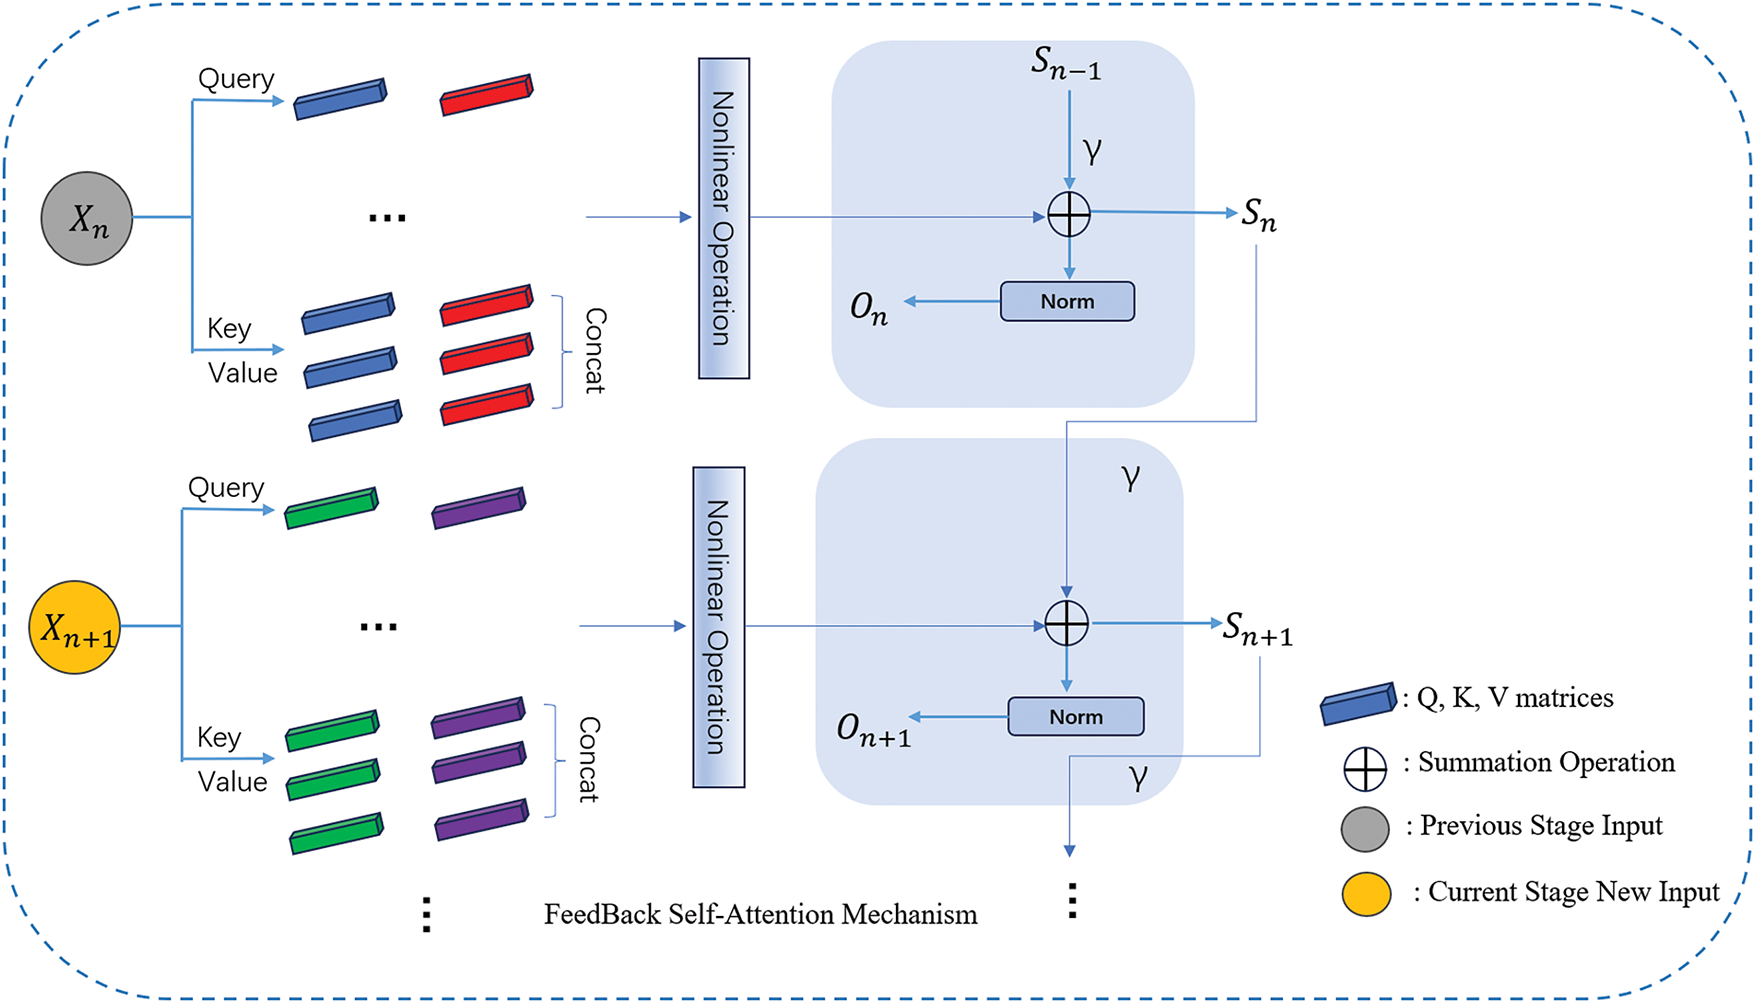
Figure 3: FSAM structure
In Fig. 3, in each round of epoch, we add FSAM on top of the original attention mechanism, which saves the results of the current epoch operation and participates in the operation of the attention mechanism of the next epoch, and iteratively saves the results, which makes the attention gradually enhanced, and at the same time, we introduce the γ parameter to regulate the attention weights, to avoid the occurrence of overfitting.
The FSAM method introduces a cyclic attention mechanism, enabling the model to comprehend the current information by incorporating both historical and current attention during parallel training. We define a feedback function that incorporates historical information to enhance the self-attention strength of the current image block, as outlined below:
First, we define the attention matrix:
where
Next, we construct the state feedback function and loop through the information with a linear transformation as in the Eq. (9).
where
Next, we apply a regularization function aimed at enhancing the model’s ability to select relevant features and improve its generalization performance. This involves applying penalties to complex models, encouraging simpler and more robust feature representations. The final feedback function obtained is shown below:
where
The FSAM approach allows each block to focus and enhance its attention based on historical information in training. This enhanced block attention information is effective in improving the model’s performance in certain scenarios because it effectively increases the model’s attention to key information, allowing the model to have a memory of historical information, which enhances the model’s comprehension and mitigates the problem of vanishing gradients to some extent. In the actual training process, we designed an iteration limit for the mechanism to work, this iteration limit is that we make the FSAM mechanism work at the beginning of the model training, and when the model is trained for a number of epochs, the mechanism is canceled by the set epoch parameter. It is used to pay more attention to a certain domain in the initial stage of model training, to notice deeper information, and when the number of training rounds exceeds the set iteration limit, we cancel the mechanism, which helps to reduce the probability of overfitting and the complexity of computation, and we can adjust the intensity of attention according to variable factors during training.
The dataset consists of echocardiographic images of coronary heart disease, divided into two categories: negative and positive.
The dataset comprises a total of 2160 echocardiographic images, with 664 images allocated for testing. The distribution of images across specific categories and the total number of images are shown in Table 2.

In our experiments, we employed a 5-fold cross-validation approach to evaluate the performance of our model. The dataset was divided into five distinct subsets, and in each fold, four of these subsets were used for training, while the remaining subset was reserved for testing, maintaining a training-to-testing ratio of 4:1. This method ensured that every data point was used for both training and validation, providing a comprehensive assessment of the model’s robustness and generalizability. Each round of experiments was conducted for 500 epochs to allow sufficient time for the model to converge and achieve optimal performance.
We now present the hardware and software used for training and testing. Our processor is an Intel Xeon Gold 6248R with 20 cores and 40 threads, accompanied by 128 GB of RAM and an A100-PCIE-40 GB (40 GB) GPU, utilized for conducting experiments in training and testing deep learning models. During the training phase, the following hyperparameters were employed: the number of epochs was set to 500, the batch size (i.e., the number of input image batches) was set to 128, and the learning rate was set to 0.0001.
To assess the performance of the deep learning model in ultrasound image classification tasks, we utilize the test set to compute the confusion matrix. This matrix enables the calculation of various classification metrics such as Precision, Recall, F1 score, and Accuracy, providing a nuanced understanding of the model’s performance. Additionally, it offers insights into which categories the model tends to confuse, aiding further performance improvement efforts. The confusion matrix displays the quantities of true positives (TP), false positives (FP), true negatives (TN), and false negatives (FN) for each category label. The specific calculation formulas are provided below:
Additionally, the Receiver Operating Characteristics (ROC) curve is a graphical tool commonly used to assess the performance of binary classifiers. It illustrates the relationship between the true positive rate (TPR) and the false positive rate (FPR) at various classification thresholds. By adjusting these thresholds, different points on the curve are generated, providing insights into the classifier’s behavior.
The ROC curve is created by incrementally increasing the threshold that defines an example as “positive” (indicating the severity of the patient’s condition). As the threshold changes, the number of true positives (TP) and false positives (FP) varies, generating a set of points that form the ROC curve in the ROC space.
To quantify the performance of the classifier, the Area Under the Curve (AUC) is calculated. An AUC value of 1 represents a perfectly accurate model, while an AUC of 0.5 indicates that the model performs no better than random chance. If the AUC is below 0.5, it suggests that the model is performing worse than random guessing.
The ROC curve provides a clear visualization of the trade-off between true positives and false positives, allowing one to evaluate the classifier’s performance across different thresholds. It also enables comparison of different classifiers by examining their respective ROC curves. The AUC serves as a comprehensive metric for classifier performance and is often used to compare the overall efficacy of different classification models.
Our proposed model is a variant of the Swin Transformer architecture, with specific improvements tailored to overcome previous difficulties and ultimately enhance the effectiveness of the classification task. Through extensive experimentation, we have validated the effectiveness and importance of our approach. Our model will be directly compared with the Swin Transformer, as shown in Table 5, with confusion matrices provided in Tables 3 and 4, as well as with other state-of-the-art (SOTA) models. All models are trained and evaluated on the same dataset. Our experimental results on the ultrasound coronary artery disease dataset demonstrate that the FSAM mechanism significantly improves the model’s ability to determine whether a patient has coronary artery disease. This serves as strong evidence for the effectiveness of our proposed method.


In the context of ultrasound coronary image classification, we rigorously evaluated key performance metrics such as accuracy, precision, recall, F1 score, and AUC metrics. The detailed results of these comparisons are recorded in Table 6, while their performance metrics are visually depicted in Figs. 4 and 5, Importantly, these comparative results unequivocally highlight the superior performance of our proposed FSAM Transformer, consistently surpassing existing state-of-the-art (SOTA) methods across all evaluation metrics.


Figure 4: Performance comparison of classification results using different models

Figure 5: ROC graphs for different models
From Table 6 and Fig. 4, our proposed model shows significant improvement in precision, recall, F1 score and accuracy. In addition, we focus on the F1 score, which combines precision and recall for a more comprehensive evaluation of the model’s performance. Compared to the comparison models, our model significantly achieves higher F1 scores, which suggests that it has an advantage in balancing accuracy and comprehensiveness.
Fig. 5 illustrates that the area under the ROC curve (AUC) of our model is relatively high. This indicates the model’s superior classification ability and discriminative power in diagnosing coronary heart disease ultrasound images. Further analysis suggests that the high AUC value of our model may be attributed to its effective capture and representation of ultrasound image features. Additionally, our model’s ROC curve exhibits a smoother shape, rather than sharp fluctuations or folds. This suggests that our model maintains stability in classification results across different thresholds and performs well in various scenarios.
As shown in Fig. 6, In this classification task, to further analyze the basis of the model’s classification decisions, we employed the Class Activation Map (CAM) method to visualize the model’s prediction results. The heatmaps illustrate the regions of the input images that the model focuses on. The red regions represent areas of high attention, indicating that these areas play a crucial role in the final classification results, while the blue regions correspond to areas of lower attention.

Figure 6: Class activation map visualization for FSCAD and Non-FSCAD images
In this experiment, the classification results for two categories, FSCAD (Functionally Significant Coronary Artery Disease) and Non-FSCAD (Non-Functionally Significant Coronary Artery Disease), were presented. From the CAM heatmaps, it can be observed that the model focuses on critical lesion regions in the coronary arteries for FSCAD images, particularly the narrowed or abnormal segments. This prominent activation region aligns well with the clinical characteristics of functionally significant lesions, demonstrating that the model can accurately capture the key features of the disease.
In contrast, for Non-FSCAD images, the model’s focus is more dispersed, with lower activation levels, and does not concentrate on specific lesion areas. This indicates that the model can effectively identify non-functionally significant lesions and exhibits a more uniform activation distribution in these images, consistent with the characteristics of Non-FSCAD.
Early detection is crucial in the prevention and treatment of cardiovascular diseases, but interpreting ultrasound images is a challenging task due to the complexity and heterogeneity of coronary features. Our proposed FSAM Transformer is better at capturing the spatial dependencies of regions and enhancing the model’s ability to capture complex features, which improves the classification performance of coronary images.
We have conducted extensive experiments, and the results show that our proposed FSAM Transformer outperforms the Swin Transformer model in terms of performance. Specifically, our method achieves 72.6%, 80%, and 0.73% in accuracy, recall, and AUC score, respectively. This represents a significant improvement compared to the Swin Transformer’s 69.3%, 78%, and 0.68%.
The FSAM approach we proposed has led to a significant improvement in the model’s classification performance. However, it is worth noting that, through a large number of experiments, we found that the introduction of multi-loop, multi-iterative attention computation increases the model’s complexity. This results in a significant decrease in inference and training speed, makes the model’s hyperparameters difficult to debug, and may lead to the loss of computational resources, among other issues. Nevertheless, we are actively exploring optimization methods and ways to simplify the training process in order to mitigate these limitations and achieve a more balanced trade-off between training efficiency and classification ability. Table 7 presents the computational efficiency of the models.

Our future work may involve applying the proposed method to other areas of medical image analysis, such as ultrasound breast cancer detection, brain tumor detection, and more. Additionally, we plan to further optimize this innovation to reduce the model’s complexity.
To perform a more comprehensive analysis and strengthen the robustness of our results, we plan to conduct further validation on additional datasets, which will include data from a broader group of patients. By introducing these changes to improve the generalization ability of our model, we aim for a more comprehensive assessment of the applicability of our approach, which will also bring new challenges.
We introduced the FSAM and applied it to the Swin Transformer to create a new model variant called the FSAM Transformer. This model is specifically tailored for diagnosing coronary heart disease using ultrasound images. Building upon the Swin Transformer’s inherent window self-attention mechanism and relative position coding, our approach enhances the model’s ability to extract and learn complex features deeply. Thorough evaluations of positive and negative ultrasound coronary image datasets underscore the effectiveness of our proposed method. Experimental validation demonstrates significant improvements in accuracy, recall, F1 score, precision, and AUC value compared to established benchmark models.
We emphasize our commitment to rigor through extensive experiments and careful comparisons. Notably, our FSAM transformer not only achieves state-of-the-art results in performance metrics, but also improves model identification performance. This helps practitioners and researchers gain deeper insights.
Acknowledgement: Not applicable.
Funding Statement: This study was supported by the National Natural Science Foundation of China (82071948, 82472003), Discovery Partners Institute and Shield of Illinois, Guangdong Natural Science Foundation (2022A1515011675) and the Scientific Research Fund for Hundred Talents Program Talent Introduction of Sun Yat-sen University (1320323001).
Author Contributions: Conceptualization, Guoqing Du, Yanhui Guo and Chunlai Du; Methodology, Yanhui Guo and Xin Gu; Software, Xin Gu and Yanhui Guo; Validation, Yanhui Guo and Guoqing Du; Investigation, Xin Gu, Siqi Guo, Ziwei Pang and Yi Du; Writing—original draft preparation, Xin Gu; Writing—review and editing, Yanhui Guo and Guoqing Du; Visualization, Xin Gu; Project administration, Guoqing Du, Yanhui Guo and Chunlai Du. All authors have read and agreed to the published version of the manuscript.
Availability of Data and Materials: The data sets presented in this study are available on request.
Ethics Approval: Ethical approval was obtained from the Ethics Committee of the Second Affiliated Hospital of Harbin Medical University. The approval reference number is sydwgzr2020-030. All data originated from patient studies approved by the Regional Committee for Medical Research Ethics and conducted according to the Helsinki Declaration. All procedures were carried out in strict accordance with the ethical guidelines set by the approving committee to ensure the protection of the rights and well-being of the human subjects involved in the study.
Conflicts of Interest: The authors declare no conflicts of interest to report regarding the present study.
References
1. Cardiovascular Diseases [Internet]; 2024. [cited 2024 Sep 5]. Available from: https://www.who.int/news-room/fact-sheets/detail/cardiovascular-diseases-(cvds). [Google Scholar]
2. Tenajas R, Miraut D, Illana CI, Alonso-Gonzalez R, Arias-Valcayo F, Herraiz JL. Recent advances in artificial intelligence-assisted ultrasound scanning. Appl Sci. 2023;13(6):3693. doi:10.3390/app13063693. [Google Scholar] [CrossRef]
3. Usmani UA, Happone A, Watada J. Enhancing medical diagnosis through deep learning and machine learning approaches in image analysis. Springer Sci Bus Media Dtschl GmbH. 2024;825:449–68. doi:10.1007/978-3-031-47718-8. [Google Scholar] [CrossRef]
4. Liu S, Wang Y, Yang X, Lei B, Liu L, Li SX, et al. Deep learning in medical ultrasound analysis: a review. Engineering. 2019;5(2):261–75. doi:10.1016/j.eng.2018.11.020. [Google Scholar] [CrossRef]
5. van Leeuwen KG, Schalekamp S, Rutten MJ, van Ginneken B, de Rooij M. Artificial intelligence in radiology: 100 commercially available products and their scientific evidence. Europeanradiology. 2021;31(6):3797–804. doi:10.1007/s00330-021-07892-z. [Google Scholar] [PubMed] [CrossRef]
6. Smistad E, Ostvik A, Salte IM, Leclerc S, Bernard O, Lovstakken L. Fully automatic real-time ejection fraction and MAPSE measurements in 2D echocardiography using deep neural networks. In: IEEE International Ultrasonics Symposium (IUS); 2018 Oct 22–25; Kobe, Japan. [Google Scholar]
7. Sengupta PP, Huang YM, Bansal M, Ashrafi A, Fisher M, Shameer K, et al. Cognitive machine-learning algorithm for cardiac imaging: a pilot study for differentiating constrictive pericarditis from restrictive cardiomyopathy. Circ Cardiovasc Imaging. 2016;9(6):e004330. doi:10.1161/CIRCIMAGING.115.004330. [Google Scholar] [PubMed] [CrossRef]
8. Madani A, Arnaout R, Mofrad M, Arnaout R. Fast and accurate view classification of echocardiograms using deep learning. npj Digital Med. 2018;1(1):1–8. doi:10.1038/s41746-017-0013-1. [Google Scholar] [PubMed] [CrossRef]
9. Arsanjani R, Dey D, Khachatryan T, Shalev A, Hayes SW, Fish M, et al. Prediction of revascularization after myocardial perfusion SPECT by machine learning in a large population. J Nucl Cardiol. 2015;22(5):877–84. doi:10.1007/s12350-014-0027-x. [Google Scholar] [PubMed] [CrossRef]
10. Motwani M, Dey D, Berman DS, Germano G, Achenbach S, Al-Mallah MH, et al. Machine learning for pre-diction of all-cause mortality in patients with suspected coronaryartery disease: a 5-year multicentre prospective registry analysis. Eur Heart J. 2017;38(7):500–7. doi:10.1093/eurheartj/ehw188. [Google Scholar] [PubMed] [CrossRef]
11. Khamis H, Zurakhov G, Azar V, Raz A, Friedman Z, Adam D. Automatic apical view classification of echocardiograms using a discriminative learning dictionary. Med Image Anal. 2017;36:15–21. doi:10.1016/j.media.2016.10.007. [Google Scholar] [PubMed] [CrossRef]
12. Dezaki FT, Dhungel N, Abdi AH, Luong C, Tsang T, Jue J, et al. Deep residual recurrent neural networks for characterisation of cardiac cycle phase from echocardiograms. In: Proceedings of Deep Learning in Medical Image Analysis and Multimodal Learning for Clinical Decision Support: DLMIA and ML-CDS 2017; 2017 Sep 14; Québec City, QC, Canada. p. 100–8. [Google Scholar]
13. Kong B, Zhan Y, Shin M, Denny T, Zhang S. Recognizing end-diastole and end-systole frames via deep temporal regression network. In: Medical Image Computing and Computer-Assisted Intervention-MICCAI 2016: 19th International Conference; 2016 Oct 17–21; Athens, Greece. p. 264–72. [Google Scholar]
14. He F, Liu T, Tao D. Why resnet works? Residuals generalize. IEEE Trans Neural Netw Learn Syst. 2020;31(12):5349–62. doi:10.1109/TNNLS.2020.2966319. [Google Scholar] [PubMed] [CrossRef]
15. Qin C, Chen L, Cai Z, Liu M, Jin L. Long short-term memory with activation on gradient. Neural Netw. 2023;164(2):135–45. doi:10.1016/j.neunet.2023.04.026. [Google Scholar] [PubMed] [CrossRef]
16. Dezaki FT, Liao Z, Luong C, Girgis H, Dhungel N, Abdi AH, et al. Cardiac phase detection in echocardiograms with densely gated recurrent neural networks and global extrema loss. IEEE Trans Med Imaging. 2018;38(8):1821–32. doi:10.1109/TMI.2018.2888807. [Google Scholar] [PubMed] [CrossRef]
17. Fiorito AM, Ostvik A, Smistad E, Leclerc S, Bernard O, Lovstakken L. Detection of cardiac events in echocardiography using 3D convolutional recurrent neural networks. In: 2018 IEEE International Ultrasonics Symposium (IUS); 2018 Oct 22–25; Kobe, Japan. [Google Scholar]
18. Lane ES, Azarmehr N, Jevsikov J, Howard JP, Shun-Shin MJ, Cole GD, et al. Multibeat echocardiographic phase detection using deep neural networks. Comput Biol Med. 2021;133(13):104373. doi:10.1016/j.compbiomed.2021.104373. [Google Scholar] [PubMed] [CrossRef]
19. Sofka M, Milletari F, Jia J, Rothberg A. Fully convolutional regression network for accurate detection of measurement points. In: Cardoso MJ, Arbel T, Carneiro G, Syeda-Mahmood T, Tavares JMRS, Moradi M, editor. Deep learning in medical image analysis and multimodal learning for clinical decision support. Cham, Switzerland: Springer; 2017. p. 258–66. [Google Scholar]
20. Østvik A, Smistad E, Aase SA, Haugen BO, Lovstakken L. Real-time standard view classification in transthoracic echocardiography using convolutional neural networks. Ultrasound Med Biol. 2019;45(2):374–84. doi:10.1016/j.ultrasmedbio.2018.07.024. [Google Scholar] [PubMed] [CrossRef]
21. Lei Ba J, Kiros JR, Hinton GE. Layer normalization. arXiv:1607.06450. 2016. [Google Scholar]
22. Liu Z, Lin Y, Cao Y, Hu H, Wei Y, Zhang Z, et al. Swin transformer: hierarchical vision transformer using shifted windows. In: Proceedings of the IEEE/CVF International Conference on Computer Vision; 2021 Oct 11–17; Montreal, BC, Canada. p. 9992–10002. [Google Scholar]
23. He K, Zhang X, Ren S, Sun J. Deep residual learning for image recognition. In: Proceedings of the IEEE Conference on Computer Vision and Pattern Recognition; 2016 Jun 27–30; Las Vegas, NV, USA. p. 770–8. [Google Scholar]
24. Radosavovic I, Kosaraju RP, Girshick R, He K, Dollár P. Designing network design spaces. In: Proceedings of the IEEE/CVF Conference on Computer Vision and Pattern Recognition; 2020 Jun 13–19; Seattle, WA, USA. p. 10425–33. [Google Scholar]
25. Howard A, Sandler M, Chu G, Chen LC, Chen B, Tan M, et al. Searching for MobileNetV3. In: Proceedings of the IEEE/CVF International Conference on Computer Vision; 2019 Oct 27–Nov 2; Seoul, Republic of Korea. p. 1314–24. [Google Scholar]
26. Tan M, Le Q. EfficientNetV2: smaller models and faster training. In: International Conference on Machine Learning; 2021 Jul 18–24. p. 10096–106. [Google Scholar]
27. Liu Z, Mao H, Wu CY, Feichtenhofer C, Darrell T, Xie S. A convnet for the 2020s. In: Proceedings of the IEEE/CVF Conference on Computer Vision and Pattern Recognition; 2022 Jun 18–24; New Orleans, LA, USA. p. 11966–76. [Google Scholar]
28. Tan M, Le Q. Efficientnet: rethinking model scaling for convolutional neural networks. In: Proceedings of International Conference on Machine Learning; 2019 Jun 9–15; Long Beach, CA, USA. p. 6105–14. [Google Scholar]
29. Sandler M, Howard A, Zhu M, Zhmoginov A, Chen L-C. MobileNetV2: inverted residuals and linear bottlenecks. In: Proceedings of the IEEE Conference on Computer Vision and Pattern Recognition; 2018 Jun 18–23; Salt Lake City, UT, USA. p. 4510–20. [Google Scholar]
30. Szegedy C, Liu W, Jia Y, Sermanet P, Reed S, Anguelov D, et al. Going deeper with convolutions. In: Proceedings of the IEEE Conference on Computer Vision and Pattern Recognition; 2018 Jun 18–23; Salt Lake City, UT, USA. p. 1–9. [Google Scholar]
31. Simonyan K, Zisserman A. Very deep convolutional networks for large-scale image recognition. arXiv:1409.1556. 2014. [Google Scholar]
Cite This Article
 Copyright © 2025 The Author(s). Published by Tech Science Press.
This work is licensed under a Creative Commons Attribution 4.0 International License , which permits unrestricted use, distribution, and reproduction in any medium, provided the original work is properly cited.
 Downloads
 Citation Tools