
 Submit a Paper
 Propose a Special lssue
 Open Access
ARTICLE
DRG-DCC: A Driving Risk Gaming Based Distributed Congestion Control Method for C-V2X Technology
1 College of Computer Science, Chongqing University, Chongqing, 400044, China
2 School of Microelectronics and Communication Engineering, Chongqing University, Chongqing, 400044, China
* Corresponding Author: Lei Ye. Email:
(This article belongs to the Special Issue: Advanced Communication and Networking Technologies for Internet of Things and Internet of Vehicles)
Computers, Materials & Continua 2025, 83(2), 2059-2086. https://doi.org/10.32604/cmc.2025.060392
Received 31 October 2024; Accepted 12 February 2025; Issue published 16 April 2025
 View Full Text
 Download PDF
Abstract
Congestion control is an inherent challenge of V2X (Vehicle to Everything) technologies. Due to the use of a broadcasting mechanism, channel congestion becomes severe with the increase in vehicle density. The researchers suggested reducing the frequency of packet dissemination to relieve congestion, which caused a rise in road driving risk. Obviously, high-risk vehicles should be able to send messages timely to alarm surrounding vehicles. Therefore, packet dissemination frequency should be set according to the corresponding vehicle’s risk level, which is hard to evaluate. In this paper, a two-stage fuzzy inference model is constructed to evaluate a vehicle’s risk level, while a congestion control algorithm DRG-DCC (Driving Risk Game-Distributed Congestion Control) is proposed. Moreover, HPSO is employed to find optimal solutions. The simulation results show that the proposed method adjusts the transmission frequency based on driving risk, effectively striking a balance between transmission delay and channel busy rate.Keywords
Nomenclature
| 3GPP | The 3rd Generation Partnership Project |
| AI | Artificial Intelligence |
| ARD | Average Reception Delay |
| AT | Average Throughput |
| BSM | Basic Safety Message |
| CBR | Channel Busy Ratio |
| ConvLSTM | Convolutional Long and Short-Term Memory |
| C-V2X | Cellular Vehicle to Everything |
| DCC | Distributed Congestion Control |
| DRG-DCC | Driving Risk Game-Distributed Congestion Control |
| DRL | Deep Reinforcement Learning |
| eNB | evolved NodeB |
| GA | Genetic Algorithm |
| HPSO | Hybrid Particle Swarm Optimization |
| IoV | Internet of Vehicles |
| LTE-V2X | Long Term Evolution Vehicle to Everything |
| MCS | Modulation and Coding Scheme |
| NS3 | Network Simulator Version 3 |
| OBU | On-Board Unit |
| PC5 | Proximity Communication 5 |
| PDR | Packet Delivery Rate |
| PER | Packet Error Rate |
| PRR | Packet Reception Rate |
| PSO | Particle Swarm Optimization |
| Rel-14 | The 3rd Generation Partnership Project Release 14 |
| RMSE | Root Mean Square Error |
| SPS | Semi-Persistent Scheduling |
| SUMO | Simulation of Urban Mobility |
| TCP/IP | Transmission Control Protocol/Internet Protocol |
| UE | User Equipment |
| UT | User Terminal |
| V2I | Vehicle to Infrastructure |
| V2P | Vehicle to Pedestrians |
| V2V | Vehicle to Vehicle |
| V2X | Vehicle to Everything |
| WiFi | Wireless Fidelity |
| XGBoost | eXtreme Gradient Boosting |
Congestion control is crucial for achieving efficient and reliable cellular V2X (C-V2X) communication in high-density traffic environments. As the major technical standard, C-V2X employs a resource pool technique to reduce the congestion probability. In particular, the 3rd Generation Partnership Project (3GPP) C-V2X standard Release 14 (Rel-14) [1] provides guidance on congestion control based on channel busy ratio (CBR). In October 2020, a large-scale test done in the Songhong C-V2X demonstration area in Shanghai, China, proved the validity of the guidance congestion control algorithm provided by Rel-14.
C-V2X employs a distributed congestion control (DCC) mechanism [2], which is done based on participating nodes’ control by adjusting communication parameters such as transmission power, packet generation rate, and data throughput [3,4]. 3GPP Rel-14 suggested a packet generation rate-based method [5], which linearly adjusts packet dissemination frequency according to CBR.
However, various correlative factors, such as vehicle driving status, regional traffic conditions, inter-vehicle relationships, etc., affecting the demand for message dissemination are not simple linear relations but complex non-linear relations. When adjusting packet transmission frequency, potential safety issues should be avoided to ensure that high-risk vehicles in high-density areas can promptly disseminate warning messages to surrounding vehicles.
The congestion control mechanism must guarantee that the appropriate vehicle receives the correct message at the proper time. Finding an optimal algorithm or parameter configuration for various congestion situations presents a challenging issue [6]. To achieve this, two major concerns are: 1) establishing the criteria for reasonable transmission priority determination and 2) ensuring the effectiveness of the decision-making approach.
The driving risk level holds significant implications for vehicle safety, and incorporating it as a parameter for transmission priority aids in prioritizing high-risk vehicle data within the traffic network. Current research on driving risk levels for vehicles primarily falls into two categories: single-factor and multi-factor evaluations of driving risk [7]. With the advancement of Internet of Vehicles (IoV) technologies and ongoing improvements in traffic data collection techniques within the “driver-vehicle-environment” domain, researchers are gradually shifting towards multi-factor approaches for evaluating driving risk [8,9]. We present a combined fuzzy inference model consisting of two stages, which is grounded in driving risk and integrates a ConvLSTM network for short-term driving risk prediction, thereby improving the reliability of the evaluation.
On the other hand, a distributed congestion control mechanism should take into account cooperative decision-making among vehicles. Artificial Intelligence (AI) based decision-making approaches are used to achieve enhanced and flexible congestion control strategy [2]. However, it has a relatively high computational complexity. Game theory is another viable approach to address congestion control issues, often applied to solve power control problems [10]. Drawing on principles of game theory, this study introduces a decentralized approach to congestion control, termed the Driving Risk Game-Distributed Congestion Control (DRG-DCC) algorithm, aimed at enhancing the efficiency of message dissemination.
This paper uses SUMO+NS3 joint simulation, and the experimental results show that the method proposed in our research can effectively alleviate network congestion and improve the communication performance between vehicles; at the same time, when the number of vehicles is large, it can still ensure the effectiveness and reliability of safety message propagation.
This paper is organized as follows. Related works are summarized in Section 2. Section 3 introduces congestion control methods in C-V2X. The Section 4 introduces the driving risk and establishes a fuzzy inference model for driving risk evaluation. In Section 5, we introduce the congestion control algorithm based on the driving risk gaming. Section 6 provides the experimental parameters, discusses the results obtained from the experiments, and validates the effectiveness of the DRG-DCC algorithm. Lastly, Section 7 presents the conclusions drawn from our research.
The selection of communication parameters and determining message priority are essential aspects of congestion control. In this section, we will analyze the related work from two aspects.
Distributed congestion control is primarily achieved by controlling physical layer parameters, such as transmission frequency and transmission power. Bazzi et al. [11] studied different congestion control methods under IEEE 802.11p and C-V2X. The results show that in IEEE 802.11 p, parameters such as transmission power, Modulation and Coding Scheme (MCS), and transmission frequency can be used to weigh the relationship between congestion and transmission range or delay. In C-V2X, congestion control methods based on transmission frequency are effective, while changes in others have minimal effect on congestion control. Therefore, in this paper, vehicle transmission frequency is taken as the research focus for C-V2X congestion control.
Deep reinforcement learning (DRL) has a wide range of applications in intelligent communication and the IoT [12,13]. Choi et al. [2] improved communication efficiency by controlling the use of channel resources through DRL methods. Literature [14] also applies DRL to optimize Packet Delivery Rate (PDR) and Packet Reception Rate (PRR), ensuring that Channel Busy Ratio (CBR) remains within a safe threshold, thereby improving network performance. Shao et al. [15] introduced DRL into spectrum sharing to address the network traffic issue. However, the above methods require a historical database, and the associated computation delay makes it difficult to meet the requirements of C-V2X applications.
Game-theoretic approaches achieve optimal strategies through Nash equilibrium and have relatively lower complexity. Hu et al. [16] proposed a congestion control method based on cooperative game theory, combined with an ant colony routing algorithm to optimize congestion issues in data transmission. Kalita et al. [17] employ a non-cooperative game approach to calculate the optimal transmission probability of nodes, thereby reducing congestion. Liu et al. [18] reduced network congestion by making transmission rates between distributed senders close to coordinated through a game theoretic approach. Amer et al. [19] proposed a non-cooperative game method that designed a utility function based on contention delay, vehicle priority, and data transmission frequency. They adjusted the transmission frequency by solving the model to address the channel congestion problem in vehicular ad hoc networks.
In this paper, we draw on the principles of non-cooperative game theory to propose a congestion control method based on driving risk gaming. By adaptively adjusting vehicle transmission frequencies, it aims to alleviate channel congestion and enhance the reliability of vehicular network communications.
The transmission priority is determined based on the importance of the message. Relying solely on communication evaluation metrics to adjust parameters is insufficient to meet the practical application needs of C-V2X. It is essential to incorporate more driving and road information for message assessment. In our study, the driving risk level is a key parameter for establishing transmission priority. Therefore, the issue of determining transmission priority can be transformed into the problem of evaluating driving risk.
Driving risk is determined by a combination of factors, including the vehicle, the road, and the driver [8]. Kodithwakku et al. [9] analyzed the severity of road traffic accidents in Sri Lanka. They demonstrated a significant correlation between factors such as road conditions, environment, vehicle characteristics with driving risk. However, these factors are characterized by non-linearity, time-varying, and uncertainty, which pose a significant challenge to driving risk evaluation.
Zheng et al. [20] conducted a comprehensive analysis of vehicle status, driving environment, road type, and weather conditions and established a near-collision database for driving risk analysis. They use the K-means clustering method to classify the driving risk. Shi et al. [21] proposed a real-time risk evaluation model that combines deep learning with XGBoost, using continuous driving data for collision detection.
As fuzzy theory has advanced, the fuzzy comprehensive evaluation method has likewise evolved and been utilized in the assessment of driving risks. In [7], a fuzzy inference system is used to predict the accident rate on rural highways. The fuzzy comprehensive evaluation method can reveal the relationships between variables and flexibly handle the complex and dynamic traffic environment. A driving risk assessment model was developed by Zhu et al. [22] utilizing fuzzy comprehensive evaluation and hierarchical analysis, grounded in a thorough examination of the ”human-vehicle-environment” factors.
In view of this, this study presents a combinatorial fuzzy inference approach for assessing driving risk. In addition, a ConvLSTM network is utilized to achieve short-term road risk prediction to meet the demands for congestion control.
3 Congestion Control Methods in C-V2X
The leading technologies of vehicle-mounted ad hoc networks include Dedicated Short-Range Communications (DSRC) and C-V2X. Before the rise of C-V2X, DSRC dominated the field. However, its underlying technology based on the IEEE 802.11p protocol was limited by transmission distance and transmission power and was not suitable for long-distance communication. Additionally, the high deployment costs of DSRC have hindered large-scale commercial adoption. In contrast, C-V2X, as an extension of LTE technology, leverages the widespread coverage and high utilization of cellular networks, offering a broader communication range [23]. Our research revolves around C-V2X, focusing on the key topic of congestion control.
The network infrastructure of C-V2X is shown in Fig. 1.
Figure 1: C-V2X network infrastructure
In the 3rd Generation Partnership Project Release 14, two modes for allocating communication resources are identified: mode 3 and mode 4. Additionally, a resource pool is utilized to enable resource sharing.
However, all of the current C-V2X box vendors employ Mode 4, which allows the On-Board Unit (OBU) to access communication resources through a distributed scheduling protocol known as Semi-Persistent Scheduling (SPS) based on Sensing. Therefore, our study will focus exclusively on C-V2X mode 4.
Sensing-based SPS incorporates the idea of resource pooling, utilizing two sliding windows: a sensing window and a resource selection window, as illustrated in Fig. 2.
Figure 2: Subchannel selection based on SPS
The length of the sensing window is set at 1000 ms. Throughout the sensing interval, the User Terminal (UT) detects the resource’s occupancy and creates a table representing the state of resource occupancy.
The protocol can be divided into three parts: sensing window, trigger resource selection/reselection, and resource selection window. Trigger resource selection/reselection refers to the time point when SPS is actively allocated or reassigned due to code rate changes or expiration of SPS resources that have been reserved for allocation. In the sensing window, UT will continuously detect the transmission from other users. At the trigger point, use the perception window before the trigger point to detect the resource occupancy status and select the available resources in the later selection window. The upper bound of the resource selection window is the delay limit of the current transmission load after the trigger time point, and the lower bound is the User Equipment (UE) implementation process delay decision. If there are available resource (
3.2 Congestion Control Method in Rel-14
In Rel-14, it is said that higher CBR is usually measured when more UE transmits more V2X messages in a given channel. Distributed congestion control can adjust the transmission parameters of each UE according to CBR. More concretely, Rel-14 recommends a congestion control method for conventional BSM messages based on vehicle density, as shown in Fig. 3. Corresponding parameters are listed in Table 1.
Figure 3: The relationship between VPERSubInterval, vPERInterval and vTxRateCntrlInt
It is essential to mention that upon concluding the vTxRateCntrlInt interval, the overall count of vehicles within a 100 m radius circle is assessed. In other words, the calculation of vehicle density takes place. Subsequently, a congestion control algorithm is presented, which modifies the transmission interval based on the local vehicle density. It is shown as Eq. (1).
Here,
According to Rel-14, the transmission interval varies from 20 ms to 1 s. Considering the actual application situation, in this paper, the range of transmission interval is set as [100 ms, 500 ms]. Then Eq. (1) is reconstructed as:
where
As mentioned earlier, although the density-based congestion control method could reduce congestion probability, it also leads to a degradation of message dissemination performance, thus decreasing road safety. Hence, in this paper, we introduce a congestion control factor corresponding to vehicle status to prevent high-risk vehicles from being unable to send messages in a timely manner.
The congestion control mechanism must guarantee that the appropriate vehicle receives the correct message at the proper time. We used driving risk as a congestion control factor to measure the importance of messages and use it as a criterion for adjusting communication parameters.
Considering driving risk as a congestion control factor, we proposed a Driving Risk Game-Distributed Congestion Control (DRG-DCC) algorithm based on Nash equilibrium.
The system framework of DRG-DCC proposed in this paper includes driving risk evaluation and prediction, game model establishment, and Hybrid Particle Swarm Optimization (HPSO) algorithm, as shown in Fig. 4.
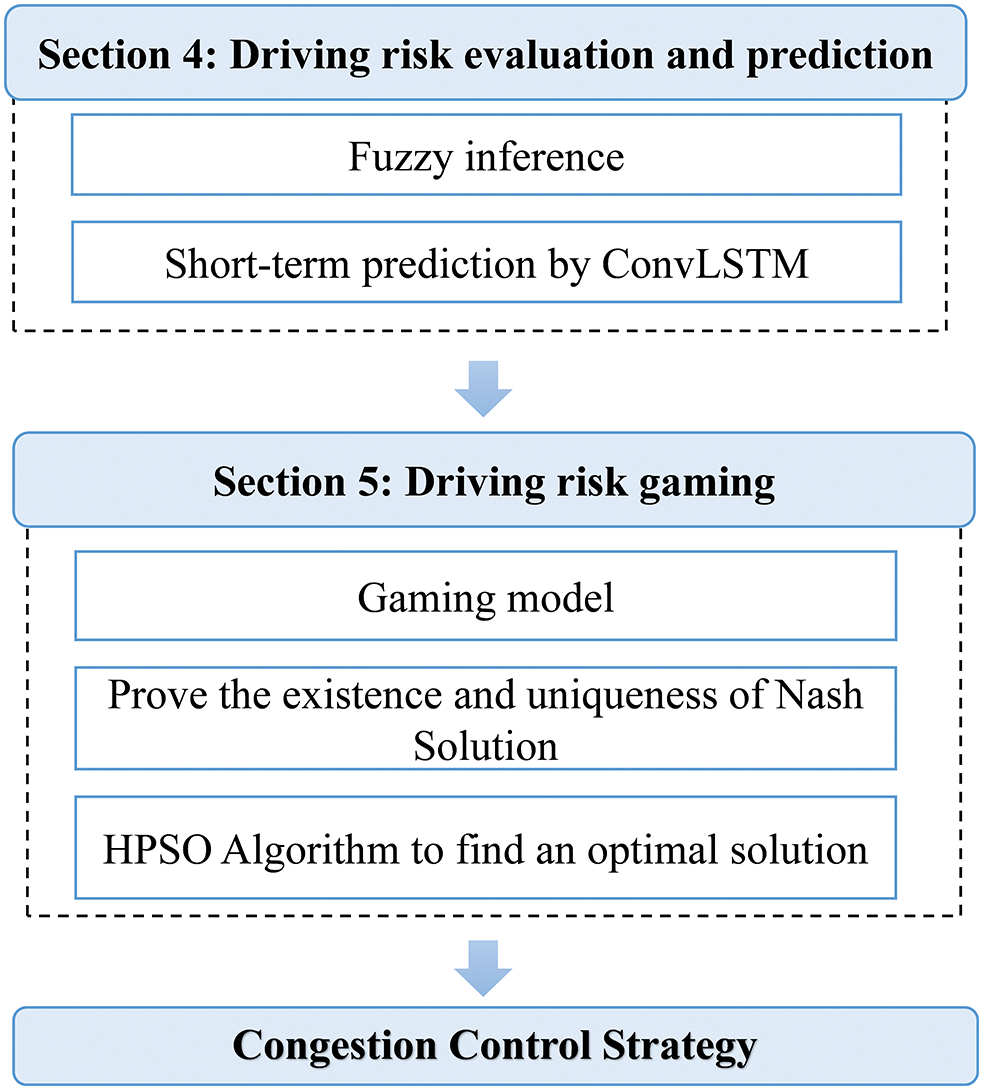
Figure 4: The structure of DRG-DCC
Firstly, the driving risk is quantified by fuzzy inference as the standard for evaluating regional risk. Considering the time delay defects caused by real-time evaluation, DRG-DCC selects the ConvLSTM model that conforms to the characteristics of traffic flow time-space series for short-term prediction. More details are given in the Section 4.
In the game model, the utility function is used to measure the benefits of transmission frequency and driving risk for vehicles. This paper also proves that the constructed game model has Nash equilibrium. Finally, the HPSO algorithm searches the game model’s solution space to obtain the vehicle’s equilibrium strategy. More details are provided in Section 5.
4 Fuzzy Inference Based Driving Risk Evaluation and Prediction
Taking into account the complexity of influencing factors, our study utilizes a two-stage fuzzy inference model to evaluate driving risk. In the first stage of the fuzzy inference model, we select three factors as inputs: driver, vehicle, and environment.
4.1 Fuzzy Inference Model for Driving Risk Evaluation
In general, driving risk evaluation faces two main difficulties. One is the rationality and usability of index factors, and the other is the method of evaluation.
Driving risk is influenced by a large number of factors, and some can be collected while others cannot. Therefore, in practical application, driving risk should be evaluated on the basis of collectible data. In this paper, we categorize the index factors into three categories: driver factor, vehicle factor, and environment factor, which correspond to
On the other hand, considering the risk level’s non-linearity, time-varying, and uncertain features, we continue to use the literature [22]’s method and propose a combined fuzzy inference model to evaluate driving risk.
The architecture of the fuzzy inference model is shown in Fig. 5, it illustrates that the suggested fuzzy inference model is comprised of two phases.
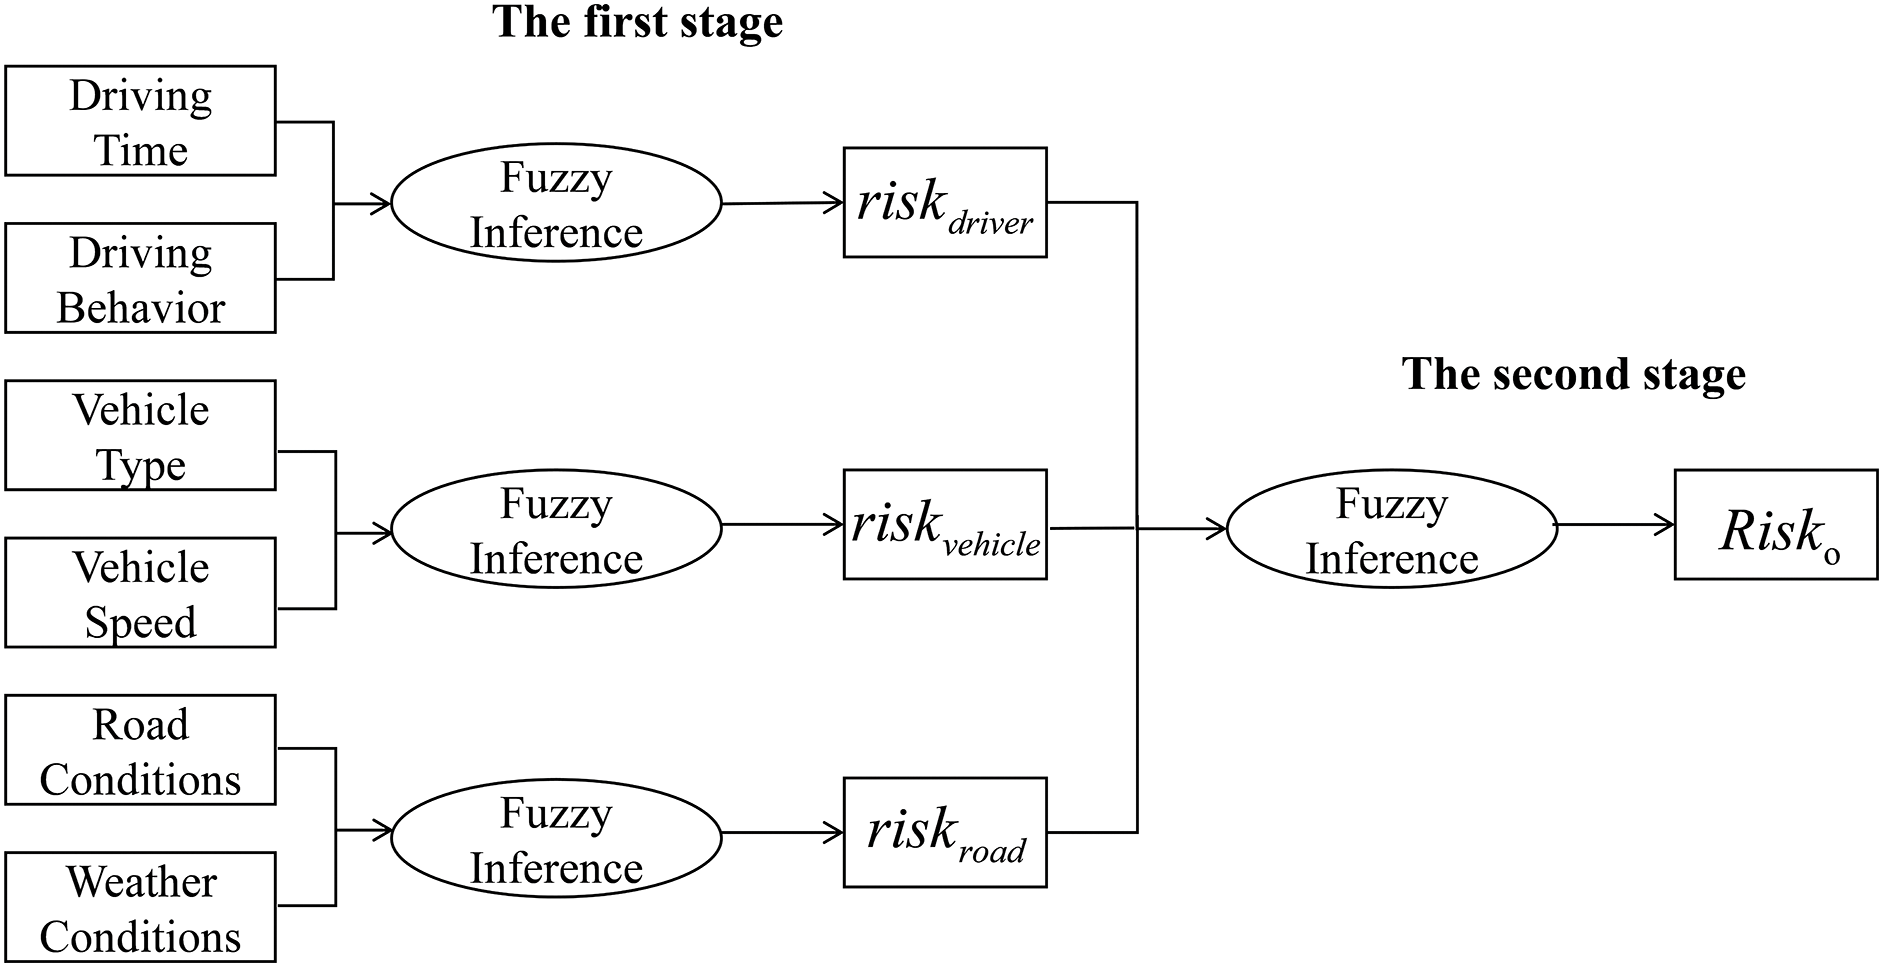
Figure 5: Schematic diagram of combined fuzzy inference
The first stage consists of three fuzzy inference modules designed to evaluate
The privacy of drivers can be protected while limiting public access. Consequently, the evaluation of
Here, we divide the fuzzy set of DT into three fuzzy linguistic variables: S, M, and B, with the universe being [0, 4]. The longer the driving duration, the larger the value mapped to the universe. The fuzzy set of DB is divided into three fuzzy linguistic values: S (normal), M (poor), and B (dangerous), with the universe being [0, 1]. These can be obtained through onboard devices, smartphone applications, etc.
The membership functions for DB, DT, and
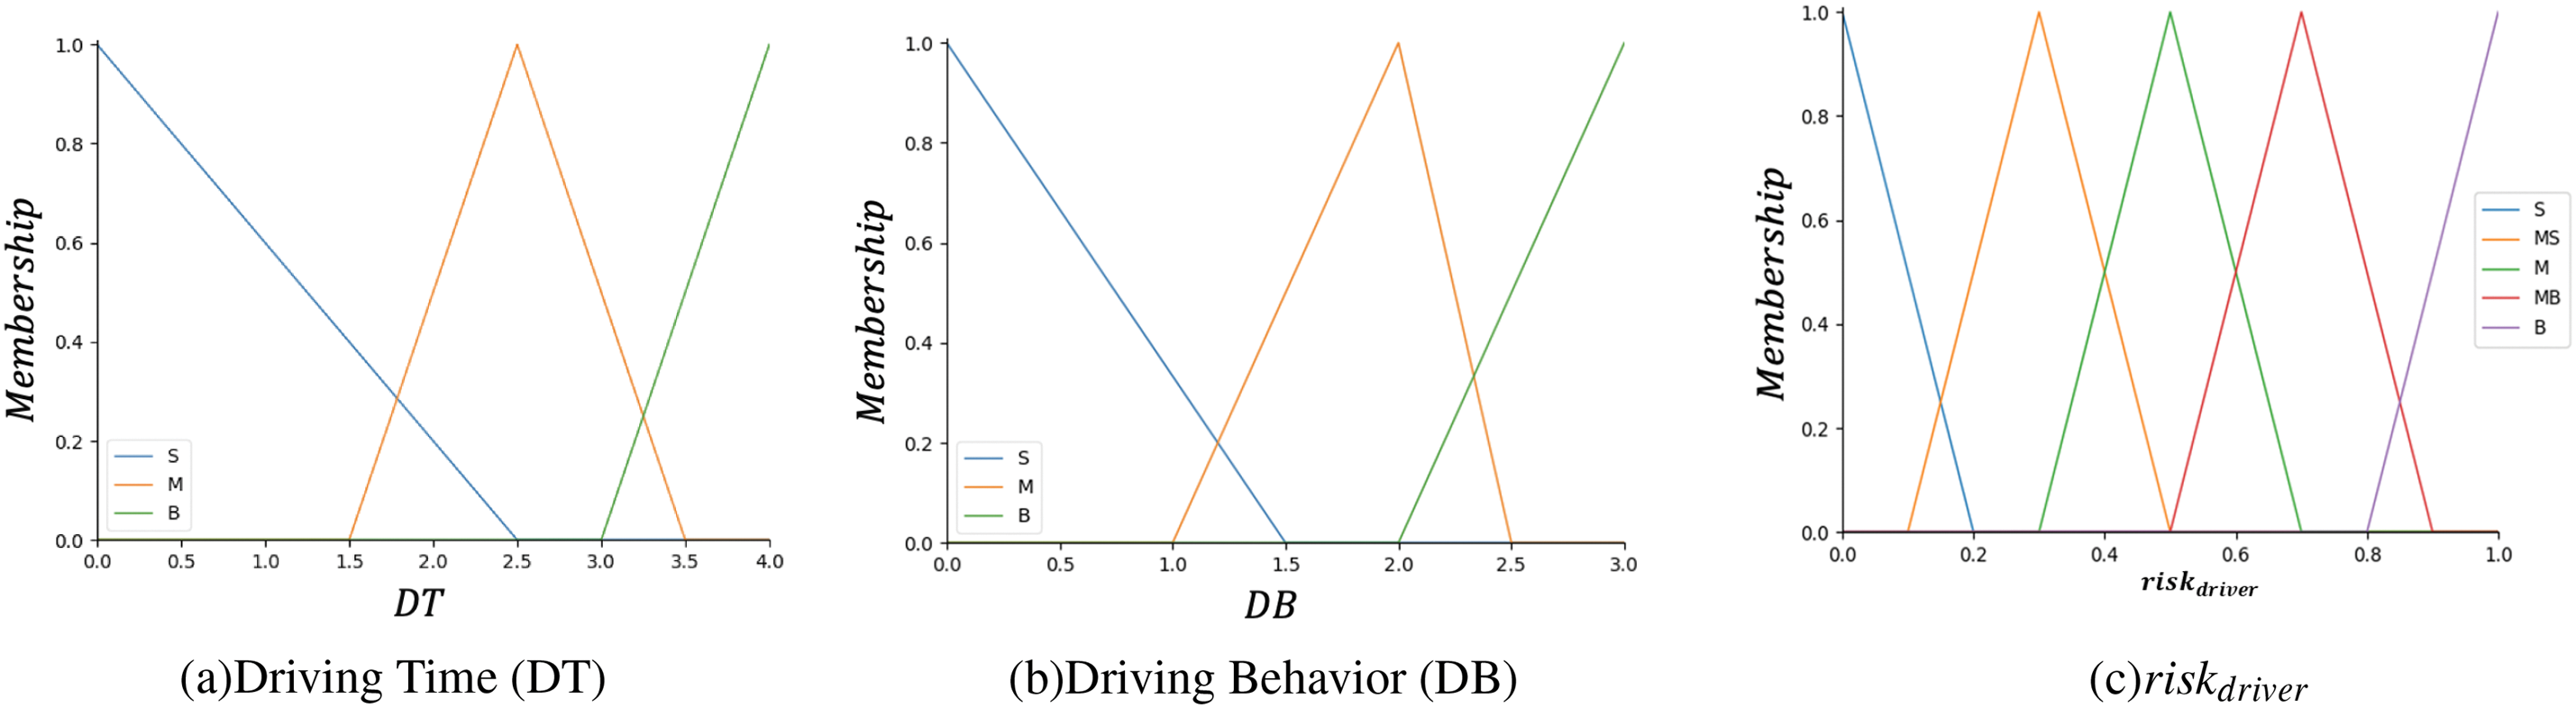
Figure 6: Membership function
The number of inference rules within a collection can be determined by taking the Cartesian product of membership sets and fuzzy linguistic variables. The relevant fuzzy inference rules for
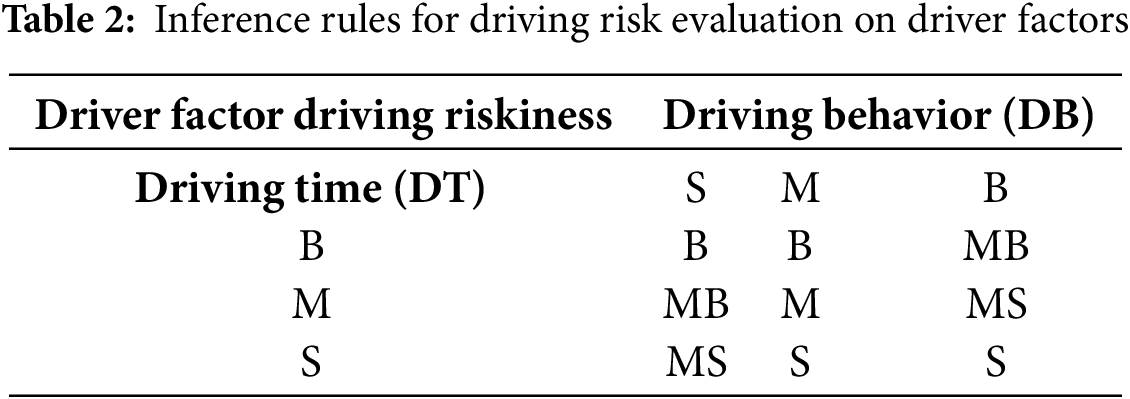
In this paper, we used the Mamdani model to perform fuzzy inference, as shown as follows:
For each rule,
Then, the results obtained from each inference are aggregated using
The centroid algorithm is employed in our study to remove fuzzy features while driving risk value associated with the driver, referred to as
In the Eq. (7), N represents the total number of points in the universe, and point
In road areas, different types of vehicles have varying impacts on driving safety [8,9]. Vehicle speed also has a significant effect on driving safety and is one of the leading causes of traffic accidents. A 5 km/h increase in speed can double the likelihood of a traffic accident [24]. In the module concerning vehicle risk, we choose vehicle type (VT) and vehicle speed (VS) as our input parameters.
Vehicle types can generally be categorized into four groups: cars accommodating fewer than seven passengers, small vans or passenger buses seating between 8 and 19 individuals, medium trucks or buses with a capacity exceeding 20 seats, and large trucks. Consequently, we classify the fuzzy set associated with VT into four fuzzy linguistic categories: S (small), M (medium), MB (medium to large), and B (large), with the range defined as [0, 40].
VS serves as another input for the driving risk assessment model concerning vehicle factors. The fuzzy set is divided into four linguistic values: Slow (S), Medium (M), Fast (MB), and Very Fast (B). Thus, the fuzzy set for the input linguistic variable VS is {S, M, MB, B}. The universe of discourse is defined as [20, 120], where larger values indicate a higher likelihood of driving risk at that speed.
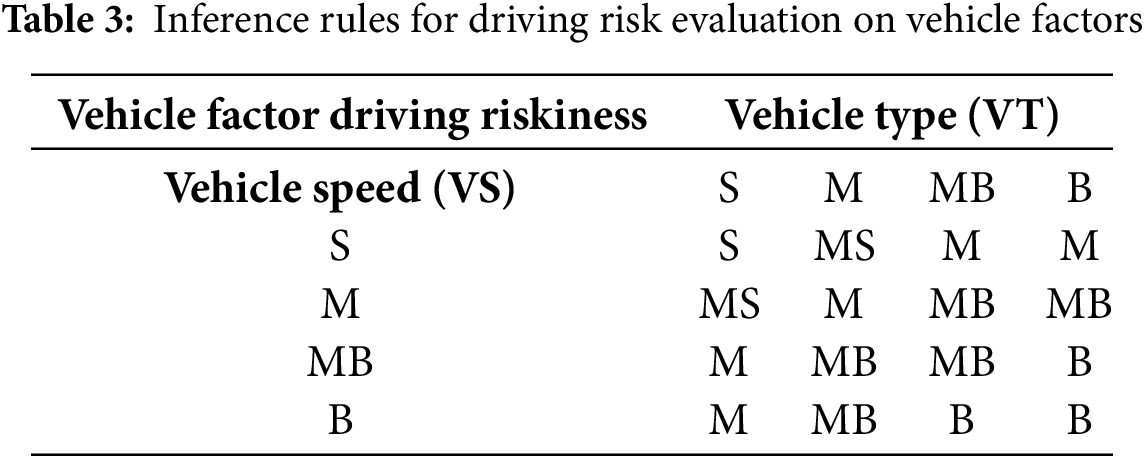
Triangular and trapezoidal membership functions are used to describe the input variables of vehicle speed and vehicle type, as shown in Fig. 7. The relevant fuzzy inference rule for
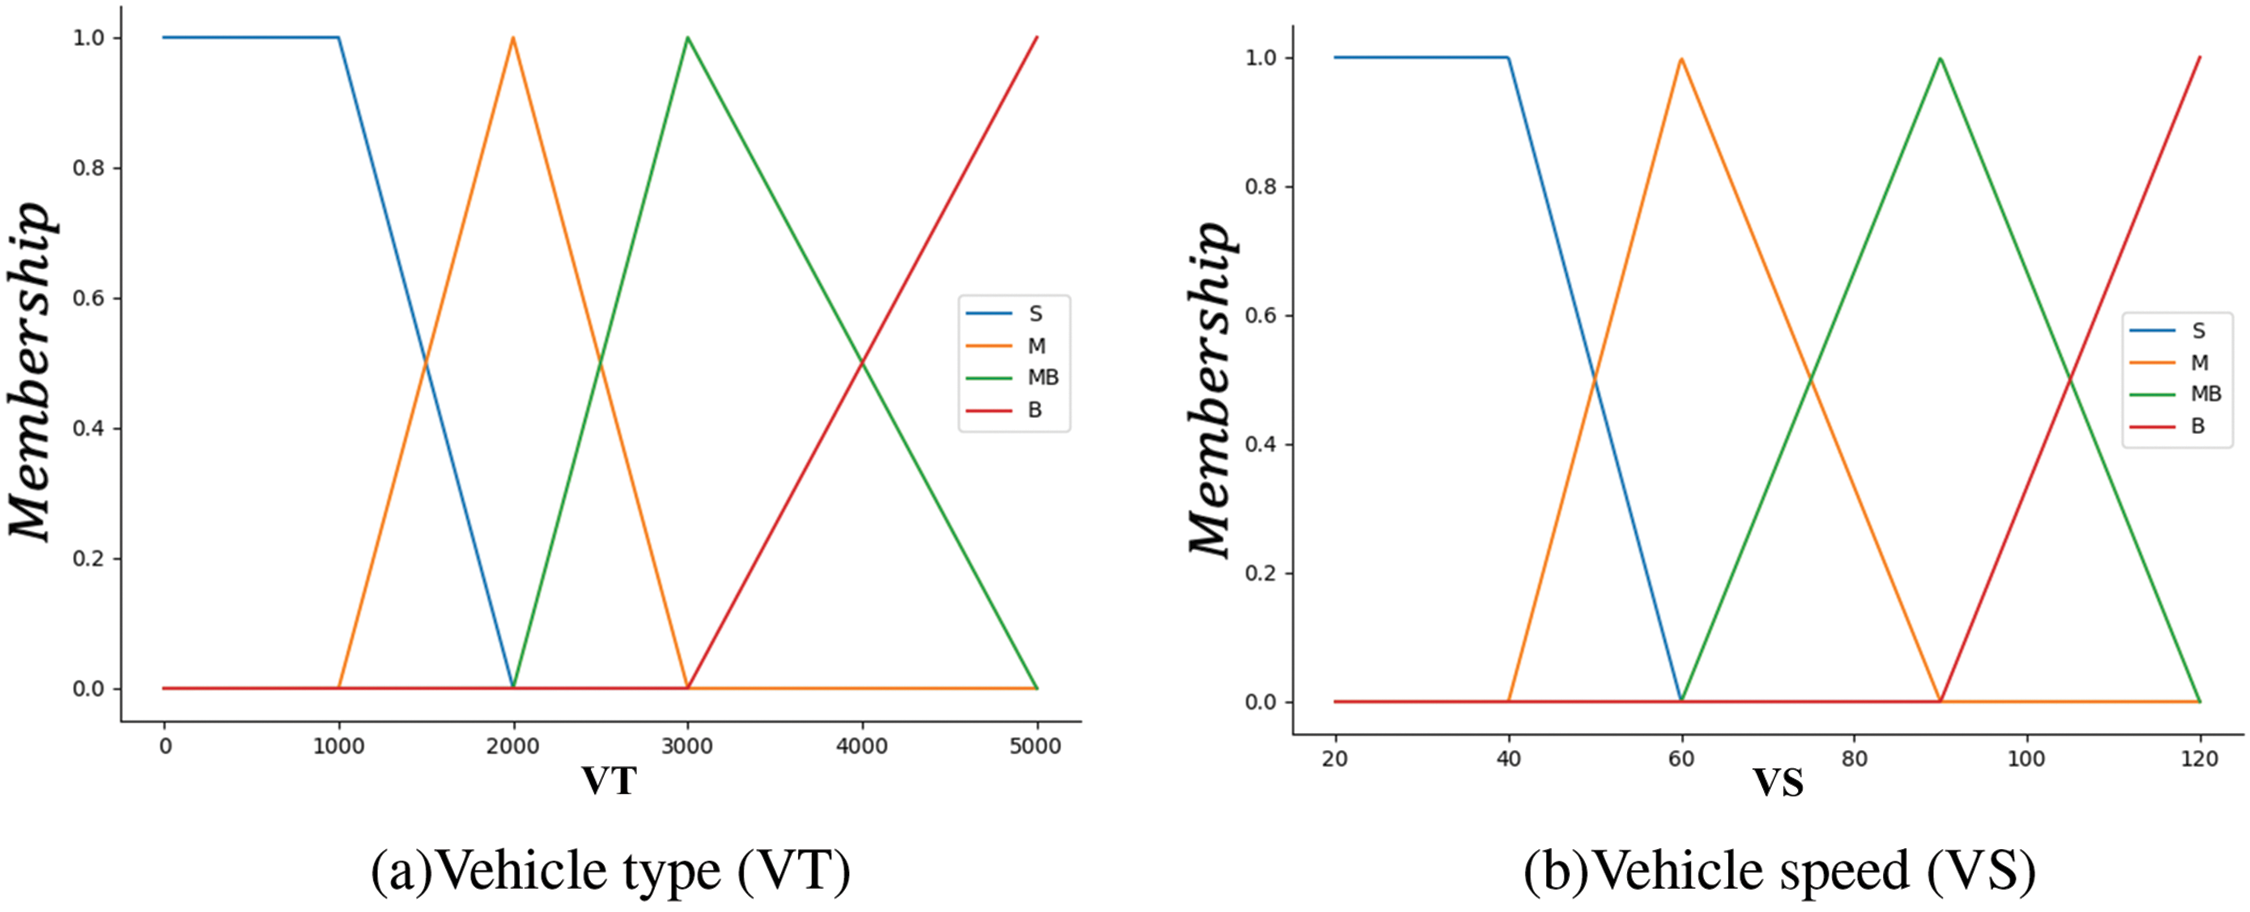
Figure 7: Membership functions of VT and VS
Similar to the calculation process of
In the environment risk module, we select road conditions and weather conditions as input variables.
The weather conditions are defined as an input linguistic variable with its fuzzy set as S, M, B, corresponding to sunny, cloudy, and snowy or rainy days, respectively. The universe is defined as [0, 30].
Similarly, the road conditions are also defined as an input linguistic variable with the fuzzy set defined as S, M, B based on the International Roughness Index, corresponding to poor, moderate, and good conditions, which can be measured by vehicles. The universe for this variable is defined as [0, 10].
The membership functions for weather and road are illustrated in Fig. 8. And the appropriate fuzzy inference rules for
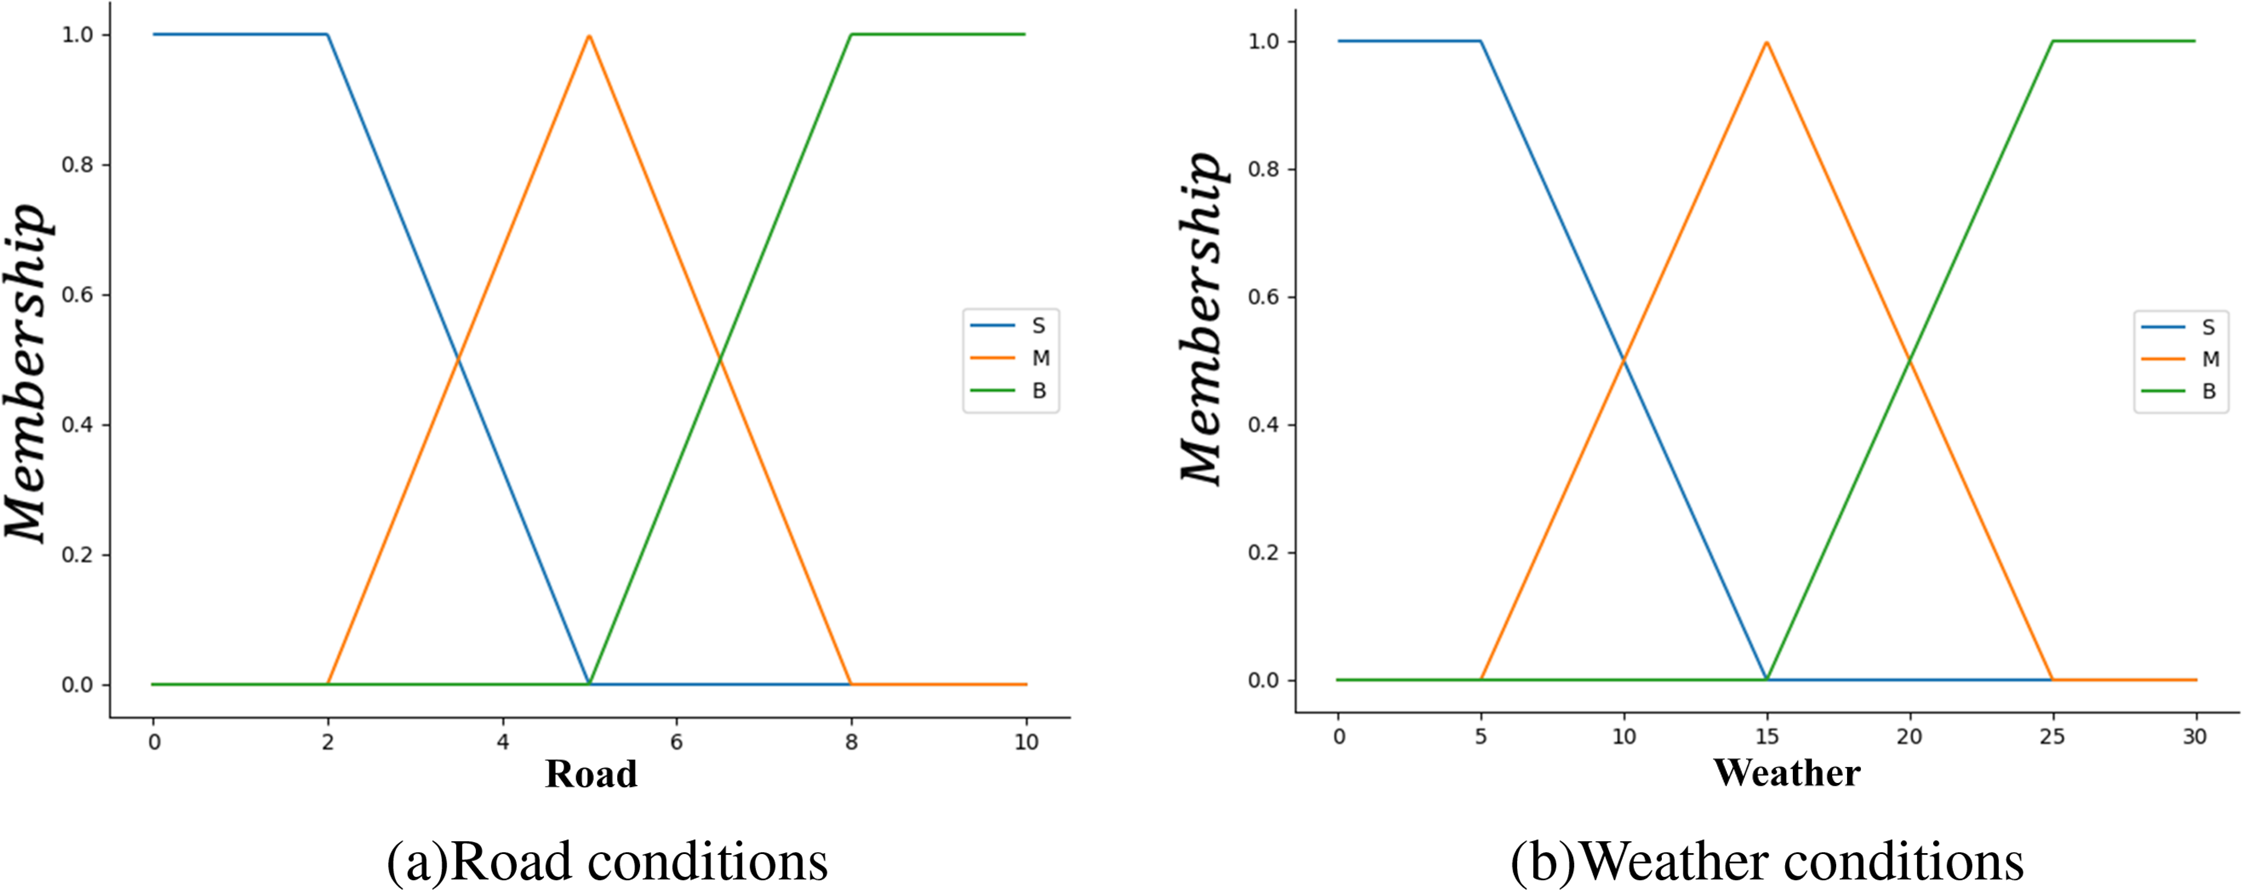
Figure 8: Membership functions of road and weather conditions
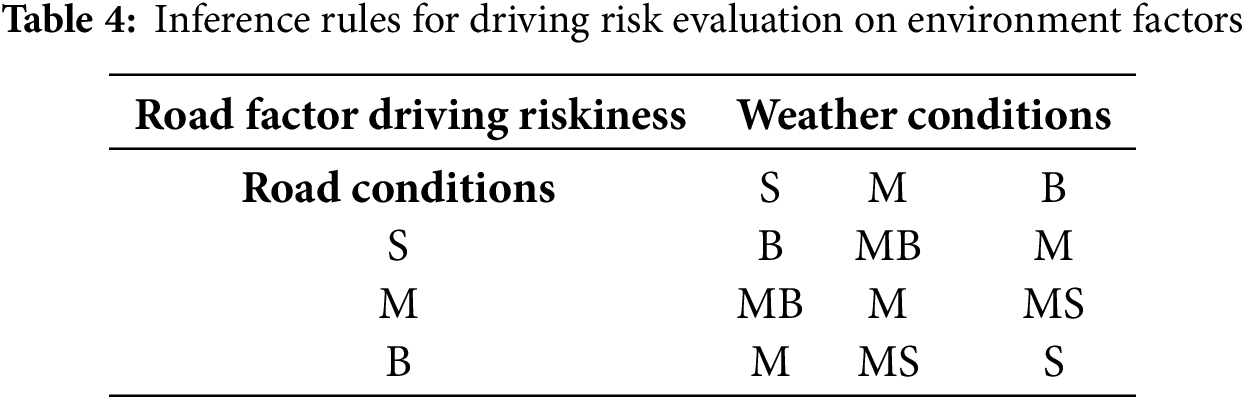
The process involved is similar to that of
The second stage performs fuzzy inference based on
In the first phase of our work, we successfully obtained the fuzzy sets for
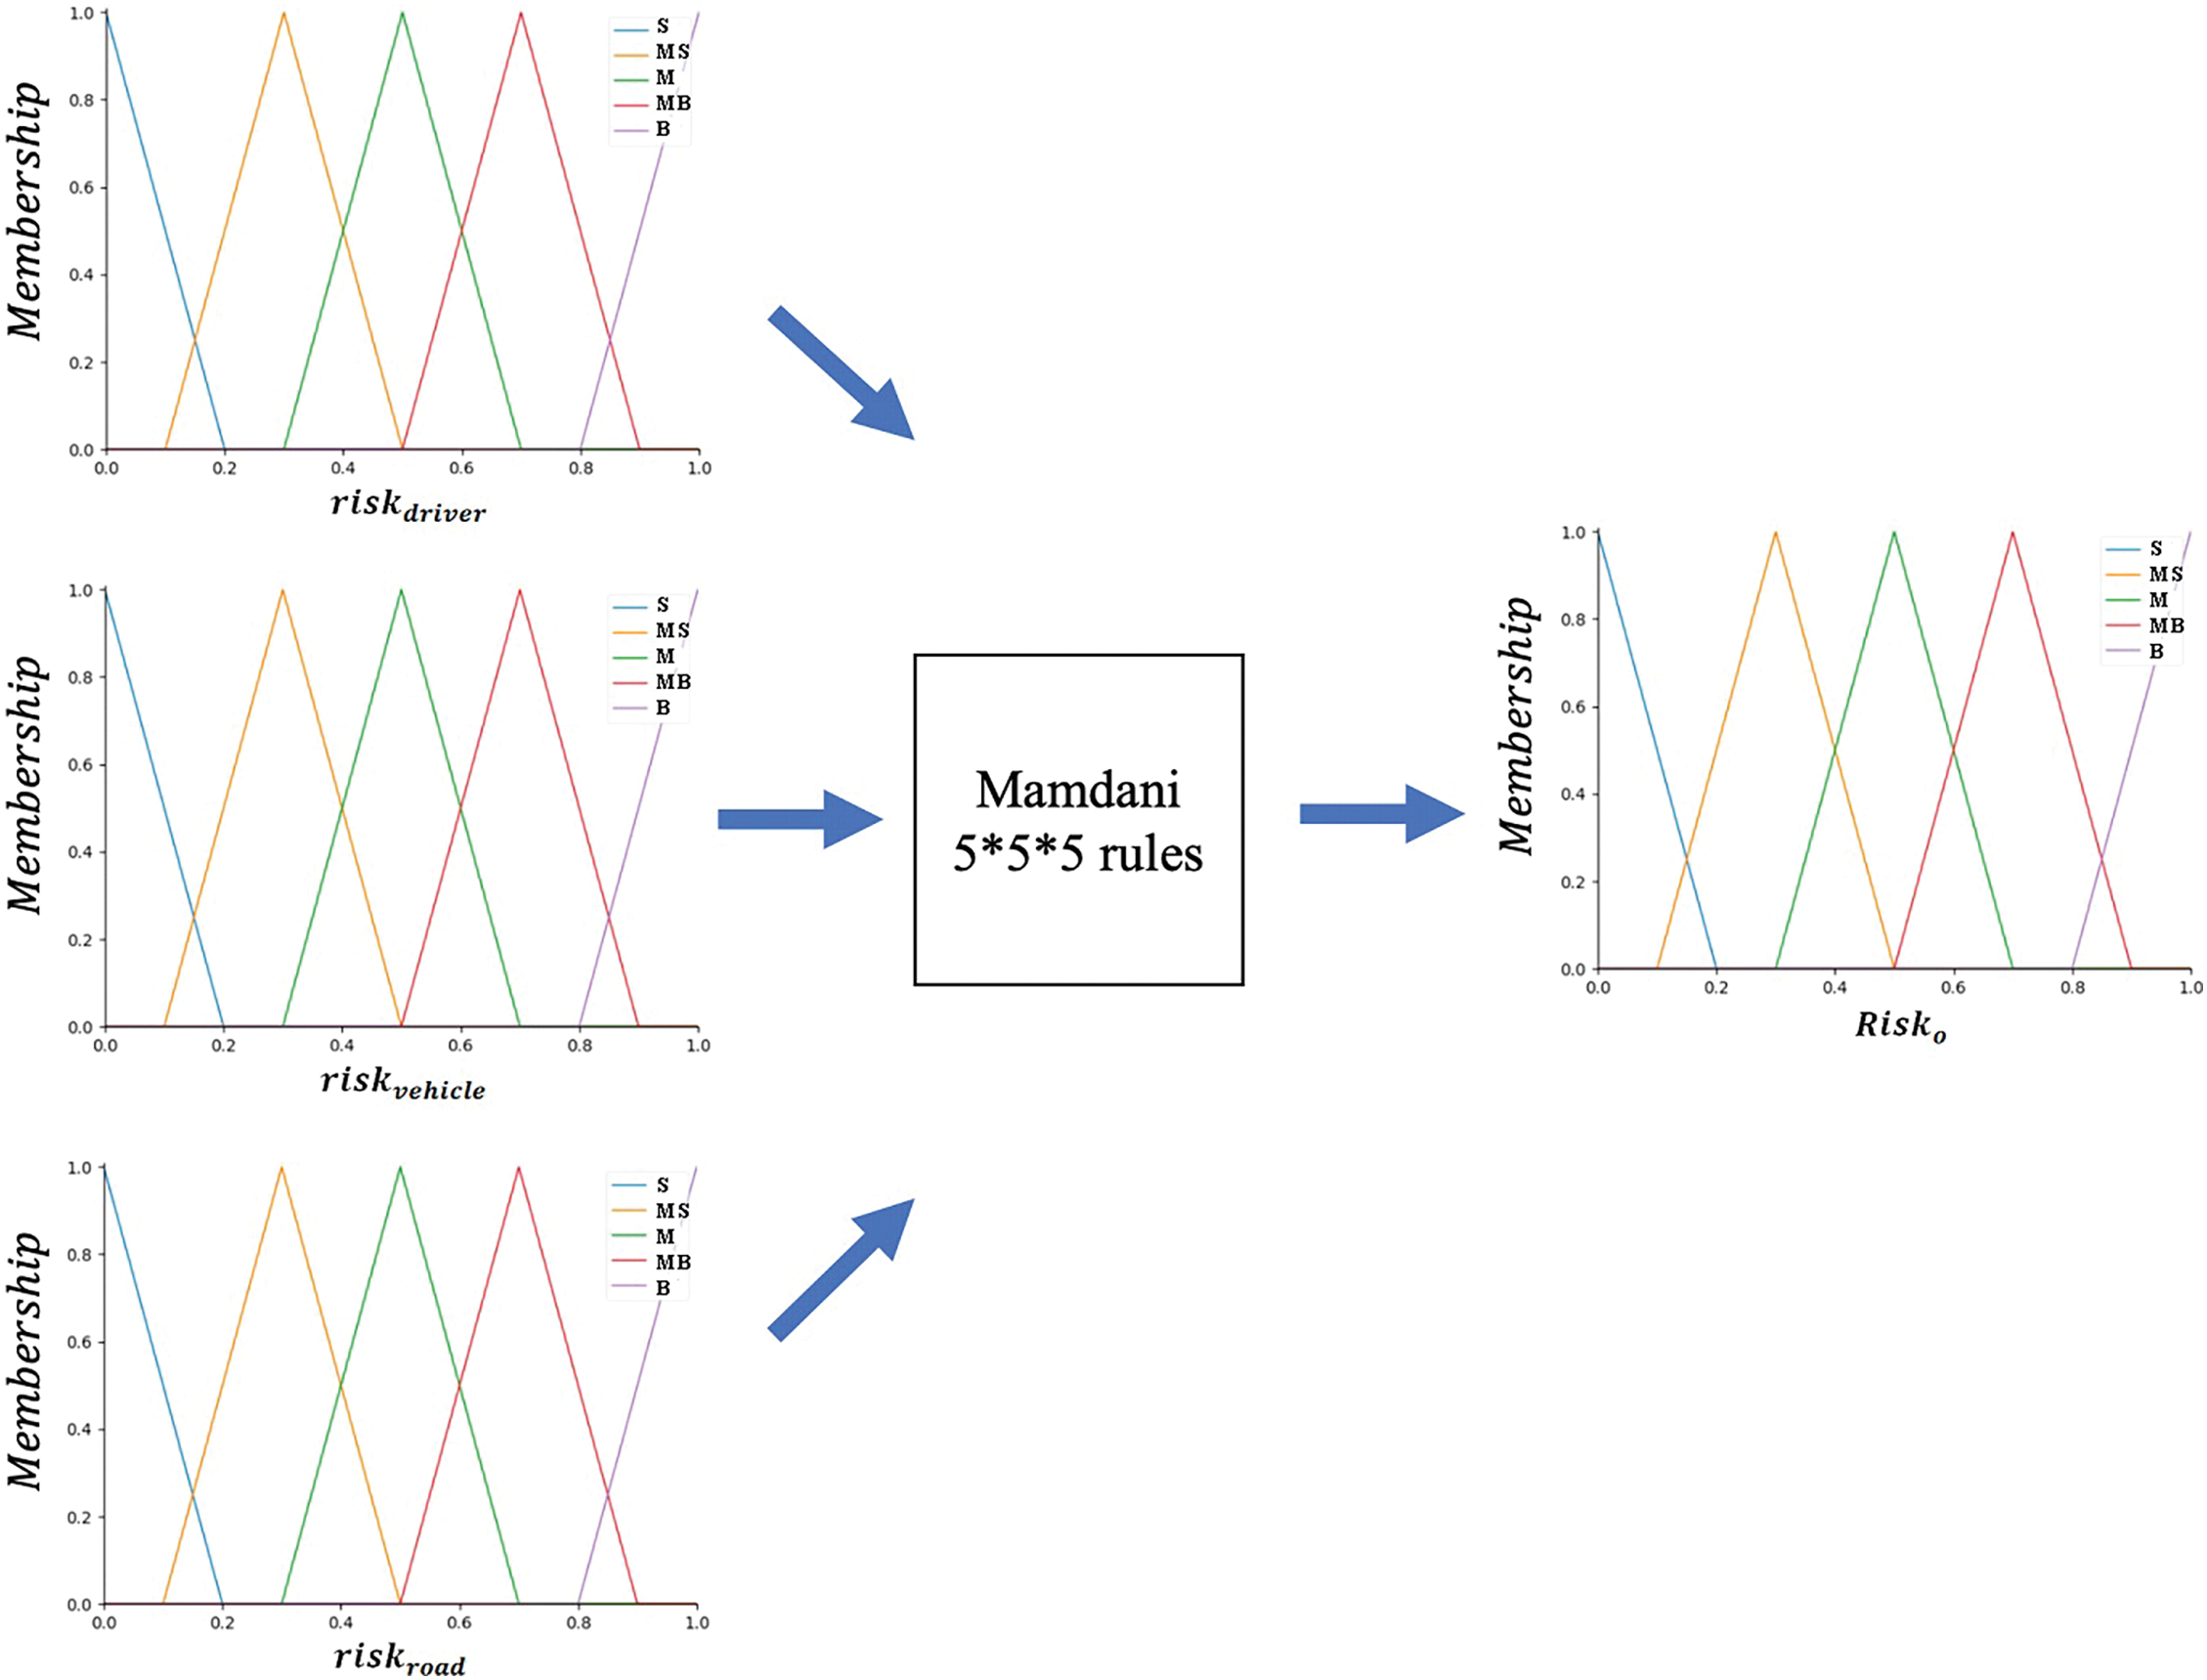
Figure 9: Combined fuzzy inference
Furthermore, the fuzzy inference rules that govern the relationships and interactions among these sets are detailed in Table 5.
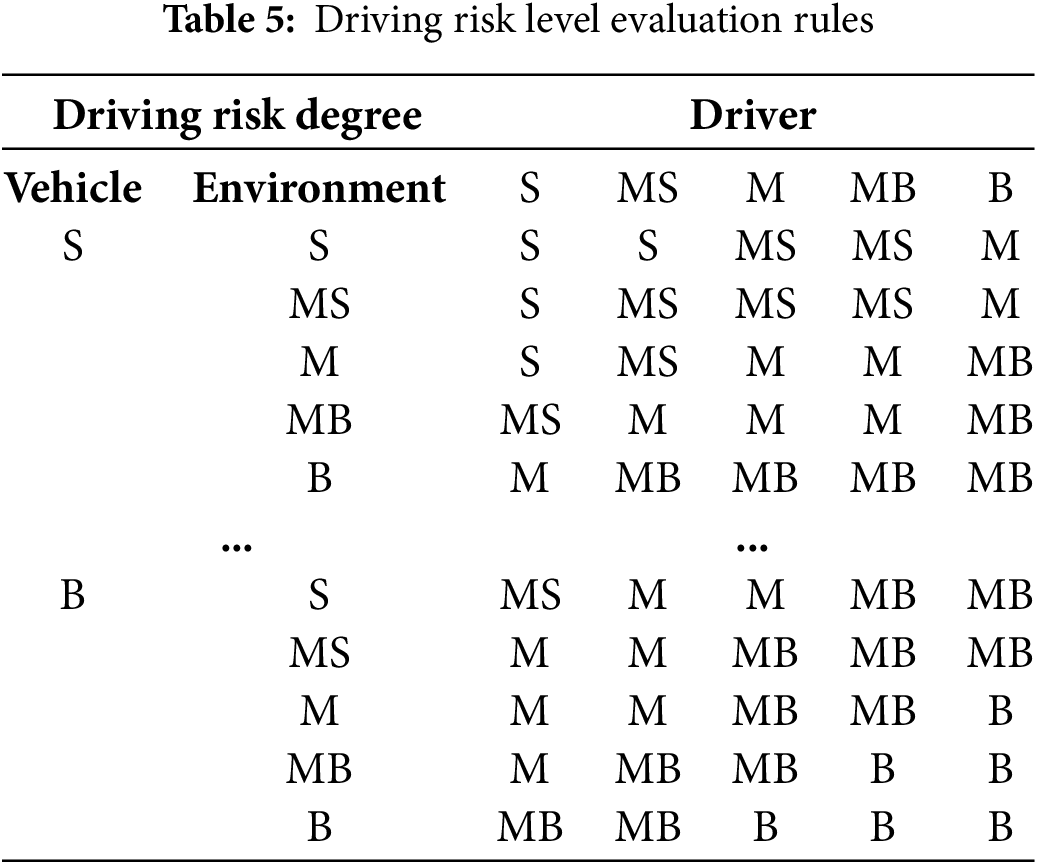
The corresponding process is as same as that of
If we consider N vehicles in the target area, the regional risk level at time
In our study, SUMO is utilized to generate traffic scenarios randomly, illustrated in Fig. 10a. Subsequently, the distribution characteristics of regional risk are evaluated, leading to the creation of the corresponding risk heat map for the traffic scenario, as displayed in Fig. 10b.
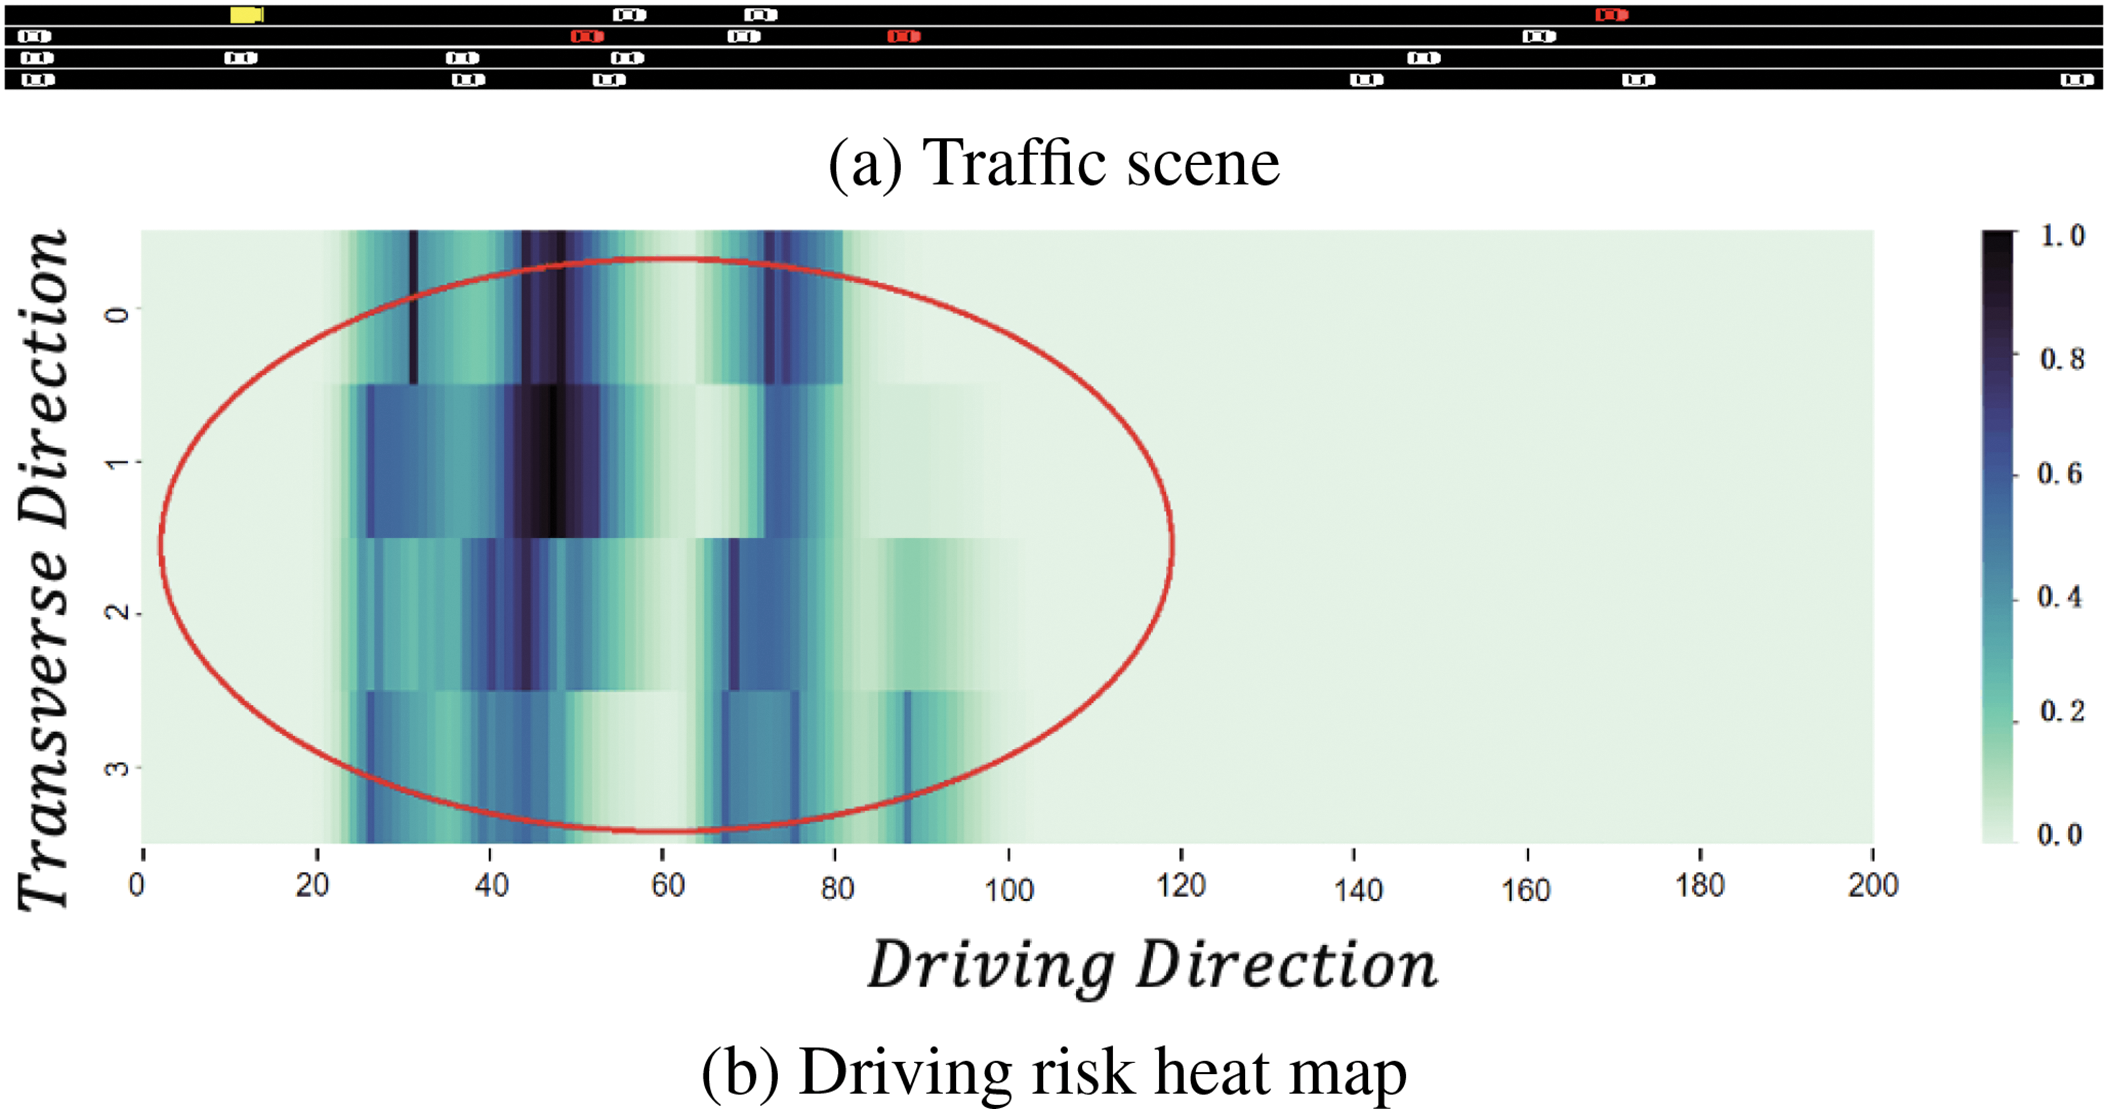
Figure 10: Combined fuzzy inference results
As depicted in Fig. 10, the highlighted region of the heat map is directly related to high-risk vehicles.
The value range of
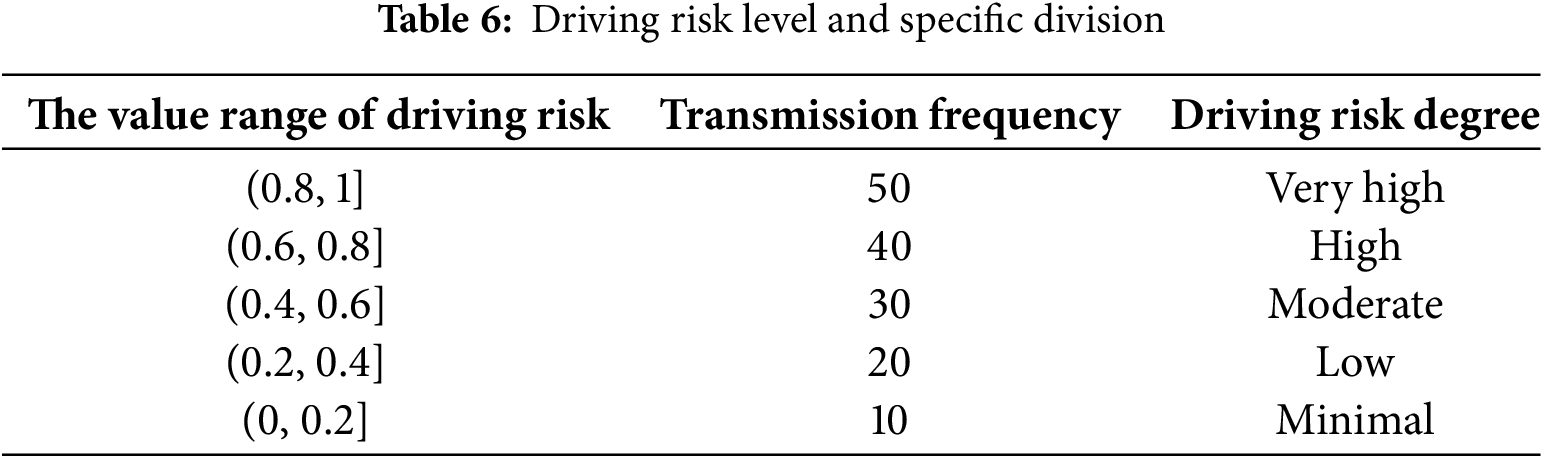
We consider vehicles with moderate or higher driving risk levels as high-risk vehicles.
4.2 Short-Term Driving Risk Prediction
The prioritization of message dissemination is crucial in the congestion control strategy. Driving risk is a complex interactive process that depends not only on the current driving conditions of the vehicle but also on the interactions with nearby vehicles [25]. In addition, the road traffic environment is characterized by diversity and uncertainty. The driving risk at the current moment cannot fully reflect the risk at the next moment, leading to inaccuracies in adjusting communication parameters. Therefore, the congestion control strategy needs to consider both the current risk factors and the expected risk factors in the future.
In this paper, we used the gravity model to calculate the interrelation between vehicles
Thus, the cumulative risk for vehicle
Next, the accumulative risk matrix for vehicles in the region at time
A convolutional long and short-term memory neural network (ConvLSTM) is utilized in this context for short-term risk prediction, as illustrated in Fig. 11. ConvLSTM combines the advantages of convolutional neural networks and long short-term memory networks, enabling it to process both temporal sequence data and spatial data simultaneously [26,27]. This aligns with the characteristics of road traffic and allows for more accurate capture of the spatiotemporal distribution changes in driving risk.
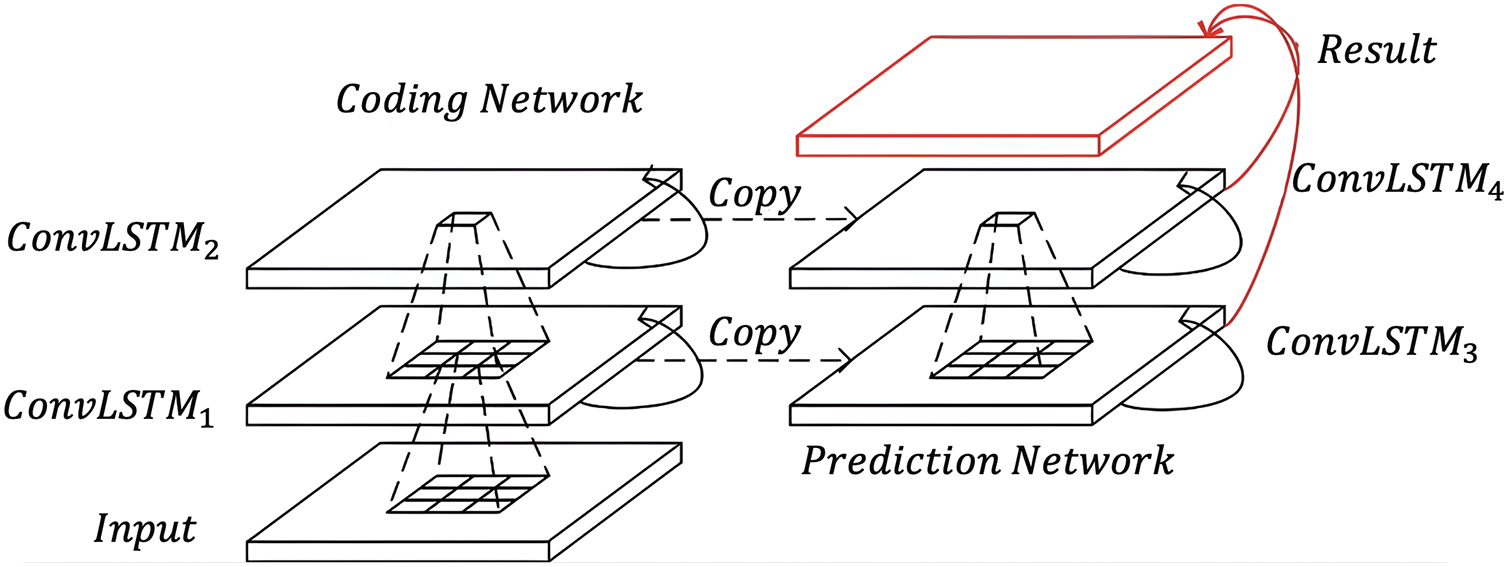
Figure 11: Structure diagram of driving risk prediction
The risk levels of vehicle
Here,
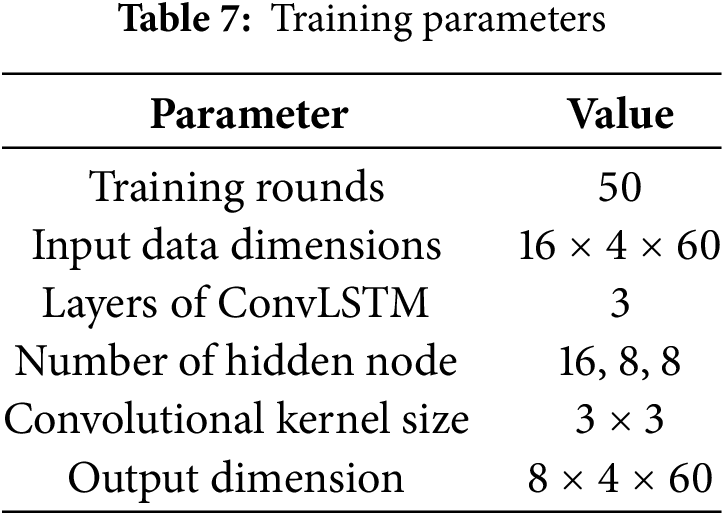
We used SUMO to generate a traffic scenario lasting ten hours, which serves as the basis for dataset D. The traffic scenario is divided into 3600 data pieces, with each data piece having a duration of 10 s. The train set, test set, and validation set consist of proportions of 70%, 15%, and 15%, respectively. Table 7 presents the training parameters.
During the 50 training rounds, the training loss curve of the ConvLSTM model, which uses root mean square error (RMSE) as the loss function, is shown in Fig. 12.
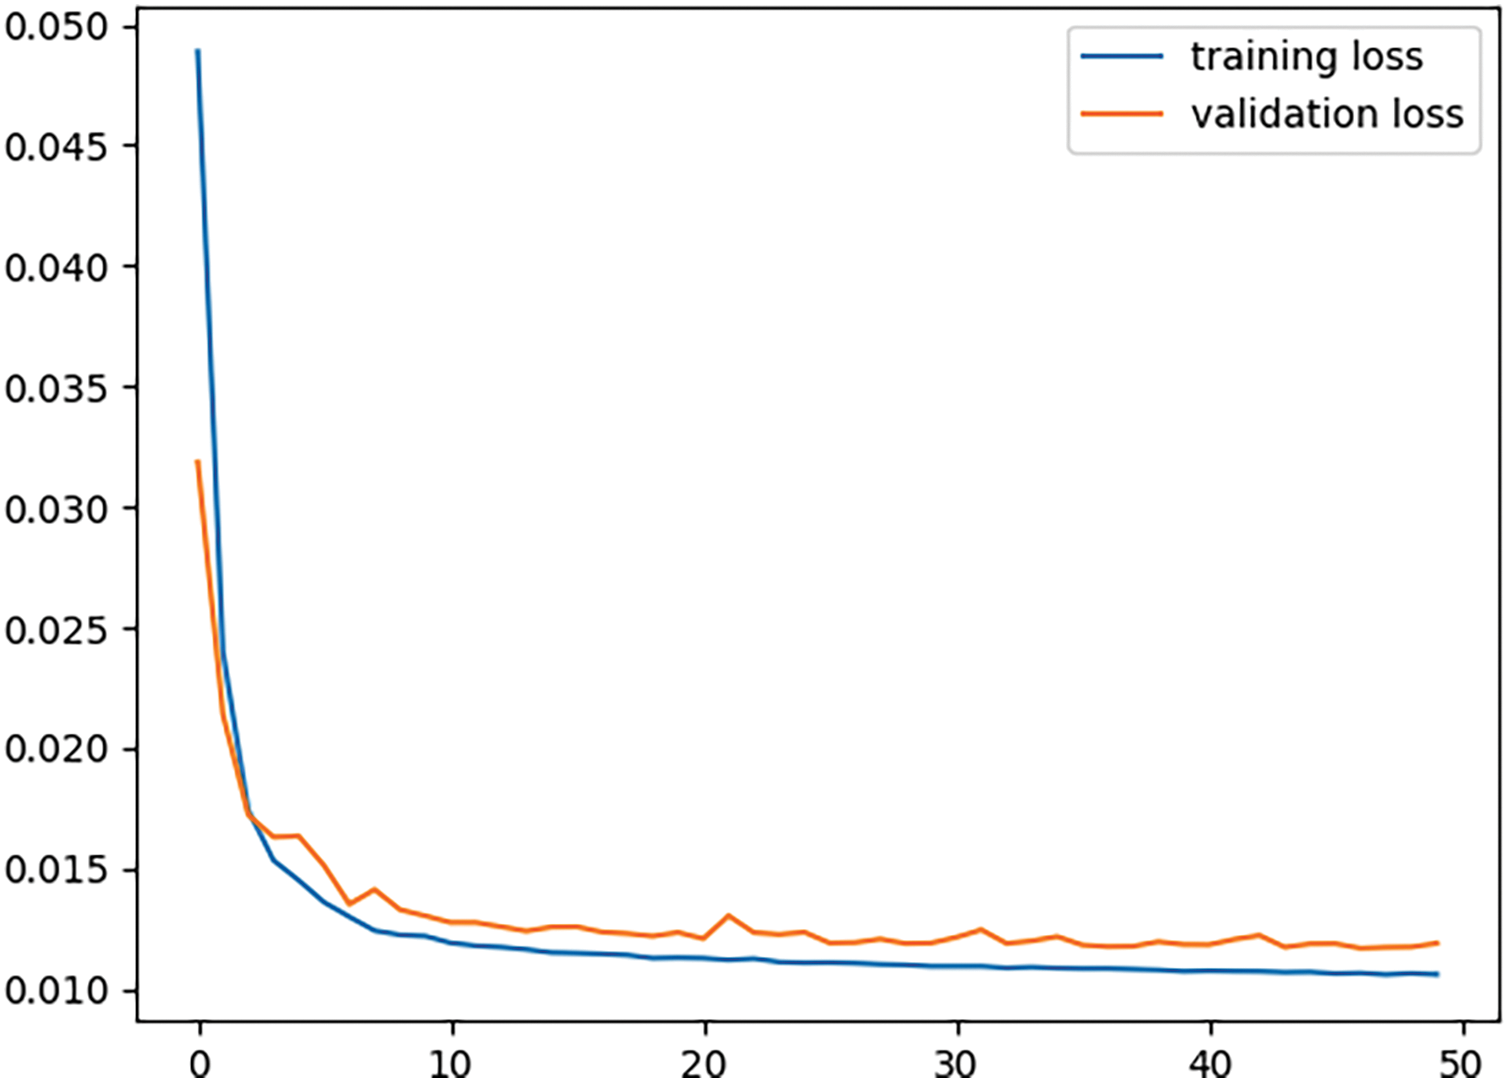
Figure 12: Loss curve of ConvLSTM model training
To conduct a comparative study, the actual simulation data and predicted data for the next 8 moments are used to construct driving risk heat maps, as shown in Fig. 13. It can be seen that the results obtained from the predictions are generally consistent with the actual simulation results, verifying the effectiveness of the model.
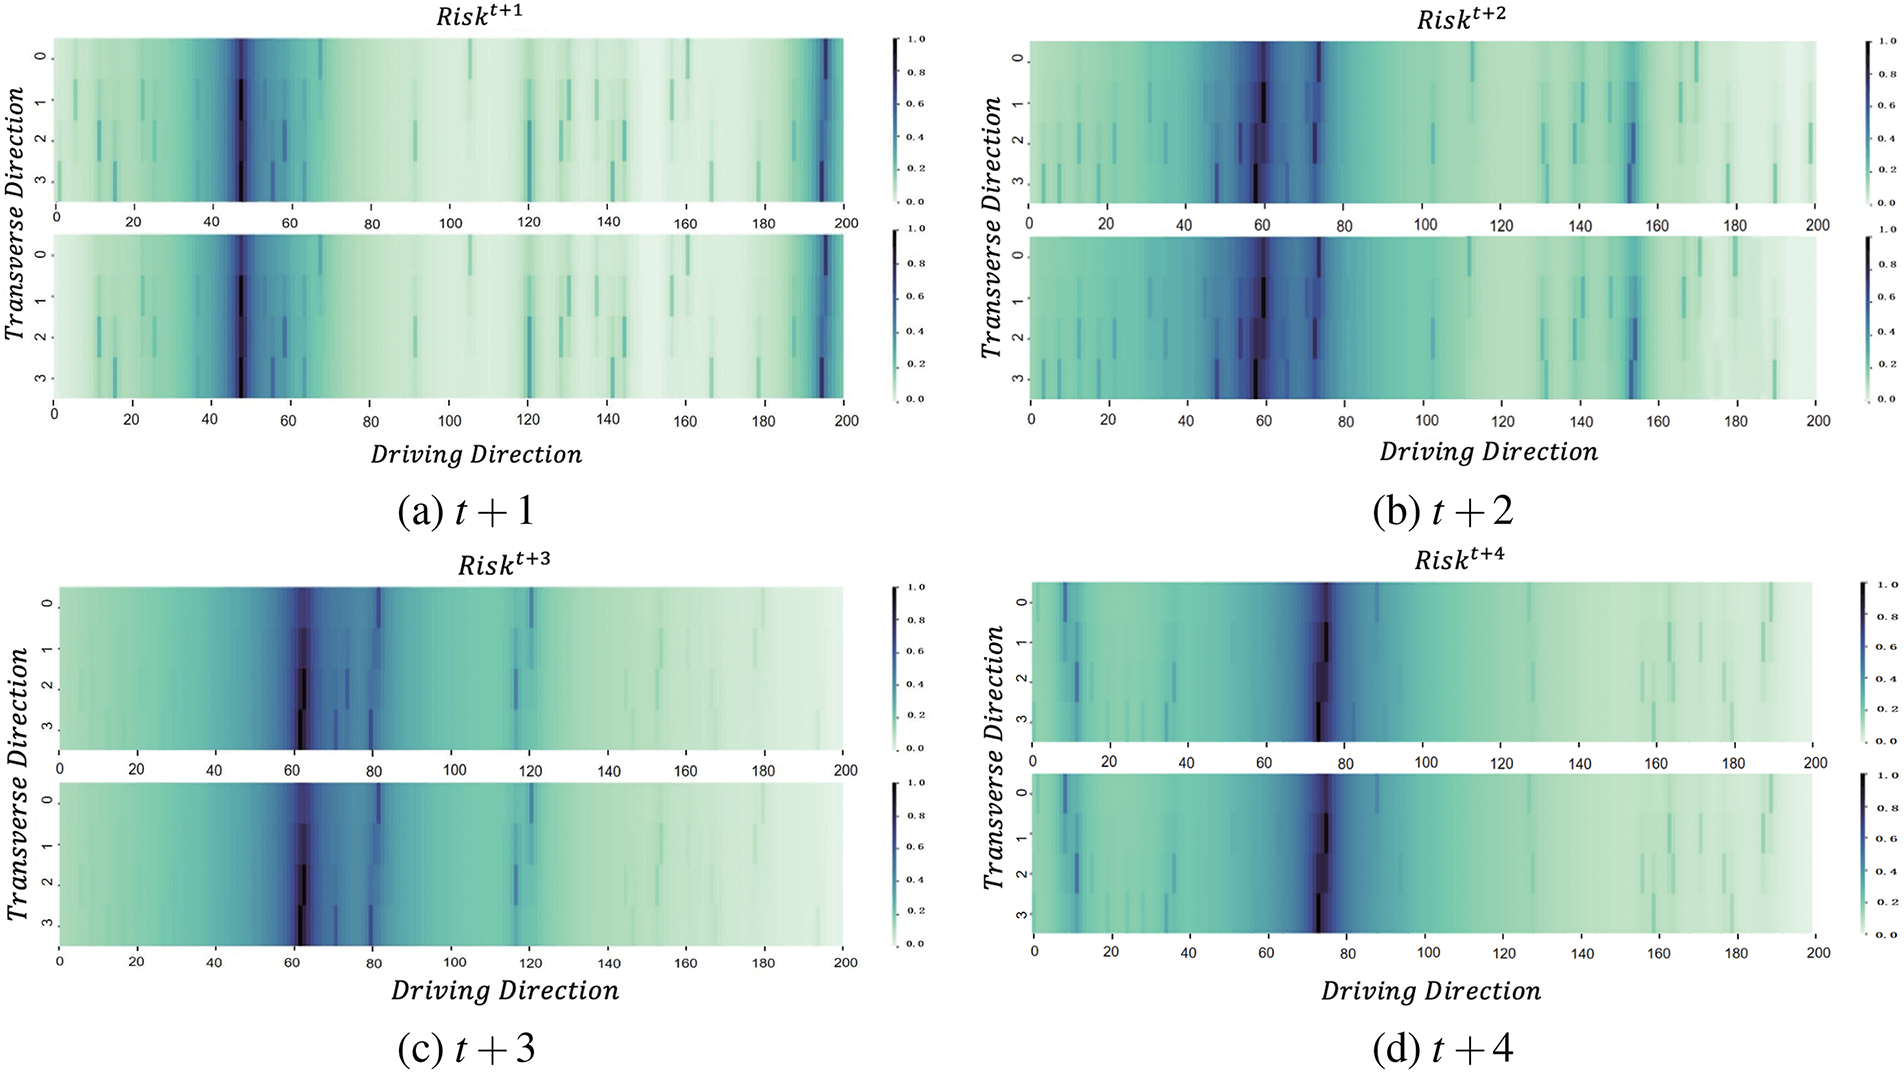
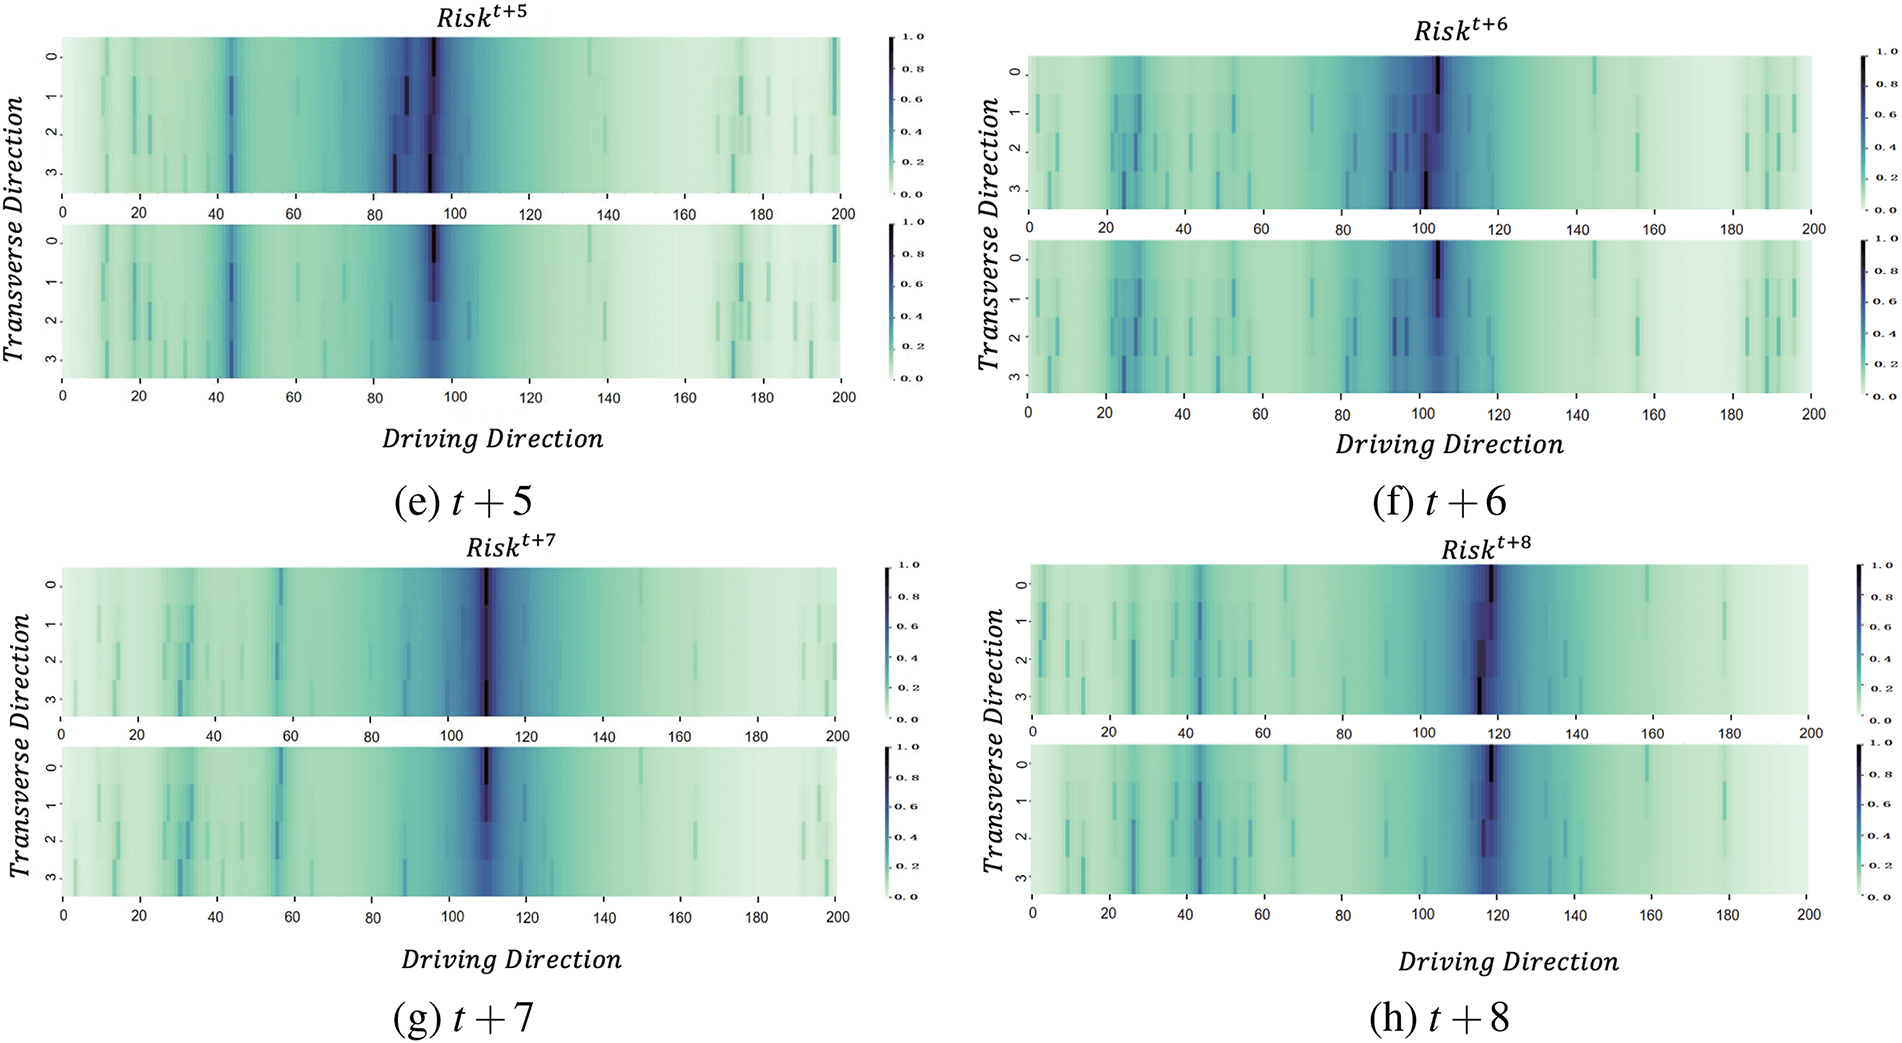
Figure 13: Prediction results of road driving risk at time
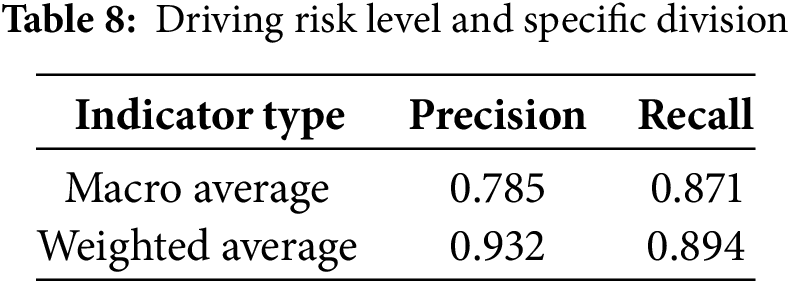
The accuracy of ConvLSTM prediction is 89.6%. This paper divides the value range of driving risk into five levels, as shown in Table 6. To further evaluate the performance of ConvLSTM, we use precision and recall to quantify the model’s effectiveness. The formula for precision is given in Eq. (13), and recall is calculated using Eq. (14).
where TP represents the number of samples correctly classified as positive, and FP denotes the number of negative samples incorrectly classified as positive. FN indicates the number of positive samples incorrectly classified as negative.
The ConvLSTM model performance in Table 8 shows a significant difference between the Macro Average and Weighted Average due to the uneven distribution of vehicles with different driving risk levels. Most fall under Minimal and Low, and only a few are in high-risk states. This reflects real-world road conditions.
5 Congestion Control Mechanism Based on Driving Risk Gaming
This study develops a congestion control strategy built on
The gaming rule focused on driving risk is described as follows:
Here,
It is assumed that each vehicle participant adheres to the principle of maximizing their individual interests, and thus the problem is represented as follows:
The utility function
Here,
The first term of the utility function is the benefit function, which increases as
In IoV, vehicles need to control the transmission frequency to maximize the utility function, as expressed in Eq. (15). In other words, by adjusting
5.2 The Existence and Uniqueness of Nash Solution
In game theory, a Nash equilibrium is a special stable state where no participant can improve their outcome by unilaterally changing their strategy. In our research, the Nash equilibrium can be defined as follows: when the transmission frequencies of other vehicles remain unchanged, no vehicle can achieve higher benefits by changing its transmission frequency.
The next two propositions will demonstrate the existence and uniqueness of the Nash equilibrium within the risk-oriented game model.
Proposition 1. A Nash solution can be found for the risk-oriented game described by Eqs. (15) and (16) provided that the following two conditions are met.
Condition 1: The strategy set
Condition 2: For the transmission frequency
Proof of Proposition 1. Condition 1: The strategy employed by vehicle
Condition 2: Vehicle
The expression for the second derivative can be found in Eq. (20).
Thus, the vehicle
Proposition 2. The Nash solution associated with a risk-oriented game is unique.
Proof of Proposition 2. Assume there are two distinct Nash solutions
According to the definition in Eq. (18), then
Based on the utility maximization principle, we can derive:
Then
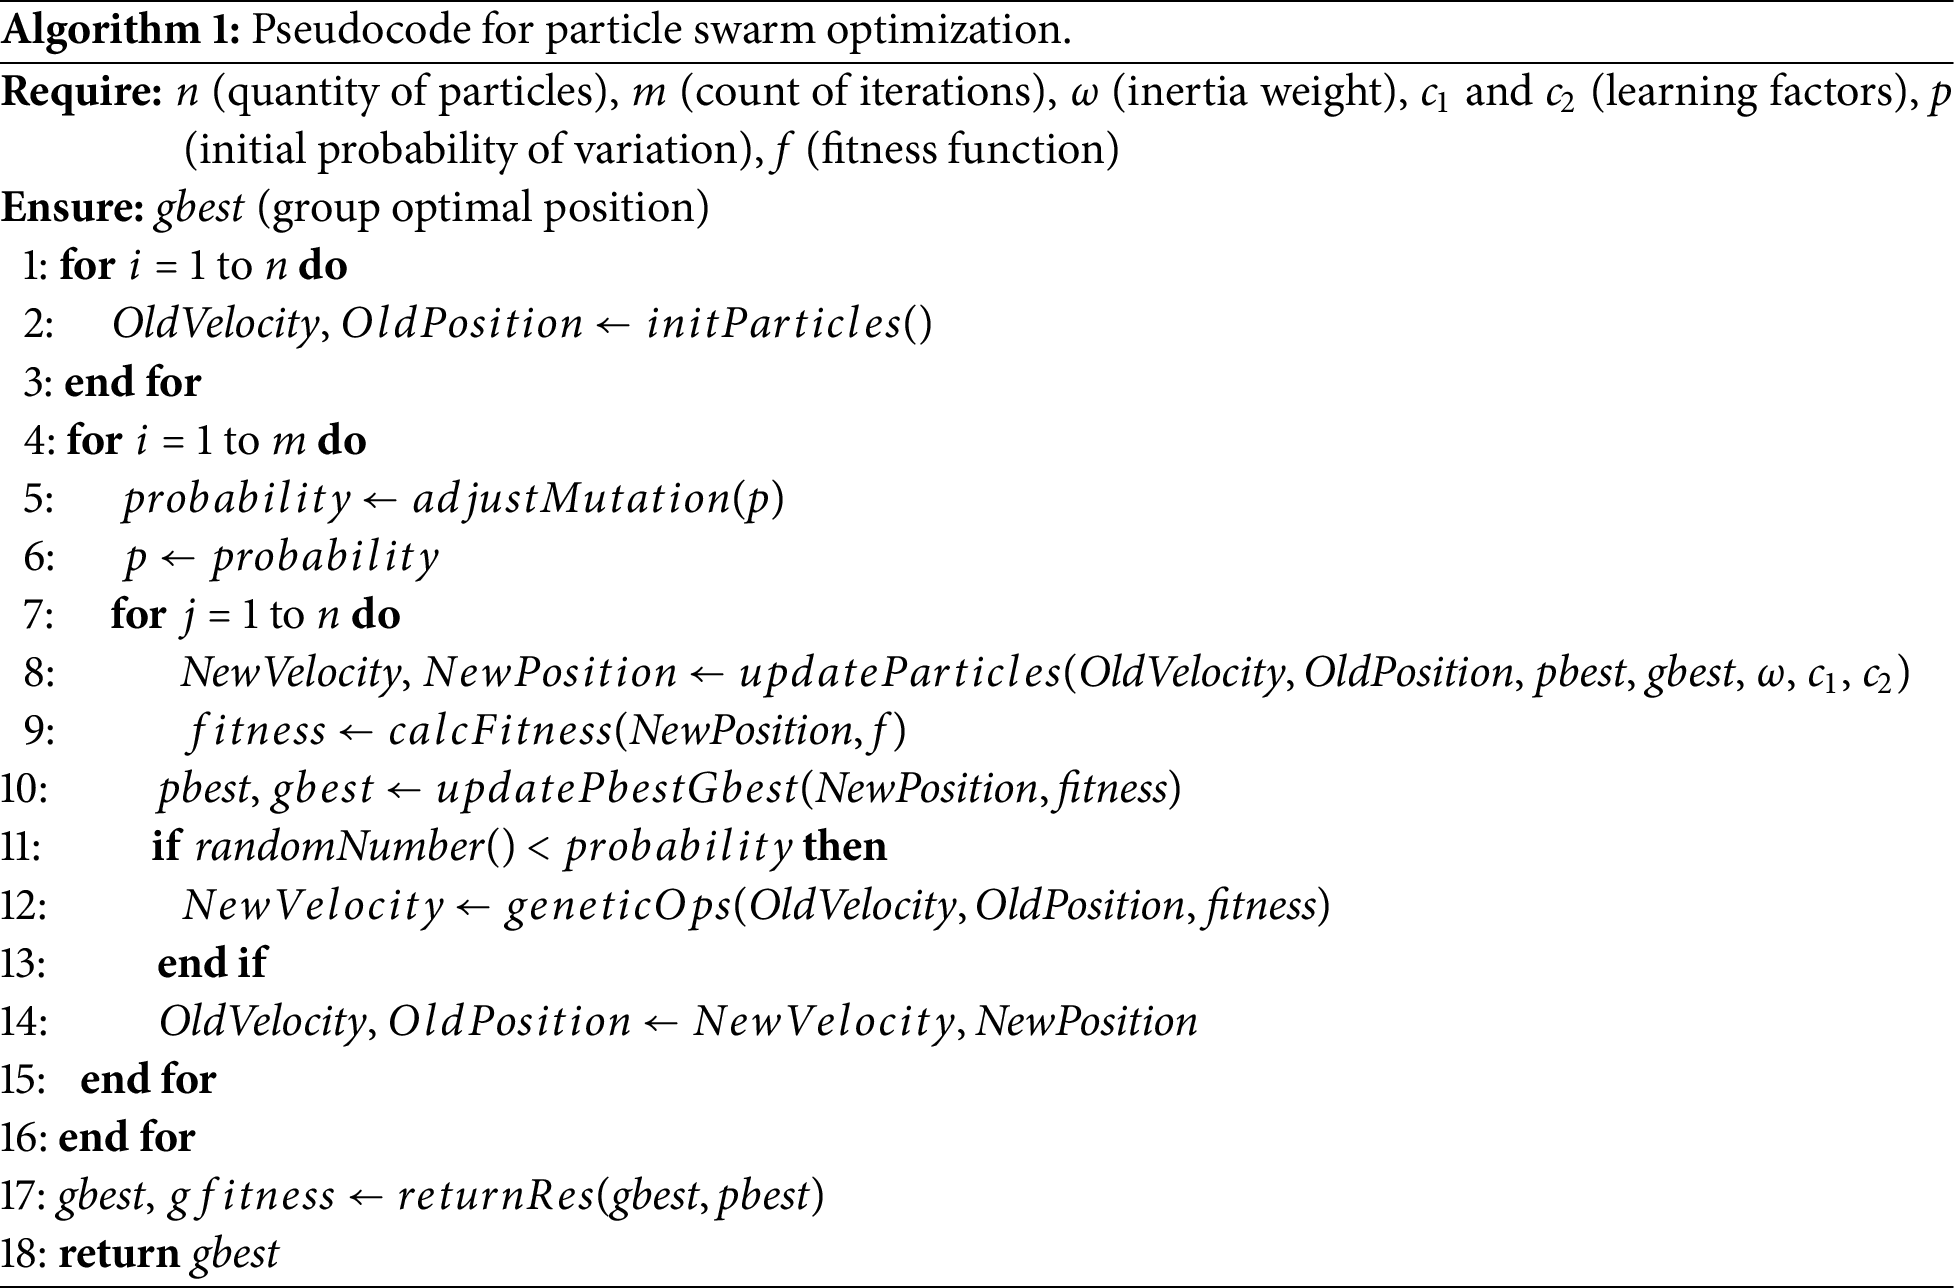
In this study, we employ a Hybrid Particle Swarm Optimization (HPSO) algorithm that integrates the exploration features of Particle Swarm Optimization (PSO) with the exploitation capabilities of the Genetic Algorithm (GA) to identify the best possible solution.
Here, vehicles are treated as particles, and the message dissemination frequency for vehicle
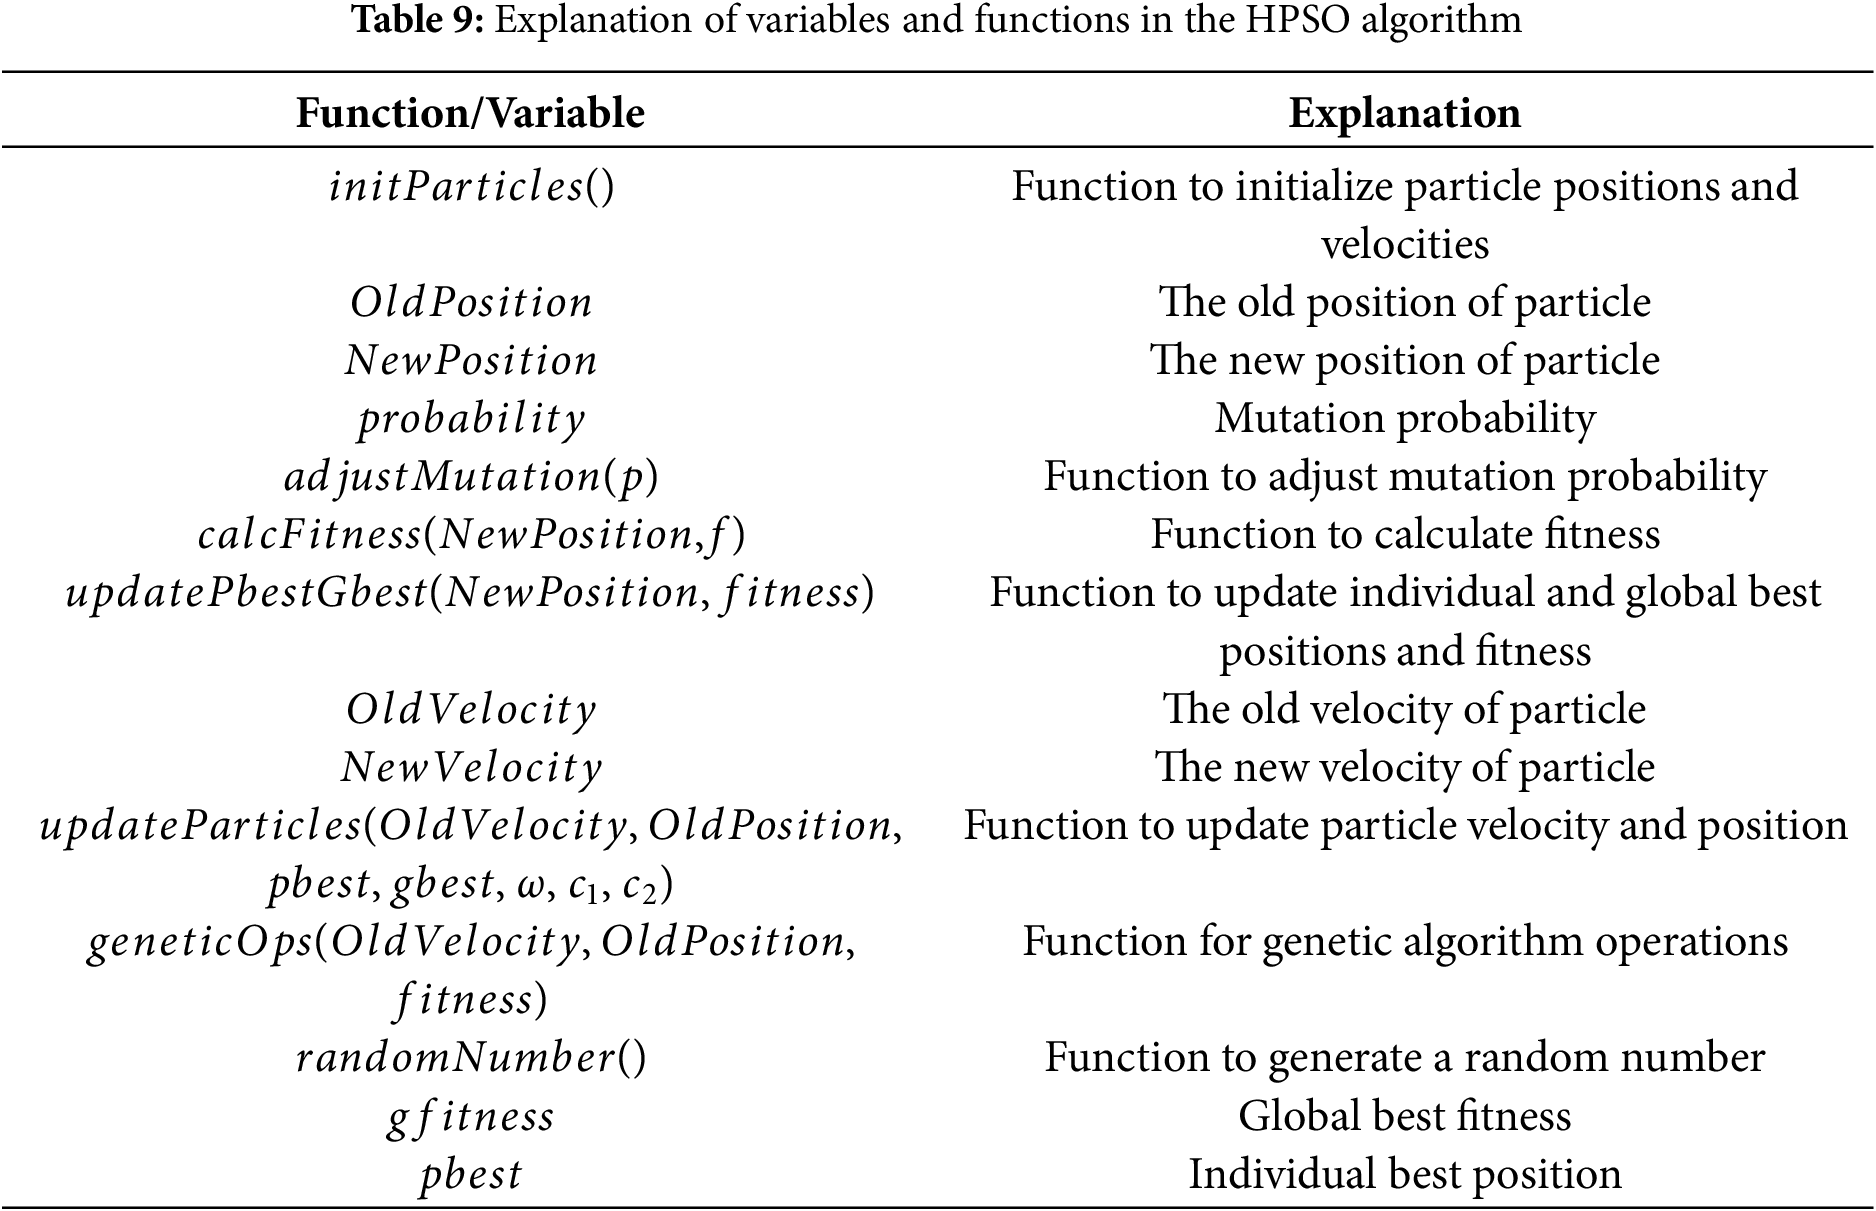
Algorithm 1 presents the pseudocode for the HPSO algorithm, and Table 9 explains its functions and variables.
6 Simulation and Experiment Results
6.1 Simulation Parameter Setting
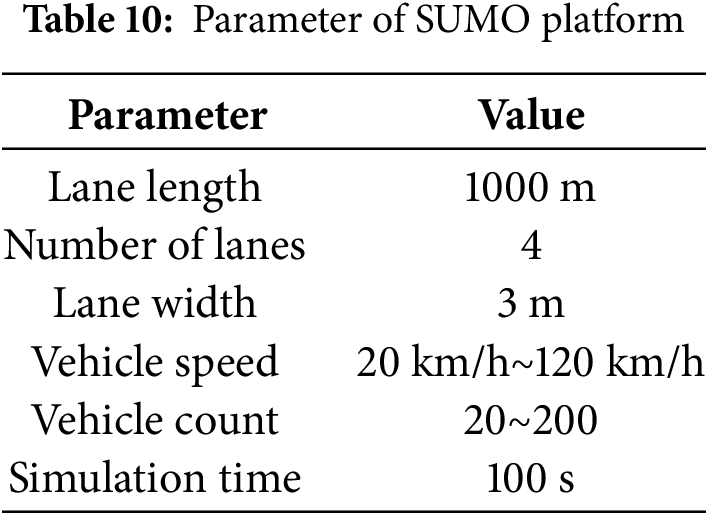
SUMO is an open source traffic simulation platform that can be used to simulate urban road networks, vehicle movement, and traffic management strategies, and evaluate traffic flow, congestion, safety, and environmental impact [28]. On the other hand, NS3 is an open source network simulation tool with a rich library of network protocols, including TCP/IP, LTE, and WiFi, which can simulate and analyze the behavior of complex computer networks [29]. These two tools are often combined for the research of intelligent transportation systems. That is why we employ the SUMO platform to build road traffic scenarios, while NS3 is used to simulate V2X communication. The parameters for the road model are shown in Table 10.
The corresponding communication and resource pool parameters are shown in Table 11 as below.
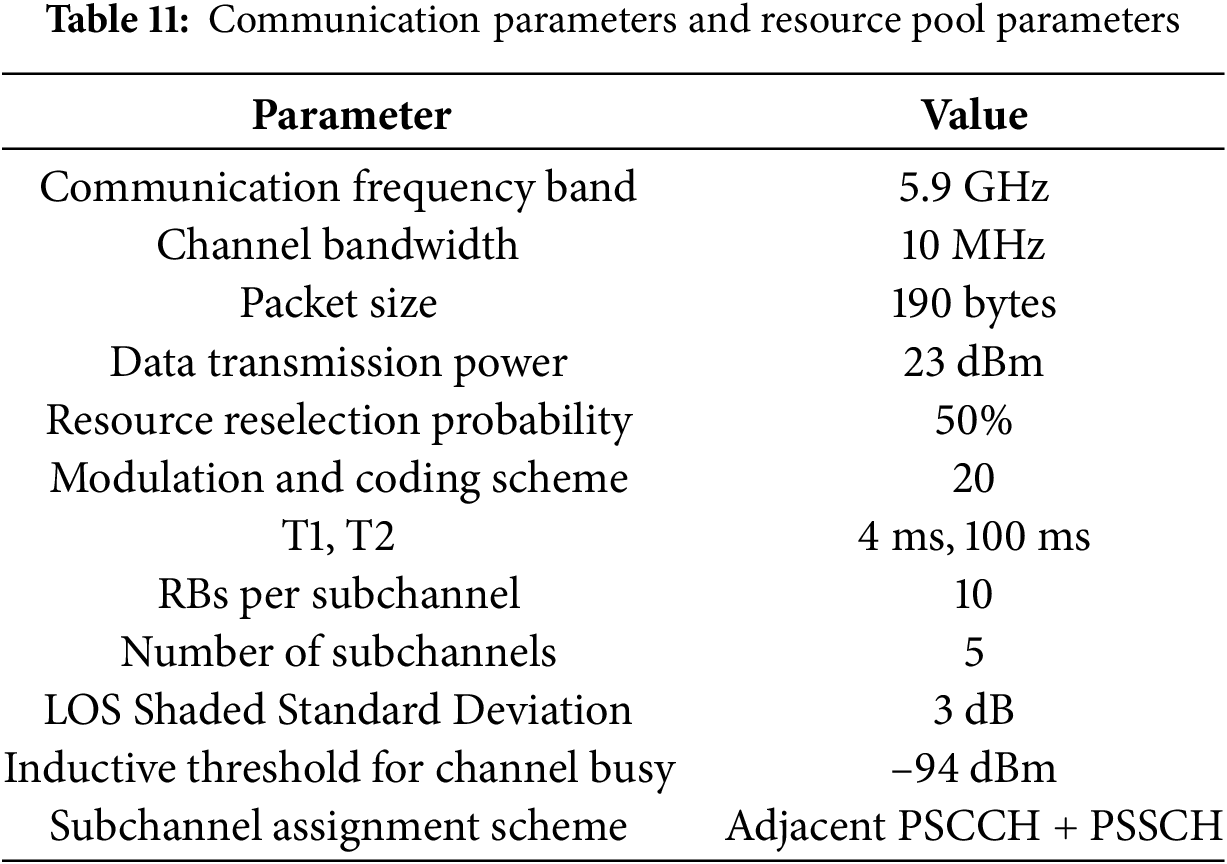
To evaluate driving risk, we randomly initialize the conditions of the vehicle, driver, and environment in simulation experiments. Additionally, to simulate communication effects in real-world environments, this study adopts the WINNER+ B1 path loss channel model as recommended by 3GPP [30]. Regarding the scheduling of resource pools, neighboring PSCCH + PSSCH subchannels are designated. This experiment assumes that all packets are of the same size and use the same Modulation and Coding Scheme (MCS). The transmission frequency of vehicle BSM packets is adjusted based on the congestion control algorithm using a driving risk game while ignoring the scenarios of BSM sending timeouts or error retransmission.
6.2 Driving Risk and Transmission Frequency
Our research uses a hybrid particle swarm optimization algorithm to solve the game model and sets the vehicle transmission frequency based on the equilibrium strategy obtained. During the simulation experiment, the changes in the driving risk and safety message transmission frequency of the ego-vehicle are recorded after entering the road area, as shown in Fig. 14.
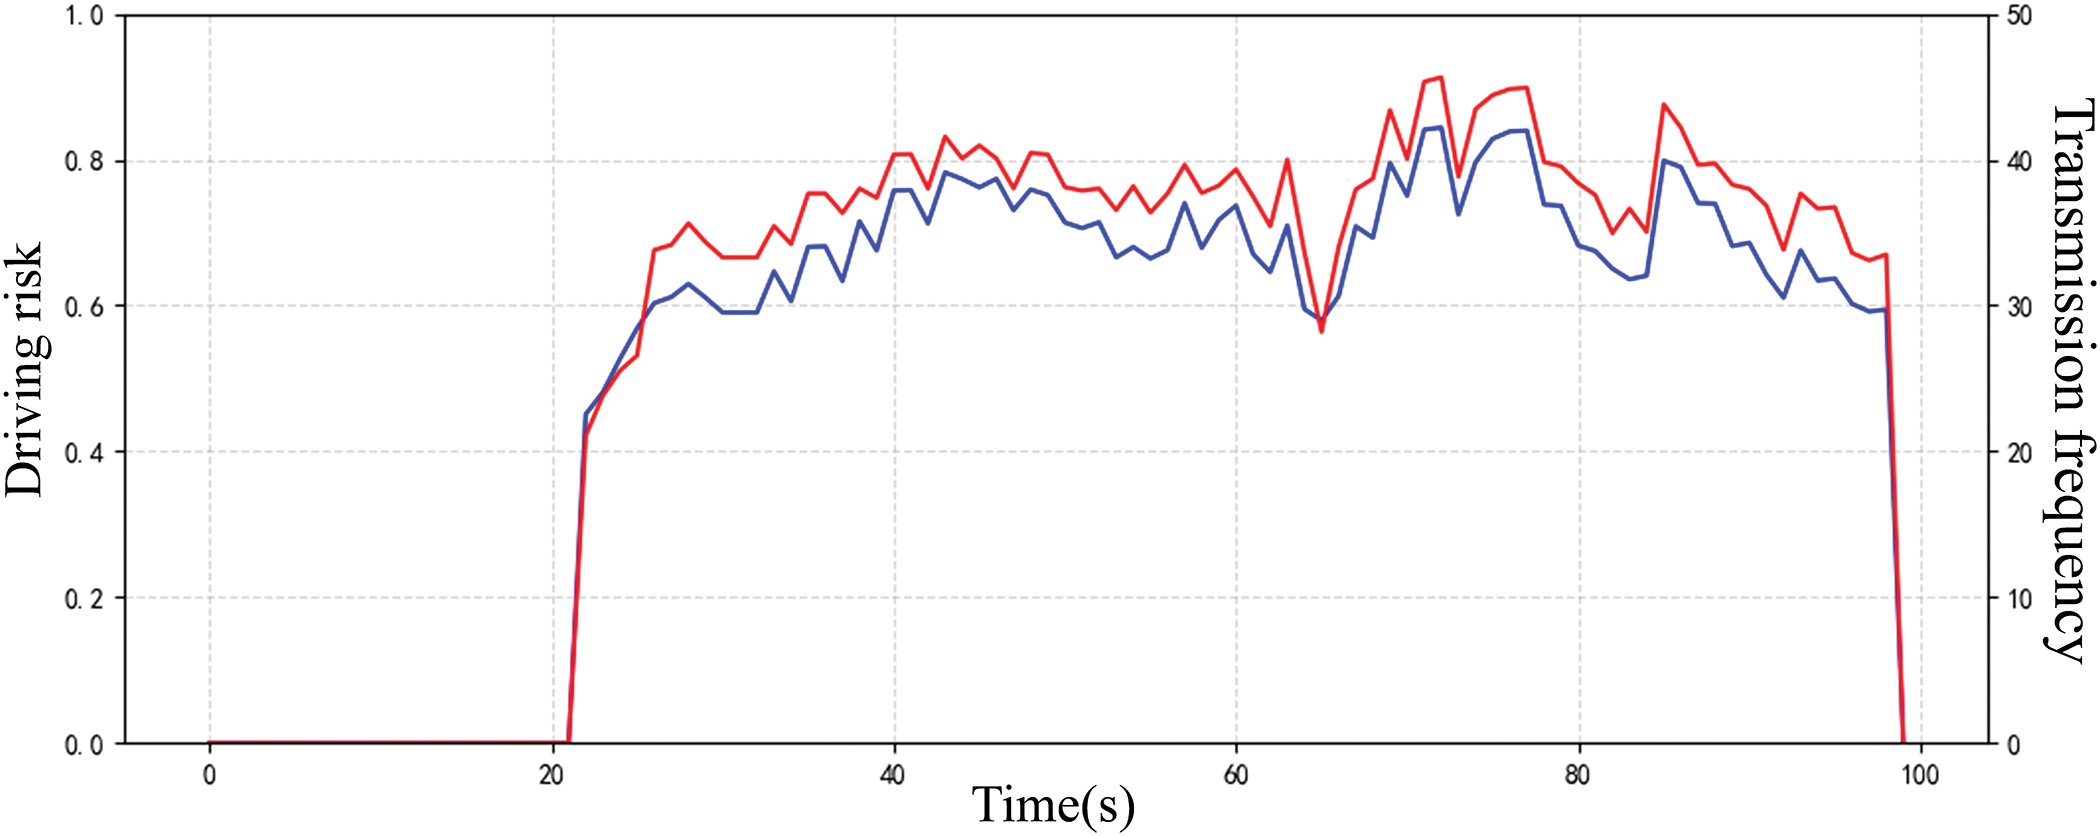
Figure 14: Driving risk of road area and transmission frequency where ego-vehicle locates
As shown in Fig. 14, after the ego-vehicle enters the road area at 21 s, the trends in driving risk and safety message transmission frequency are generally consistent. When the driving risk in the ego-vehicle’s current road area increases, the ego-vehicle correspondingly increases the transmission frequency to ensure timely delivery of safety information. Conversely, when the driving risk decreases, the ego-vehicle reduces the transmission frequency. This is in line with the original intention of the utility function design and is also in line with the actual situation.
6.3 Communication Performance Indicators
For comparative experiments aimed at validating the effectiveness of the congestion control strategy proposed in our study, LTE-V2X protocol and standard-based congestion control algorithms have been chosen.
The Packet Delivery Rate (PDR) is defined as the proportion of packets that successfully arrive at the intended destination compared to the overall number of packets transmitted, and it can be used to measure the quality of V2X communication. It is expressed as:
where N denotes the total count of experiments,
According to Fig. 15, it is evident that in scenarios with a rising number of vehicles, compared to the other two methods in the figure, the DRG-DCC algorithm still achieves a relatively high PDR. This is due to the fact that the DRG-DCC algorithm can flexibly modify the transmission frequency in accordance with the driving risk of the vehicle, which guarantees an increased packet delivery rate. While the congestion control algorithm base on the standard modifies parameters exclusively based on the correlation between
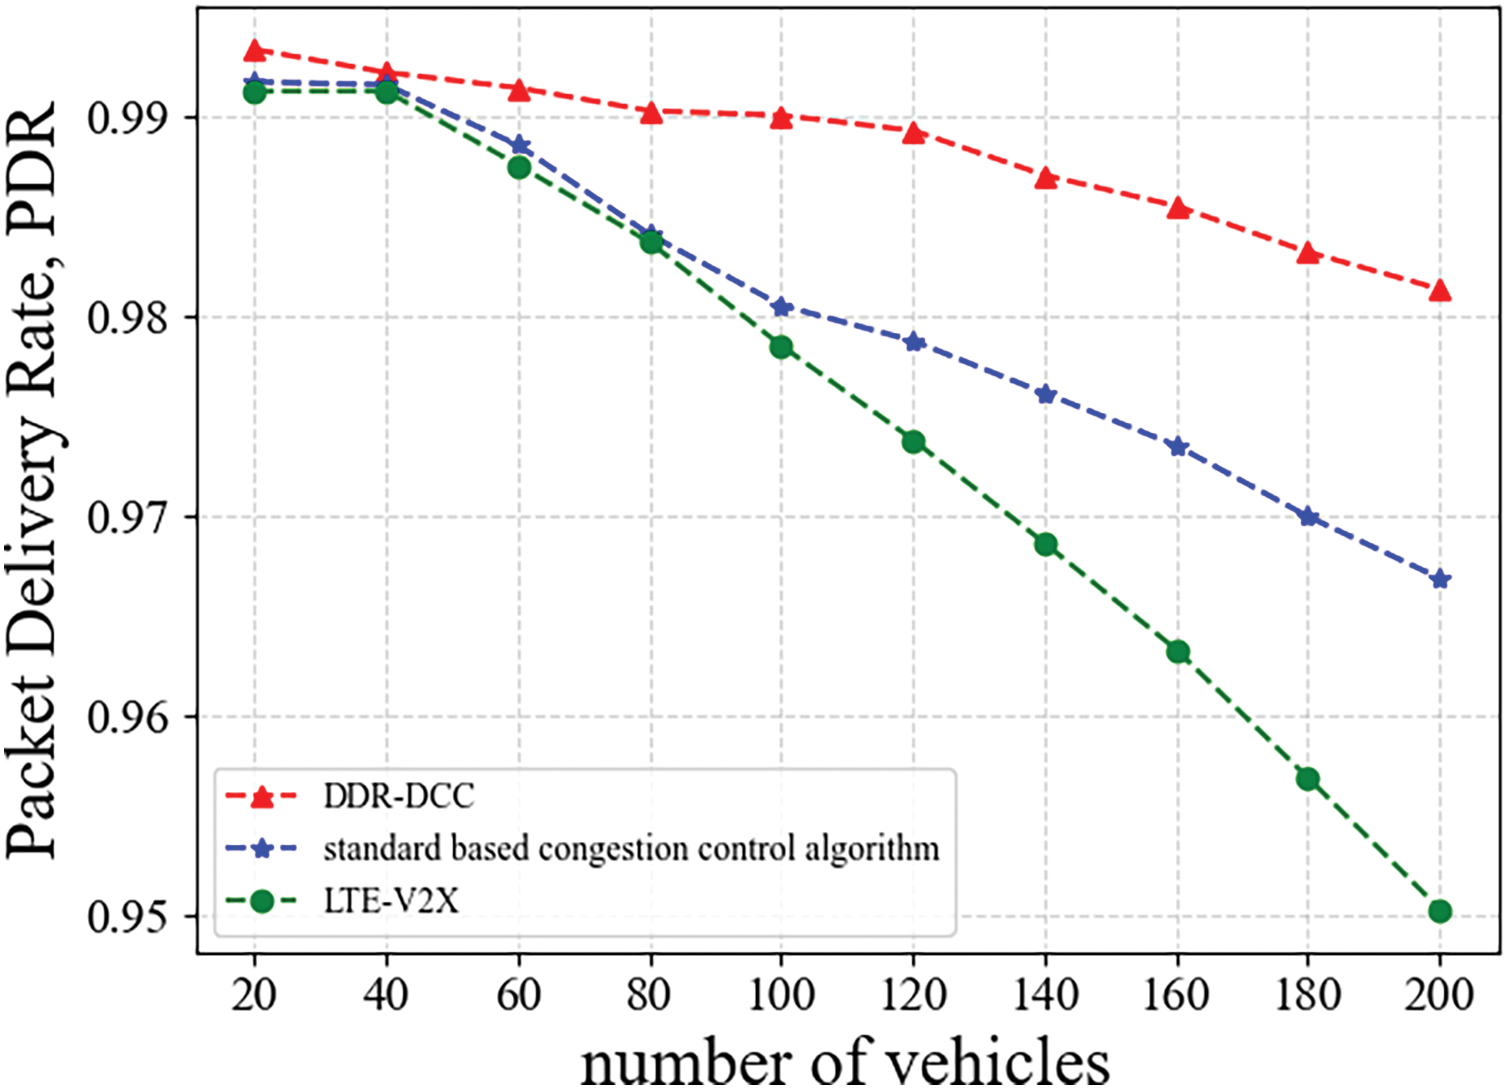
Figure 15: Packet delivery rate, PDR
The Average Reception Delay (ARD) refers to the average time it takes for a packet to be transmitted from the sender to the receiver, reflecting the timeliness of data transmission. It is defined as:
N denotes the count of BSMs that have been received,
Fig. 16 illustrates that increasing vehicle density results in a significant rise in the average reception delay of BSM under the LTE-V2X standard. This phenomenon occurs because a more significant number of resource blocks must be transmitted among vehicles, leading to prolonged resource allocation times. Consequently, vehicles take more time to receive and process BSMs. Moreover, we can see that the average reception delay of the DRG-DCC is more stable and lower than that of the standard-based congestion control algorithm.
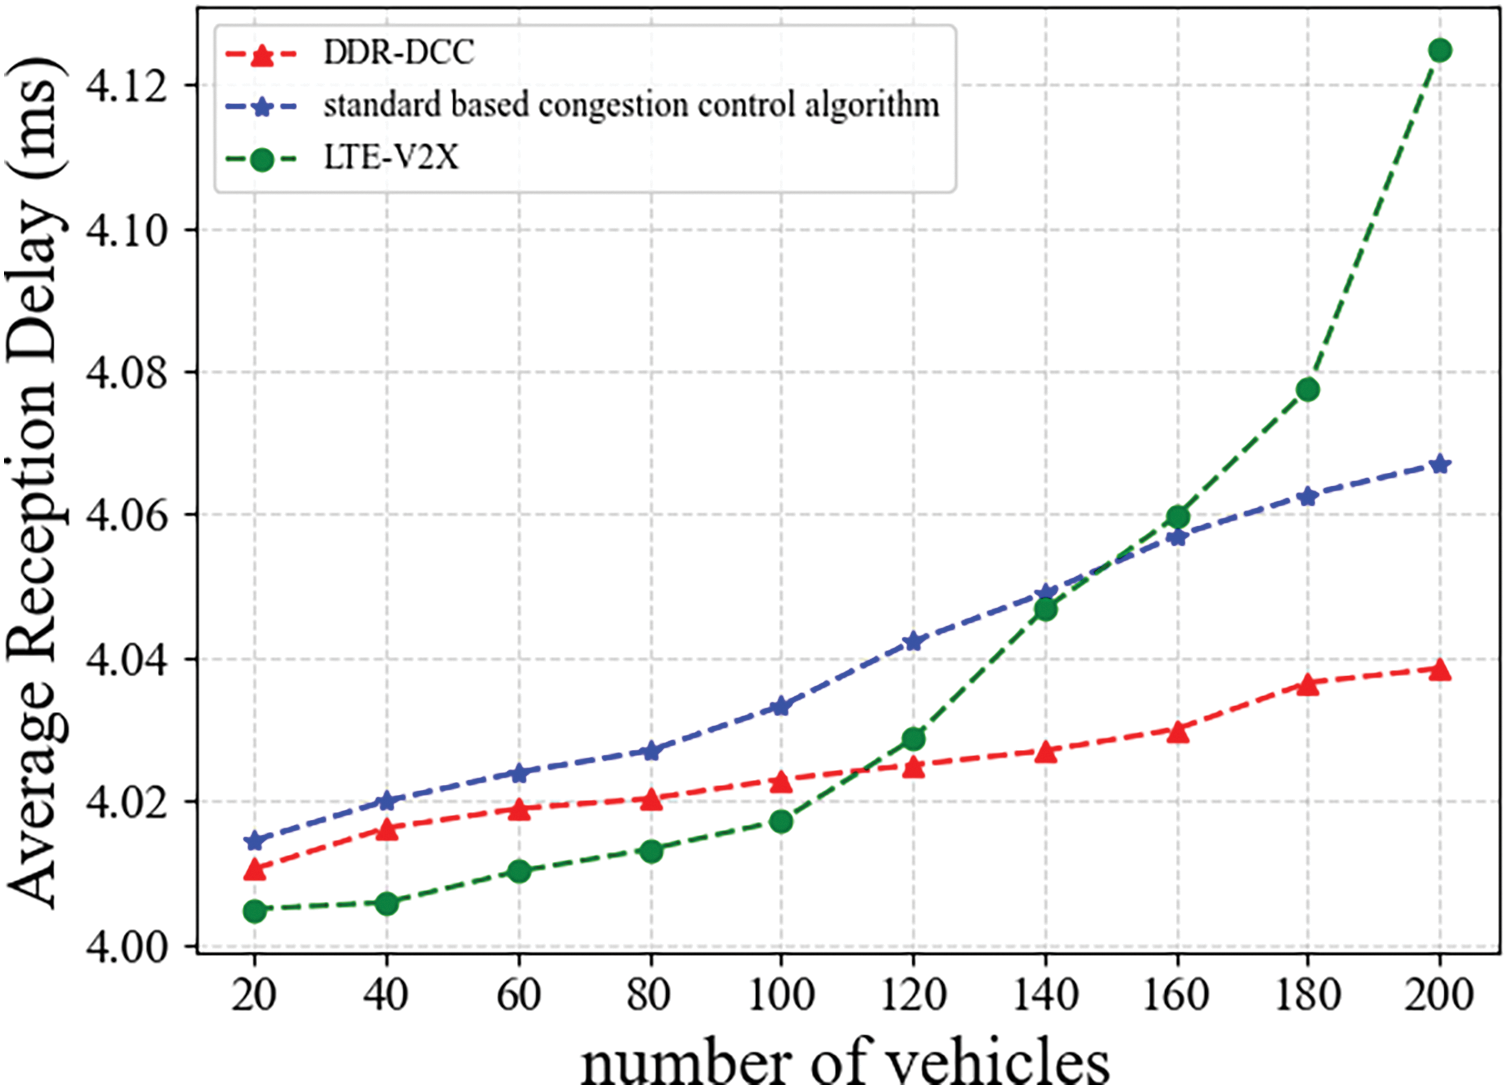
Figure 16: Average reception delay, ARD
This is because the DRG-DCC strategy can adaptively adjust the transmission frequency of data packets based on the driving risk of different vehicles, thereby reducing the data volume in the network and lowering the computation delay of the semi-persistent scheduling protocol used for resource block allocation. With a total of 200 road vehicles, there is a decrease of 0.06 s in the average reception delay, a factor that is essential for C-V2X, which demands both high reliability and low latency.
Average Throughput (AT) refers to the average amount of data transmitted in the network over a period of time, which can be used to evaluate the quality and efficiency of data transmission in V2X networks. It is expressed as:
where
Fig. 17 illustrates that with an increase in road vehicle density, the approach presented in this study achieves greater throughput. Specifically, when the road vehicle count reaches 200, the average throughput (AT) generated by our model surpasses that of the other congestion control strategy by approximately 55%. This indicates that our method can still ensure transmission efficiency under high vehicle density conditions. This is because the technique proposed in this paper finds the optimal transmission frequency for each vehicle through a non-cooperative game, resulting in fewer resource block conflicts, which increases the packet reception success rate and thus improves the average throughput.
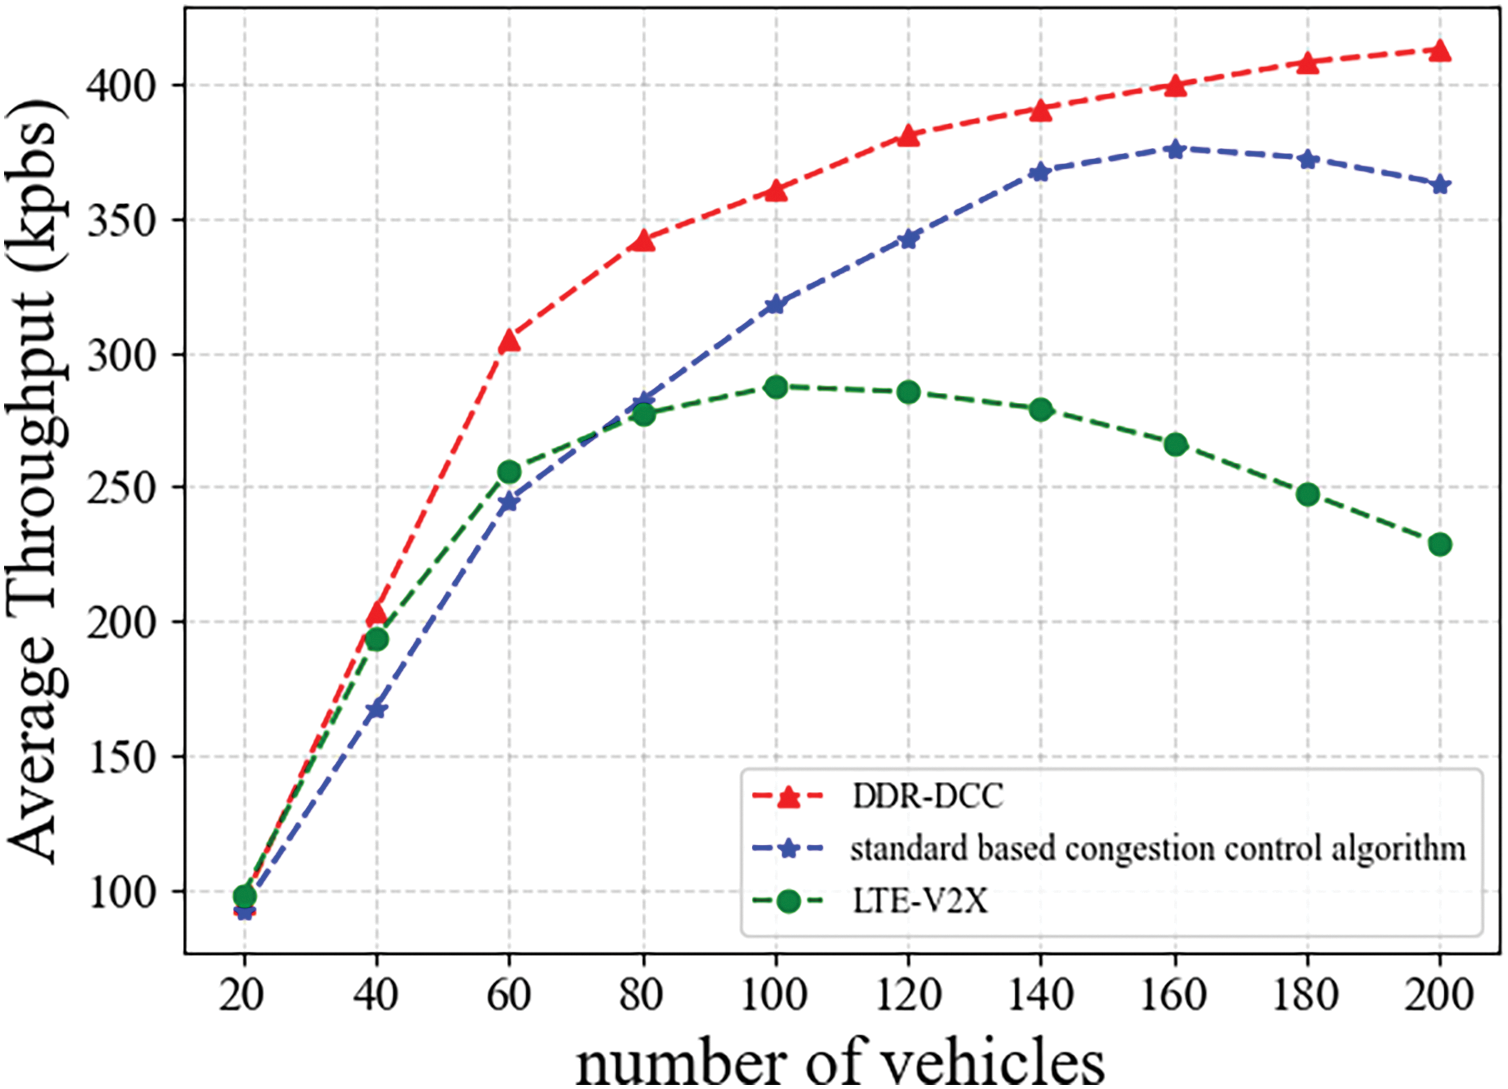
Figure 17: Average throughput, AT
The metric selected for evaluating network load is the channel busy rate (CBR). CBR indicates the proportion of time within a designated detection period that a vehicle perceives the channel as being occupied.
As illustrated in Fig. 18, as the vehicle density increases, the channel busy rate (CBR) of the LTE-V2X standard, utilizing a fixed frequency of 10 Hz for message transmission, has already exceeded 70%. The CBR based on the standard congestion control algorithm has also significantly increased. This indicates that both methods experience congestion issues in high-density scenarios. The DRG-DCC algorithm presented in our research proves to be more effective in mitigating congestion. In high-density situations, the CBR value associated with the DRG-DCC algorithm stays at or below 0.5, ensuring the reliability and real-time efficiency of the vehicle network.
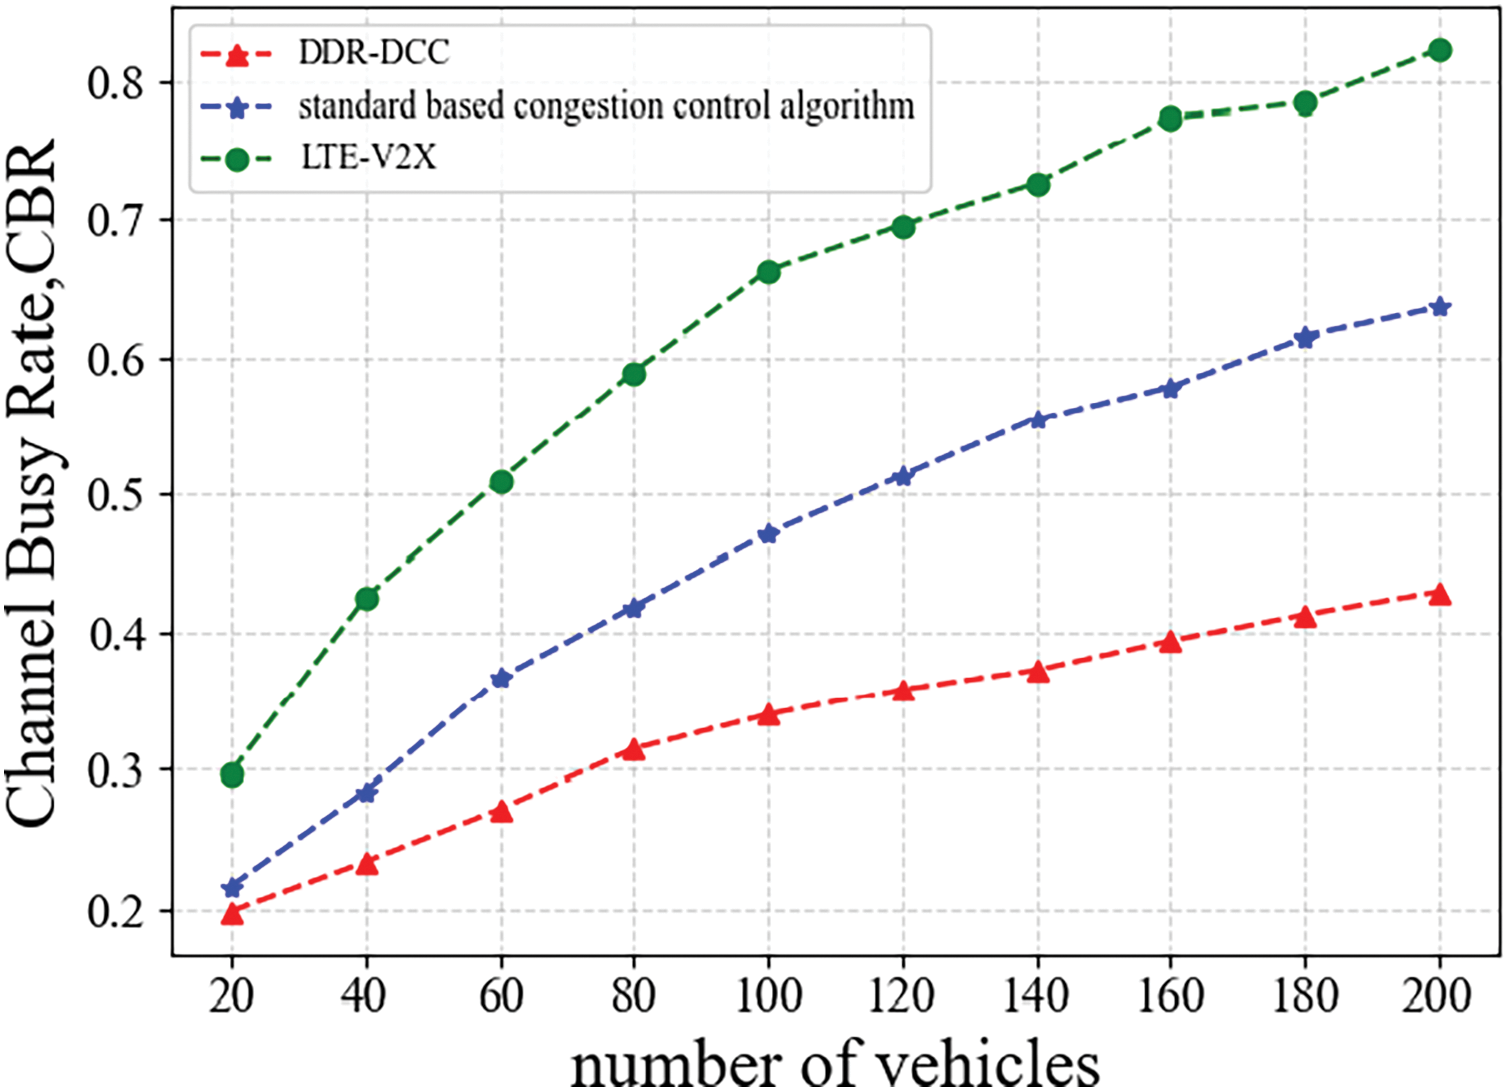
Figure 18: Channel Busy Rate (CBR)
The DRG-DCC strategy adjusts the packet transmission frequency based on vehicle driving risk, setting a higher frequency for high-risk vehicles and a lower frequency for low-risk vehicles, thereby saving communication resources, reducing data volume, lowering channel load, and preventing network congestion.
In our research, we proposed a Nash equilibrium congestion control algorithm based on the driving risk evaluation. First, we establish a two-stage fuzzy inference model to evaluate driving risk. By performing fuzzy inference on driver, vehicle, and environment factors, we obtain single-factor driving risk values, which are then combined to derive the overall driving risk value. Additionally, we use ConvLSTM for short-term prediction of driving risk, further enhancing the accuracy and effectiveness of the evaluation. Subsequently, we employ a non-cooperative game framework to manage the driving risk along with the transmission frequencies of BSMs, demonstrating both the existence and uniqueness of the Nash equilibrium. Ultimately, the game model is resolved through the use of the HPSO algorithm.
The simulation results show that the driving risk evaluation method based on combined fuzzy inference proposed in this paper can effectively reflect driving risk. Compared to the LTE-V2X standard without congestion control mechanisms and the standard-based congestion control algorithm, the congestion control strategy proposed in this paper adaptively adjusts the transmission frequency of vehicle safety messages based on the driving risk of the ego-vehicle. This improves communication performance and alleviates channel congestion. Even in the case of high vehicle density, the reliability of the message can still be guaranteed.
Looking ahead, we can consider incorporating more comprehensive factors for traffic risk evaluation. On the other hand, our study focused solely on a four-lane straight-road scenario. Future work could explore optimizing congestion control strategies for specific traffic scenarios, such as intersections and merge ramps.
Acknowledgement: I express my sincere gratitude to all individuals who have contributed to this paper. Their dedication and insights have been invaluable in shaping the outcome of this work.
Funding Statement: This research is supported by the special key project of Chongqing Technology Innovation and Application Development under Grant No. cstc2021jscx-gksbX0057, and the Special Major Project of Chongqing Technology Innovation and Application Development under Grant No. CSTB2022TIADSTX0003.
Author Contributions: The authors confirm their contribution to the paper as follows: study conception and design: Lingqiu Zeng, Peibing Sa, Qingwen Han, Lei Ye; data collection: Lingqiu Zeng, Peibing Sa, Lei Ye; analysis and interpretation of results: Lingqiu Zeng, Qingwen Han, Lei Ye, Cheng Zhang; draft manuscript preparation: Lingqiu Zeng, Peibing Sa, Qingwen Han, Lei Ye, Letian Yang, Jiqiang Cheng. All authors reviewed the results and approved the final version of the manuscript.
Availability of Data and Materials: The data that support the findings of this study are available from the corresponding author, Lei Ye, upon reasonable request.
Ethics Approval: Not applicable.
Conflicts of Interest: The authors declare no conflicts of interest to report regarding the present study.
References
1. 3GPP. Release 14 [Standard]. 2017 [cited 2025 Feb 11]. Available from: https://www.3gpp.org/specifications-technologies/releases/release-14. [Google Scholar]
2. Choi JY, Jo HS, Mun C, Yook JG. Deep reinforcement learning-based distributed congestion control in cellular V2X networks. IEEE Wirel Commun Lett. 2021;10(11):2582–6. doi:10.1109/LWC.2021.3108821. [Google Scholar] [CrossRef]
3. Patil A, Shet NSV. Challenges for decentralized congestion control mechanisms in vehicular ad hoc networks. In: 8th International Symposium on Embedded Computing and System Design (ISED); 2018 Dec 13–15; Cochin, India. Piscataway, NJ: IEEE; 2018. p. 246–50. [Google Scholar]
4. (ETSI) ETSI. Congestion Control Mechanisms for the C-V2X PC5 Interface; Access Layer Part, Standard ETSI TS 103 574 V1.1.1. Sophia Antipolis, France: European Telecommunications Standards Institute (ETSI); 2018. [Google Scholar]
5. Fallah YP, Huang CL, Sengupta R, Krishnan HJIToVT. Analysis of information dissemination in vehicular ad-hoc networks with application to cooperative vehicle safety Systems. 2011;60(1):233–47. [Google Scholar]
6. Mansouri A, Martinez V, Härri J. A first investigation of congestion control for LTE-V2X mode 4. In: 15th Annual Conference on Wireless On-demand Network Systems and Services (WONS); 2019 Jan 22–24; Wengen, Switzerland. Piscataway, NJ: IEEE; 2019. p. 56–63. [Google Scholar]
7. Garnaik MM, Giri JP, Panda A. Impact of highway design on traffic safety: how geometric elements affect accident risk. Ecocycles. 2023;9(1):83–92. doi:10.19040/ecocycles.v9i1.263. [Google Scholar] [CrossRef]
8. Srisurin P, Chalermpong S. Analyzing human, roadway, vehicular and environmental factors contributing to fatal road traffic crashes in Thailand. Eng J. 2021;25(10):27–38. doi:10.4186/ej.2021.25.10.27. [Google Scholar] [CrossRef]
9. Kodithuwakku DS, Peiris T. Factors influencing for severity of road traffic accidents in Sri Lanka. Sri Lankan J Appl Stat. 2021;22(1):1–12. doi:10.4038/sljastats.v22i1.8035. [Google Scholar] [CrossRef]
10. Li Y, Ye C. Power control algorithm of D2D communication based on non-cooperative game theory. In: Robotics and Rehabilitation Intelligence: First International Conference, ICRRI 2020; 2020 Sep 9–11; Fushun, China: Springer. p. 20–33. [Google Scholar]
11. Bazzi A. Congestion control mechanisms in IEEE 802.11p and sidelink C-V2X. In: 53rd Asilomar Conference on Signals, Systems, and Computers; 2019 Nov 3–6; Pacific Grove, CA, USA. Piscataway, NJ: IEEE; 2019. p. 1125–30. [Google Scholar]
12. Zhang C, Zhang W, Wu Q, Fan P, Fan Q, Wang J, et al. Distributed deep reinforcement learning based gradient quantization for federated learning enabled vehicle edge computing. IEEE Internet Things J. 2025;12(5):4899–913. [Google Scholar]
13. Wu Q, Wang W, Fan P, Fan Q, Zhu H, Letaief KB. Cooperative edge caching based on elastic federated and multi-agent deep reinforcement learning in next-generation networks. IEEE Trans Netw Serv Manag. 2024;21(4):4179–96. doi:10.1109/TNSM.2024.3403842. [Google Scholar] [CrossRef]
14. Roshdi M, Bhadauria S, Hassan K, Fischer G. Deep reinforcement learning based congestion control for V2X communication. In: 32nd IEEE Annual International Symposium on Personal, Indoor and Mobile Radio Communications (PIMRC); 2021 Sep 13–16; Helsinki, Finland. Piscataway, NJ: IEEE; 2021. p. 1–6. [Google Scholar]
15. Shao Z, Wu Q, Fan P, Cheng N, Chen W, Wang J, et al. Semantic-aware spectrum sharing in internet of vehicles based on deep reinforcement learning. IEEE Internet Things J. 2024 Dec;11(23):38521–36. doi:10.1109/JIOT.2024.3448538. [Google Scholar] [CrossRef]
16. Hu Z, Wang X, Bie Y. Game theory based congestion control for routing in wireless sensor networks. IEEE Access. 2021;9:103862–74. doi:10.1109/ACCESS.2021.3097942. [Google Scholar] [CrossRef]
17. Kalita A, Khatua M. A noncooperative gaming approach for control packet transmission in 6TiSCH network. IEEE Internet Things J. 2021;9(5):3954–61. doi:10.1109/JIOT.2021.3101941. [Google Scholar] [CrossRef]
18. Liu L, Xiao F, Han L, Fan W, He X. GTCC: a game theoretic approach for efficient congestion control in datacenter networks. IEEE Trans Netw Sci Eng. 2024;11(6):6328–44. doi:10.1109/TNSE.2024.3443099. [Google Scholar] [CrossRef]
19. Amer H, Al-Kashoash H, Khami MJ, Mayfield M, Mihaylova LJAHN. Non-cooperative game based congestion control for data rate optimization in vehicular ad hoc networks. Ad Hoc Netw. 2020;107(9):102181. doi:10.1016/j.adhoc.2020.102181. [Google Scholar] [CrossRef]
20. Zheng Y, Wang JQ, Li XF, Yu CF, Kodaka K, Li KQ, et al. Driving risk assessment using cluster analysis based on naturalistic driving data. In: IEEE 17th International Conference on Intelligent Transportation Systems (ITSC); 2014; New York: IEEE. p. 2584–9. [Google Scholar]
21. Shi L, Qian C, Guo F. Real-time driving risk assessment using deep learning with XGBoost. Acc Anal Preven. 2022;178(1):106836. doi:10.1016/j.aap.2022.106836. [Google Scholar] [PubMed] [CrossRef]
22. Zhu H, Chen X, Pei YL, Yu Q, Sun Y. Research on road safety situation assessment and prediction under accident conditions. J Highway Trans Res Develop. 2019;15(11):272–6. [Google Scholar]
23. Bey T, Tewolde G. Evaluation of DSRC and LTE for V2X. In: 9th IEEE Annual Computing and Communication Workshop and Conference (CCWC); 2019 Jan 7–9; Las Vegas, NV, USA. Piscataway, NJ: IEEE; 2019. p. 1032–5. [Google Scholar]
24. Singh S. Critical reasons for crashes investigated in the national motor vehicle crash causation survey. 2015 [cited 2025 Feb 11]. Available from: https://crashstats.nhtsa.dot.gov/Api/Public/Publication/812115. [Google Scholar]
25. Xiong X, Zhang S, Chen Y. Review of intelligent vehicle driving risk assessment in multi-vehicle interaction scenarios. World Elect Veh J. 2023;14(12):348. doi:10.3390/wevj14120348. [Google Scholar] [CrossRef]
26. Shi X, Chen Z, Wang H, Yeung DY, Wong WK, Woo WC. Convolutional LSTM network: a machine learning approach for precipitation nowcasting. Adv Neural Inf Process Syst. 2015;28:802–10. [Google Scholar]
27. Huang H, Zeng Z, Yao D, Pei X, Zhang Y. Spatial-temporal ConvLSTM for vehicle driving intention prediction. Tsinghua Sci Technol. 2021;27(3):599–609. doi:10.26599/TST.2020.9010061. [Google Scholar] [CrossRef]
28. Behrisch M, Bieker L, Erdmann J, Krajzewicz D. SUMO—simulation of urban mobility: an overview. In: Proceedings of SIMUL 2011, The Third International Conference on Advances in System Simulation; 2011 Oct 23–28; Barcelona, Spain. Wilmington, DE: ThinkMind; 2011. [Google Scholar]
29. Campanile L, Gribaudo M, Iacono M, Marulli F, Mastroianni M. Computer network simulation with ns-3: a systematic literature review. Electronics. 2020;9(2):272. doi:10.3390/electronics9020272. [Google Scholar] [CrossRef]
30. Große P, Schneider C, Sommerkorn G, Thomä R. A hybrid channel model based on WINNER for vehicle-to-X application. arXiv:1601.05929. 2016. [Google Scholar]
Cite This Article
 Copyright © 2025 The Author(s). Published by Tech Science Press.
This work is licensed under a Creative Commons Attribution 4.0 International License , which permits unrestricted use, distribution, and reproduction in any medium, provided the original work is properly cited.
 Downloads
 Citation Tools