
 Submit a Paper
 Propose a Special lssue
 Open Access
ARTICLE
Automatic Pancreas Segmentation in CT Images Using EfficientNetV2 and Multi-Branch Structure
1 School of Informatics, Hunan University of Chinese Medicine, Changsha, 410208, China
2 Department of Hepatobiliary Pancreatic Surgery, Changsha Eighth Hospital, Changsha, 410100, China
3 School of Traditional Chinese Medicine, Hunan University of Chinese Medicine, Changsha, 410208, China
* Corresponding Author: Guojiang Xin. Email:
Computers, Materials & Continua 2025, 83(2), 2481-2504. https://doi.org/10.32604/cmc.2025.060961
Received 13 November 2024; Accepted 12 February 2025; Issue published 16 April 2025
 View Full Text
 Download PDF
Abstract
Automatic pancreas segmentation plays a pivotal role in assisting physicians with diagnosing pancreatic diseases, facilitating treatment evaluations, and designing surgical plans. Due to the pancreas’s tiny size, significant variability in shape and location, and low contrast with surrounding tissues, achieving high segmentation accuracy remains challenging. To improve segmentation precision, we propose a novel network utilizing EfficientNetV2 and multi-branch structures for automatically segmenting the pancreas from CT images. Firstly, an EfficientNetV2 encoder is employed to extract complex and multi-level features, enhancing the model’s ability to capture the pancreas’s intricate morphology. Then, a residual multi-branch dilated attention (RMDA) module is designed to suppress irrelevant background noise and highlight useful pancreatic features. And re-parameterization Visual Geometry Group (RepVGG) blocks with a multi-branch structure are introduced in the decoder to effectively integrate deep features and low-level details, improving segmentation accuracy. Furthermore, we apply re-parameterization to the model, reducing computations and parameters while accelerating inference and reducing memory usage. Our approach achieves average dice similarity coefficient (DSC) of 85.59%, intersection over union (IoU) of 75.03%, precision of 85.09%, and recall of 86.57% on the NIH pancreas dataset. Compared with other methods, our model has fewer parameters and faster inference speed, demonstrating its enormous potential in practical applications of pancreatic segmentation.Keywords
Pancreatic cancer is recognized as one of the deadliest tumors and is projected to become the second leading cause of cancer-related mortality in the United States [1]. Early screening and diagnosis are crucial for improving the survival rate of patients with pancreatic cancer [2]. Computed tomography (CT) is the first-line imaging modality for diagnosing suspected pancreatic cancer [3]. However, manual delimitation of the pancreas in abdominal CT images is not only skill-demanding and time-consuming but also prone to subjective inconsistency. Therefore, there is an urgent need for a method that can quickly and accurately segment the pancreas, alleviating radiologists’ workload and aiding physicians in early screening of pancreatic inflammation or lesions, as well as in surgical planning.
Traditional pancreatic image segmentation techniques achieved low dice coefficients (

Figure 1: CT slices from three cases. The pancreatic region is highlighted in red from three case
Some researchers directly apply 3D fully convolutional networks to locate and segment the pancreas from volumetric data [11,12]. Mo et al. [13] introduced a iterative 3D feature enhancement network to enhance multi-level integrated features and single features at different levels, suppressing non-target information and improving the fine details of the pancreas. Due to the GPU limitations, an entire CT scan needs to be cropped to sub-volumes and the input size is fixed at
Focusing on smaller input regions around the target can lead to higher segmentation accuracy. Therefore, a few techniques involve resampling pancreatic CT slices during data preprocessing, such as directly resizing to smaller dimensions of
In response to the above problems, prior to training, we design a fixed candidate region based on the pancreas location for cropping, which can preserve the relative positional information while removing part of the background. In the network design, we first utilize the powerful and parameter-efficient neural network EfficientNetV2 [29] as the encoder. This architecture incorporates advanced convolutional modules, such as Fused-MBConv [29], which effectively minimizes information loss during downsampling and preserves important details. EfficientNetV2 is trained using a compound scaling strategy and features a hierarchical progressive structure that enhances the model’s ability to capture global contextual information while extracting multi-level detailed and semantic features. These characteristics facilitate the segmentation of objects of varying sizes and shapes.
Then, we design a residual multi-branch dilated attention (RMDA) module to suppress irrelevant background information and highlight specific pancreatic features. RMDA employs multi-branch dilated convolutions to capture multi-scale pancreatic features from deep semantic representations. This enables the attention mechanism to more effectively guide the network’s focus on critical pancreatic regions across multiple scales, rather than being confined to a single scale. Additionally, RepVGG [30] blocks with a multi-branch structure are introduced into the decoder, where they are responsible for fusing the extracted features and effectively restoring image details. We term our network as ERR-Net (EfficientNetV2-RMDA-RepVGG-Net). The proposed method is experimentally evaluated on two public pancreas datasets and compared with other advanced methods. What’s more, the re-parameterization has been implemented on the trained network, which not only lowers the number of network parameters and FLOPs, but also saves memory overhead and speeds up inference. The primary contributions of our work can be summed up as follows:
1. A novel network based on EfficientNetV2 and multi-branch structure, ERR-Net, is proposed for pancreatic segmentation.
2. We adopt EfficientNetV2 as the encoder and modify it to extract and preserve pancreatic features of varying sizes and shapes, improving the capabilities of extracting complex features and representation learning, as well as the computational efficiency.
3. A multi-branch structure RMDA is designed to act on skip connections, suppressing irrelevant background noise and highlighting useful pancreatic features. Meanwhile, RepVGG blocks are introduced in the decoder to fuse features from both deep and shallow layers, effectively restoring detailed information about the pancreas. Furthermore, by utilizing re-parameterization, the entire model has made improvement in lightweight, with fewer parameters, less computation, and faster inference speed.
The remainder of this paper is organized as follows. Section 2 briefly reviews the related work. Section 3 describes our approach and Section 4 presents the experimental results. Section 5 contains a brief discussion. Finally, Section 6 draws conclusions.
Pancreas segmentation is part of the medical image analysis field and serves as the foundation for further pancreas-related diagnosis [31]. With further research, various techniques have been presented to perform abdominal pancreas segmentation. Traditional pancreas segmentation methods, such as atlas [32], region growth [5] and simple linear iterative clustering [33], are reliant on manual extraction of features or human involvement during the segmentation procedure. Due to the disadvantages of low accuracy, time-consuming, and missing automation, they have been replaced by the quickly evolving deep learning. Especially, significant improvements have been brought to pancreas segmentation by CNN-based techniques because of CNN’s strong model capabilities to fit various data distributions. Specifically, the pancreatic segmentation models can be separated into one-stage and two-stage models based on the various stages of the model.
Gibson et al. [34] presented the DenseVNet segmentation network, which enabled high-resolution activation maps through feature reuse and memory-efficient dropout. Attention Gate [19] was integrated into 3D U-Net to suppress unrelated regions while highlighting significant features during the segmenting pancreas. Fang et al. [12] developed a globally guided progressive fusion network in which the encoder utilized 3D convolution to extract the features, while the decoder employed 2D convolution to conserve memory consumption. Although 3D convolutions can learn the three-dimensional spatial relationships of the pancreas, they face challenges related to substantial computational expenses and GPU memory consumption. Due to the tiny size of the pancreas itself, some convolution operations are computationally wasted. Zheng et al. [35] proposed using shadowed sets to identify the uncertain regions of the result of pancreas segmentation and calculate the weight for them. During training, the weight was employed to induce the network to focus more on the uncertain areas of the pancreas. Huang et al. [36] designed a lightweight network for pancreatic segmentation by merging U-Net and MobileNet-V2 [37]. Before training, they cropped the image according to the centroid and fed it into the segmentation network. Although the model has a relatively low parameter count of 6.3 million, its segmentation accuracy remains insufficient. Liu et al. [23] utilized 2D VGGU-Net to obtain the position of the liver, kidney, and spleen, calculating the contour center points of the three abdominal organs in each CT slice. They are used to dynamically construct candidate boxes for the pancreas and crop redundant backgrounds. However, the inaccurately cropped regions will affect the model’s segmentation performance, and this approach requires a lot of preparation work before segmenting the pancreas.
As the pancreas and pancreatic tumors make up a minor fraction of the original input data, a significant pixel imbalance occurs. Therefore, the two-stage framework has been proposed by some researchers. Yu et al. [38] proposed a multi-stage saliency segmentation method, which recurrently uses the segmentation mask of the current stage to refine the cropping and segmentation results in the subsequent stage. Chen et al. [39] presented the feature propagation and fusion network (FPF-Net) for extracting features. It employed two similar networks for detecting and segmenting the pancreas, which increased the number of network parameters and complexity. A deep U-Net is used by Qiu et al. [40] to locate the pancreas and crop CT images during the coarse-stage. And they designed the residual transformer [41] UNet (RTUNet) to extract multi-scale characteristics from a global perspective that captures large position changes of the pancreas. However, this model requires a long training time of 48 h and is highly dependent on the segmentation outcomes from the coarse-stage network. Zheng et al. [42] introduced an extension-contraction transformation network (ECTN) within a two-stage cascaded framework to achieve accurate pancreatic segmentation. However, they come with a significant increase in parameter count, growing geometrically compared to 2D networks, which presents challenges in terms of computational efficiency.
This section consists of two main components: data pre-processing and network architecture design. Take note that our proposed approach is grounded in 2D manipulations. Therefore, all CT volumes are divided into 2D slices and the axial slices are used to train our models.
Before training the model, the data pre-processing is carried out on the pancreas dataset to obtain candidate regions of the pancreas, minimize the impact of noise, and enhance the presentation of the pancreas. The process of data pre-processing is presented in Fig. 2a. It is mostly composed of the following steps:

Figure 2: (a) The diagram depicting the pipeline of data pre-processing; (b) The image display of the pre-processing result. Note: The red rectangular box contains the region of the pancreas. After pre-processing, the pancreatic region appears more distinct, and certain background information has been removed
(1) The statistical analysis is conducted on the quantity of slices in pancreas CT scans. In the NIH dataset, there are 7059 slices with pancreatic masks in the axial view, and the count of slices with pancreatic labels varies between 46 and 145 for each case. To ease the problem of low contrast between pancreas and the adjacent abdominal organs, according to some research works [23,43], the CT values are truncated to [−100, 240] Hounsfield Unit (HU). From Fig. 2b, it is evident that the clarity of the pancreatic area has been notably improved. The CT values are normalized to the range of [0, 1] when converting them to pixel values.
(2) The candidate regions selected in this method are based on the positions of the pancreas. In NIH dataset, the pancreas position ranges from 167 to 405 in the
(3) Some data augmentation techniques are adopted to enhance the robustness of models and alleviate the over-fitting during network training, including Random Scaling, Horizontal Flip, Gaussian Blur, and Random Rotation. These techniques are chosen to introduce variability in object size, orientation, and image quality, simulating the natural variations typically observed in medical images. While advanced augmentation methods like Mixup and CutMix, which generate synthetic samples through interpolation, were considered, they were not included in this study.
3.2 ERR-Net Network Architecture
ERR-Net adopts a symmetrical encoder-decoder architecture and skip connections. As shown in Fig. 3, the adjusted EfficientNetV2 is employed as the encoder to extract the complicated multi-level features of the pancreas. The encoder has five outputs, namely five kind feature maps of original size, 1/2, 1/4, 1/8, and 1/16. 1/16 size of the feature maps serve as the input of the decoder, while the remaining four feature maps are preserved to fused with the features of the decoding end.

Figure 3: The network architecture of ERR-Net.
We design an RMDA module and insert it into the four skip connections. In this module, multi-scale semantic information from deeper layers is guided to pay attention to the target region. Then, the feature maps from the shallow layers will be re-weighted to suppress irrelevant features and highlight pancreatic features.
During the process of decoding, the sizes of the feature maps are doubled using upsampling and progressively recovering to the original image resolution. Four enhanced encoding features are concatenated with the upsampled feature representations, and RepVGG blocks are introduced to fuse deep semantic features and shallow detail information, improving detail recovery in segmentation. Lastly, through a
EfficientNetV2, a new family of convolutional neural architectures that represents an improved version of the previous EfficientNet [44] models. Due to non-uniform scaling and training-aware neural architecture search (NAS), EfficientNetV2 has been dramatically boosted with regard to parameter efficiency and training speed. In this paper, we adopt and adjust the pre-trained EfficientNetV2-S as the encoder of our model. The reason for choosing the scale of S is that its training image size is 300 and the evaluation size is 384, which is closest to the image resolution of our training set. Moreover, it has the lightest network configuration and shortest inference time when compared to the other scales. With its powerful feature extraction capability, EfficientNetV2-S can effectively extract details and semantic information of targets, and handle significant alterations in the pancreatic morphology.
EfficientNetV2 extensively utilizes both MBConv [37] and the newly added Fused-MBConv in the early layers, which replaces the depthwise convolution and the expansion convolution of

Figure 4: The Structural display of MBConv and Fused-MBConv
EfficientNetV2-S is derived from EfficientNetV2 through non-uniform scaling, enhancing the capture of global context information and extracting abundant details and semantic features of the target. The network architecture of EfficientNetV2-S is shown in Table 1, where k represents the kernel size of the convolution, and the numbers behind Fused-MBConv and MBConv represent their expansion ratios. Only layers of stages 0 to 6 in EfficientNetV2-S are employed by ERR-Net. Given the compact size of the pancreas as a segmentation target, the down-sampling frequency of the entire encoder is determined to 4. Therefore, the stride is adjusted to 1 in our model instead of the original value of 2 in the first

3.4 Residual Multi-Branch Dilated Attention (RMDA)
While skip connections supply detailed information for the decoder, they may fail to draw attention to the crucial details. To suppress irrelevant background information and emphasize specific pancreatic features, we design and insert the RMDA module into skip connections, which performs re-weighted selection on shallow features based on the multi-scale deep semantic information.
Specifically, the network’s receptive field is enlarged by utilizing a multi-branch structure with parallel dilated convolutions, effectively capturing multi-scale information from the feature maps of the deep layers. And the semantic information extracted from deep layers is applied to eliminate irrelevant information, as the correlated information is fused in addition to highlighting crucial pancreatic features. Then, the weights of the low-level features are adjusted by means of calculating the attention coefficient. As shown in Fig. 5, after adopting RMDA, the model focuses more on the target region.
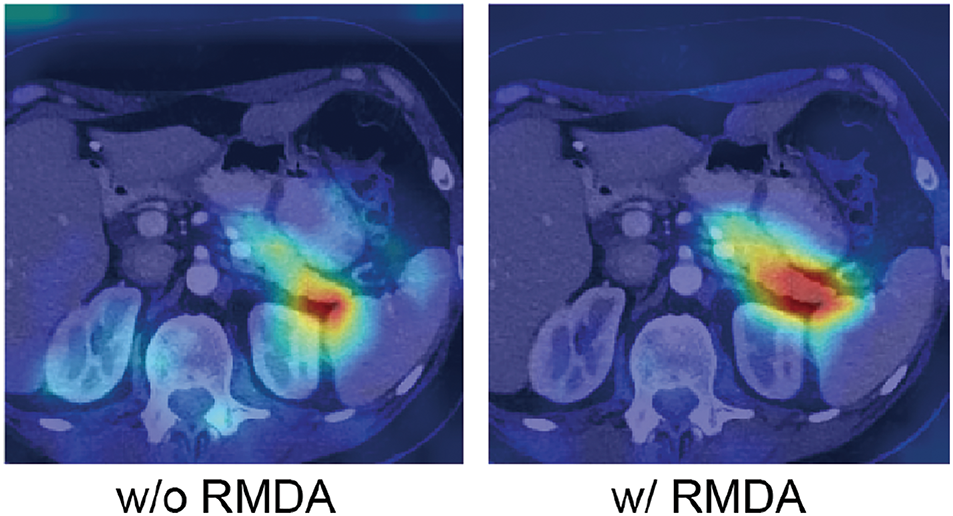
Figure 5: Visualization results of with RMDA
As shown in Fig. 6, the
where

Figure 6: Structure of Residual Multi-branch Dilated Attention (RMDA)
Meanwhile, the feature map
where
Thus, the weights of the features can be adjusted by calculating the dot product between the attention-weighted map
Since the values of the attention map
In the decoder of our model, RepVGG blocks are utilized instead of regular convolutions to integrate feature information from shallow and deep layers, helping to restore image details and refine pancreas segmentation. In the multi-branch structure, different branches can learn various representations, which makes the fused representations enriched and enhanced. As is shown in Fig. 7, the RepVGG blocks use

Figure 7: The process of structural re-parameterization in the RepVGG block
After training, the multi-branch structure is transformed through structural re-parameterization. Specifically, each branch in the RepVGG block passes through the BN layer during training, and the convolutional layers and BN layers can be merged. Eqs. (5) and (6) represent equations of the convolutional layer without bias and the BN layer, respectively. And Eq. (7) is the combination of the convolution and BN. The final fused operation is represented by Eq. (8).
where
After combining convolution and BN, the RepVGG block has only one
According to Ding et al. [30], it uses
NIH pancreas dataset [45]. Our method is tested and evaluated on the NIH pancreas dataset, which is an open-source collection consisting of 82 enhanced abdominal CT scans with a resolution of
MSD pancreas dataset [46]. Medical Segmentation Decathlon consists of ten medical image segmentation datasets, which are from different sections of the human body. The MSD pancreas tumor segmentation dataset contains labeled 281 volumetric data with the dimension of
All experiments are executed based on the environment of Python 3.7, PyTorch 1.7.1, and Ubuntu 20.04. Our models are trained on two Nvidia GeForce RTX 3090 GPUs, each with 24 GB of memory. We employ the learning rate scheduling strategy, Cosine Annealing, to dynamically adjust the learning rate, thereby improving the model’s convergence and overall performance. After preliminary experiments and considering both training time and model performance, the experimental parameters are set as shown in Table 2.

Four evaluation metrics Dice Similarity Coefficient (DSC), Intersection over Union (IoU), Precision, and Recall is leveraged to measure the model’s performance in segmenting the pancreas. Here are the definitions of these metrics:
(1) DSC calculates the spatial overlap between the predicted mask and ground truth.
(2) IoU computes the similarity between the segmentation mask and ground truth.
(3) Precision calculates the proportion of true positive predictions in the segmentation mask.
(4) Recall calculates the true positive rate within the ground truth annotations.
where TP, FN, and FP represent the true positives, false negatives, and false positives predicted for the pancreas, respectively.
In the experiments, Dice loss is employed to evaluate and optimize the training of segmentation models, which is derived from DSC. Because of the tiny volume of pancreas in the CT scans, there is a problem of class imbalance between the target and background. Therefore, Focal Loss [48] is utilized in our model to alleviate the pancreatic category imbalance problem. The combination of these two losses forms the final loss function of our network. It is writen as Eq. (14), where
4.5.1 Comparison with the State-of-the-Art
In this section, we compare our segmentation results with state-of-the-art methods. Table 3 presents the comparative outcomes of mean DSC, IoU, Precision, and Recall, including their standard deviation. It also displays the parameters and inference time of models. All experimental outcomes of other methods are sourced from the original papers or related studies.

As indicated in Table 3, our approach demonstrates highly competitive performance compared to the state-of-the-art methods. Among the compared approaches, the suggested algorithm scores the greatest DSC of
It is worth noting that our method sharply lowers the network parameters compared with most algorithms. Although the model of Cao et al. [51] has the fewest parameters, our approach outperforms theirs by 2.55%, 3.38%, and 2.15% in terms of average DSC, Precision, and Recall, respectively. And our network has a remarkable reduction in inference time. With only 0.052 s needed for inferring each slice, the inference speed of our network is extremely quick. Compared to the method of Hu et al. [25], our model has one-third the number of parameters and achieves six times the inference speed. This proves that our model not only performs well in segmentation accuracy but also has fewer parameters and faster inference speed.
Furthermore, Fig. 8 indicates the qualitative comparison of our approach with labels, where the red line represents the contours of ground truth and the blue line indicates the predicted edges of our model, respectively. It is evident that the shapes and boundaries of the final segmentation closely match the ground truth, whether for small, large, or discontinuous pancreatic regions.

Figure 8: The segmentation results of our method compared with labels. The red solid line represents the ground truth, and the blue solid line represents the predicted results
Our approach is also experimentally validated on the MSD pancreatic dataset to verify its effectiveness and generalization ability. The data undergoes the same preprocessing as the NIH dataset. As presented in Table 4, our method achieves superior segmentation accuracy, reaching the highest average DSC, IoU, and Recall of 82.7%, 71.25%, and 84.79%, respectively. Although our average Precision is not among the highest, the proposed method scores 83.1% in Precision and 84.79% in Recall, demonstrating a relatively balanced overall segmentation performance.

4.5.2 Comparison with the Classical Segmentation Models
In this experiment, we contrasted our model with the classical segmentation networks. They are PSPNet [53], DeeplabV3+ [54], SegFormer [55], and TransUNet [56]. It can be seen in Table 5, when compared with the two CNN-based models, PSPNet and DeeplabV3+, the performance of ours exhibits a substantial improvement in segmentation accuracy. Compared with two Transformer [41]-based models, SegFormer and TransUNet, our model achieves better segmentation performance. Although our Precision is 0.03% lower than that of TransUNet, our model shows superior accuracy in DSC, IoU, and Recall, while also exhibiting the lowest standard deviation. And the parameter count and FLOPs of our network are significantly lower than those of TransUNet, indicating that our model achieves an effective trade-off between segmentation accuracy and computational resource usage.

In order to clearly display the distribution of the segmentation outcomes of five models on NIH 82 cases, we provide four Box-Scatter Plots to visualize the results of four metrics. As is indicated in Fig. 9, each boxplot displays a distribution of model segmentation results. For instance, the green boxplot stands for the distribution of our segmentation outcomes. It presents a box shape where the upper whisker indicates the maximum value and the lower whisker indicates the minimum value of the data, both of them containing no outliers. The bottom of the box stands for the first quartile and the top of it represents the third quartile. The black lines inside all boxes represent the median of the results. Besides, the specific results of each sample are visually presented in scatter plots, allowing for a comprehensive understanding of the performance of the five models. A jitter is applied to prevent point overlap, ensuring clarity in data representation.

Figure 9: Box-Scatter Plots of five segmentation methods on four evaluation index
By contrasting the boxplots of the segmentation outcomes of five models, it is obvious that the value of median DSC, IoU, and Recall of our model significantly exceed 85%, 75% and 85% respectively, outperforming the segmentation outcomes of other models. Furthermore, our model has the smallest box size among the four evaluation metrics, reflecting the stability and consistency of our segmentation performance. Although the median Precision of TransUNet marginally exceeds that of our network, the majority of the segmentation outcomes from the proposed approach surpass 80%.
Fig. 10 provides a 3D qualitative comparison of the predicted outcomes from five different models. And the green circle highlights areas where other classical segmentation networks do not perform as well as ERR-Net. The displayed cases include Case 67, Case 71, and Case 79. In the three instances, PSPNet’s segmentation outcomes are subpar and different regions of each example display under-segmentation. For Case 67 and Case 79, DeepLabv3+ suffers from inaccurate boundary recognition when segmenting the pancreas, while an apparent over-segmentation occurrs in Case 71. In Case 67, it is obvious that both SegFormer and TransUNet show considerable over-segmentation. Our prediction result in Case 67 is closer to GT, despite the fact that our model also encounter a minor over-segmentation. Additionally, ERR-Net is capable of segmenting the pancreas more accurately, particularly in cases with intricate features, compared to the segmentation results of SegFormer and TransUNet in Case 79. As we can see, in the three cases, ERR-Net produces segmentation masks that are very similar to GT. This implies that our model can not only effectively extract pancreatic features of various shapes and sizes, but also maintain stability under complex backgrounds interference, and achieve more accurate segmentation of the pancreas.

Figure 10: Comparison of 3D segmentation outcomes from different models. The green circles mark the regions where the segmentation masks of other models are less precise than ours
Several ablation experiments are carried out in order to evaluate the contributions of each component in our model. Table 6 summarizes the experimental results of different network configurations. For fair comparisons, we keep the training parameter settings unchanged with only modules being replaced or added. And all of them are running in the same environment.
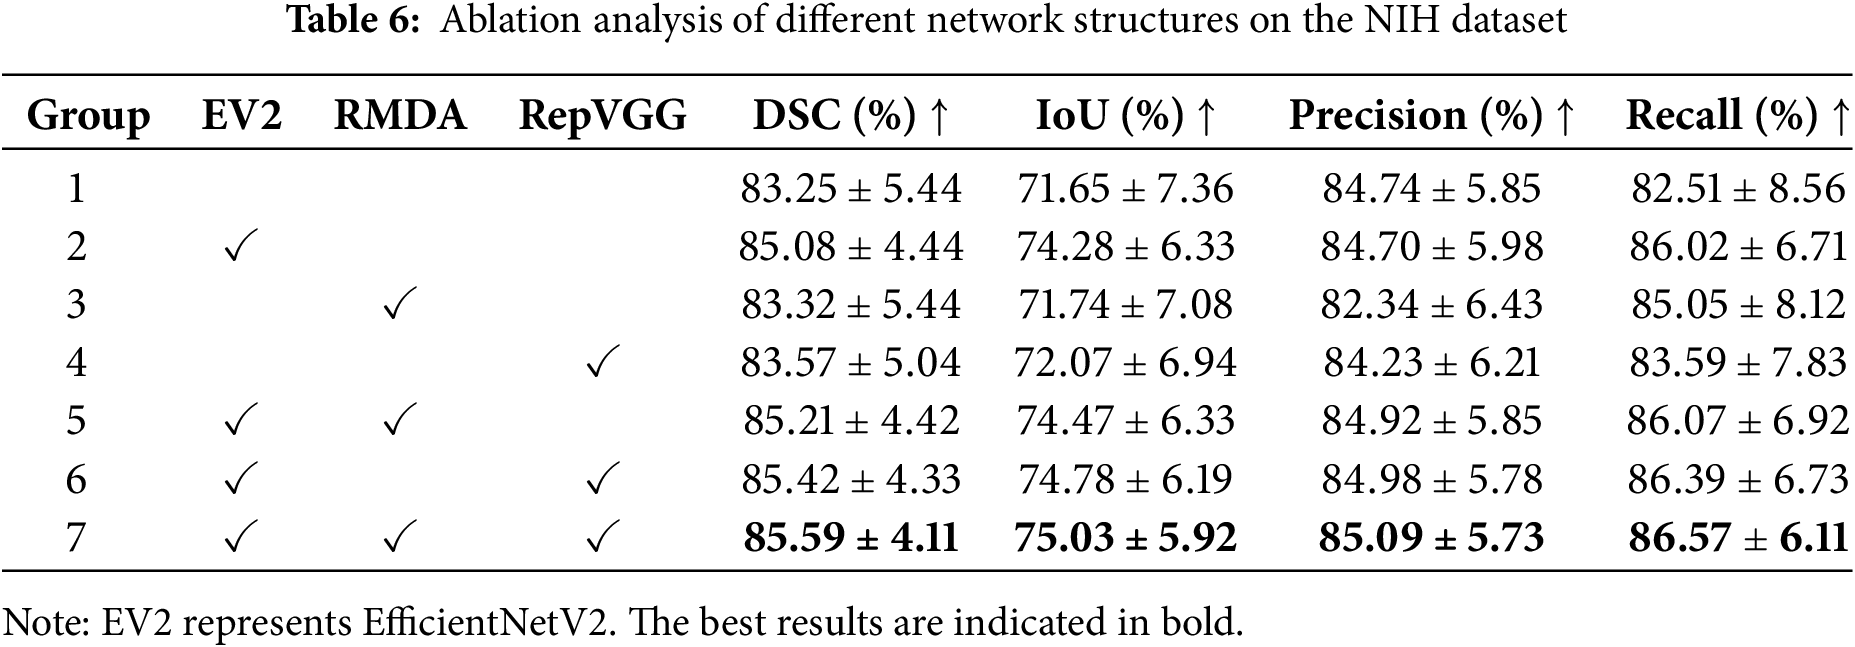
The first group represents the segmentation results of U-Net. By replacing the encoder of U-Net with the adjusted EfficientNetV2, the metrics increase 1.83% on DSC, 2.63% on IoU, and 3.51% on Recall, respectively. The significant increments reflect the powerful feature extraction capability of EfficientNetV2. From the third and fourth groups, it can be seen that simply adding the RMDA or RepVGG module leads to improvements in the average DSC, IoU, and Recall. On the basis of EfficientNetV2, by incorporating the RMDA module to the skip connections, the segmentation accuracy sees an increase of 0.13% on DSC, 0.19% on IoU, 0.22% on Precision, and 0.05% on Recall. Similarly, the use of RepVGG blocks boosts accuracy over EfficientNetV2 by 0.34% on DSC, 0.5% on IoU, 0.28% on Precision, and 0.37% on Recall. With the inclusion of EfficientNetV2, RepVGG, and RMDA, our model produces superior performance for pancreas segmentation. Compared with the baseline U-Net, the mean DSC, IoU, Precision, and Recall of our model achieve the growths of 2.34%, 3.38%, 0.35%, and 4.06%, respectively. In addition, all segmentation indicators of our network have the smallest standard deviation. The growth in these metrics suggests the modules we utilized can enhance pancreatic segmentation accuracy.
We qualitatively illustrate the segmentation outcomes of different network settings using three scenarios, namely Case 20, Case 57, and Case 68. Fig. 11 visualizes their 3D segmentation results. Specifically, the comparison between the columns (a) and (b) indicates that EfficientNetV2, as the encoder, outperforms U-Net in fitting the overall shape of the pancreas and is better equipped to handle complex situations with significant variations in pancreatic shape and size, leading to a more precise overall segmentation of the pancreas modality. When analyzing the columns (b) and (c), by combining the designed RMDA module with EfficientNetV2, certain pancreatic regions are segmented more accurately. Similarly, the introduction of RepVGG improves the recovery of pancreas detail information compared to using EfficientNetV2 alone, as evidenced by the contrast of the columns (b) and (d). As seen in the last two columns, our model performs more effectively when segmenting the three cases of the pancreas with varying morphologies.

Figure 11: Comparison of 3D prediction results of different network structures. (a) U-Net; (b) U-Net+EV2; (c) U-Net+EV2+RMDA; (d) U-Net+EV2+RepVGG; (e) Ours; (f) Ground truth
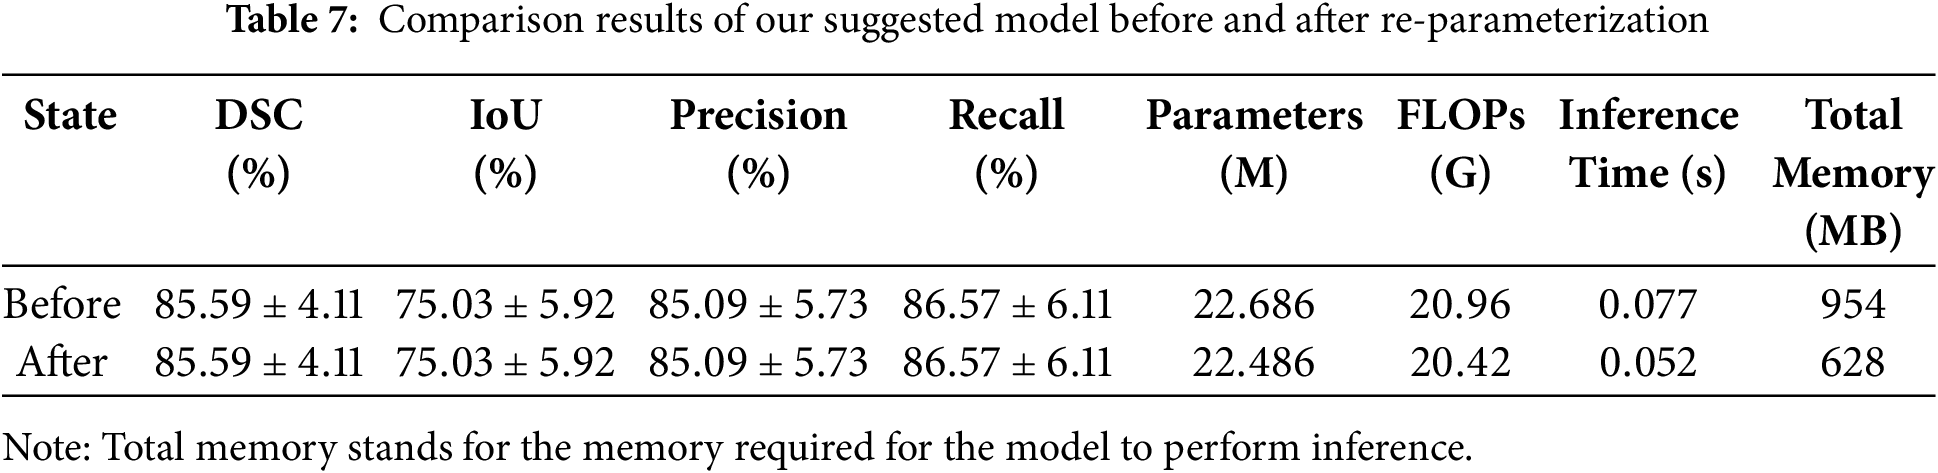
In this section, we have accomplished re-parameterization on the trained model. As mentioned in Section 3.5, the structural re-parameterization technique makes it feasible to convert the RepVGG modules, into single path modules containing only
Table 7 displays the comparison results of our network on the NIH dataset before and after re-parameterization. According to Table 7, it can be seen that both before and after the re-parameterization procedure, the values of the four assessment indicators for the model’s segmentation accuracy remain the same. Compared with the training phase, the inference phase of the model has fewer parameters and requires less computation, with a reduction of 0.2 million parameters and 0.54 G FLOPs. This improves the efficiency of network inference and lightens the pancreatic segmentation model. Compared to the trained model, which has an inference time of 0.077 s per slice, the inference time of the re-parameterized model has been reduced to 0.052 s per slice. This indicates that our model can assist doctors in performing fast and accurate pancreatic segmentation in CT images, alleviate the pressure on doctors in clinical practice, and improve the efficiency of disease diagnosis. Additionally, the model’s memory requirement for reasoning has decreased by 326 MB, from 954 to 628 MB. This not only significantly lowers the amount of memory used, but it also lessens the reliance of the pancreas segmentation model on resources and equipment, which is more beneficial for segmentation model deployment and resource conservation in clinical applications.
Although our model has improved in terms of accuracy and efficiency for pancreatic segmentation, the prediction results are not ideal in some specific cases. This negatively impacts the mean segmentation accuracy. As shown in Fig. 12, despite the preprocessing, the contrast between the pancreas and surrounding tissues remains extremely low. Due to the blurred boundaries, and small and discontinuous pancreatic region, it is difficult for the model to accurately segment the target. Additionally, the model does not incorporate pancreatic information from the coronal and sagittal views during segmentation, which leads to under-segmentation when constructing the 3D segmentation results. Improving the connection between pancreatic slices and the extraction of spatial three-dimensional context will be the main goal of future research.

Figure 12: (a) Original CT image; (b) preprocessed CT image; (c) ground truth; (d) predicted result
In this work, we propose a novel approach for segmenting the pancreas from CT images. Firstly, we generate candidate regions according to position distribution to remove certain unnecessary backgrounds. Then, an EfficientNetV2 is employed as the encoder to capture the diverse and multi-level pancreatic features, improving the modeling capability of the pancreas’s complex morphology. The RMDA module is crafted to emphasize the useful pancreatic features. After that, RepVGG is introduced in the decoder to fuse features from deep and shallow layers and restore detailed information about the pancreas. Additionally, the trained model has been re-parameterized, which not only reduces the number of parameters and FLOPs but also accelerates inference speed and saves memory usage. The quantitative and qualitative comparison with advanced methods and classical networks proves the superiority and stability of our approach.
Acknowledgement: Not applicable.
Funding Statement: This work was supported by the Science and Technology Innovation Program of Hunan Province (Grant No. 2022RC1021), the Hunan Provincial Natural Science Foundation Project (Grant No. 2023JJ60124), the Changsha Natural Science Foundation Project (Grant No. kq2202265), and the key project of the Hunan Provincial of Education (Grant No. 22A0255).
Author Contributions: Panru Liang: Conceptualization, Methodology, Software, Writing—original draft, Writing—review & editing, Visualization, Formal analysis. Guojiang Xin: Writing—review & editing, Supervision, Methodology, Resources. Xiaolei Yi: Validation, Formal analysis, Conceptualization. Hao Liang: Supervision, Investigation, Funding acquisition. Changsong Ding: Supervision, Formal analysis, Funding acquisition. All authors reviewed the results and approved the final version of the manuscript.
Availability of Data and Materials: The NIH dataset is openly available in the Cancer Imaging Archive (TCIA) at https://www.cancerimagingarchive.net/collection/pancreas-ct/ (accessed on 08 February 2025). The MSD dataset is available from http://medicaldecathlon.com/ (accessed on 08 February 2025).
Ethics Approval: Not applicable.
Conflicts of Interest: The authors declare no conflicts of interest to report regarding the present study.
References
1. Adamopoulos C, Cave DD, Papavassiliou AG. Inhibition of the RAF/MEK/ERK signaling cascade in pancreatic cancer: recent advances and future perspectives. Int J Mol Sci. 2024;25(3):1631. doi:10.3390/ijms25031631. [Google Scholar] [PubMed] [CrossRef]
2. Liu S, Liang S, Huang X, Yuan X, Zhong T, Zhang Y. Graph-enhanced U-Net for semi-supervised segmentation of pancreas from abdomen CT scan. Phys Med Biol. 2022;67(15):155017. doi:10.1088/1361-6560/ac80e4. [Google Scholar] [PubMed] [CrossRef]
3. Chu LC, Goggins MG, Fishman EK. Diagnosis and detection of pancreatic cancer. Cancer J. 2017;23(6):333–42. doi:10.1097/PPO.0000000000000290. [Google Scholar] [PubMed] [CrossRef]
4. Li H, Li J, Lin X, Qian X. A model-driven stack-based fully convolutional network for pancreas segmentation. In: 2020 5th International Conference on Communication, Image and Signal Processing (CCISP); 2020; Chengdu, China: IEEE. p. 288–93. doi:10.1109/CCISP51026.2020.9273498. [Google Scholar] [CrossRef]
5. Tam TD, Binh NT. Efficient pancreas segmentation in computed tomography based on region-growing. In: Nature of Computation and Communication: International Conference, ICTCC 2014; 2014 Nov 24–25; Ho Chi Minh City, Vietnam; 2015. p. 332–40. [Google Scholar]
6. Shan X, Du C, Chen Y, Nandi A, Gong X, Ma C. Threshold algorithm for pancreas segmentation in Dixon water magnetic resonance images. In: 2017 13th International Conference on Natural Computation, Fuzzy Systems and Knowledge Discovery (ICNC-FSKD); 2017; Guilin, China: IEEE. p. 2367–71. doi:10.1109/FSKD.2017.8393142. [Google Scholar] [CrossRef]
7. Karasawa K, Kitasaka T, Oda M, Nimura Y, Hayashi Y, Fujiwara M. Structure specific atlas generation and its application to pancreas segmentation from contrasted abdominal CT volumes. In: Medical Computer Vision: Algorithms for Big Data: International Workshop, MCV 2015; 2015 Oct 9; Munich, Germany. 2016. p. 47–56. [Google Scholar]
8. Li X, Chen H, Qi X, Dou Q, Fu CW, Heng PA. H-DenseUNet: hybrid densely connected UNet for liver and tumor segmentation from CT volumes. IEEE Trans Med Imag. 2018;37(12):2663–74. doi:10.1109/TMI.2018.2845918. [Google Scholar] [PubMed] [CrossRef]
9. Zhao C, Xu Y, He Z, Tang J, Zhang Y, Han J. Lung segmentation and automatic detection of COVID-19 using radiomic features from chest CT images. Pattern Recognit. 2021;119:108071. doi:10.1016/j.patcog.2021.108071. [Google Scholar] [PubMed] [CrossRef]
10. Yamanakkanavar N, Lee B. A novel M-SegNet with global attention CNN architecture for automatic segmentation of brain MRI. Comput Biol Med. 2021;136(1):104761. doi:10.1016/j.compbiomed.2021.104761. [Google Scholar] [PubMed] [CrossRef]
11. Roth HR, Oda H, Zhou X, Shimizu N, Yang Y, Hayashi Y. An application of cascaded 3D fully convolutional networks for medical image segmentation. Comput Med Imag Graph. 2018;66(1):90–9. doi:10.1016/j.compmedimag.2018.03.001. [Google Scholar] [PubMed] [CrossRef]
12. Fang C, Li G, Pan C, Li Y, Yu Y. Globally guided progressive fusion network for 3D pancreas segmentation. In: Medical Image Computing and Computer Assisted Intervention-MICCAI 2019: 22nd International Conference; 2019 Oct 13–17; Shenzhen, China. p. 210–8. [Google Scholar]
13. Mo J, Zhang L, Wang Y, Huang H. Iterative 3D feature enhancement network for pancreas segmentation from CT images. Neural Comput Appl. 2020;32(16):12535–46. doi:10.1007/s00521-020-04710-3. [Google Scholar] [CrossRef]
14. Ronneberger O, Fischer P, Brox T. U-net: convolutional networks for biomedical image segmentation. In: Medical Image Computing and Computer-Assisted Intervention-MICCAI 2015: 18th International Conference; 2015 Oct 5–9; Munich, Germany. p. 234–41. [Google Scholar]
15. Li M, Lian F, Guo S. Pancreas segmentation based on an adversarial model under two-tier constraints. Phys Med Biol. 2020;65(22):225021. doi:10.1088/1361-6560/abb6bf. [Google Scholar] [PubMed] [CrossRef]
16. Li F, Li W, Shu Y, Qin S, Xiao B, Zhan Z. Multiscale receptive field based on residual network for pancreas segmentation in CT images. Biomed Signal Process Control. 2020;57:101828. doi:10.1016/j.bspc.2019.101828. [Google Scholar] [CrossRef]
17. Li M, Lian F, Wang C, Guo S. Accurate pancreas segmentation using multi-level pyramidal pooling residual U-Net with adversarial mechanism. BMC Med Imag. 2021;21(1):1–8. doi:10.1186/s12880-021-00694-1. [Google Scholar] [PubMed] [CrossRef]
18. Wang Y, Zhang J, Cui H, Zhang Y, Xia Y. View adaptive learning for pancreas segmentation. Biomed Signal Process Control. 2021;66(9):102347. doi:10.1016/j.bspc.2020.102347. [Google Scholar] [CrossRef]
19. Schlemper J, Oktay O, Schaap M, Heinrich M, Kainz B, Glocker B. Attention gated networks: learning to leverage salient regions in medical images. Medical Image Anal. 2019;53(7639):197–207. doi:10.1016/j.media.2019.01.012. [Google Scholar] [PubMed] [CrossRef]
20. Maji D, Sigedar P, Singh M. Attention Res-UNet with guided decoder for semantic segmentation of brain tumors. Biomed Signal Process Control. 2022;71:103077. doi:10.1016/j.bspc.2021.103077. [Google Scholar] [CrossRef]
21. Yan Y, Zhang D. Multi-scale U-like network with attention mechanism for automatic pancreas segmentation. PLoS One. 2021;16(5):e0252287. doi:10.1371/journal.pone.0252287. [Google Scholar] [PubMed] [CrossRef]
22. Li M, Lian F, Li Y, Guo S. Attention-guided duplex adversarial U-net for pancreatic segmentation from computed tomography images. J Appl Clin Med Phys. 2022;23(4):e13537. doi:10.1002/acm2.13537. [Google Scholar] [PubMed] [CrossRef]
23. Liu Z, Su J, Wang R, Jiang R, Song YQ, Zhang D. Pancreas Co-segmentation based on dynamic ROI extraction and VGGU-Net. Expert Syst Appl. 2022;192(11):116444. doi:10.1016/j.eswa.2021.116444. [Google Scholar] [CrossRef]
24. Liu S, Yuan X, Hu R, Liang S, Feng S, Ai Y. Automatic pancreas segmentation via coarse location and ensemble learning. IEEE Access. 2019;8:2906–14. doi:10.1109/ACCESS.2019.2961125. [Google Scholar] [CrossRef]
25. Hu P, Li X, Tian Y, Tang T, Zhou T, Bai X. Automatic pancreas segmentation in CT images with distance-based saliency-aware DenseASPP network. IEEE J Biomed Health Inform. 2021;25(5):1601–11. doi:10.1109/JBHI.2020.3023462. [Google Scholar] [PubMed] [CrossRef]
26. Chen H, Liu Y, Shi Z, Lyu Y. Pancreas segmentation by two-view feature learning and multi-scale supervision. Biomed Signal Process Control. 2022;74(3):103519. doi:10.1016/j.bspc.2022.103519. [Google Scholar] [CrossRef]
27. Dai S, Zhu Y, Jiang X, Yu F, Lin J, Yang D. TD-Net: trans-deformer network for automatic pancreas segmentation. Neurocomputing. 2023;517(8):279–93. doi:10.1016/j.neucom.2022.10.060. [Google Scholar] [CrossRef]
28. Yang M, Yu K, Zhang C, Li Z, Yang K. Denseaspp for semantic segmentation in street scenes. In: Proceedings of the IEEE Conference on Computer Vision and Pattern Recognition; 2018; Salt Lake City, UT, USA. p. 3684–92. [Google Scholar]
29. Tan M, Le Q. EfficientNetV2: smaller models and faster training. In: International Conference on Machine Learning; 2021; Virtual Conference: PMLR. Vol. 139, p. 10096–106. [Google Scholar]
30. Ding X, Zhang X, Ma N, Han J, Ding G, Sun J. Repvgg making vgg-style convnets great again. In: Proceedings of the IEEE/CVF Conference on Computer Vision and Pattern Recognition (CVPR); 2021; Nashville, TN, USA. p. 13733–42. [Google Scholar]
31. Guo Z, Zhang L, Lu L, Bagheri M, Summers RM, Sonka M. Deep LOGISMOS: deep learning graph-based 3D segmentation of pancreatic tumors on CT scans. In: 2018 IEEE 15th International Symposium on Biomedical Imaging (ISBI 2018); 2018; Washington, DC, USA: IEEE. p. 1230–3. doi:10.1109/ISBI.2018.8363793. [Google Scholar] [CrossRef]
32. Karasawa K, Oda M, Kitasaka T, Misawa K, Fujiwara M, Chu C. Multi-atlas pancreas segmentation: atlas selection based on vessel structure. Med Image Anal. 2017;39(3):18–28. doi:10.1016/j.media.2017.03.006. [Google Scholar] [PubMed] [CrossRef]
33. Farag A, Lu L, Turkbey E, Liu J, Summers RM. A bottom-up approach for automatic pancreas segmentation in abdominal CT scans. In: Abdominal Imaging. Computational and Clinical Applications: 6th International Workshop, ABDI 2014; 2014 Sep 14; Cambridge, MA, USA. p. 103–13. [Google Scholar]
34. Gibson E, Giganti F, Hu Y, Bonmati E, Bandula S, Gurusamy K. Automatic multi-organ segmentation on abdominal CT with dense V-networks. IEEE Trans Med Imag. 2018;37(8):1822–34. doi:10.1109/TMI.2018.2806309. [Google Scholar] [PubMed] [CrossRef]
35. Zheng H, Chen Y, Yue X, Ma C, Liu X, Yang P. Deep pancreas segmentation with uncertain regions of shadowed sets. Magn Reson Imag. 2020;68:45–52. doi:10.1016/j.mri.2020.01.008. [Google Scholar] [PubMed] [CrossRef]
36. Huang ML, Wu YZ. Semantic segmentation of pancreatic medical images by using convolutional neural network. Biomed Signal Process Control. 2022;73(1):103458. doi:10.1016/j.bspc.2021.103458. [Google Scholar] [CrossRef]
37. Sandler M, Howard A, Zhu M, Zhmoginov A, Chen LC. MobileNetV2: inverted residuals and linear bottlenecks. In: Proceedings of the IEEE Conference on Computer Vision and Pattern Recognition; 2018; Salt Lake City, UT, USA. p. 4510–20. [Google Scholar]
38. Yu Q, Xie L, Wang Y, Zhou Y, Fishman EK, Yuille AL. Recurrent saliency transformation network: incorporating multi-stage visual cues for small organ segmentation. In: Proceedings of the IEEE Conference on Computer Vision and Pattern Recognition; 2018; Salt Lake City, UT, USA. p. 8280–9. [Google Scholar]
39. Chen H, Liu Y, Shi Z. FPF-Net: feature propagation and fusion based on attention mechanism for pancreas segmentation. Multimed Syst. 2023;29(2):525–38. doi:10.1007/s00530-022-00963-1. [Google Scholar] [CrossRef]
40. Qiu C, Liu Z, Song Y, Yin J, Han K, Zhu Y. RTUNet: residual transformer UNet specifically for pancreas segmentation. Biomed Signal Process Control. 2023;79(1):104173. doi:10.1016/j.bspc.2022.104173. [Google Scholar] [CrossRef]
41. Vaswani A, Shazeer N, Parmar N, Uszkoreit J, Jones L, Gomez AN. Attention is all you need. In: Advances in neural information processing systems. Vol. 30. Long Beach, CA, USA: Curran Associates, Inc; 2017. [Google Scholar]
42. Zheng Y, Luo J. Extension-contraction transformation network for pancreas segmentation in abdominal CT scans. Comput Biol Med. 2023;152(10039):106410. doi:10.1016/j.compbiomed.2022.106410. [Google Scholar] [PubMed] [CrossRef]
43. Xie L, Yu Q, Zhou Y, Wang Y, Fishman EK, Yuille AL. Recurrent saliency transformation network for tiny target segmentation in abdominal CT scans. IEEE Trans Med Imag. 2019;39(2):514–25. doi:10.1109/TMI.2019.2930679. [Google Scholar] [PubMed] [CrossRef]
44. Tan M, Le Q. Efficientnet: rethinking model scaling for convolutional neural networks. In: International Conference on Machine Learning; 2019; Long Beach, CA, USA: PMLR. p. 6105–14. [Google Scholar]
45. Roth HR, Lu L, Farag A, Shin HC, Liu J, Turkbey EB. Deeporgan: multi-level deep convolutional networks for automated pancreas segmentation. In: Medical Image Computing and Computer-Assisted Intervention-MICCAI 2015: 18th International Conference; 2015 Oct 5–9; Munich, Germany. p. 556–64. [Google Scholar]
46. Simpson AL, Antonelli M, Bakas S, Bilello M, Farahani K, Van Ginneken B. A large annotated medical image dataset for the development and evaluation of segmentation algorithms. arXiv:190209063. 2019. [Google Scholar]
47. Li J, Lin X, Che H, Li H, Qian X. Pancreas segmentation with probabilistic map guided bi-directional recurrent UNet. Phys Med Biol. 2021;66(11):115010. doi:10.1088/1361-6560/abfce3. [Google Scholar] [PubMed] [CrossRef]
48. Chen L, Wan L. CTUNet: automatic pancreas segmentation using a channel-wise transformer and 3D U-Net. Vis Comput. 2023;39(11):5229–43. doi:10.1007/s00371-022-02656-2. [Google Scholar] [CrossRef]
49. Cai J, Lu L, Xing F, Yang L. Pancreas segmentation in CT and MRI via task-specific network design and recurrent neural contextual learning. In: Deep Learning and Convolutional Neural Networks for Medical Imaging and Clinical Informatics; 2019; Cham, Switzerland: Springer. p. 3–21. [Google Scholar]
50. Zhang D, Zhang J, Zhang Q, Han J, Zhang S, Han J. Automatic pancreas segmentation based on lightweight DCNN modules and spatial prior propagation. Pattern Recognit. 2021;114(6):107762. doi:10.1016/j.patcog.2020.107762. [Google Scholar] [CrossRef]
51. Cao L, Li J, Chen S. Multi-target segmentation of pancreas and pancreatic tumor based on fusion of attention mechanism. Biomed Signal Process Control. 2023;79:104170. doi:10.1016/j.bspc.2022.104170. [Google Scholar] [CrossRef]
52. Li J, Chen T, Qian X. Generalizable pancreas segmentation modeling in CT imaging via meta-learning and latent-space feature flow generation. IEEE J Biomed Health Inform. 2023;27(1):374–85. doi:10.1109/JBHI.2022.3207597. [Google Scholar] [PubMed] [CrossRef]
53. Zhao H, Shi J, Qi X, Wang X, Jia J. Pyramid scene parsing network. In: Proceedings of the IEEE Conference on Computer Vision and Pattern Recognition (CVPR); 2017; Honolulu, HI, USA. p. 6230–9. [Google Scholar]
54. Chen LC, Zhu Y, Papandreou G, Schroff F, Adam H. Encoder-decoder with atrous separable convolution for semantic image segmentation. In: Proceedings of the European Conference on Computer Vision (ECCV); 2018; Munich, Germany. p. 801–18. [Google Scholar]
55. Xie E, Wang W, Yu Z, Anandkumar A, Alvarez JM, Luo P. SegFormer: simple and efficient design for semantic segmentation with transformers. Adv Neural Inform Process Syst 2021;34:12077–90. [Google Scholar]
56. Chen J, Lu Y, Yu Q, Luo X, Adeli E, Wang Y. TransUNet: transformers make strong encoders for medical image segmentation. arXiv:210204306. 2021. [Google Scholar]
Cite This Article
 Copyright © 2025 The Author(s). Published by Tech Science Press.
This work is licensed under a Creative Commons Attribution 4.0 International License , which permits unrestricted use, distribution, and reproduction in any medium, provided the original work is properly cited.
 Downloads
 Citation Tools