
 Submit a Paper
 Propose a Special lssue
 Open Access
ARTICLE
Dynamic Spatial Focus in Alzheimer’s Disease Diagnosis via Multiple CNN Architectures and Dynamic GradNet
Department of Computer Science, College of Computers and Information Technology, Taif University, Taif, 21944, Saudi Arabia
* Corresponding Author: Jasem Almotiri. Email:
(This article belongs to the Special Issue: Cutting-Edge Machine Learning and AI Innovations in Medical Imaging Diagnosis)
Computers, Materials & Continua 2025, 83(2), 2109-2142. https://doi.org/10.32604/cmc.2025.062923
Received 31 December 2024; Accepted 17 March 2025; Issue published 16 April 2025
 View Full Text
 Download PDF
Abstract
The evolving field of Alzheimer’s disease (AD) diagnosis has greatly benefited from deep learning models for analyzing brain magnetic resonance (MR) images. This study introduces Dynamic GradNet, a novel deep learning model designed to increase diagnostic accuracy and interpretability for multiclass AD classification. Initially, four state-of-the-art convolutional neural network (CNN) architectures, the self-regulated network (RegNet), residual network (ResNet), densely connected convolutional network (DenseNet), and efficient network (EfficientNet), were comprehensively compared via a unified preprocessing pipeline to ensure a fair evaluation. Among these models, EfficientNet consistently demonstrated superior performance in terms of accuracy, precision, recall, and F1 score. As a result, EfficientNet was selected as the foundation for implementing Dynamic GradNet. Dynamic GradNet incorporates gradient weighted class activation mapping (GradCAM) into the training process, facilitating dynamic adjustments that focus on critical brain regions associated with early dementia detection. These adjustments are particularly effective in identifying subtle changes associated with very mild dementia, enabling early diagnosis and intervention. The model was evaluated with the OASIS dataset, which contains greater than 80,000 brain MR images categorized into four distinct stages of AD progression. The proposed model outperformed the baseline architectures, achieving remarkable generalizability across all stages. This finding was especially evident in early-stage dementia detection, where Dynamic GradNet significantly reduced false positives and enhanced classification metrics. These findings highlight the potential of Dynamic GradNet as a robust and scalable approach for AD diagnosis, providing a promising alternative to traditional attention-based models. The model’s ability to dynamically adjust spatial focus offers a powerful tool in artificial intelligence (AI) assisted precision medicine, particularly in the early detection of neurodegenerative diseases.Keywords
Magnetic resonance imaging (MRI) has become an essential tool for diagnosing neurodegenerative diseases such as Alzheimer’s disease (AD) because of its ability to provide detailed images of brain structures. MRI is particularly effective in detecting early and subtle changes in brain regions vulnerable to AD, such as the hippocampus, which plays a critical role in memory and cognitive function. Detecting these changes is crucial for early diagnosis and monitoring the progression of the disease [1,2]. Given the noninvasive nature of MRI, it is widely used in both clinical and research settings to detect biomarkers associated with AD. However, the manual interpretation of MRI images remains a challenging and time-consuming task that is prone to human error, especially when dealing with large datasets and complex brain structures. To address these challenges, automated methods—particularly those leveraging machine learning and deep learning models—have been developed to increase the accuracy and efficiency of MRI-based diagnoses [3].
Deep learning models, a type of machine learning model, have demonstrated significant potential in the field of medical image analysis [4]. Their ability to automatically extract relevant features from raw images without the need for manual intervention provides a substantial advantage over traditional methods. Convolutional neural networks (CNNs) have gained widespread adoption in medical imaging tasks because of their ability to capture spatial hierarchies and patterns through convolutional layers [5]. This powerful feature learning capability has allowed deep learning approaches to set new performance benchmarks across a wide range of artificial intelligence applications [6]. Recent advancements in CNN architectures have led to models that are capable of capturing both local and global features within images. Among the most prominent of these architectures are the residual network (ResNet), self-regularized network (RegNet), densely connected convolutional network (DenseNet), and efficient network (EfficientNet) each offering unique advantages for medical imaging tasks, including AD detection.
As deep learning frameworks continue to evolve, attention has shifted toward developing efficient and scalable neural network architectures that can be applied across a diverse range of tasks, particularly in computer vision. Traditionally, designing individual networks such as ResNet or EfficientNet has been the primary approach to achieve state-of-the-art performance. However, Radosavovic et al. (2020) introduced RegNet and emphasized focusing on network design spaces that parameterize entire populations of networks rather than individual instances [7]. In AD studies, RegNet has shown promise in analyzing amyloid deposition via medical images, demonstrating its potential in detecting subtle changes associated with the disease. The ability of RegNet to process complex imaging data efficiently makes it a valuable tool for enhancing diagnostic accuracy in AD [8].
ResNet, introduced by He et al. [9], is widely recognized for its ability to train deep networks by addressing the vanishing gradient problem. Through the use of skip connections, ResNet allows gradients to flow more effectively through the network, enabling the training of very deep architectures. Thus, ResNet has been particularly effective in image classification tasks, including medical imaging applications, where it has been successfully applied to AD diagnosis via MR images [10].
DenseNet, proposed by Huang et al. [11], adopted a different approach by connecting each layer to every other layer in a feed forward manner. This dense connectivity promotes feature reuse, leading to more efficient learning and reducing the number of parameters required. DenseNet’s efficient design makes it particularly suitable for medical imaging tasks, especially in cases where computational resources are limited. Moreover, DenseNet has demonstrated strong performance in tasks that require detailed anatomical understanding, such as detecting subtle changes in MR images for AD diagnosis [12].
EfficientNet, introduced by Tan et al. [13], employs a compound scaling method to uniformly scale the depth, width, and resolution of the network, optimizing performance while minimizing computational cost. Unlike traditional methods that scale these dimensions independently, often leading to suboptimal performance or high computational overhead, EfficientNet’s scalability and ability to balance accuracy with efficiency make it highly suitable for both high performance and resource constrained environments. This architecture has set new benchmarks in various medical imaging tasks, outperforming prior CNNs across multiple benchmarks.
While CNN based architectures such as RegNet, ResNet, DenseNet, and EfficientNet have consistently demonstrated strong performance in medical imaging tasks, understanding why these models make certain predictions is critical in clinical applications. A widely adopted technique in this context is gradient weighted class activation mapping (GradCAM) [14], which provides visual explanations by highlighting the regions in the input image that are most important for model prediction. By leveraging GradCAM, researchers and clinicians can gain insights into which areas of the brain the model focuses on when diagnosing AD from MR images. This interpretability is essential for validating model predictions and ensuring that the network focuses on clinically relevant brain regions, such as the hippocampus or other areas susceptible to early AD related atrophy. The incorporation of GradCAM thus enhances the transparency of deep learning models, increasing the trustworthiness and reliability of artificial intelligence (AI) tools for medical imaging.
In computer aided diagnosis (CAD), medical image analysis plays a critical and challenging role in identifying anatomical or pathological structures across various imaging modalities, such as magnetic resonance imaging (MRI), computed tomography (CT), and positron emission tomography (PET). However, automating this process presents several challenges, including low contrast of soft tissue, variability in anatomical structures, and limited availability of annotated datasets for model training. Inspired by the ability of the human visual system to focus on relevant areas and ignore background noise, attention mechanisms have been introduced to assign adaptive weights to different regions in an image, enabling neural networks to prioritize the most important regions related to the task and disregard irrelevant areas. This capability enhances the model’s ability to capture complex semantic relationships, making attention mechanisms particularly useful for improving both accuracy and interpretability in medical image analysis [15].
• Key Contributions:
1. Dynamic Adjustments for Complex Spatial Patterns:
A key strength of Dynamic GradNet is its ability to dynamically adjust focus during training on the basis of the complexity of spatial patterns in the brain. The model emphasizes critical brain regions affected by AD, such as the hippocampus and amygdala [16], without overfitting to irrelevant features. This dynamic adjustment process is especially crucial in detecting “very mild dementia”, where subtle changes in these regions are the earliest indicators of cognitive decline. By capturing these early patterns, the model significantly improves diagnostic accuracy, making it highly effective in identifying patients at the earliest stages of the disease.
2. Controlled Spatial Focus during Training:
Dynamic GradNet incorporates a mechanism to provide precise control over the brain regions that the model focuses on during training, ensuring that the model emphasizes key areas affected by AD, such as the hippocampus, temporal lobe, parietal lobe, frontal lobe, amygdala, and cerebral cortex [16]. By incorporating this spatial focus approach into training, the model prioritizes these regions, resulting in more accurate and reliable classifications, particularly for early-stage dementia.
3. Unified Preprocessing for Fair Comparison of Powerful CNN Architectures:
To ensure fairness in model evaluation, a unified preprocessing pipeline was applied to all neural network architectures: RegNet, ResNet, DenseNet, and EfficientNet. These CNN architectures are known for their strong performance in image classification tasks. The standardized preprocessing approach ensures consistent data handling across models, attributing performance differences directly to the architectures. Following a fair comparison, EfficientNet emerged as the best-performing model across key metrics such as precision, recall, F1 score, and accuracy, making it the ideal candidate for integrating Dynamic GradNet reduced False Positives and improved generalizability
By focusing on spatially significant regions and avoiding noise or irrelevant areas, Dynamic GradNet reduces the likelihood of false positives. This controlled spatial learning approach ensures that the model emphasizes the most important brain regions, improving its generalizability across different stages of AD.
As a result, the model generates more reliable predictions, particularly in early-stage diagnoses, where detecting subtle structural changes is critical for timely intervention.
4. Clinical Relevance and Interpretability
Integrating Dynamic GradNet into the training process enhances both the accuracy and interpretability of the model’s predictions. By focusing on the brain regions most affected by AD, the model’s decision-making process becomes more aligned with clinical observations, making it suitable for real-world medical applications. This approach ensures that the model is not only accurate but also interpretable, providing clinicians with a valuable tool for early diagnosis and monitoring of AD progression.
This study bridges the gap between deep learning interpretability and clinical applicability by ensuring that the model focuses on diagnostically relevant brain regions. The proposed approach enhances both classification accuracy and explainability, making it more accessible for radiologists and neurologists in real-world diagnostic workflows.
The application of deep learning approaches in medical image analysis, particularly for AD detection, has attracted substantial attention in recent years. Early studies in this domain relied primarily on traditional machine learning techniques that require manual feature extraction from MR images. For example, methods such as structural MRI feature extraction and hippocampal volume measurement are commonly used to assess brain atrophy in regions associated with AD [17]. However, these techniques are limited by their dependence on handcrafted features, which could lead to subtle patterns critical for early diagnosis being overlooked.
The advent of deep learning techniques, particularly CNNs, has revolutionized this field by enabling automatic feature extraction directly from raw MR images. CNN based approaches have been successfully employed in various AD detection studies using structural MRI data. For example, Liu et al. [18] demonstrated the effectiveness of CNNs in classifying MRI data for AD diagnosis, achieving high accuracy by focusing on key brain regions susceptible to AD related atrophy. Similarly, Suk et al. [19] introduced a deep sparse multitask learning framework that combines MRI and PET data to further enhance AD detection performance.
In addition to CNN based methods, machine learning techniques have been widely explored for Alzheimer’s disease (AD) diagnosis, incorporating various approaches to enhance classification performance. Traditional machine learning classifiers such as Random Forests have been applied to structural MRI data, often combined with feature selection techniques to improve early-stage detection [20]. More recently, hybrid models integrating deep learning with ensemble learning strategies have gained attention in AD diagnosis. Studies have shown that combining multiple CNN architectures or fusing imaging modalities, such as MRI and PET scans, can significantly improve model robustness
More recently, hybrid models integrating deep learning with ensemble learning strategies have gained attention in AD diagnosis. Studies have shown that combining multiple CNN architectures or fusing imaging modalities, such as MRI and PET scans, can significantly improve model robustness [21]. Additionally, Transformer based architectures, particularly Vision Transformers (ViTs), have emerged as promising alternatives due to their ability to capture long range dependencies in medical images [22]. These advancements highlight the growing impact of machine learning in AD detection and the ongoing efforts to enhance interpretability and reliability in clinical settings.
2.1 Deep Learning and Spatial Attention Mechanisms for Alzheimer’s Disease Classification
Recent advancements in CNN architectures, such as ResNet, RegNet, DenseNet, and EfficientNet, have significantly improved the accuracy and computational efficiency of AD detection systems [22–24].
ResNet, introduced by He et al. [9], has been widely adopted for AD detection because of its ability to train deep networks without suffering from the vanishing gradient problem. An improved ResNet model was proposed for the early diagnosis of AD via MRI scans [25]. This model, which is based on ResNet-50, incorporates several enhancements, including the Mish activation function, spatial transformer network (STN), and a nonlocal attention mechanism. These improvements enabled the model to capture long range correlations in MRI data while retaining critical spatial information, addressing the limitations often encountered by traditional CNNs. The model achieved a classification accuracy of 0.97 with the ADNI dataset, surpassing other algorithms in terms of macro precision, recall, and F1 score.
Additionally, a novel multistage deep learning framework based on residual functions was introduced for AD detection [26]. Inspired by the success of ResNet in image classification tasks, the framework employs five stages to enhance feature extraction while maintaining depth. Following the feature extraction phase, machine learning classifiers such as support vector machines (SVMs), random forests (RFs), and software were applied for classification. The model achieved excellent accuracy for three benchmark datasets (ADNI, MIRAID, and OASIS), with accuracy rates reaching as high as 0.99, outperforming existing systems.
Recent advancements have also highlighted the potential of RegNet in medical imaging applications, including AD detection. In one study [3], RegNet X064 was employed to predict amyloid deposition in PET scans for AD prognosis, achieving notably high performance. When combined with gradient boosting decision trees (GBDTs), the model exhibited reduced error margins and faster prediction times than human experts did. These findings underscore the effectiveness and scalability of RegNet in AD imaging tasks, making it a promising tool for clinical use in detecting neurodegenerative diseases.
DenseNet has also shown significant promise in the field of medical imaging, particularly in the analysis of MRI brain scans. Compared with traditional CNNs, DenseNet’s densely connected convolutional architecture facilitates more efficient feature extraction with fewer parameters, leading to improved performance in medical image analysis tasks [27]. In brain MRI analysis, DenseNet has demonstrated high accuracy in capturing intricate brain structures, making it a valuable tool in both clinical applications and research settings. This model’s ability to handle complex medical images efficiently demonstrates its potential to increase diagnostic accuracy and support advancements in neuroimaging techniques.
Several studies have explored the use of DenseNet in AD classification tasks. For example, in [28], a transfer learning based model utilizing DenseNet was introduced for classifying AD into three categories. This model achieved an accuracy of 0.96 and an AUC (Area Under Curve) of 0.99 with MRI datasets. This study demonstrated that DenseNet outperforms other traditional models in managing high dimensional MR data, particularly when combined with data augmentation techniques, addressing the issue of limited dataset availability. Moreover, the integration of a healthcare decision support system (HDSS) alongside the DenseNet model provided valuable insights for clinical decision making. These advancements highlight DenseNet’s potential to improve diagnostic accuracy in AD classification within clinical settings.
EfficientNet has also emerged as powerful deep learning model for medical imaging tasks, particularly those involving MRI scans. For example, in [29], a study was conducted utilizing a fine-tuned EfficientNet architecture for brain tumor classification that achieved superior performance across multiple datasets. EfficientNet’s efficient feature extraction and reduced computational complexity have suggested to be highly beneficial for analyzing high resolution MR images, particularly in complex brain imaging tasks. This study underscores the potential of transfer learning based EfficientNet models to increase diagnostic accuracy in medical imaging applications, as these models outperform state-of-the-art methods.
In AD related tasks, recent studies have demonstrated the effectiveness of EfficientNet. For example, EfficientNet-B0 was employed to classify brain MR images for early AD detection [30]. This approach integrates UNet for brain tissue segmentation and EfficientNet-B0 for feature extraction and classification. This model achieved an accuracy of 0.98, with high sensitivity and precision scores. These findings demonstrate EfficientNet’s ability to handle the complexity of brain MRI data, particularly in distinguishing between healthy and diseased brain tissues. The integration of EfficientNet into AD diagnosis systems has the potential to increase diagnostic accuracy and support early intervention, aligning with the growing body of research that positions EfficientNet as a robust tool for neurodegenerative disease classification.
While deep learning models such as CNNs have significantly advanced medical imaging tasks such as brain MRI classification, the interpretability of these models remains a critical challenge. However, techniques such as GradCAM have emerged as powerful tools to increase the transparency and interpretability of CNN models by generating visual explanations of the regions in an image that contribute most to a model’s output. In one study [31], the effectiveness of GradCAM in interpreting CNN models trained to classify different types of multiple sclerosis (MS) was demonstrated using brain MR images. The results showed that GradCAM provided superior localization of discriminative brain regions, making it an invaluable tool for understanding CNNs’ decision making processes in medical contexts. These results emphasize the importance of integrating interpretability techniques such as GradCAM to improve the reliability and clinical applicability of deep learning models in medical imaging.
In the context of AD diagnosis, recent studies have explored the combination of deep learning models with interpretability techniques such as GradCAM. For example, Inception ResNet a was applied to differentiate between AD patients and healthy controls (HCs) via T1-weighted MR brain images [32] and achieved competitive performance. GradCAM was employed to visualize the most discriminative brain regions, with the results indicating that the lateral ventricles in the mid-axial slice were key in distinguishing AD patients. This integration of GradCAM not only enhanced the transparency of the model’s decisions but also demonstrated its potential for assisting in diagnosis with minimal medical expertise. These findings highlight the importance of GradCAM in improving the interpretability and clinical relevance of deep learning models for AD diagnosis.
Krishnan et al. (2024) integrated a spatial attention mechanism into a CNN architecture to improve the classification of AD using MRI data. The spatial attention layer aids in guiding the model to focus on critical brain regions, such as those affected by AD, leading to a validation accuracy of 0.99. This approach, which assigns adaptive weights to important regions of the brain, highlights the potential of spatial focus techniques to increase both the accuracy and interpretability of deep learning models in AD diagnosis [33].
Sun, Wang, and He (2022) proposed a temporal and spatial analysis framework for improving AD diagnosis via the use of resting state functional MRI (fMRI) data. The authors employed a CNN with residual connections combined with a multilayer long short term memory network to classify AD patients and predict the progression of mild cognitive impairment (MCI) to AD. By constructing a functional connectivity (FC) network matrix based on regions of interest (ROIs) in the brain, the model was able to focus on critical brain areas while analyzing temporal changes over multiple time points. This approach aligns with the concept of spatial focus, as it directs the model’s attention to diagnostically relevant brain regions, enhancing the ability to distinguish AD patients from healthy controls and to predict progressive MCI (pMCI) patients vs. stable MCI (sMCI) patients. Their method achieved classification accuracy of 0.93 for AD patients vs. HCs and 0.75 for pMCI patients vs. sMCI patients, demonstrating the effectiveness of spatial and temporal focus in improving diagnostic accuracy [34].
The studies discussed in this section highlight the advancements and challenges in Alzheimer’s disease (AD) diagnosis using deep learning. While previous research has extensively leveraged GradCAM as a post-hoc interpretability tool, the majority of these approaches focus solely on visualizing model attention after prediction, rather than incorporating it into the learning process. Consequently, existing methods fail to dynamically adjust their focus on clinically significant brain regions during training, limiting their effectiveness in capturing subtle yet crucial biomarkers for early-stage detection.
In contrast, this study introduces an innovative approach by dynamically integrating GradCAM into the training pipeline. Rather than merely using GradCAM to observe model attention retrospectively, our method actively refines the feature learning process, ensuring that the model prioritizes clinically relevant regions while suppressing irrelevant background features. This dynamic reweighting mechanism enhances both classification accuracy and model interpretability, addressing one of the critical limitations in existing methods.
Moreover, unlike prior research where GradCAM is employed only to explain model predictions, our approach directly influences how the model learns important features, thereby reducing false positive rates in early-stage AD detection. This improvement is particularly crucial for cases such as very mild dementia, where subtle biomarkers are often overlooked. To validate our findings, we conducted a rigorous comparison across four well established CNN architectures RegNet, ResNet, DenseNet, and EfficientNet-B0 using a standardized evaluation framework. The results demonstrated that EfficientNet-B0 outperformed other architectures across all performance metrics, including accuracy, recall, and F1 score, making it the optimal backbone for the proposed Dynamic GradNet framework.
By addressing both the challenges of interpretability and early-stage detection, this work presents a paradigm shift in AD diagnosis, demonstrating that integrating GradCAM beyond post-hoc analysis can significantly improve deep learning models for medical imaging. The proposed method advances the field by bridging the gap between model explain ability and performance, offering a more reliable and clinically interpretable solution for AD classification.
3.1 Dataset Preparation and Overview
The OASIS MRI dataset [35–38] used in this study contains more than 80,000 brain MR images categorized into four classes on the basis of AD progression: moderate dementia, very mild dementia, mild dementia, and nondemented. These images were obtained from 461 patients, offering a robust dataset for AD detection and analysis. Patient classification was based on clinical dementia rating (CDR) values, resulting in four distinct classes, as shown in Table 1. This classification enables the study of AD progression across different stages. Fig. 1 presents sample MRI images from the dataset, showcasing representative examples from each of the four categories. These samples highlight the visual differences and subtle patterns associated with each stage of AD progression.
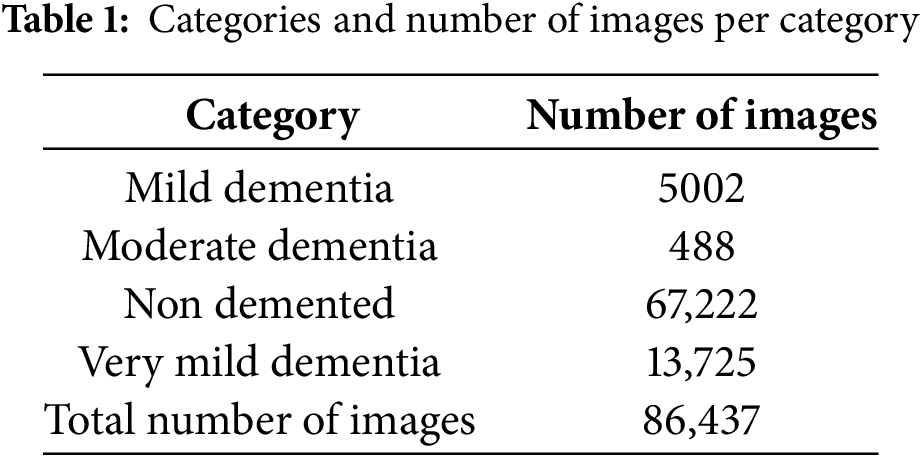
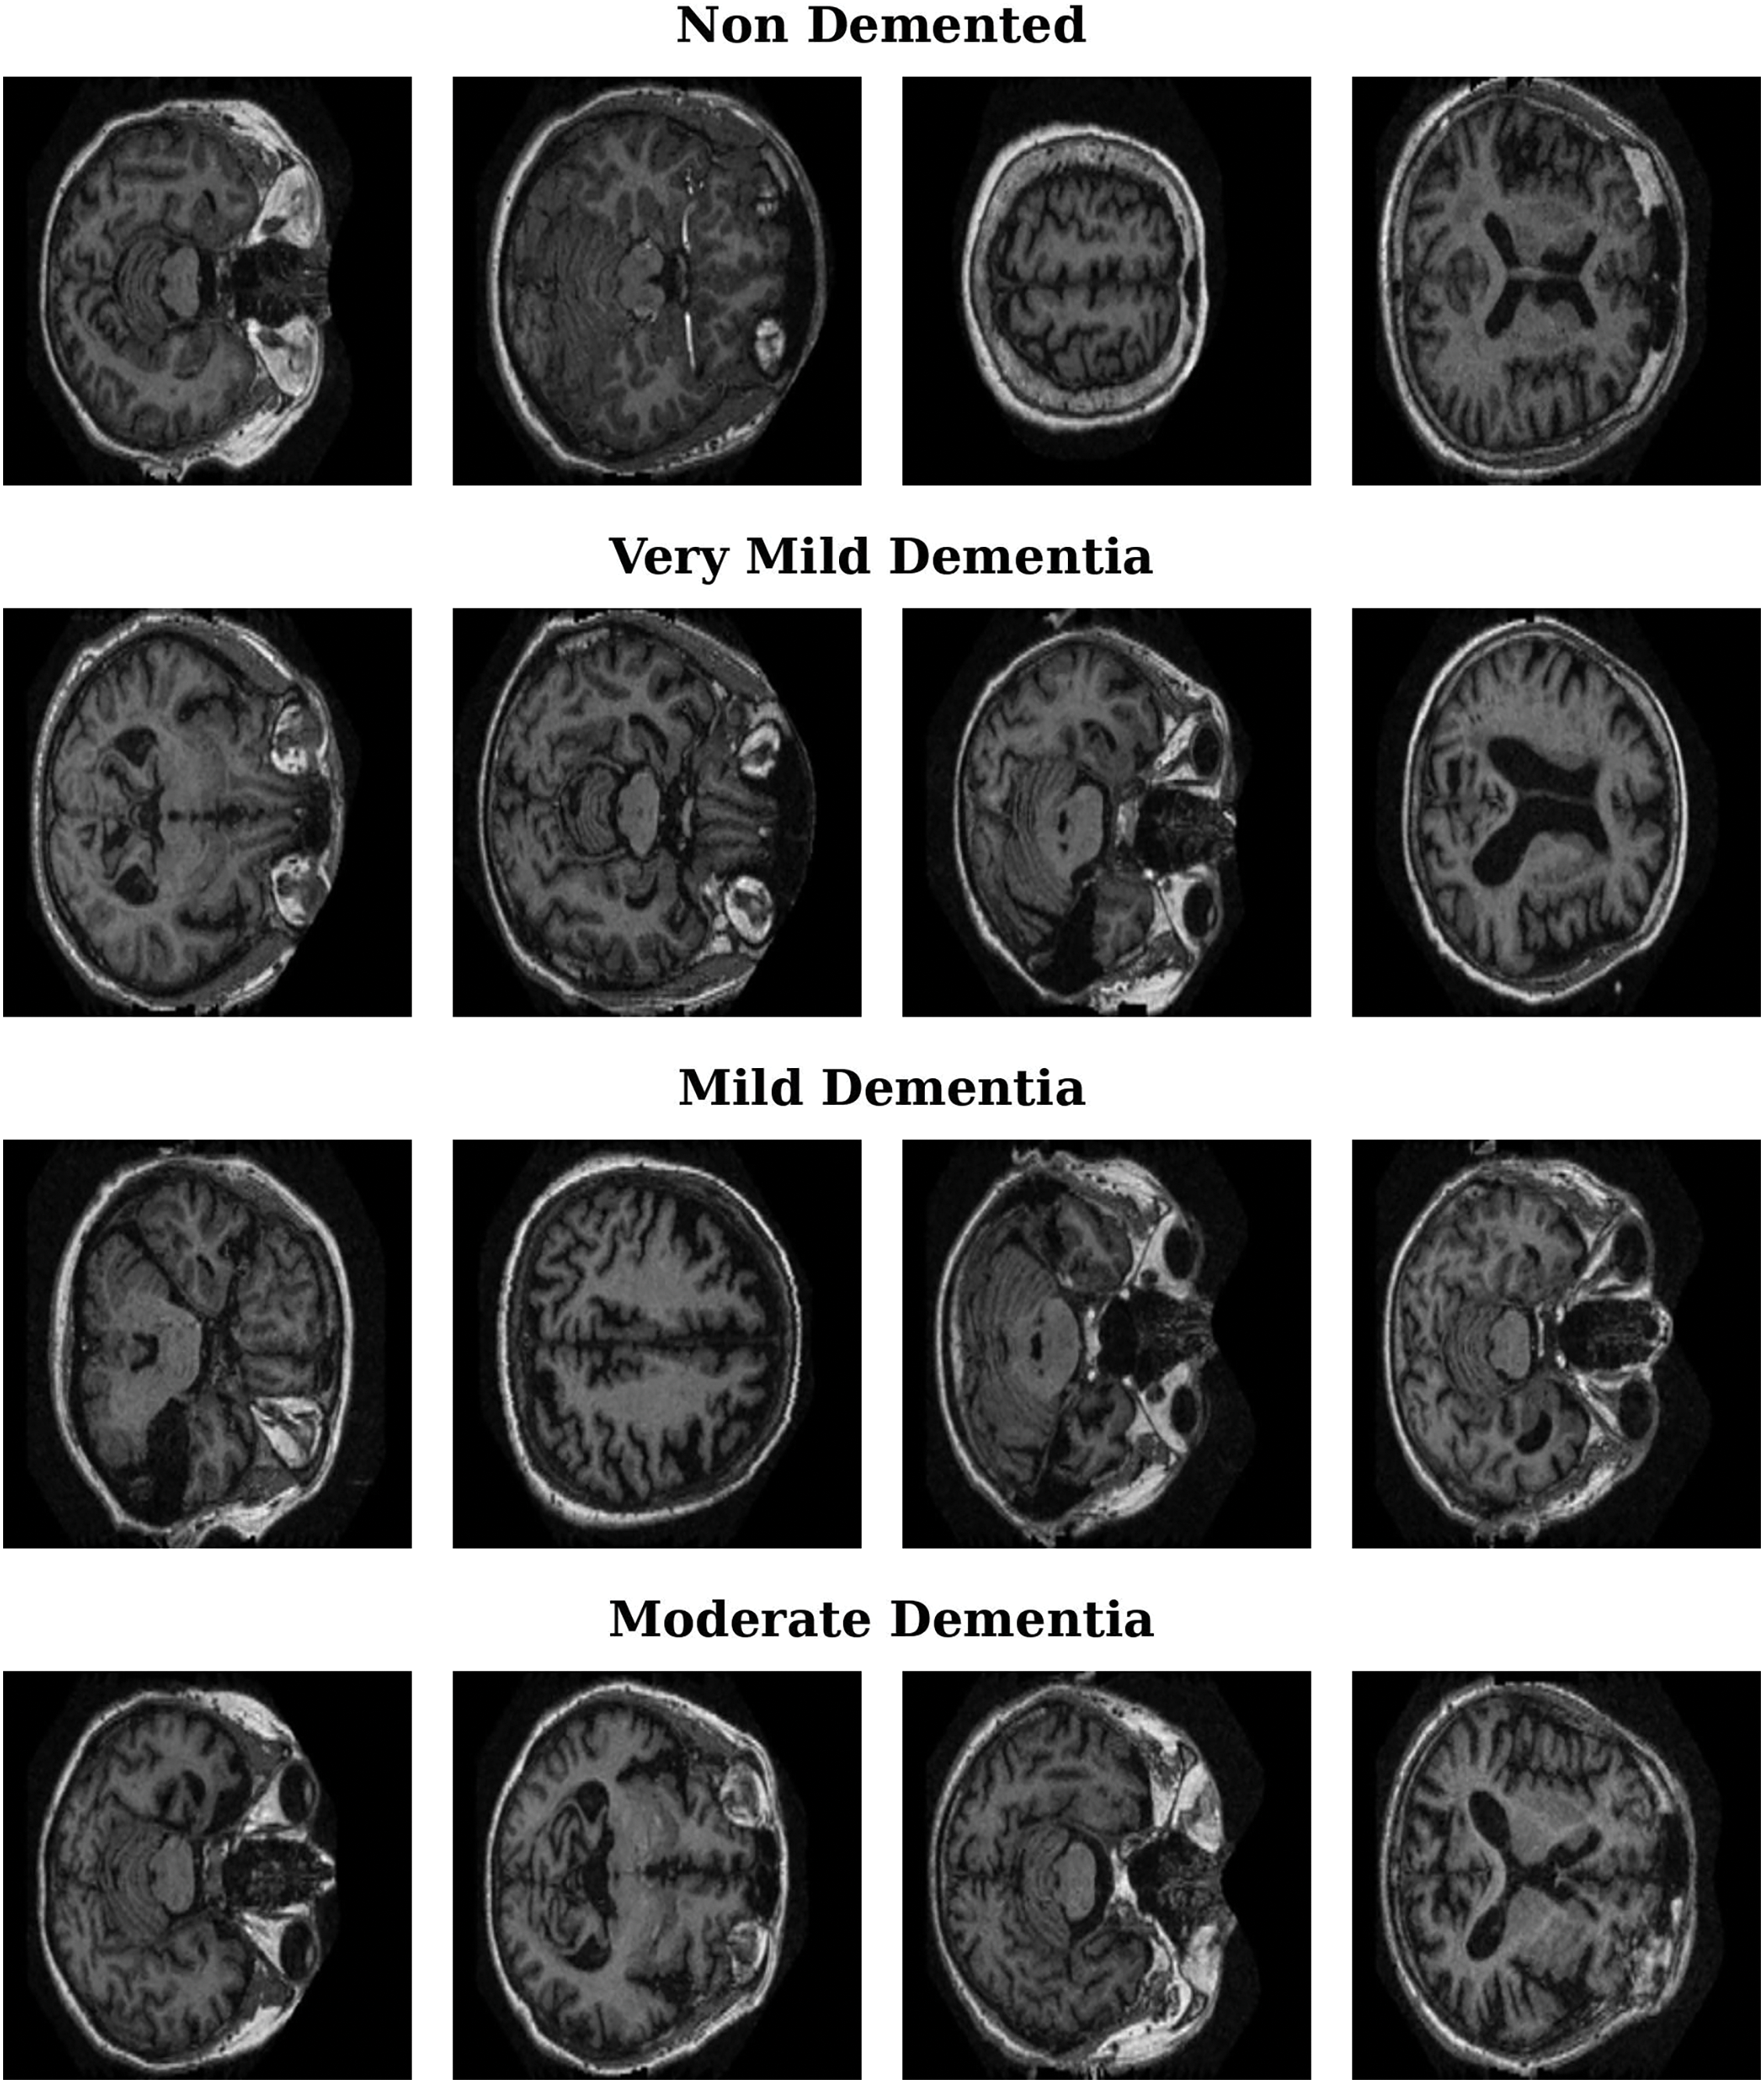
Figure 1: Representative MRI images for Alzheimer’s disease stages
In this section, we describe the unified preprocessing pipeline applied to all four neural network architectures: RegNet, ResNet, DenseNet, and EfficientNet. A consistent and standardized preprocessing approach ensures that no unique or model specific transformations are applied to one architecture over another, providing a fair basis for performance comparison.
The images are resized to 224 × 224 pixels to align with the standard input dimensions of various CNN architectures. This size ensures compatibility with pre-trained models, balances computational efficiency with feature preservation, and maintains anatomical integrity. Additionally, using a fixed resolution across all models eliminates input size variability, enabling a fair and consistent performance comparison.
To improve the generalizability of the models and prevent overfitting, several data augmentation techniques have been applied. These transformations introduce variations to the training dataset, allowing the models to learn more robust features. The following augmentations were used:
• Random Horizontal Flip: With a probability of 0.50, each image is flipped horizontally. This transformation helps the model become invariant to the left–right orientation, which is especially useful in medical imaging tasks where structural symmetry is common.
• Random Rotation: a ±10 degree random rotation is applied to improve model generalization and reduce sensitivity to slight orientation differences in MRI scans. This range introduces variability while preserving critical brain structures, preventing overfitting to specific spatial patterns.
These data augmentation techniques are crucial in enhancing the variability of the training data, which contributes to the robustness of the models during inference.
Once the augmentation techniques are applied, the images are directly converted to tensors via the transforms.ToTensor() function. This transformation function scales the pixel values (which originally range from [0, 255]) to a range of [0, 1] by dividing each pixel by 255, preparing the images for input into the neural networks.
After the images are converted to tensors, a normalization approach is applied using the mean and standard deviation values. Since the images are grayscale, the values used for normalization are specific to images with a single channel. The values used for normalization in this study are mean = 0.165 and standard deviation = 0.176.
Normalization ensures that the pixel values are scaled such that the resulting tensors have a mean of 0 and a standard deviation of 1. This process helps improve the convergence of the model during training by standardizing the input values, leading to more stable gradient updates and faster training.
The dataset is split into three subsets: training, validation, and testing. A stratified split is applied to ensure that the class distribution in the subsets reflects the overall class distribution in the dataset.
• Training Set: 0.80 of the dataset is used for training the models.
• Validation Set: 0.10 of the dataset is used for validation, ensuring that the models do not overfit during the training process.
• Test Set: 0.10 of the dataset is reserved for evaluating the final performance of the models.
This stratified split ensures a balanced distribution of classes across all subsets, maintaining a proportional representation of each class in the training, validation, and test sets.
3.2.6 Handling Class Imbalance
The OASIS dataset presents a significant class imbalance, particularly between the nondemented and moderate dementia categories. To address this issue, we implemented a comprehensive approach that combines Weighted Random Sampling, a Weighted Loss Function, and Class-wise Performance Analysis to ensure that the model does not disproportionately favor the majority class.
To balance the dataset during training, Weighted Random Sampling was applied, ensuring that underrepresented classes were sampled more frequently. The class weights were computed using the formula:
where N represents the total dataset size, and
In addition to sampling adjustments, a Weighted CrossEntropy Loss Function was incorporated to further counteract the imbalance. The loss function was modified such that higher penalties were assigned to misclassified samples from underrepresented classes, ensuring that the model paid more attention to the minority classes. The loss function is formulated as follows:
where
To evaluate the effectiveness of these techniques, a Class-wise Performance Analysis was conducted, where metrics such as precision, recall, F1 score, and accuracy were calculated separately for each class. This analysis validated that the model’s improvements were not driven solely by the majority class but were distributed more equitably across all dementia stages. The results confirmed that the integration of weighted sampling and loss functions led to more balanced predictions, reducing bias and improving overall classification stability.
3.2.7 DataLoader Configuration
A DataLoader is used to load the data in batches during the training process. The batch size is set to 32 across all the models, and the “WeightedRandomSampler” is incorporated into the training DataLoader to handle class imbalance. For the validation and test sets, the data are loaded without sampling, and shuffling is disabled to maintain consistency during evaluation.
3.2.8 Summary of Preprocessing Pipeline
•
•
•
•
•
•
In summary, the uniform preprocessing pipeline applied to all four models, RegNet, ResNet, DenseNet, and EfficientNet, serves as a cornerstone of this research. By ensuring that the same transformations and data preparation steps are consistently applied across all the architectures, we eliminate any potential biases that could arise from model specific preprocessing. This consistency guarantees that the results obtained from each model are directly comparable. Any observed differences in performance can thus be attributed solely to the inherent architecture of the models rather than to variations in the input preparation. This careful control of preprocessing conditions is a critical contribution of our work, ensuring a fair and rigorous evaluation of each model’s capabilities.
The unified preprocessing pipeline can be expressed mathematically as follows:
where:
•
•
•
•
• Tensor(
•
Following this preprocessing pipeline, the image is passed through each of the four models:
•
• RegNet, ResNet, DenseNet and EfficientNet are the four different models applied in this study.
By applying this uniform preprocessing pipeline followed by each specific model architecture, we ensure that any observed differences in performance are a direct result of the model’s architecture, as the preprocessing steps are consistent across all the models.
3.3 Convolutional Neural Network (CNN Architectures)
The decision making process in CNNs, such as RegNet, ResNet, DenseNet, and EfficientNet, is driven by their ability to learn and extract hierarchical features from input data. These architectures are designed to enhance performance on tasks such as AD classification, involving stages such as nondemented, very mild dementia, mild dementia, and moderate dementia. Each model introduces distinct structural innovations, optimizing feature extraction and classification and thus making them well suited for complex image based diagnostics. The task in this study involves classifying four distinct stages of AD: nondemented, very mild dementia, mild dementia, and moderate dementia. These stages are reflected in the classes variable, which contains these four labels. The final layer of each neural network model (RegNet, ResNet, DenseNet, and EfficientNet) is adjusted to output predictions for these four classes, ensuring that the models can differentiate between the various stages of dementia on the basis of the input medical images.
ResNet [16] is a deep CNN that employs residual connections to address the vanishing gradient problem, enabling the training of deeper architectures without performance loss. This design makes ResNet particularly effective for tasks such as medical image classification.
In this study, a pretrained ResNet50 was fine-tuned to classify the stages of AD. The final fully connected layer was modified to output predictions for four classes, allowing the model to distinguish between different stages of dementia.
RegNet [14] is a CNN architecture designed to optimize network design spaces for improved scalability and performance. Unlike traditional architectures, RegNet employs a regularized approach to adjust model size and complexity, resulting in a more balanced and efficient network. This scalability makes RegNet particularly effective for a wide range of tasks, including medical image classification, while maintaining computational efficiency.
In this study, a pretrained RegNet-Y-400MF model was fine-tuned for AD classification. The final fully connected layer was adapted to output predictions for four distinct classes, allowing the model to effectively differentiate between the various stages of dementia.
DenseNet [18] is a CNN that establishes dense connections between each layer to every other layer in a feedforward manner, ensuring maximum information and gradient flow throughout the network. This dense connectivity mitigates the vanishing gradient problem and improves feature reuse, leading to efficient learning with fewer parameters. Its ability to enhance feature propagation makes it particularly effective for tasks such as medical image classification.
In this study, a pretrained DenseNet121 model was fine-tuned to classify AD stages. The original classifier layer was replaced to output predictions for four classes, enabling the model to effectively distinguish between different stages of dementia.
EfficientNet [20] is a CNN that scales the dimensions of depth, width, and resolution in a balanced manner via a compound scaling method. This approach enables the network to achieve better accuracy and efficiency than traditional models do, making it highly effective for tasks requiring computational efficiency, such as medical image classification.
In this study, a pretrained EfficientNet-B0 model was fine-tuned to classify AD stages. The original classifier layer was modified to output predictions for four classes, allowing the model to accurately differentiate between the various stages of dementia.
3.3.5 Final Layer Modification for AD Classification
For each model (ResNet, RegNet, DenseNet, and EfficientNet), the final fully connected layer was replaced to output four classes corresponding to AD stages (mild dementia, moderate dementia, nondemented, very mild dementia). This modification ensures that each model can classify input images into one of these four stages.
In all cases, the output layer was followed by a softmax activation function to convert logits into class probabilities, ensuring that the sum of the probabilities was 1 for each prediction.
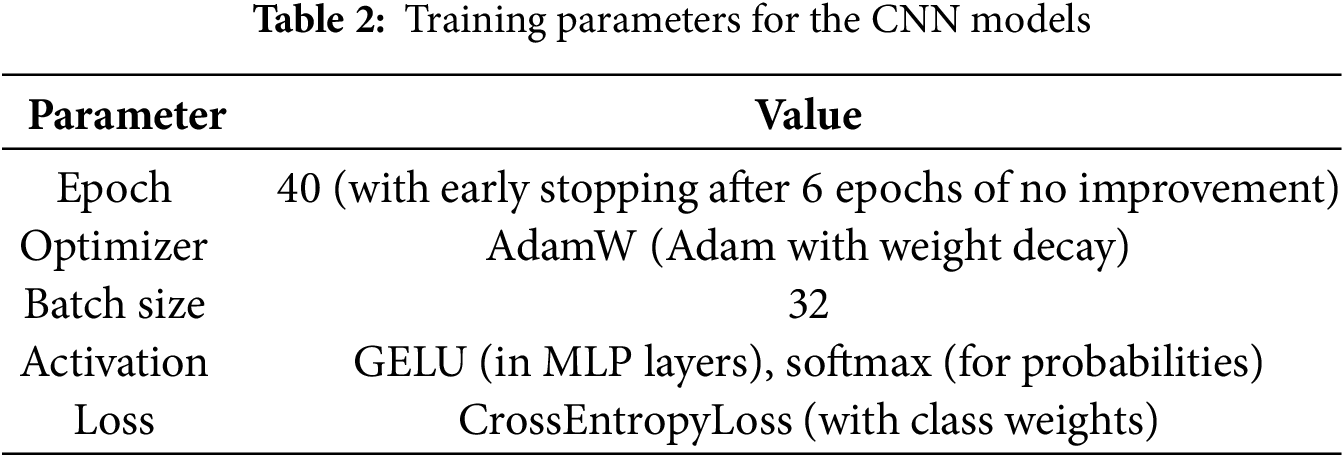
The key training parameters applied consistently across all CNN models (ResNet, RegNet, DenseNet, and EfficientNet) are summarized in Table 2.
3.4 EfficientNet-B0 and GradCAM Integration
The EfficientNet-B0 model was further enhanced through the integration of GradCAM for dynamic weighting during training. This approach introduces an innovative dynamic weighting mechanism into the loss function, guided by the spatial importance of image regions as determined by GradCAM.
Among the tested models (ResNet, RegNet, DenseNet, and EfficientNet), EfficientNet demonstrated the best performance in terms of precision, recall, F1 score, and accuracy. As a result, it was selected for the integration of GradCAM (dynamic weighting) to further improve its performance during training.
By integrating GradCAM into the EfficientNet-B0 architecture, the model dynamically adjusts its focus to critical brain regions, improving both interpretability and diagnostic accuracy. The framework of our proposed method, including the preprocessing pipeline, the EfficientNet model, and the GradCAM integration for dynamic spatial focus, is illustrated in Fig. 2.
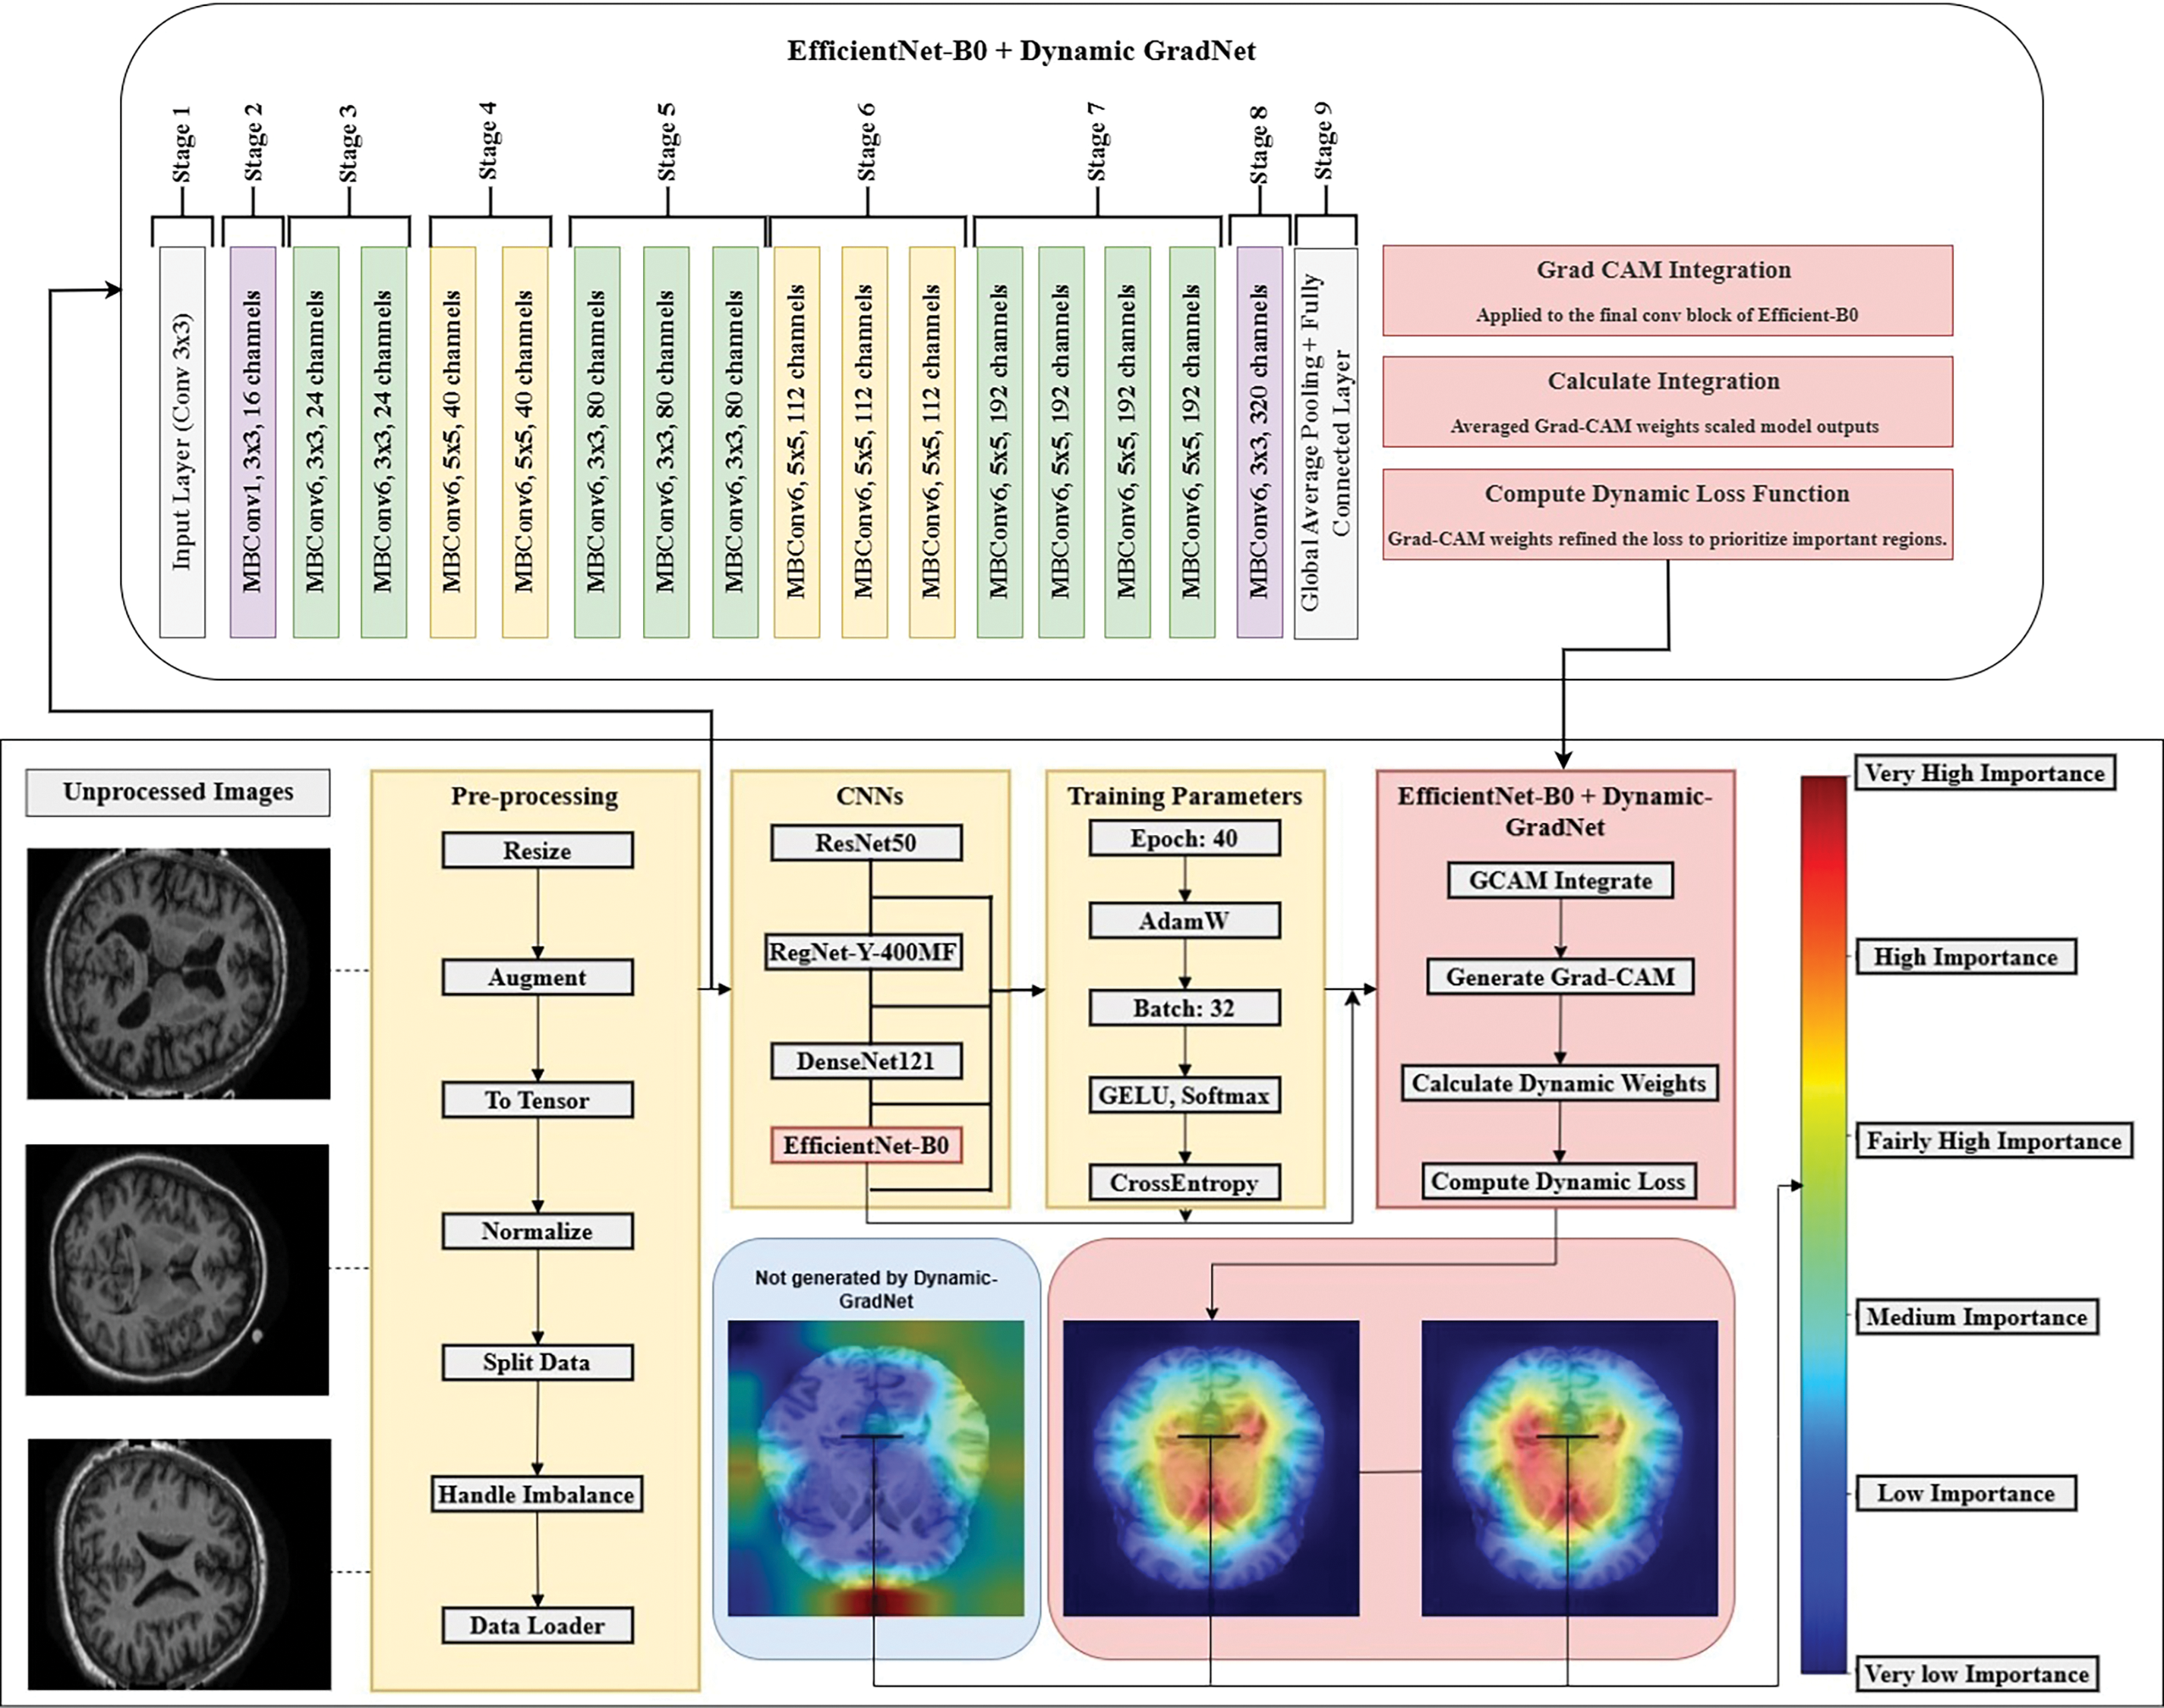
Figure 2: Dynamic GradNet framework for enhanced spatial attention
3.4.1 Model and Training Parameters
To ensure a fair comparison between the models, the following training parameters were applied consistently across all models, with the only difference being the loss function used in the EfficientNet-B0 model (Table 3).
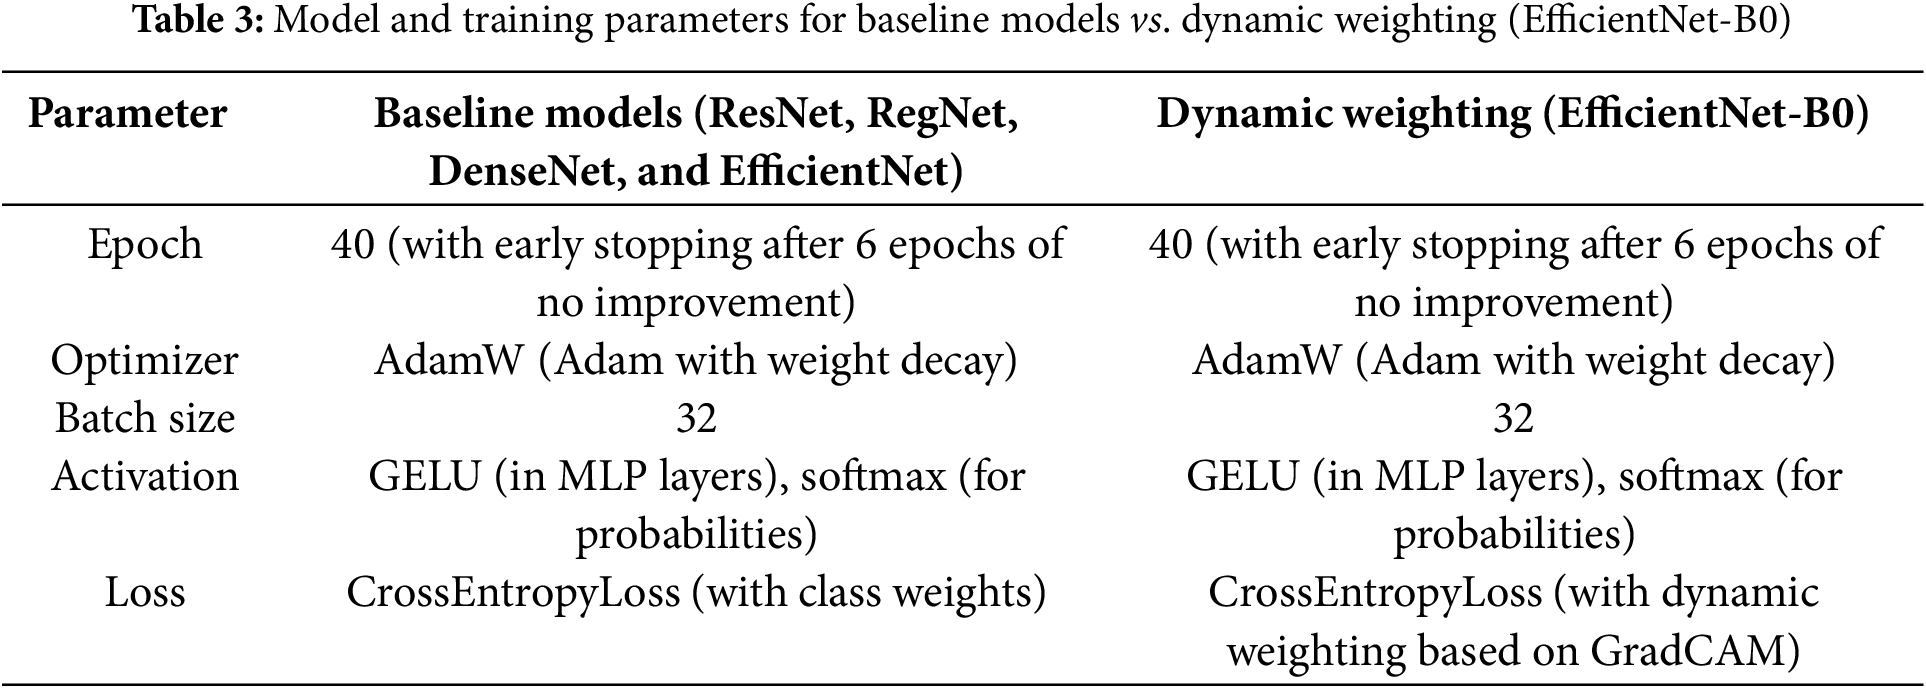
The key distinction is that while the baseline models (ResNet, RegNet, DenseNet, and EfficientNet) utilize CrossEntropyLoss with class weights to manage class imbalance, the EfficientNet-B0 model employs CrossEntropyLoss with dynamic weighting based on GradCAM.
GradCAM was applied to the final convolutional block of EfficientNet-B0 before the classifier to generate heatmaps that highlight the most relevant image regions for each class prediction. These heatmaps guided the dynamic weighting in the loss function, ensuring the model focuses on the most critical regions of the image during training. The 3D GradCAM visualization further highlights the most significant brain regions involved in the classification process, providing a crucial understanding of the spatial focus in the model’s predictions Fig. 3.
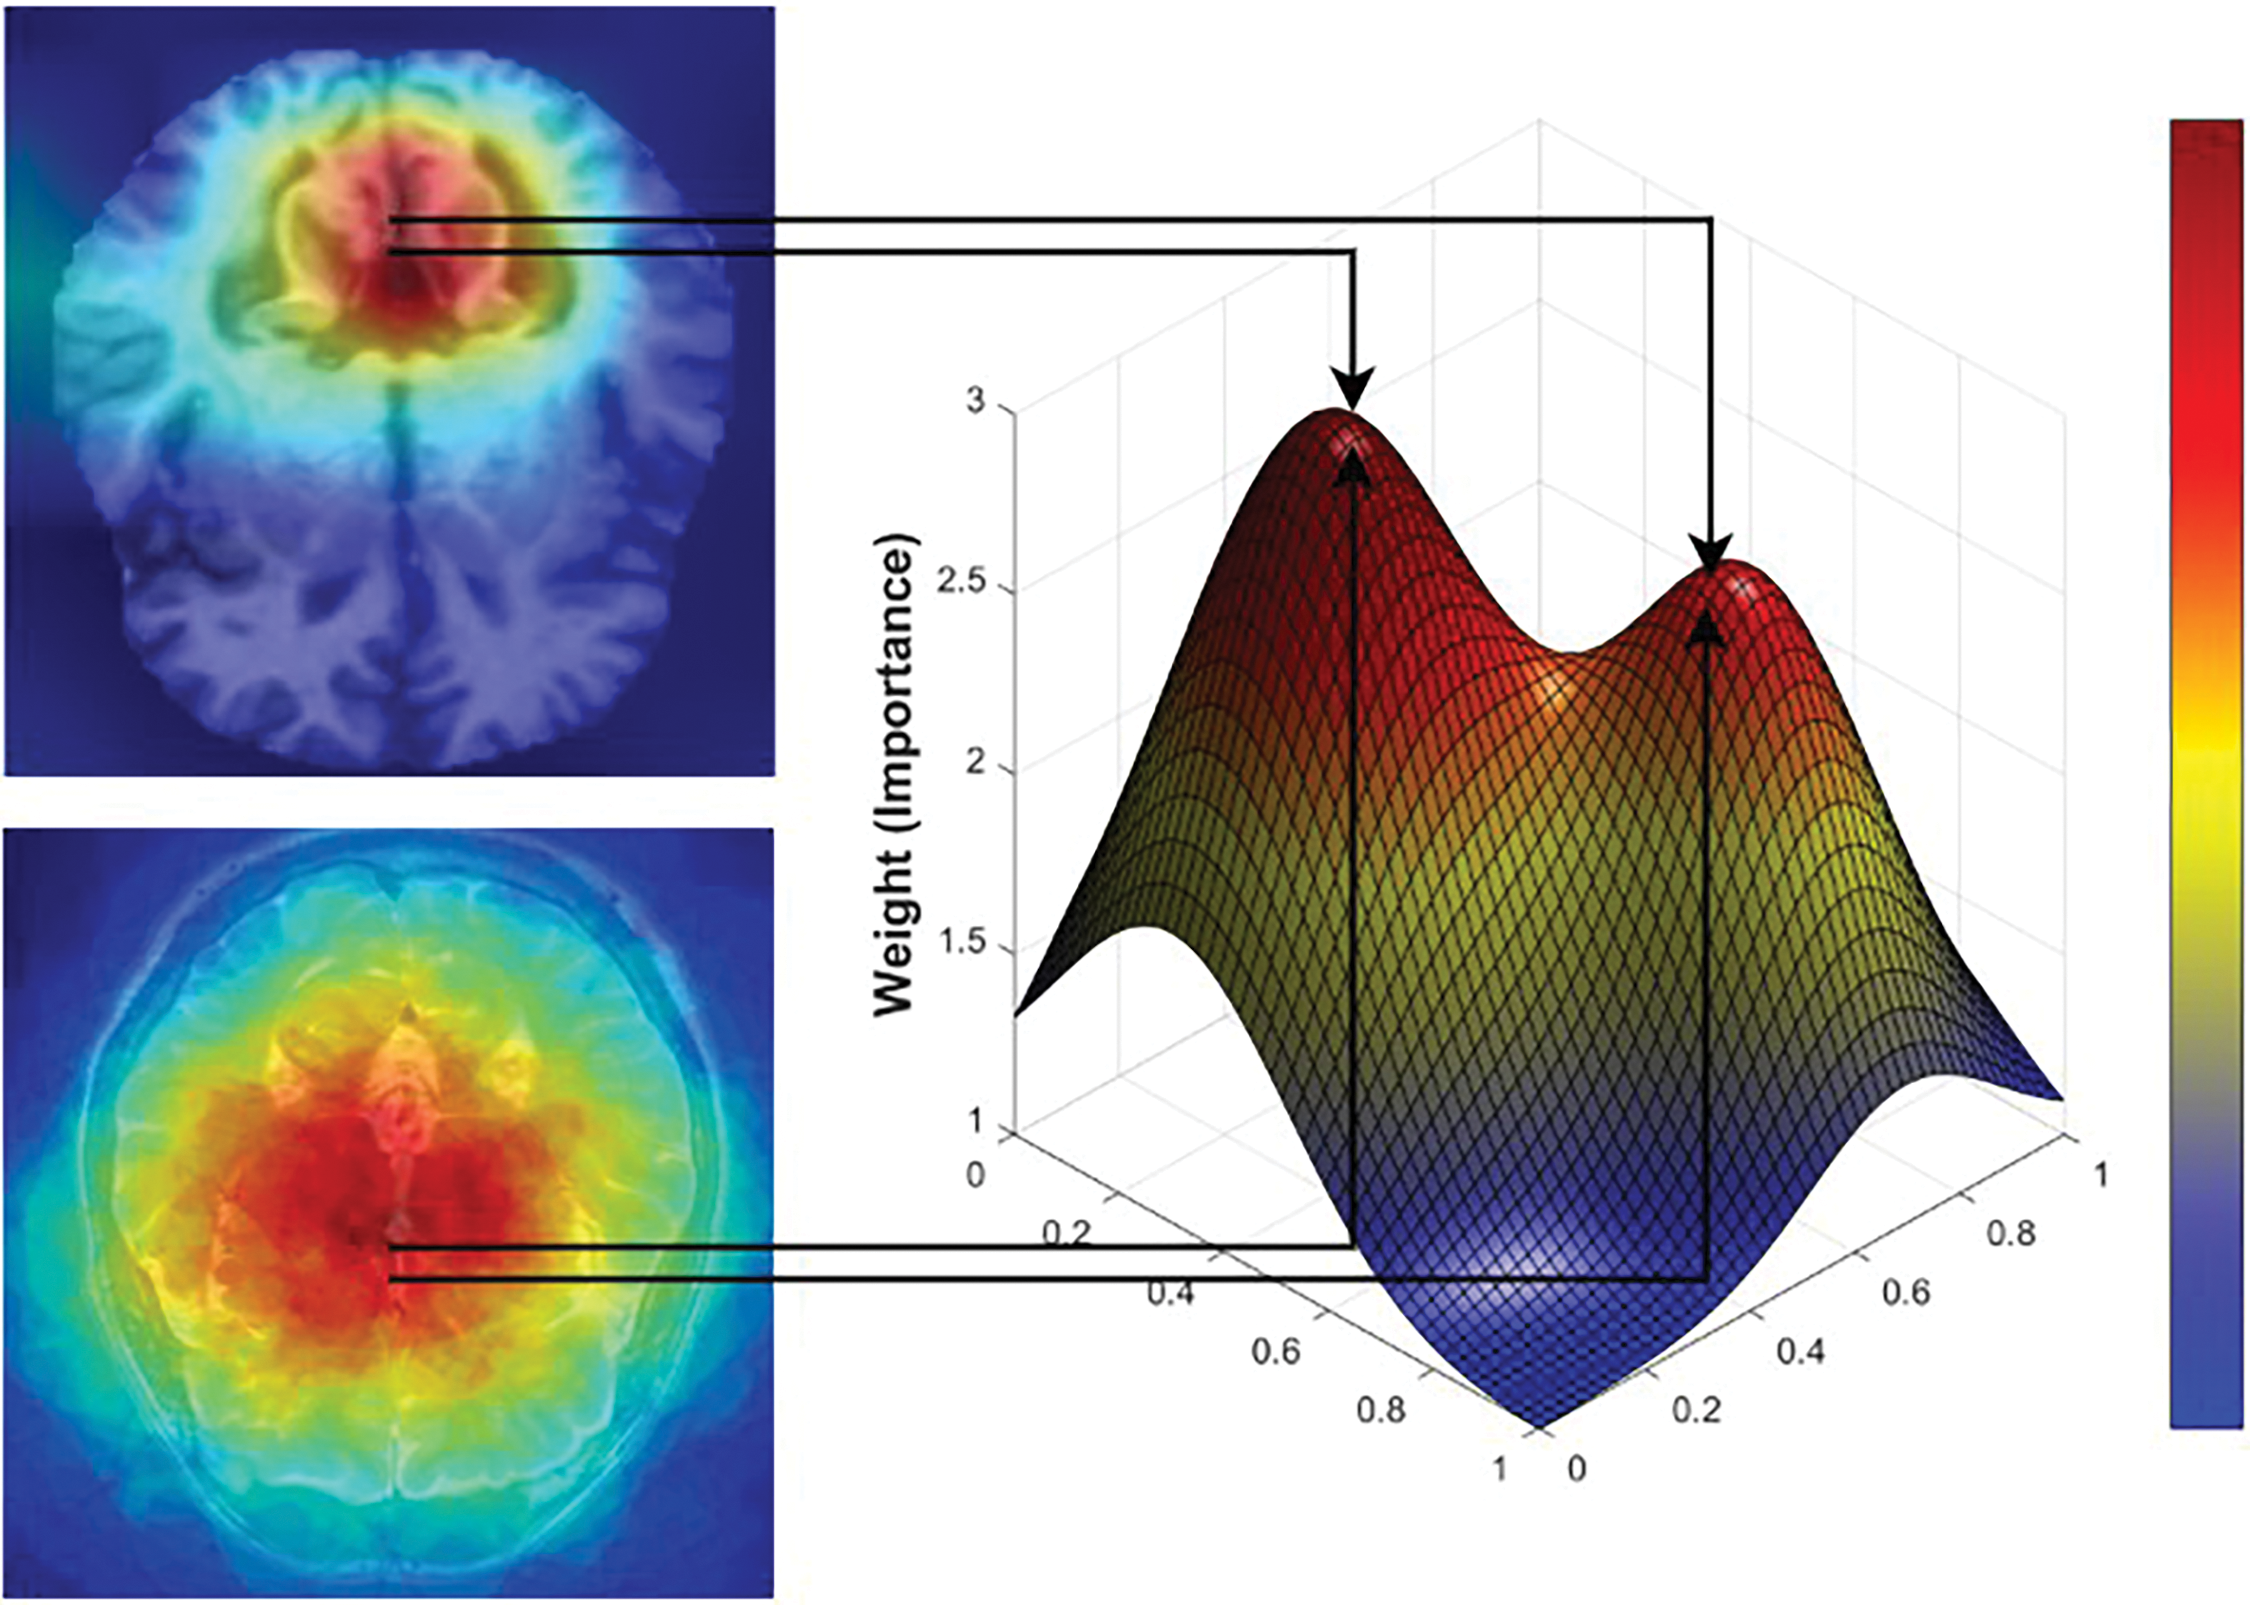
Figure 3: Critical brain regions mapped by 3D GradCAM
For each input image, GradCAM generated heatmaps that highlighted the most relevant features for classification. These heatmaps were computed from the gradients of the output with respect to the activation maps in the target layer. The activations were weighted by the gradients and averaged spatially to produce the heatmap, which indicates the importance of each region in the input image for the model’s decision.
3.4.4 Dynamic Weight Calculation
The GradCAM heatmaps were averaged across spatial dimensions to compute scalar weights representing the importance of the highlighted regions. These weights were then applied to the model outputs to scale them, ensuring that the network focused more on the regions of greater importance. This process allows the model to adapt its predictions by focusing on the most important parts of the image while ignoring less critical regions.
3.4.5 Loss Function Calculation
To enhance the model’s ability to focus on critical brain regions during training, GradCAM-based dynamic weighting was integrated into the CrossEntropy Loss function. The GradCAM heatmaps generated for each class were used to compute spatial importance weights, which were then applied to the model’s predictions before loss computation. This mechanism ensures that regions with higher clinical significance contribute more to the training process, allowing the model to refine its decision making based on essential anatomical features.
3.4.6 Dynamic Weight Computation from GradCAM
After each forward pass, the GradCAM activation maps were computed from the final convolutional layer. These heatmaps highlight the most influential areas in the brain MRI scans, with activation intensities reflecting their relative importance for each class.
For each class c, the weight
where:
•
•
• Z is a normalization factor ensuring stability in weight scaling.
3.4.7 Weighted Model Output Modification
Before computing the loss, the predicted probability for each class
where:
•
•
3.4.8 Final Loss Function with GradCAM Integration
Using the modified outputs, the CrossEntropy Loss was calculated as:
where:
•
•
•
This integration ensures that the loss function penalizes errors more in clinically relevant regions, guiding the model to prioritize learning from the most diagnostically significant areas in MRI images.
3.4.9 Representation of Spatial Importance through GradCAM Weights
The weights obtained from GradCAM represent the contribution of each activation map to the model’s final decision. These weights are used to determine the spatial importance of regions within the image.
The activation maps produced by the convolutional layers contain spatial information about the input image. Each pixel in the activation map corresponds to a specific region in the original image. By weighting the activation map using the gradients with respect to the class score, the regions that contribute more significantly to the model’s decision are highlighted. Regions with higher gradients are assigned greater importance in the final prediction, which is reflected in the GradCAM heatmap.
When GradCAM is used to guide the model during training, the following steps are applied:
• GradCAM Calculation
After each training step, GradCAM is computed on the basis of the model’s current outputs. The gradients with respect to the target layer’s activations are calculated and used to generate the heatmap.
• Modifying Outputs with the Weights
The model’s outputs are adjusted using the weights derived from the GradCAM heatmaps. These weights emphasize regions identified as having greater importance by GradCAM, thereby ensuring that these regions have greater influence during the loss calculation, guiding the model to focus on these areas.
• Loss Calculation
The loss is calculated on the basis of the modified outputs. By incorporating dynamic weights, the model is encouraged to focus on the regions identified as important by GradCAM. This approach helps the model learn more effectively by concentrating on the most relevant spatial features during training.
By incorporating GradCAM derived weights during training, the model is guided to focus on the most critical regions of the input image for classification, enhancing its ability to generalize and make accurate decisions. This approach is particularly beneficial in tasks where spatial information is crucial for understanding the image content, as the model can concentrate on the most relevant spatial features.
3.5 Computational Requirements
The proposed model was trained on a system equipped with an Intel Core i9-13900 processor, 32 GB RAM, and an NVIDIA GTX 1650 (4 GB GDDR6) GPU. This hardware configuration was sufficient to train the model effectively while maintaining a balance between computational efficiency and performance. The model’s architecture was designed to be lightweight, ensuring feasibility for deployment in real-world medical imaging applications without requiring high-end computational resources. Furthermore, the model can be integrated into clinical workflows using moderate hardware specifications, making it accessible for a broader range of medical institutions.
This methodology demonstrates how EfficientNet-B0, enhanced with GradCAM for dynamic weighting, was trained for AD disease classification. The consistent preprocessing pipeline applied across all models ensures a fair comparison, while the integration of the dynamic weighting mechanism enables the EfficientNet-B0 model to focus on the most relevant areas in images, improving its performance for this critical task. The integration of GradCAM into the loss function represents a novel approach for improving model interpretability and accuracy in medical image classification.
Below are the mathematical equations and explanations for the metrics used to evaluate the performance of the proposed model. These metrics provide insights into the model’s ability to correctly classify instances in a multiclass setting.
The precision metric measures the proportion of true positives (correctly predicted positive instances) out of all the predicted positives. It is given by the following formula:
where TP refers to the number of true positive cases and FP refers to the number of false positive cases.
The recall metric, also known as sensitivity, measures the proportion of actual positive cases that the model correctly identified. It is calculated as:
where FN refers to the number of false negatives, i.e., actual positive cases that were incorrectly predicted as negative.
The F1 score is the harmonic mean of precision and recall, providing a balance between the two metrics, especially in cases of class imbalance. It is given by the following formula:
The accuracy metric measures the overall proportion of correct predictions (both positive and negative) out of the total number of predictions. It is computed as:
where TN represents the number of true negative cases and correctly predicted negatives.
4.1 Comparative Analysis of Model Performance
In this section, we present a comparison of the performance of five models, ResNet, RegNet, DenseNet, EfficientNet, and EfficientNet with Dynamic GradNet, across four categories of AD diagnosis: mild dementia, moderate dementia, nondemented, and very mild dementia. The evaluation is based on key metrics such as accuracy, precision, recall, and the F1 score, providing insights into each model’s strengths in different stages of dementia.
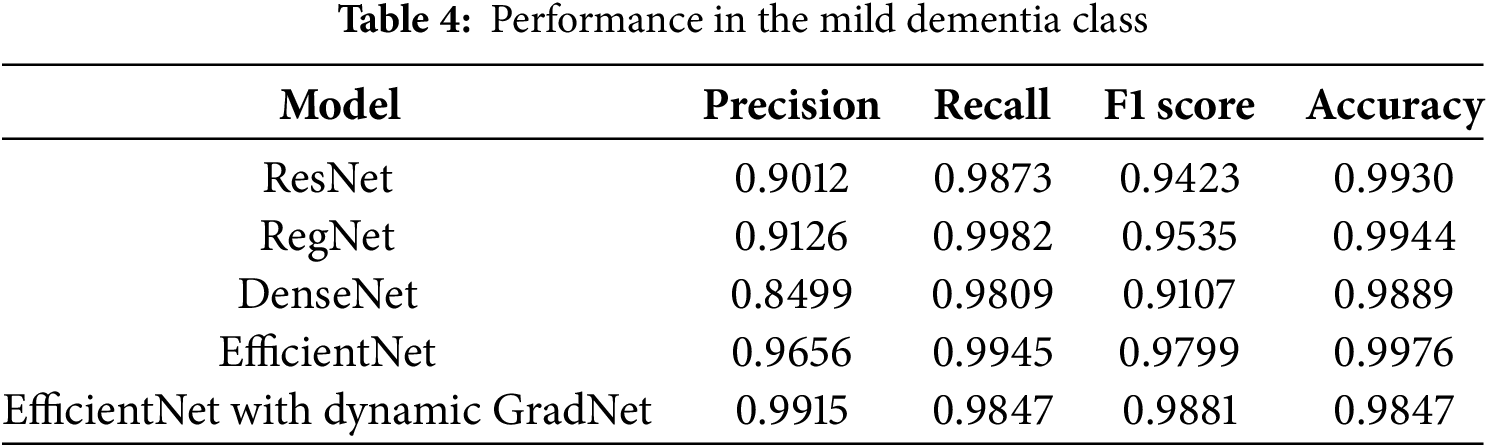
4.1.1 Performance in the Mild Dementia Class
Table 4 highlights the performance of different models in classifying the mild dementia category. Among these models, EfficientNet with Dynamic GradNet yielded the highest overall F1 score (0.9881), reflecting a balanced trade off between precision and recall. However, EfficientNet achieved the highest accuracy (0.9976), indicating its superior ability to correctly classify both positive and negative samples in this category.
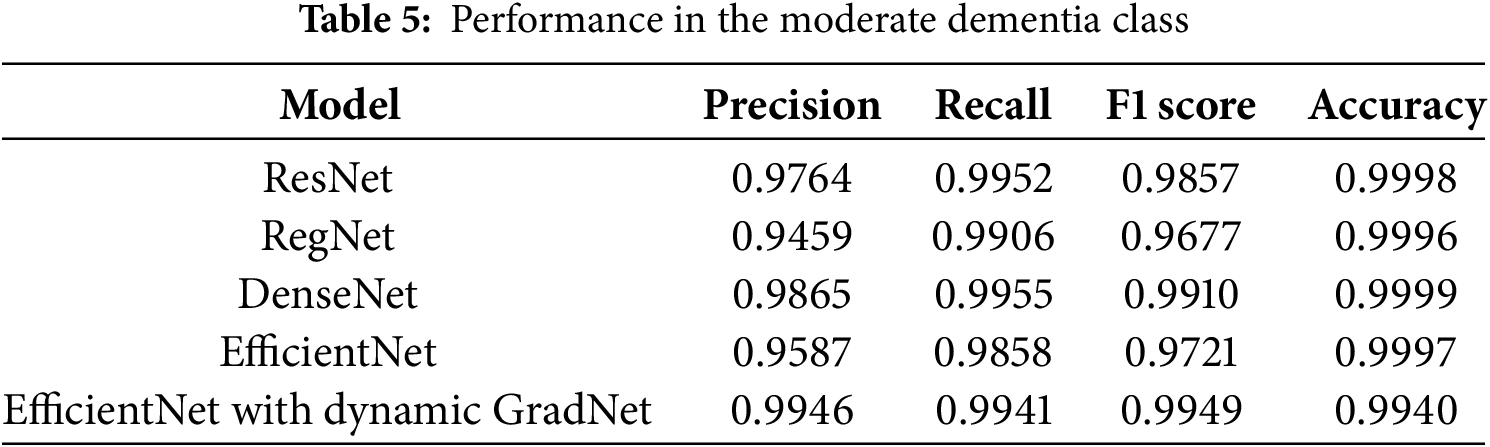
4.1.2 Performance in the Moderate Dementia Class
In the moderate dementia class, DenseNet achieved the highest accuracy (0.9999) and F1 score (0.9910), indicating its strong performance in correctly identifying both true positives and true negatives. Moreover, EfficientNet with Dynamic GradNet achieved the highest precision (0.9946), highlighting its robustness in minimizing false positives in this class, as shown in Table 5.
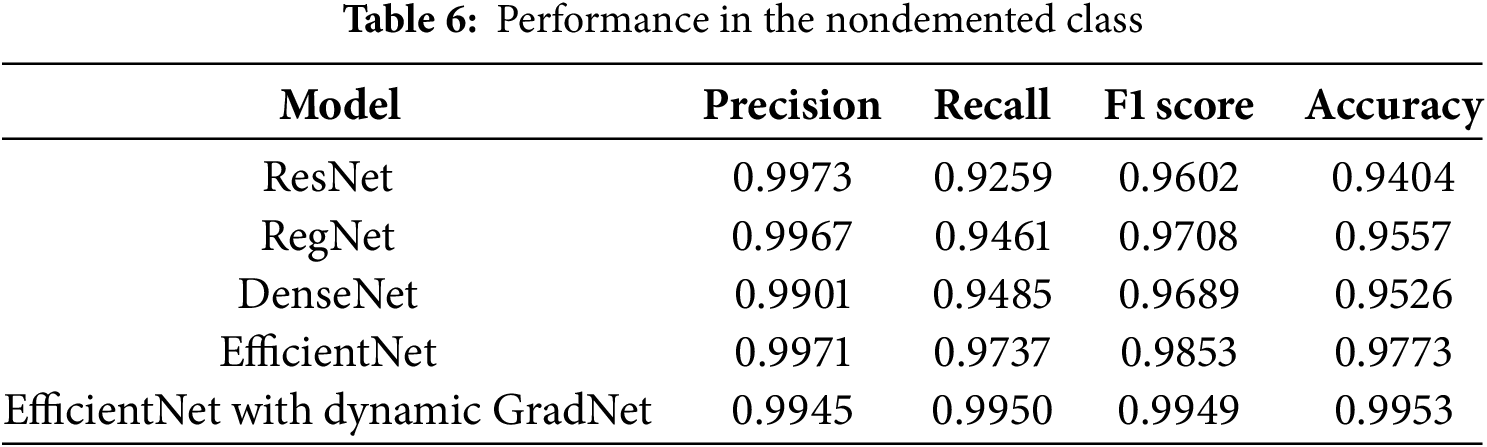
4.1.3 Performance in the Nondemented Class
For the nondemented class, EfficientNet with Dynamic GradNet achieved the highest recall (0.9950), F1 score (0.9949), and accuracy (0.9953), making it the most effective model for correctly identifying nondemented individuals. ResNet and EfficientNet exhibited the highest precision values (0.9973 and 0.9971, respectively), indicating their strong ability to minimize false positives in this category, as shown in Table 6.
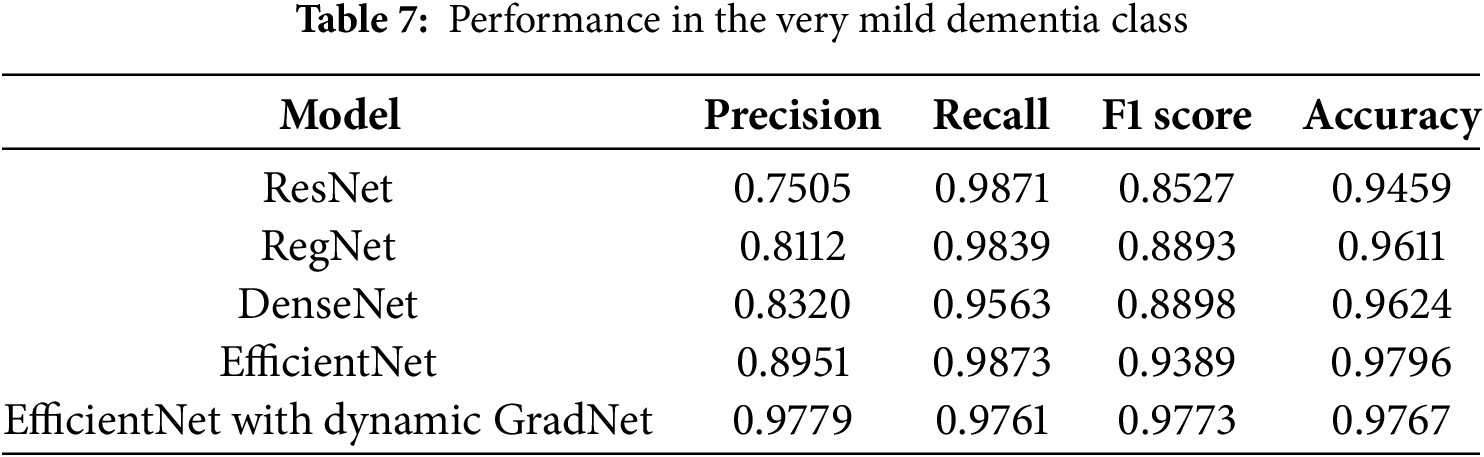
4.1.4 Performance in the Very Mild Dementia Class
In the very mild dementia class, EfficientNet with Dynamic GradNet outperformed all the other models, with the highest precision (0.9779), F1 score (0.9773), and accuracy (0.9767). This finding indicates the superior ability of EfficientNet with Dynamic GradNet to accurately detect early-stage dementia while maintaining a lower rate of false positives, as shown in Table 7.
4.2 Comprehensive Model Comparison
Fig. 4, presents the training and validation loss and accuracy curves over epochs for EfficientNet with Dynamic GradNet. These performance curves illustrate the model’s convergence behavior, highlighting its stability and generalization across training and validation sets.
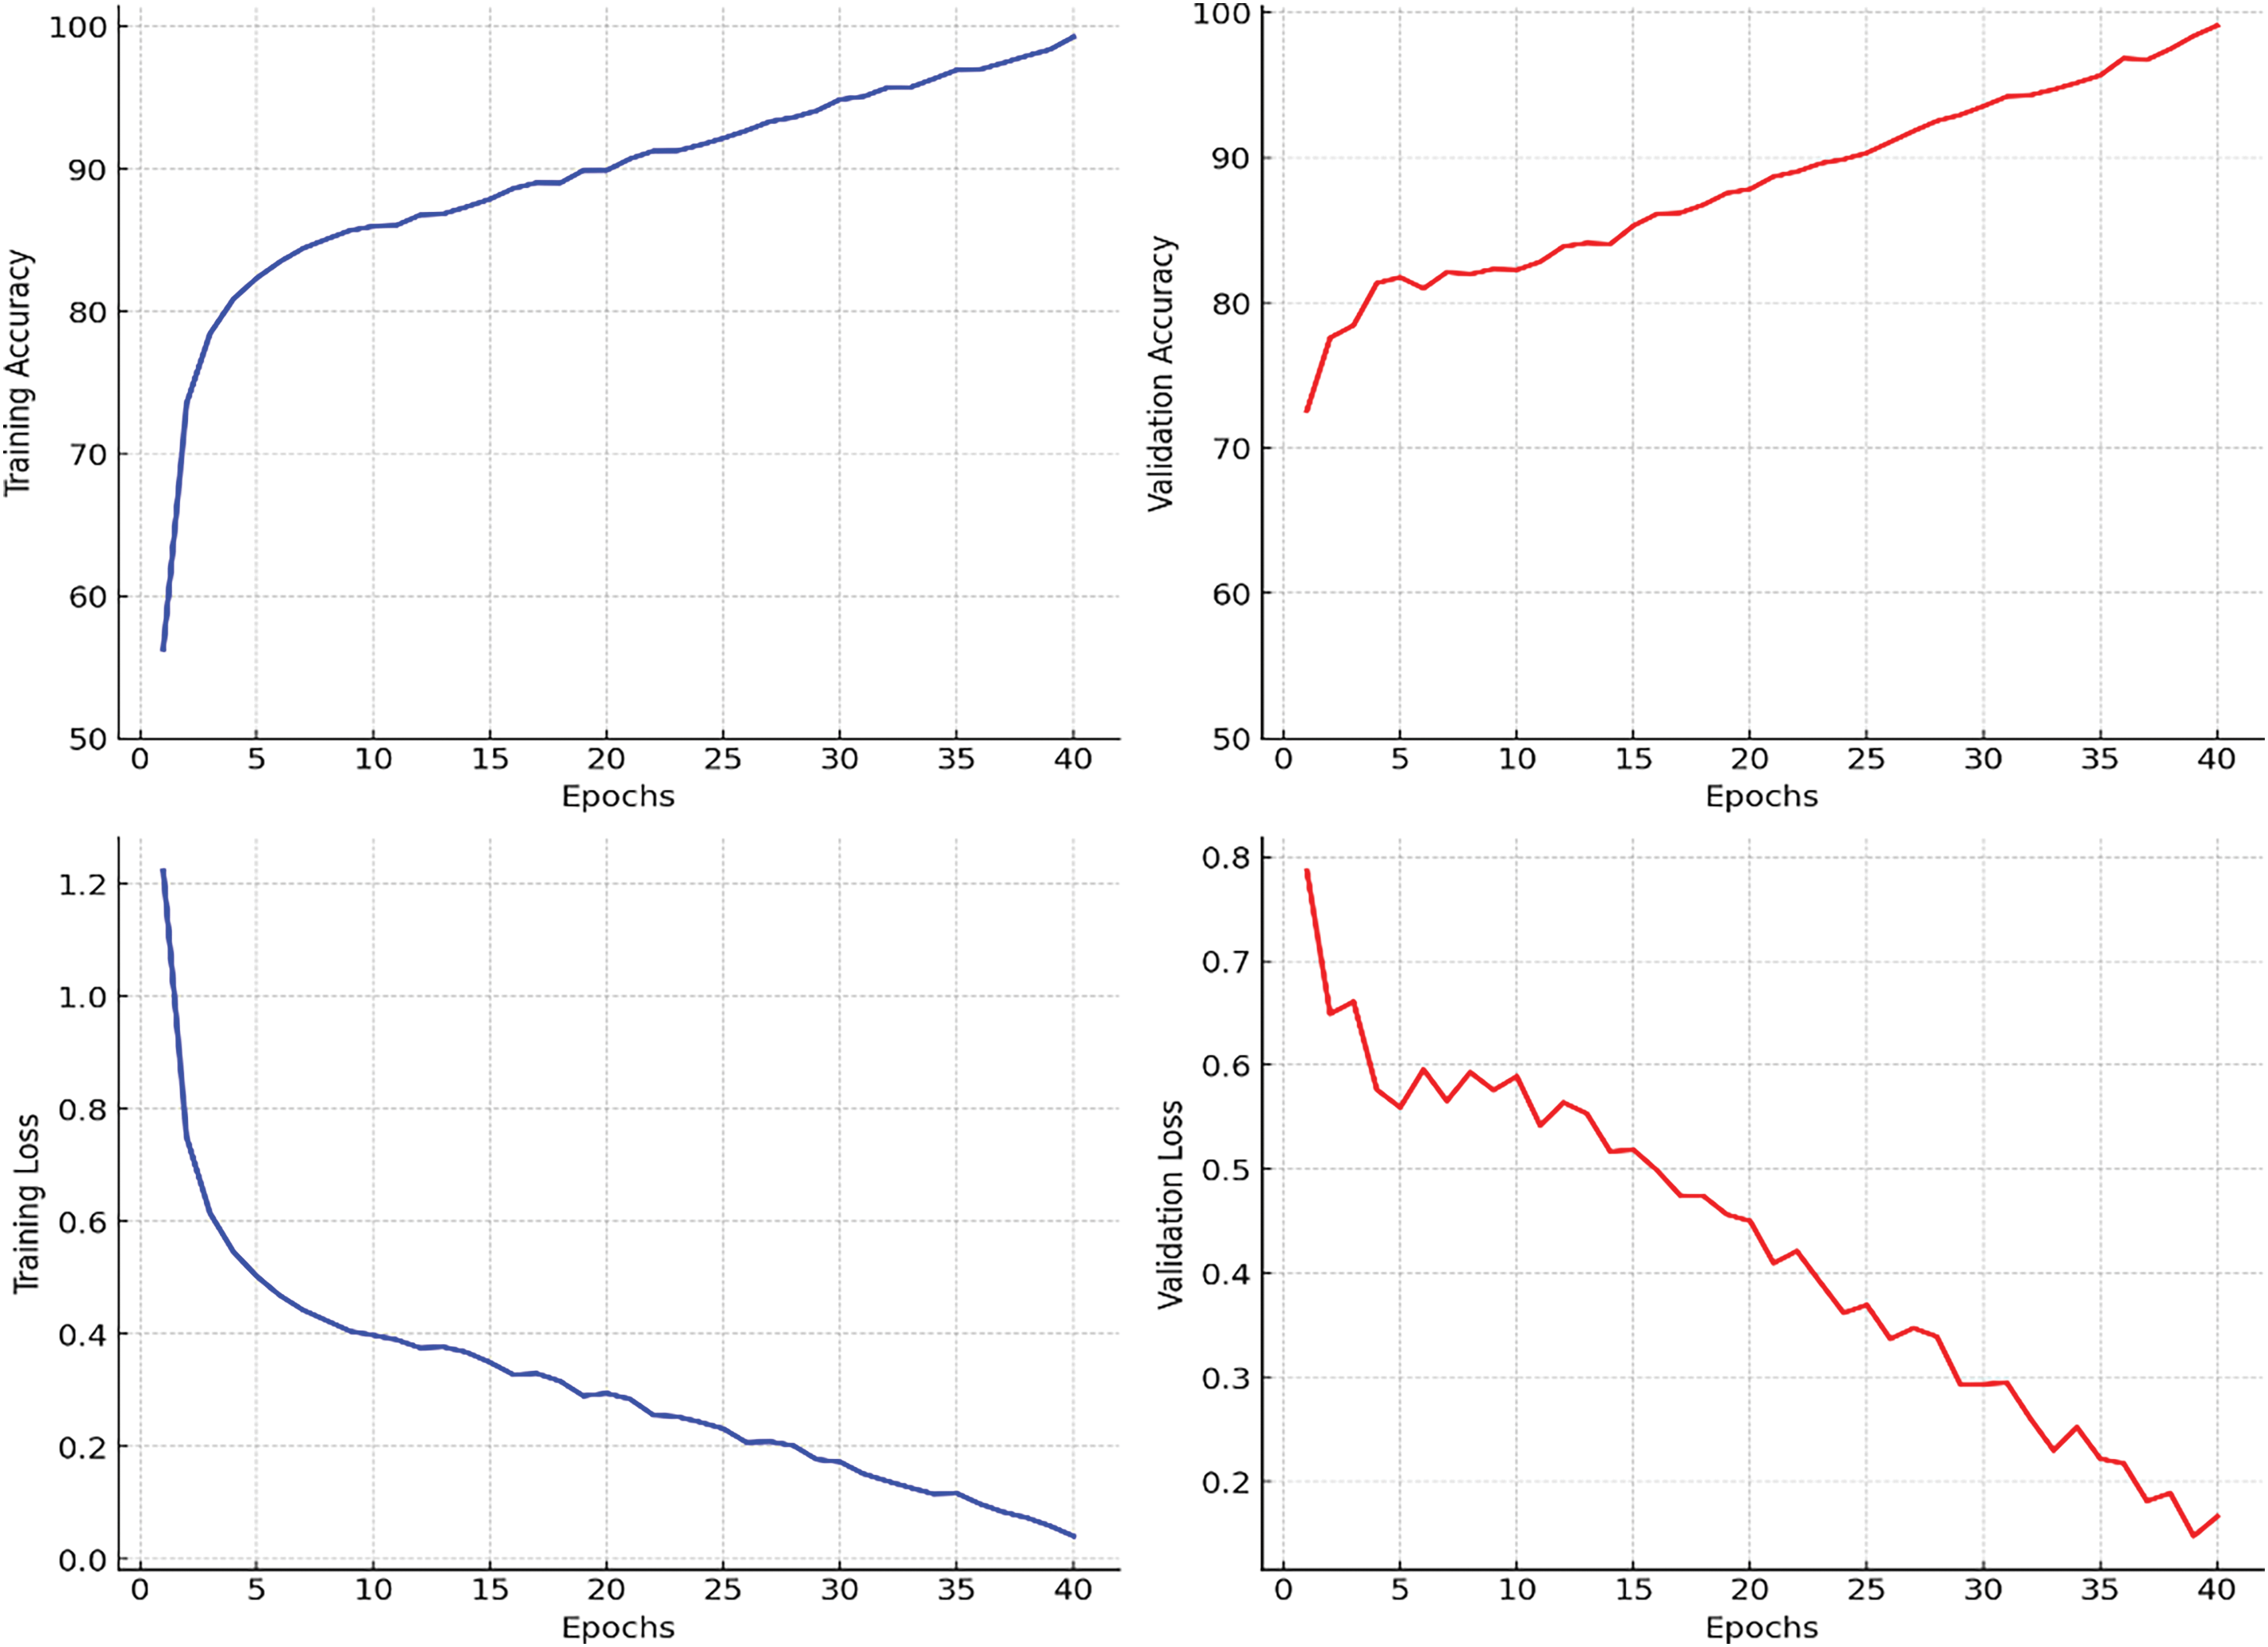
Figure 4: Training and validation performance curves for EfficientNet with dynamic GradNet
4.2.1 Average Performance across All Classes
Table 8 presents a summary of the average performance of each model across all classes. EfficientNet with Dynamic GradNet yielded the highest average scores across all the metrics, including precision (0.9896), recall (0.9878), F1 score (0.9887), and accuracy (0.9903). This finding indicates that EfficientNet with Dynamic GradNet not only performs well across individual classes but also generalizes effectively across the entire dataset as illustrated in Fig. 5.
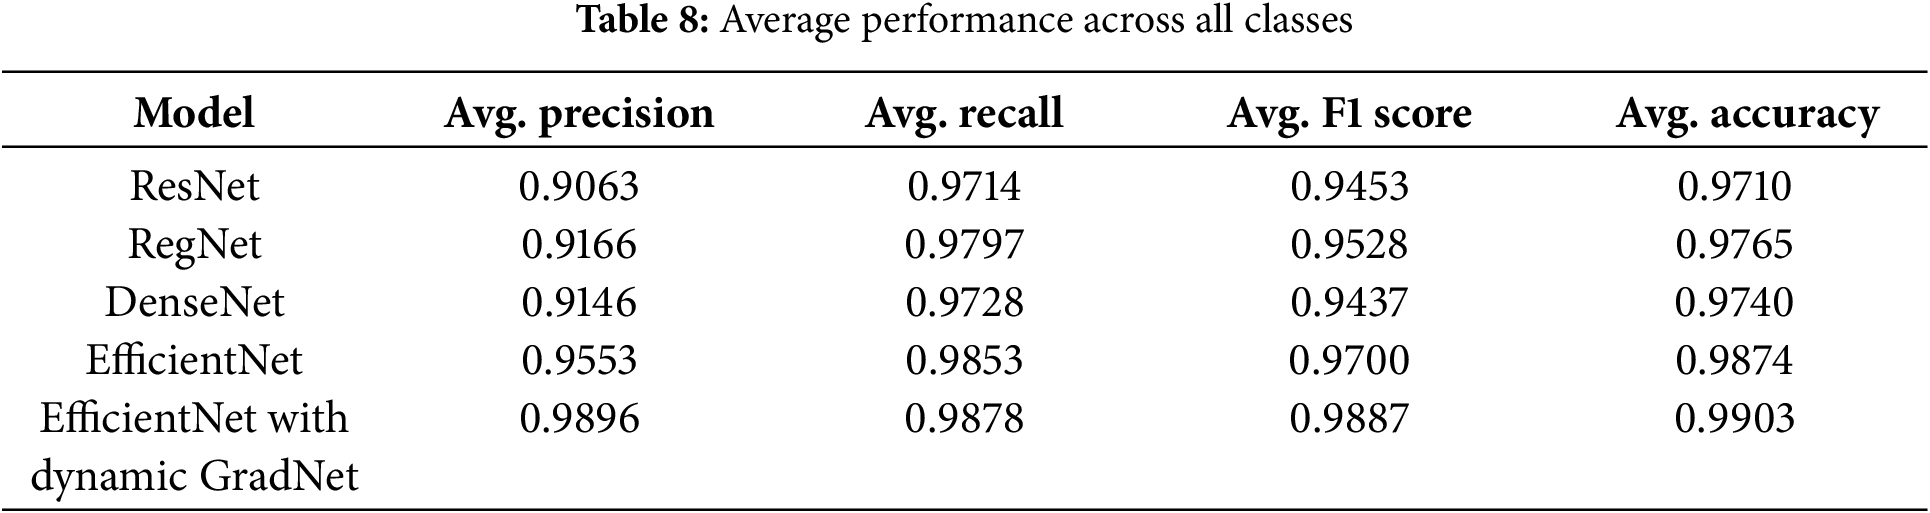
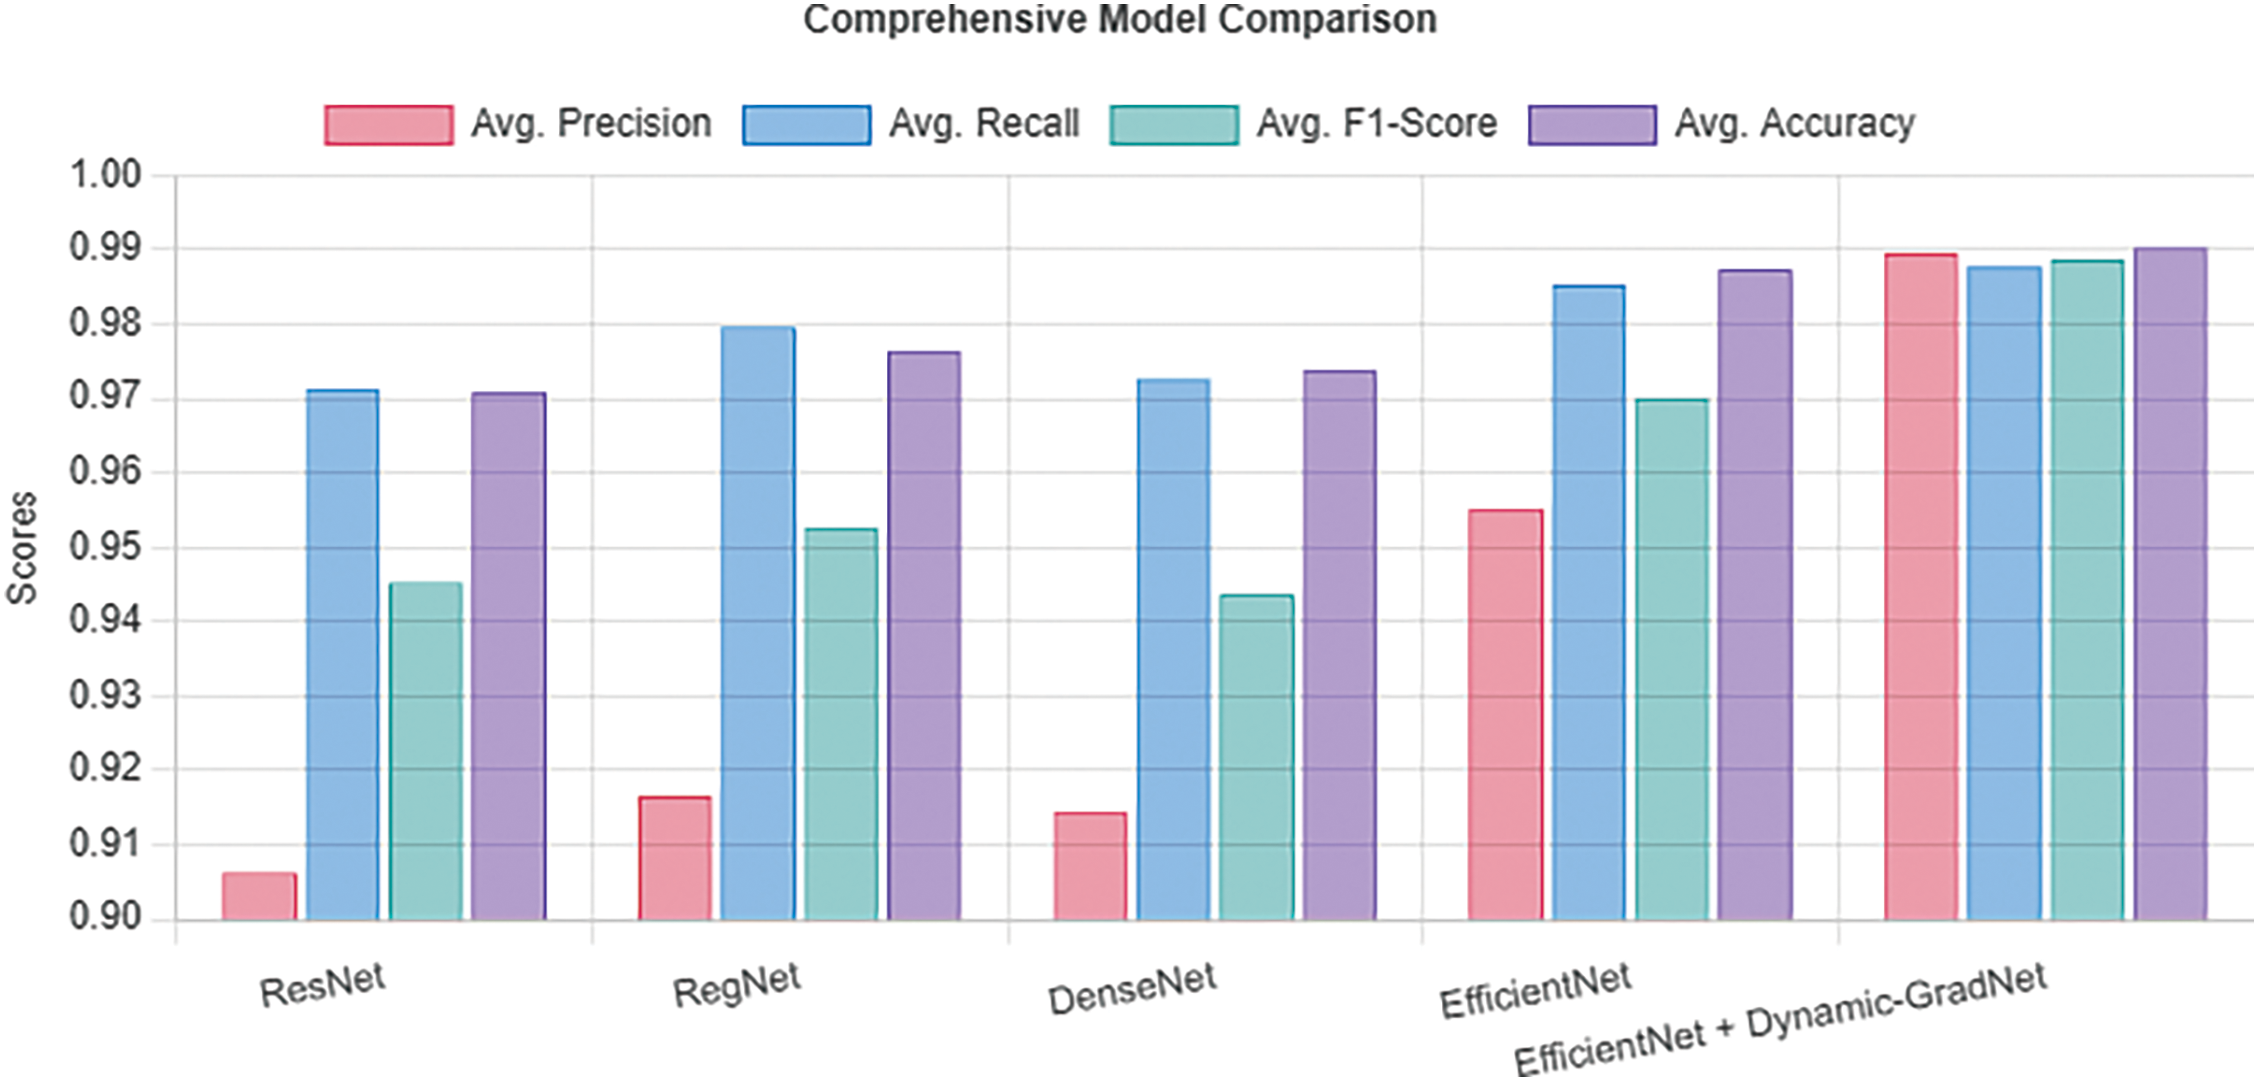
Figure 5: Average performance across all classes
The integration of EfficientNet with Dynamic GradNet has notably enhanced the model’s ability to focus on critical regions, as illustrated in Fig. 6. The GradCAM visualizations demonstrate a progressive refinement in attention across four stages of Alzheimer’s disease progression (moderate dementia, mild dementia, very mild dementia, and nondemented). Each stage is represented by a sequence of four images, showing how the model’s focus improves over training, gradually capturing more relevant brain regions in MRI scans. Additionally, Fig. 6, also presents examples of failure cases from other models, which failed to emphasize critical areas and missed essential brain regions relevant to Alzheimer’s diagnosis. These failure cases (not EfficientNet with Dynamic GradNet) highlight the limitations of models without dynamic weighting, further emphasizing the effectiveness of the proposed approach in improving model robustness and reliability for MRI-based Alzheimer’s disease classification.
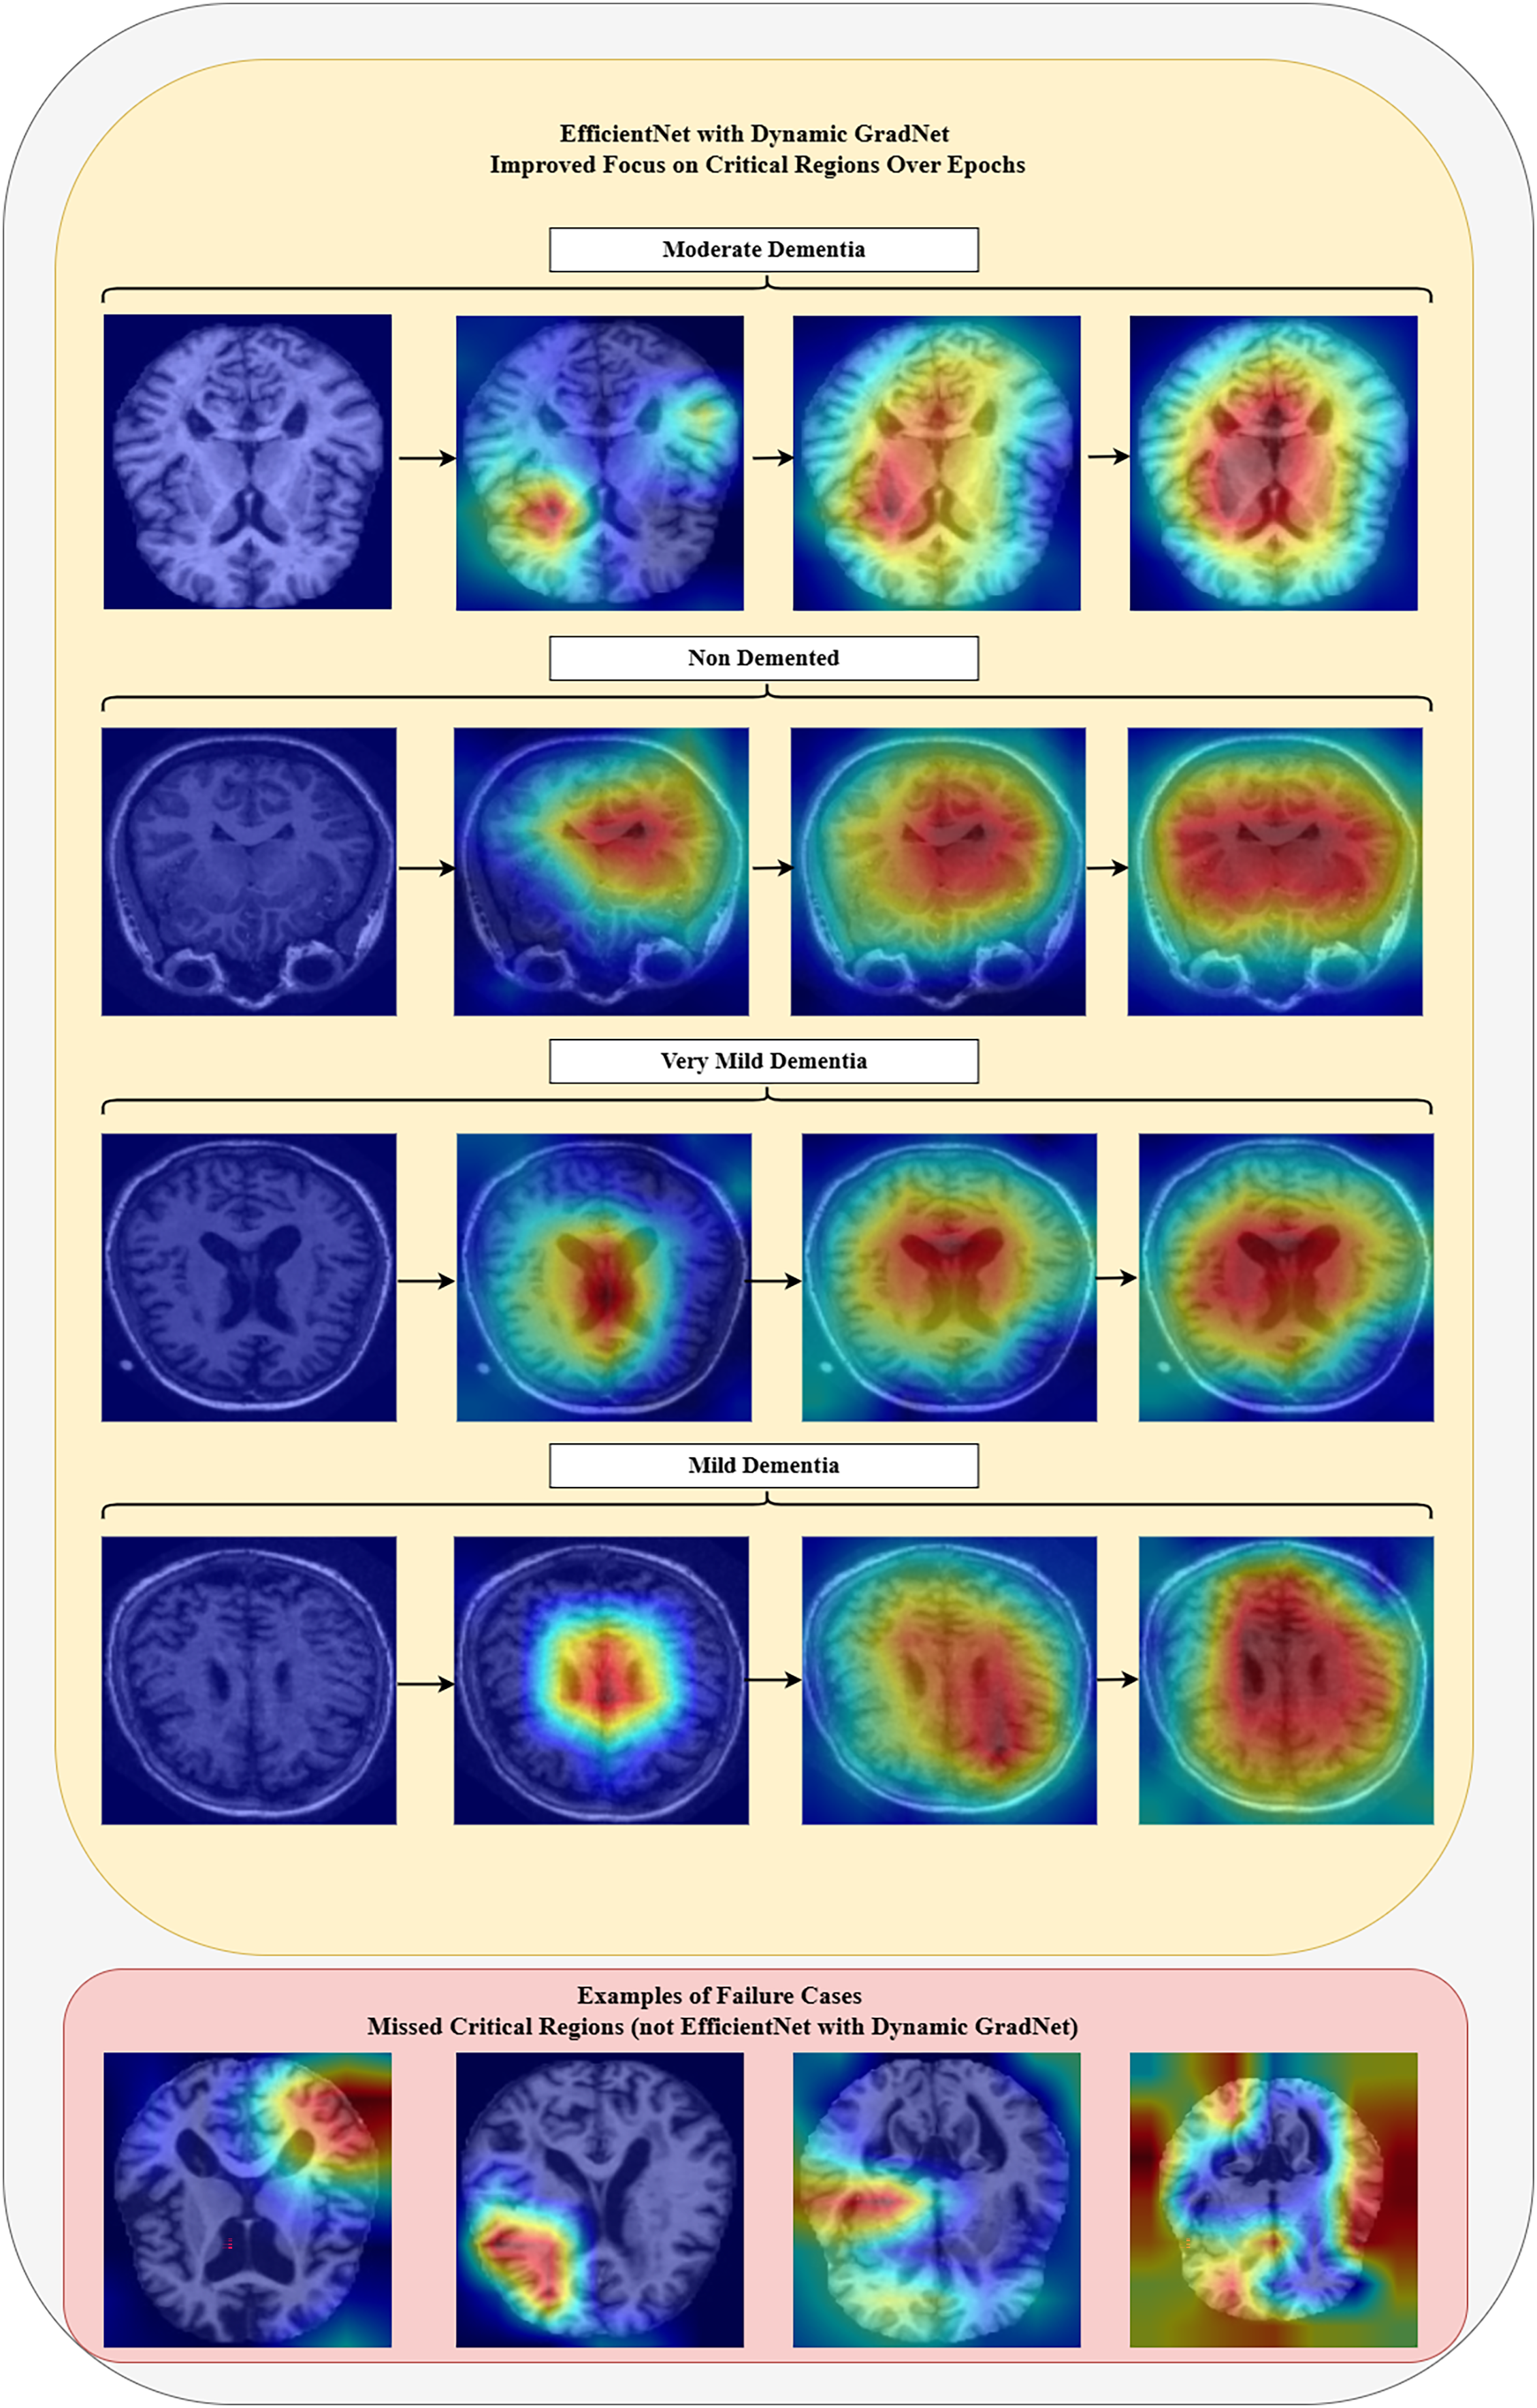
Figure 6: Model focus analysis
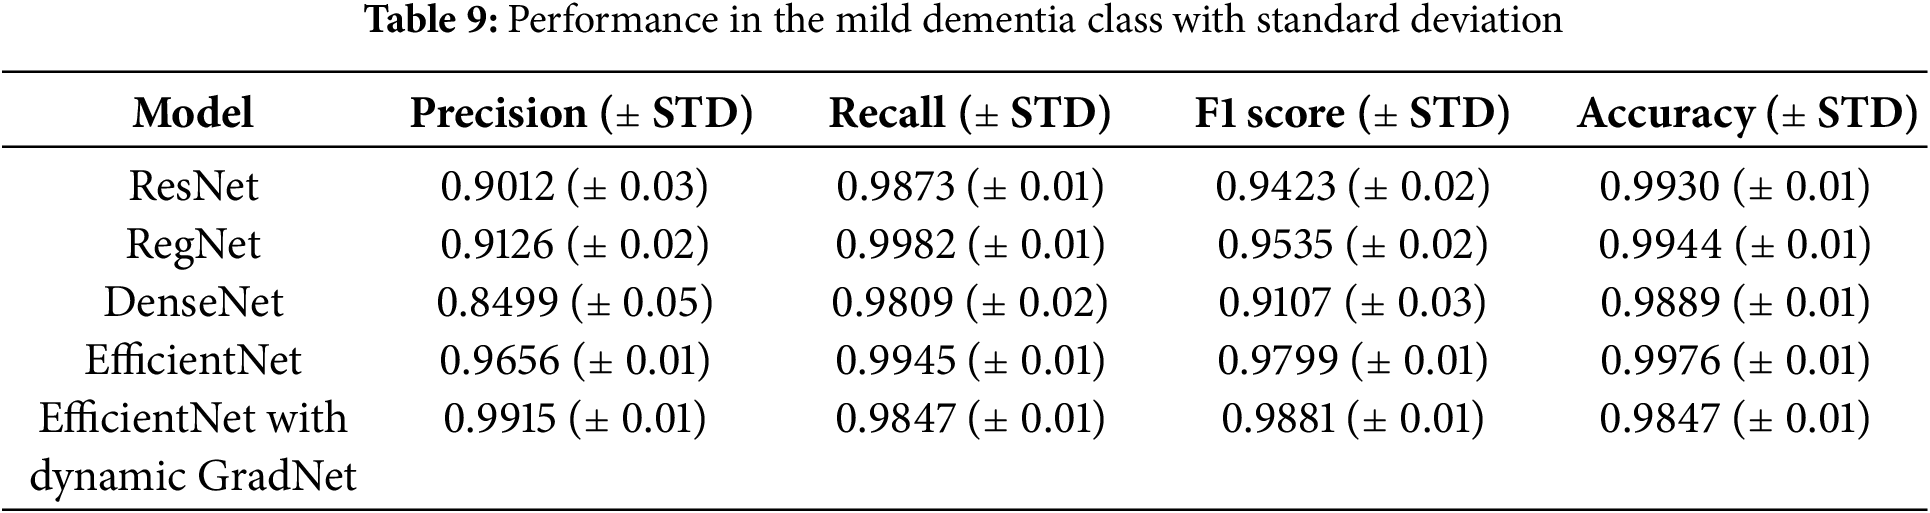
4.2.2 Performance in the Mild Dementia Class with Standard Deviation
The results for the mild dementia class are further detailed with standard deviations, highlighting the consistency of each model. EfficientNet with Dynamic GradNet not only achieved the highest precision and F1 score but also maintained a low variance, indicating its stable and reliable performance across different test samples.
Table 9 reports the standard deviation (STD) for each metric, providing insight into the consistency and reliability of the model’s performance. The low variance across multiple runs further supports the robustness of the proposed EfficientNet with Dynamic GradNet framework.
4.2.3 Sensitivity and Specificity Analysis
Table 10 presents a comparison of each model’s sensitivity (recall) and specificity across the four classes. EfficientNet with Dynamic GradNet consistently performed well across all categories, particularly in the nondemented and moderate dementia classes with high specificity, indicating its strong ability to minimize false positives. Similarly, it achieved high sensitivity in detecting true positives, especially in the very mild dementia class, which is crucial for early diagnosis. The improvements in specificity and sensitivity achieved by EfficientNet with Dynamic GradNet compared to other models, including DenseNet, RegNet, and the baseline EfficientNet, are comprehensively illustrated in Figs. 7 through 14.
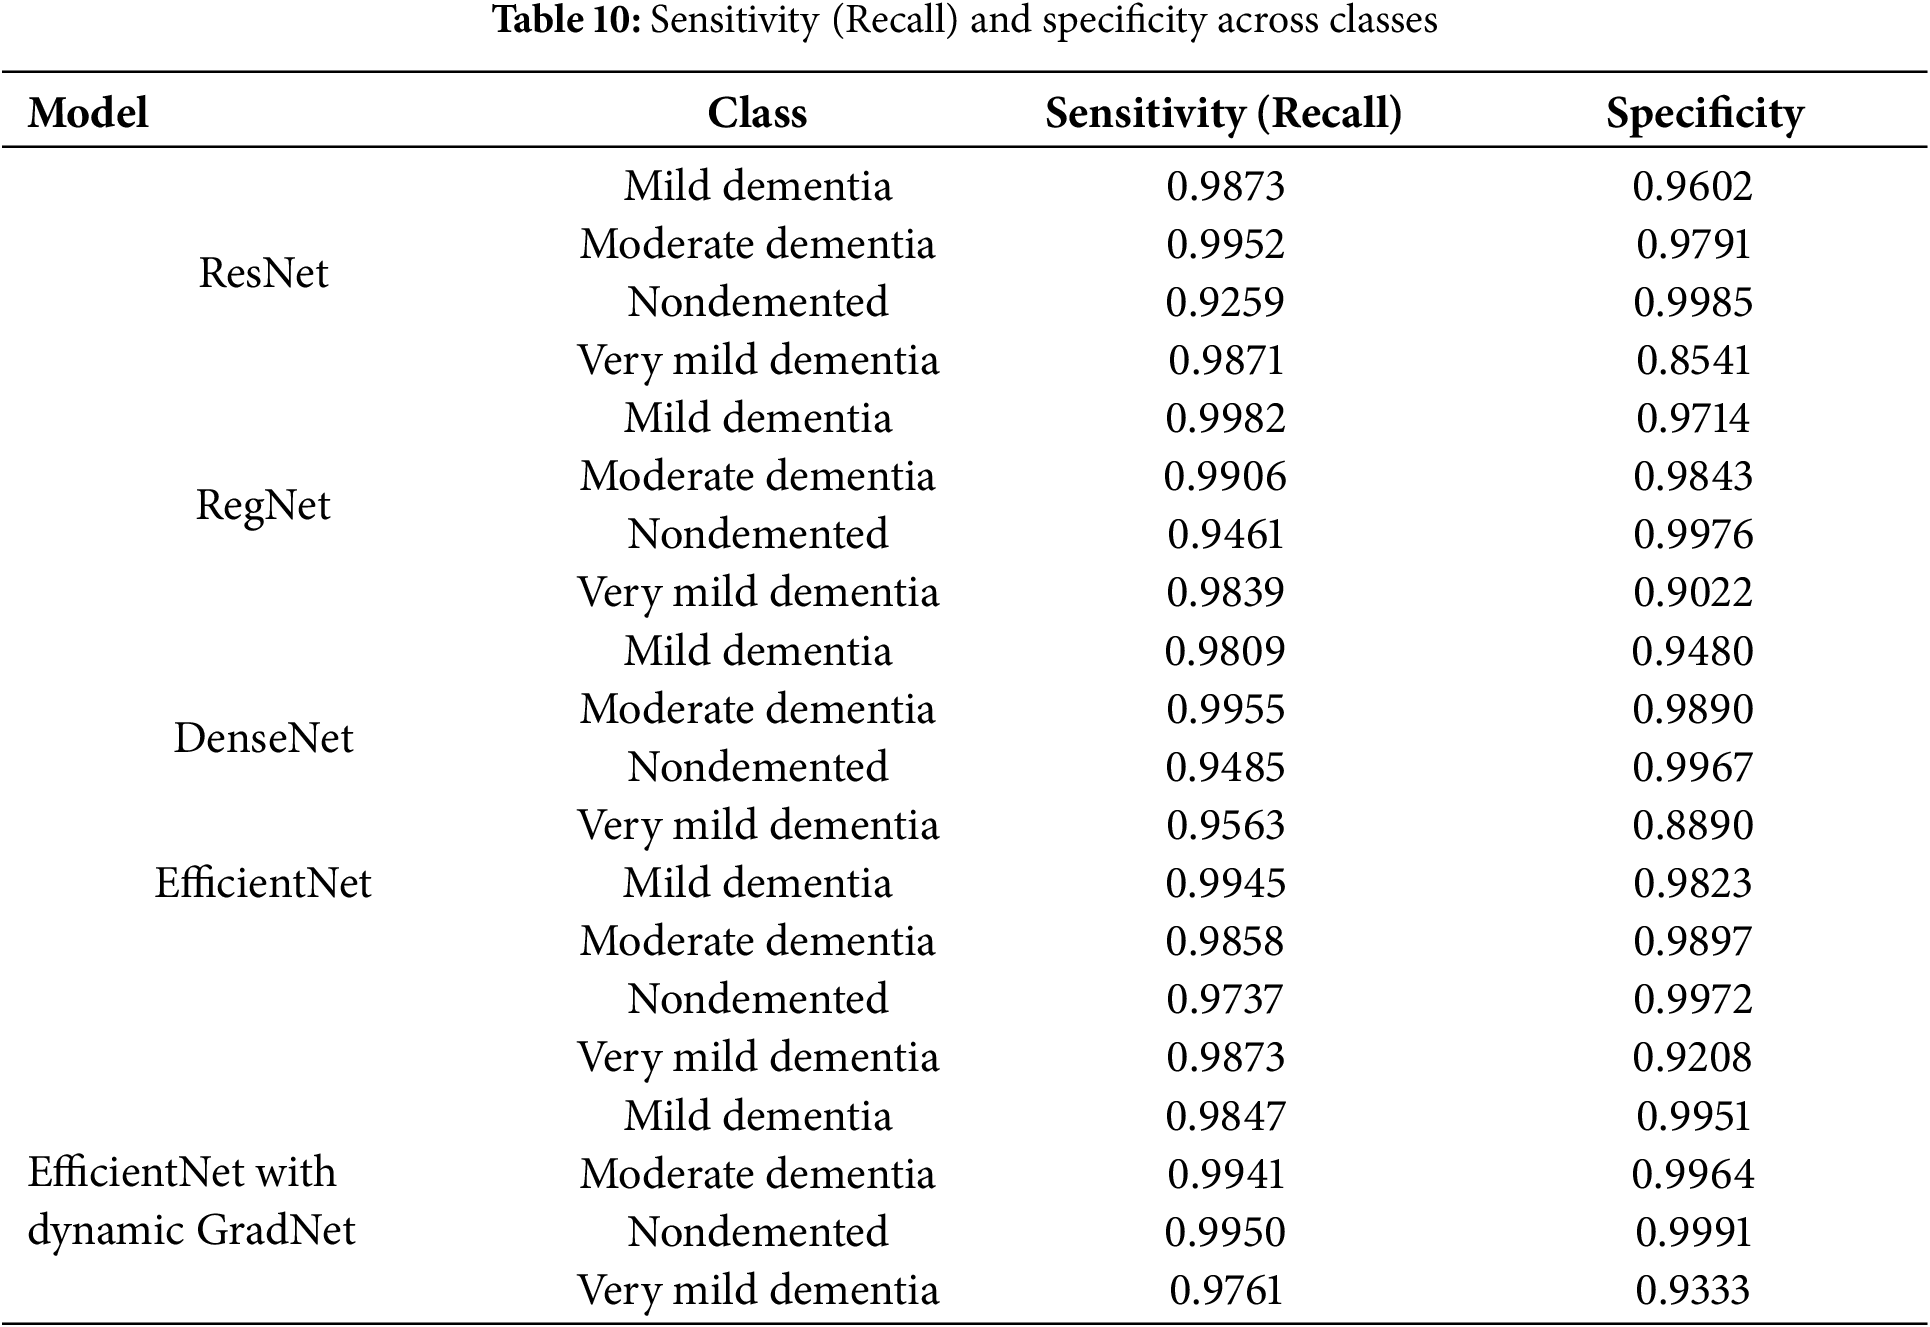
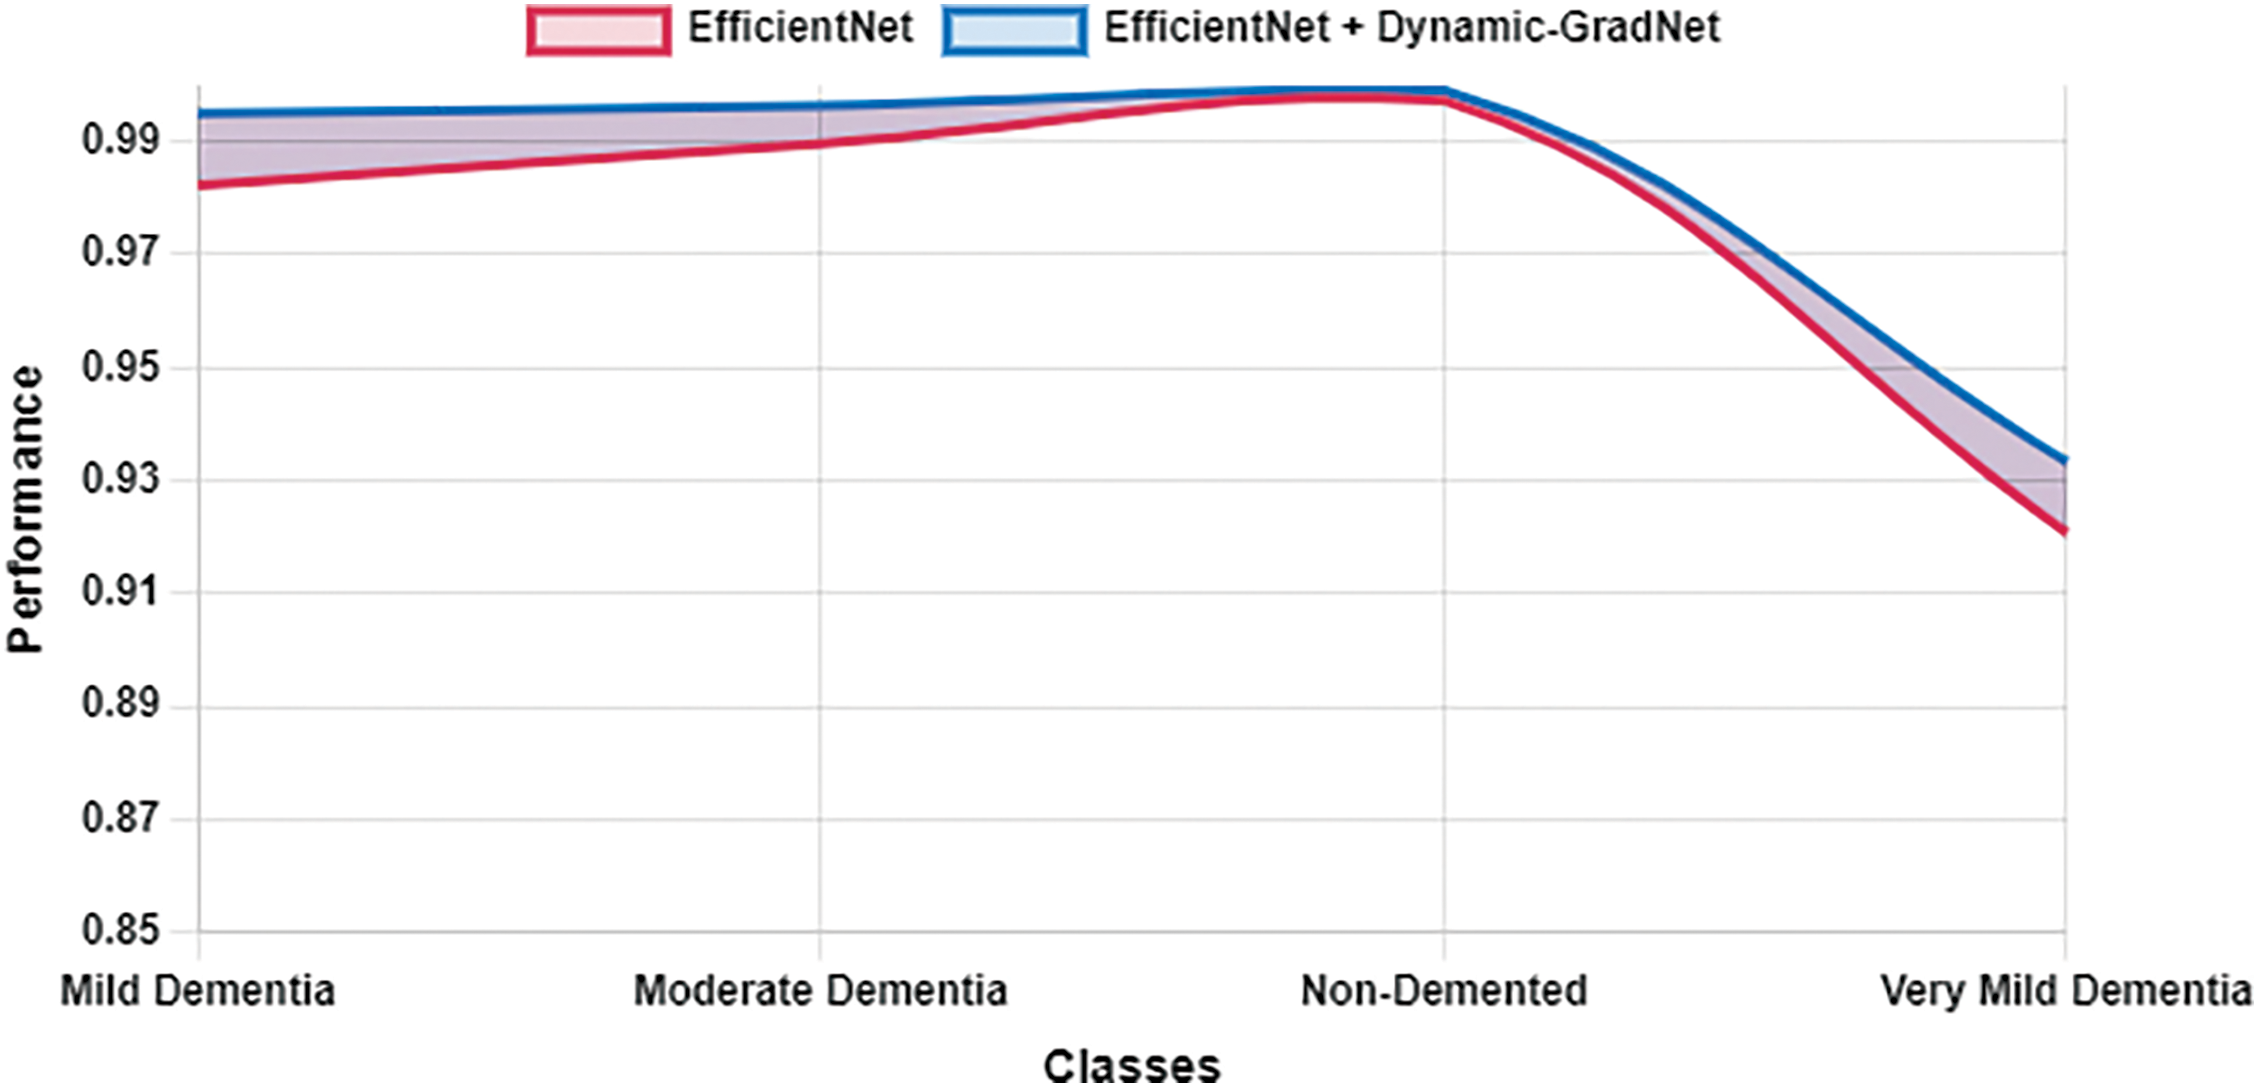
Figure 7: Specificity EfficientNet vs. EfficientNet with dynamic GradNet
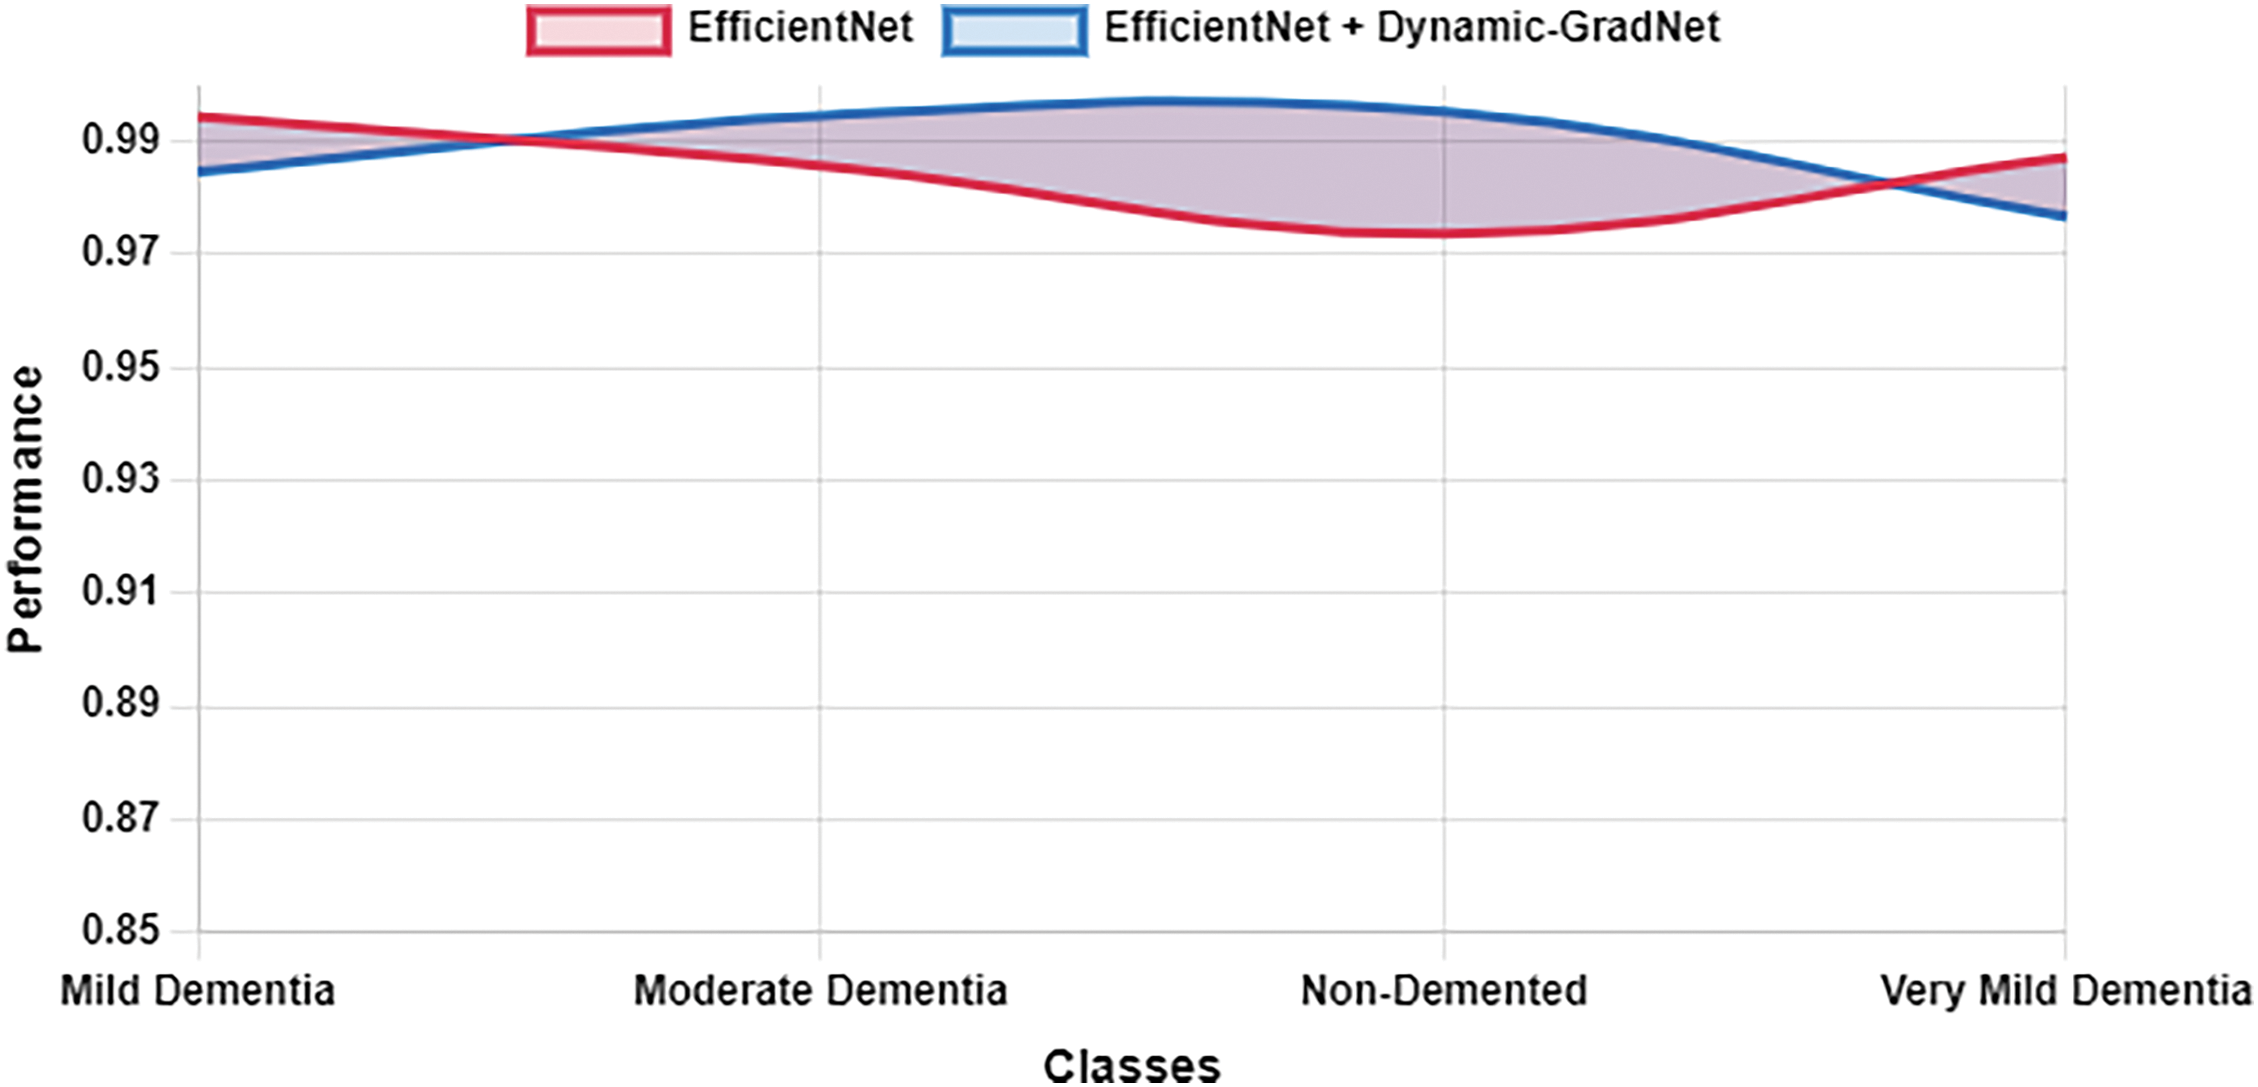
Figure 8: Sensitivity EfficientNet vs. EfficientNet with dynamic GradNet
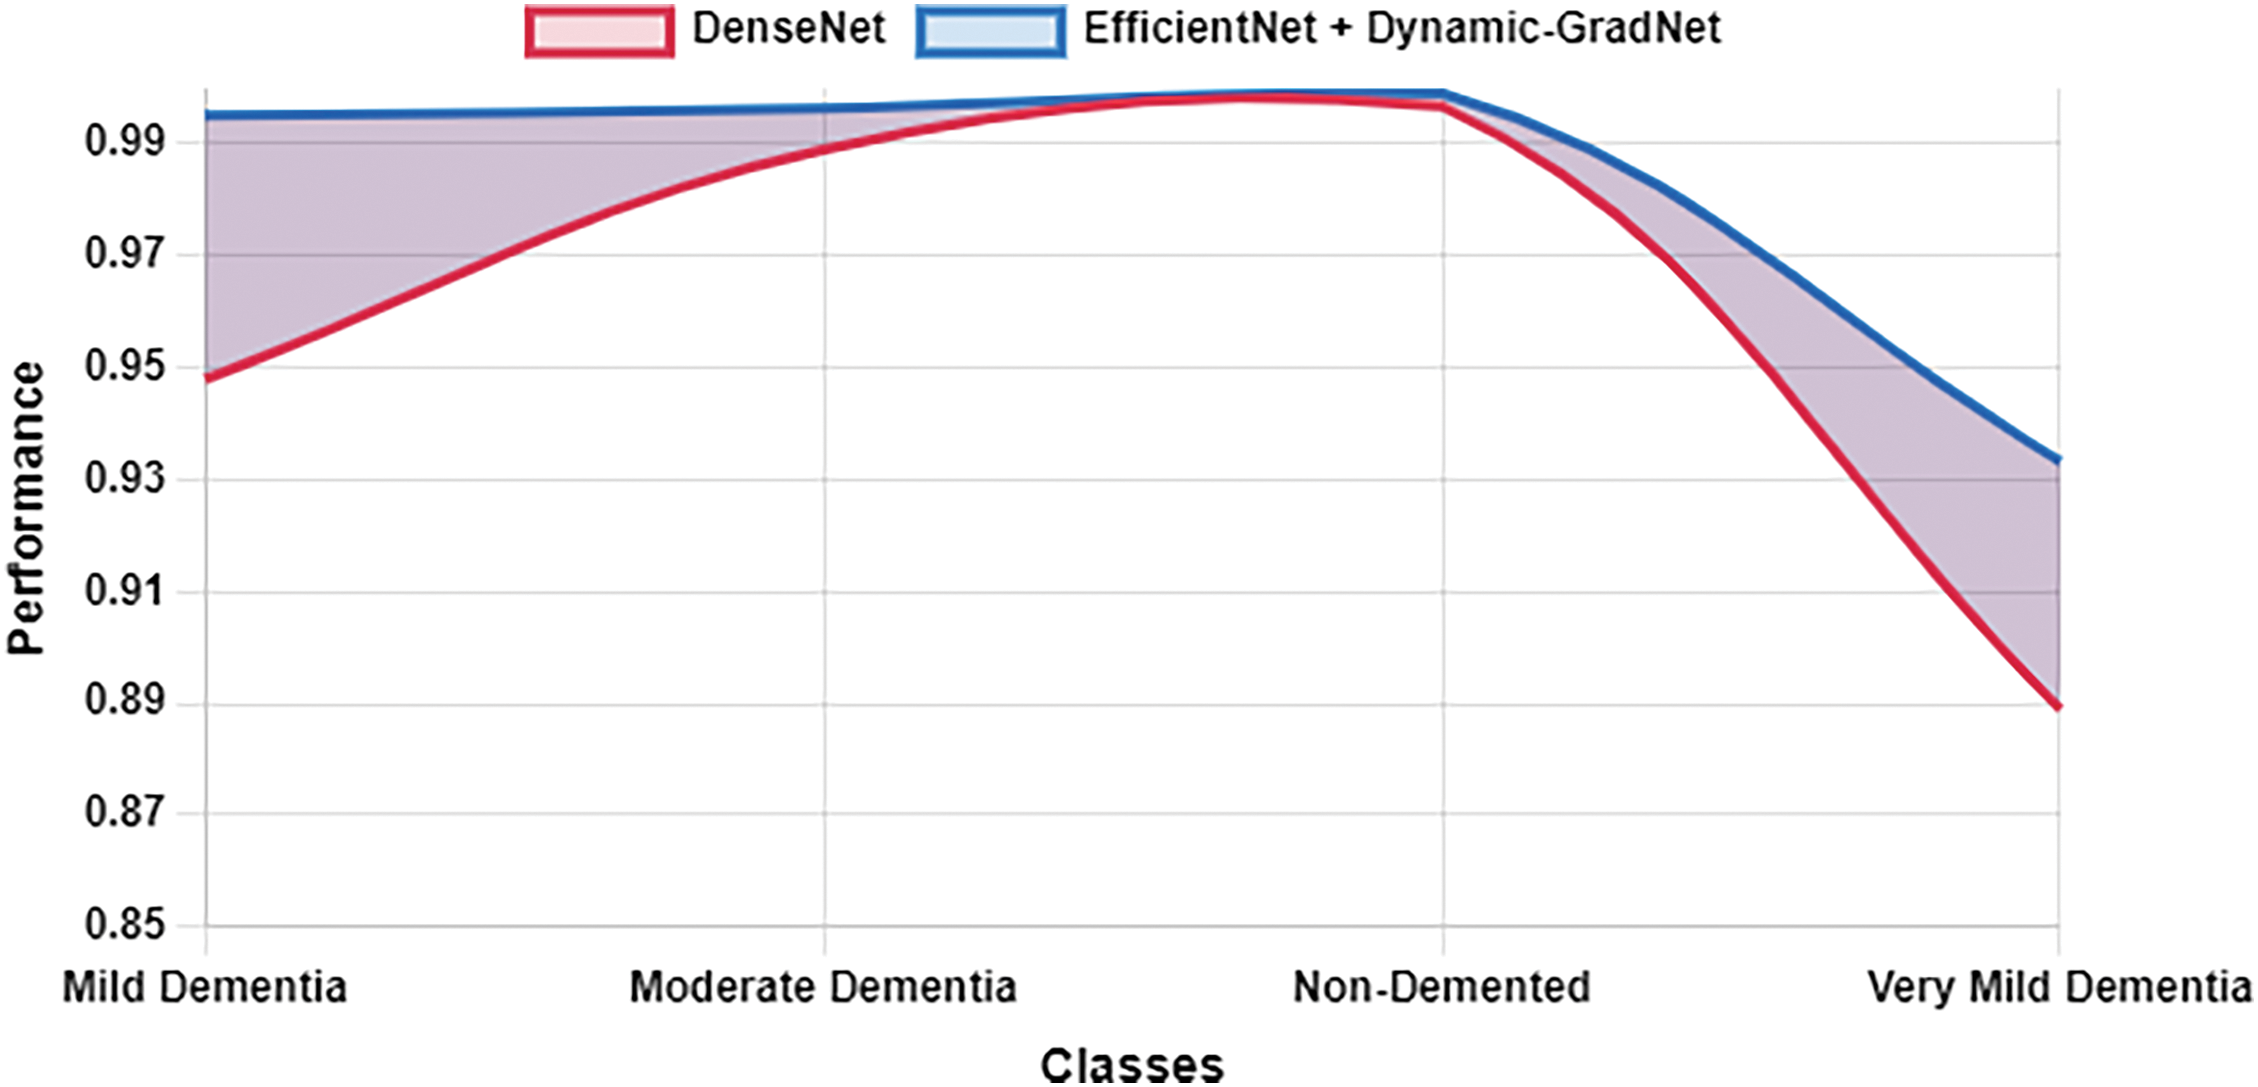
Figure 9: Specificity DenseNet vs. EfficientNet with Dynamic GradNet
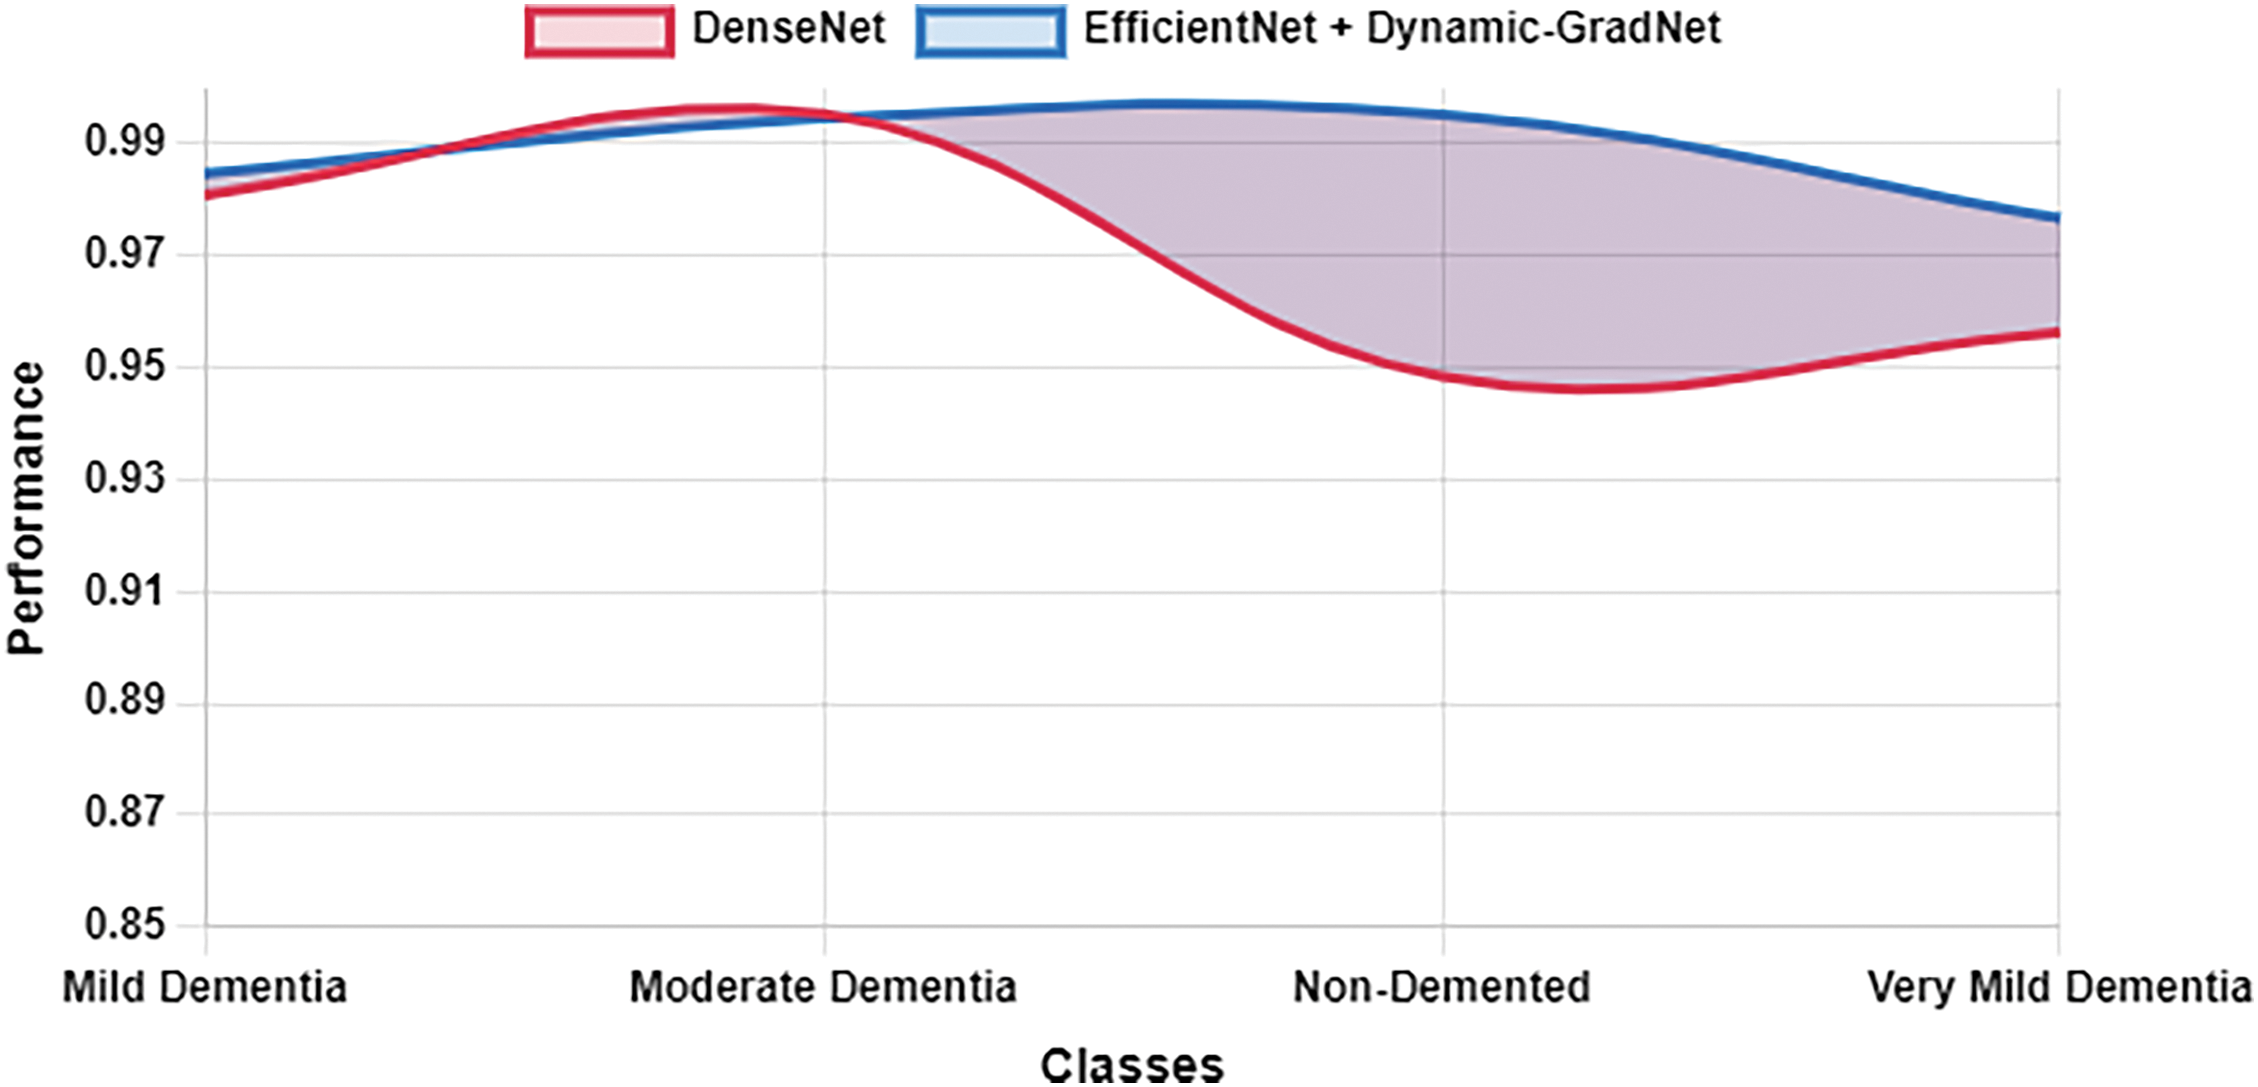
Figure 10: Sensitivity DenseNet vs. EfficientNet with Dynamic GradNet
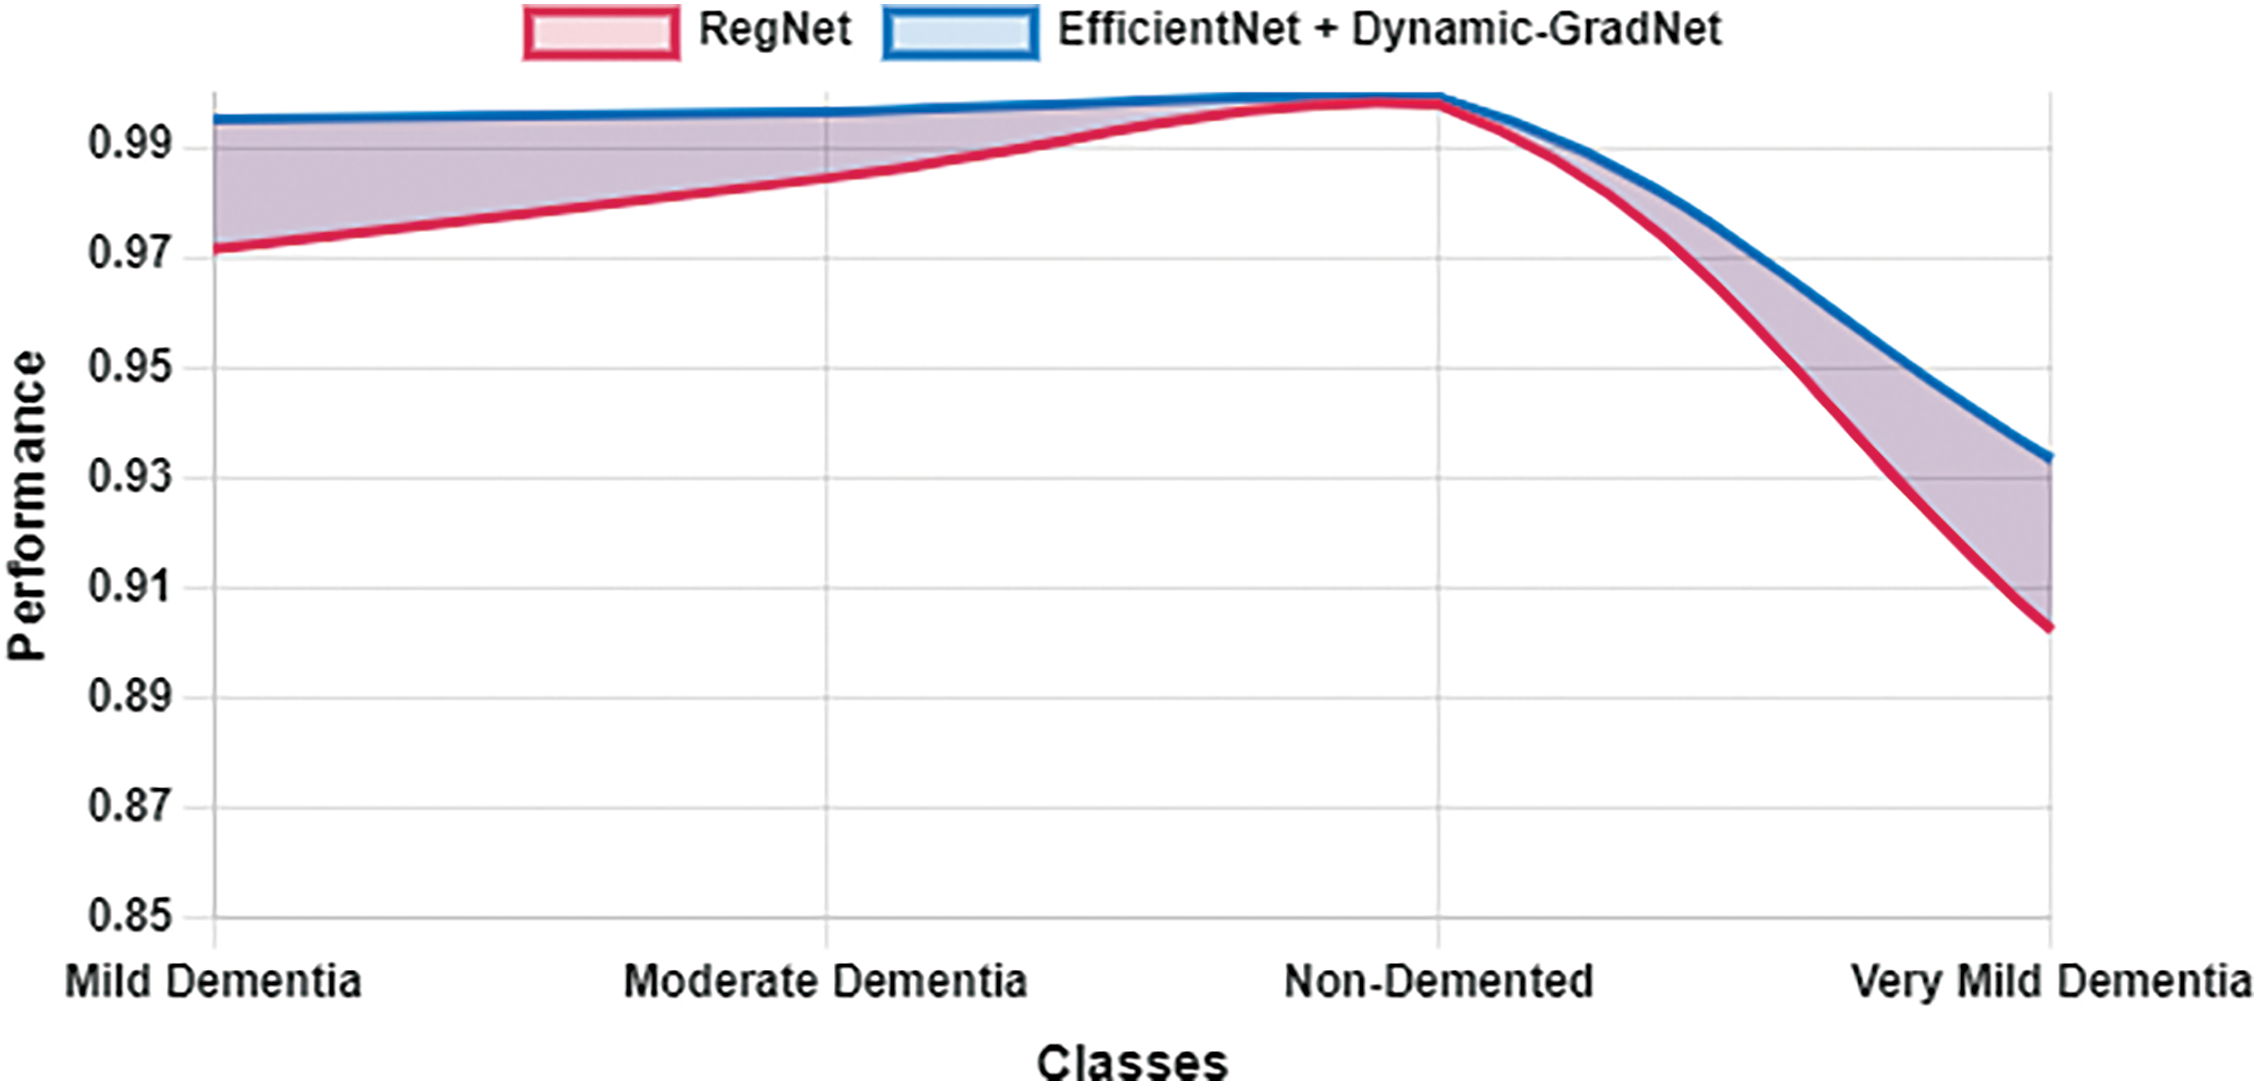
Figure 11: Specificity RegNet vs. EfficientNet with dynamic GradNet
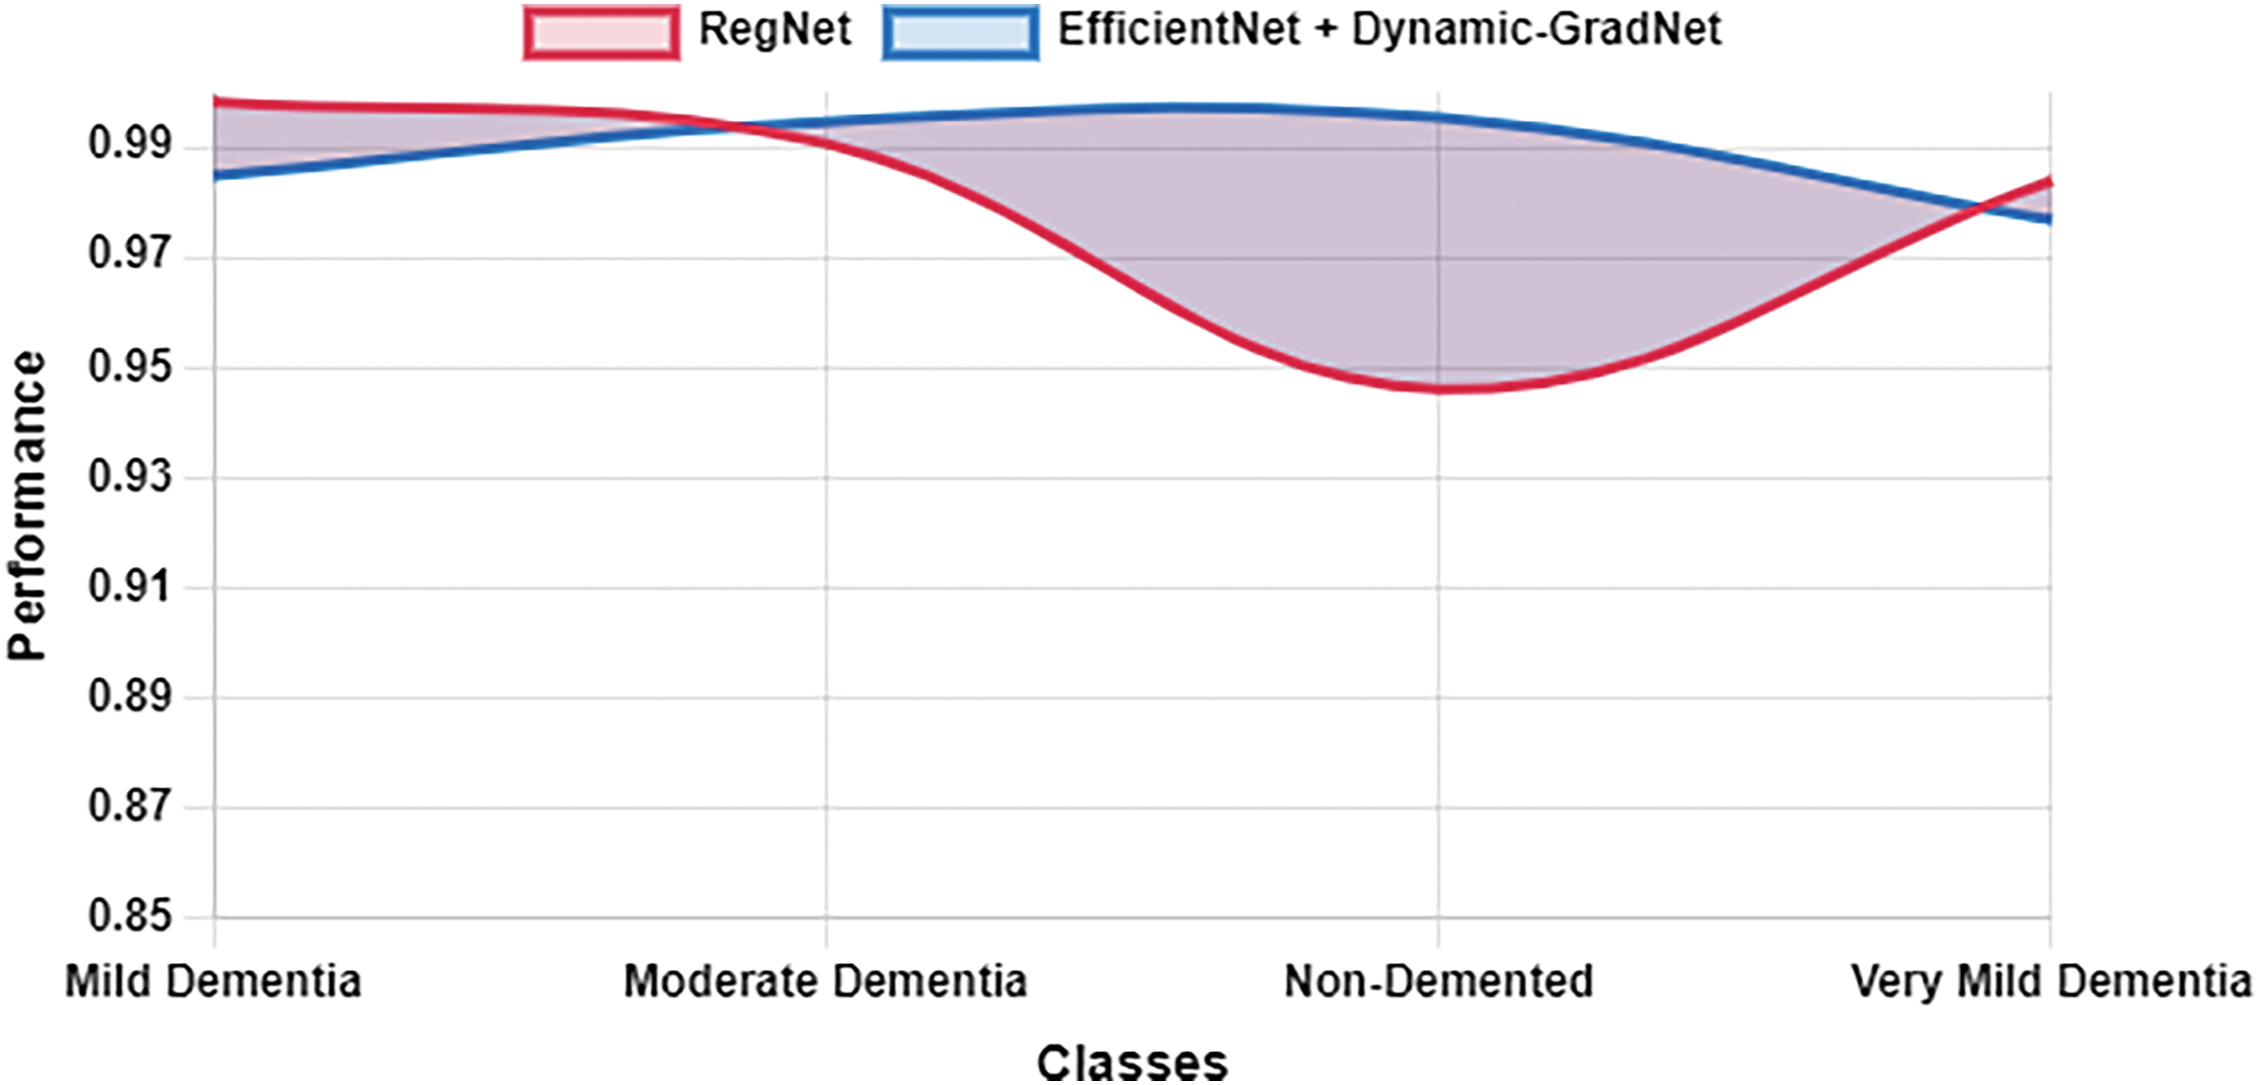
Figure 12: Sensitivity RegNet vs. EfficientNet with dynamic GradNet
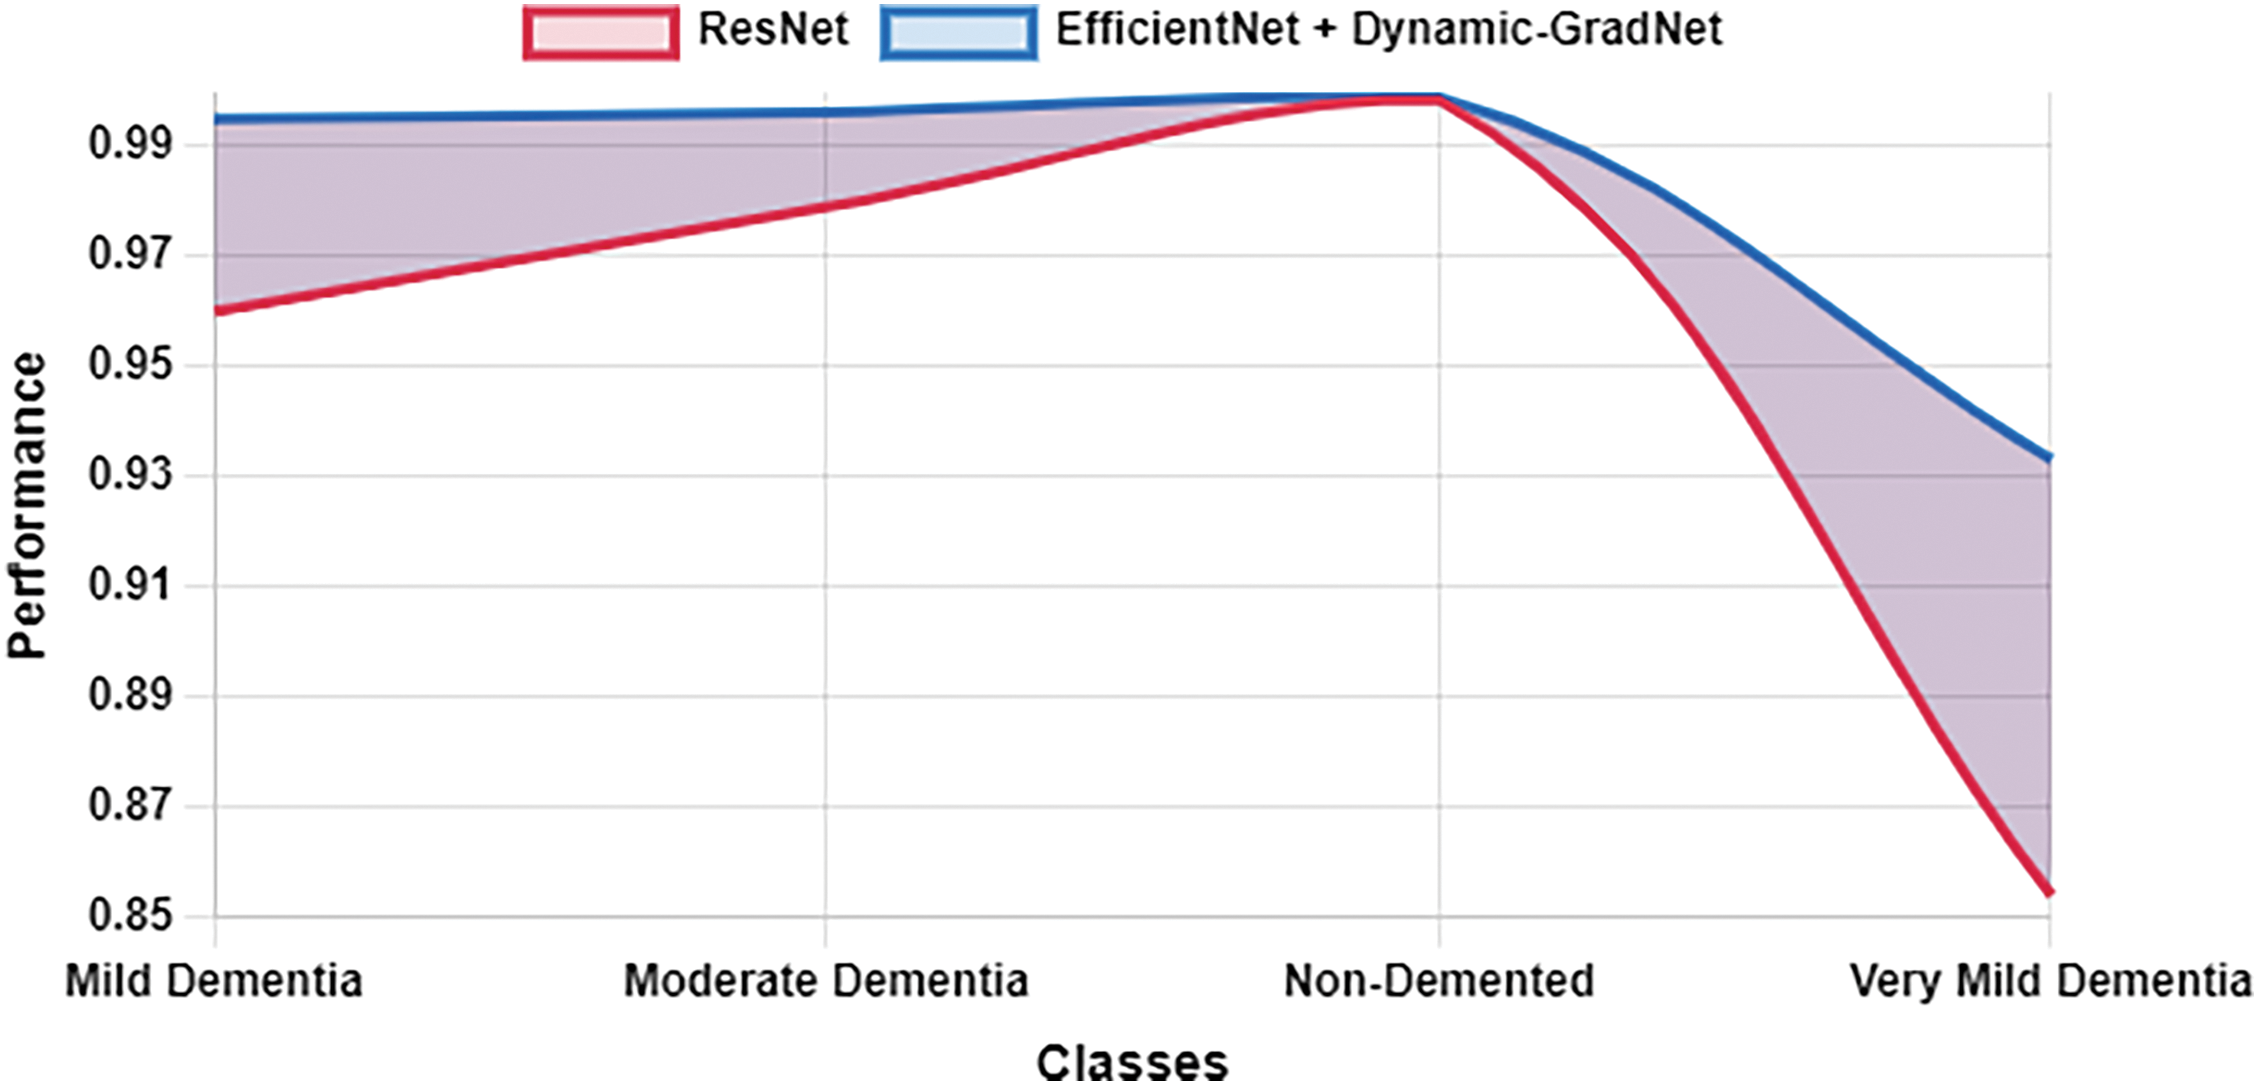
Figure 13: Specificity ResNet vs. EfficientNet with dynamic GradNet
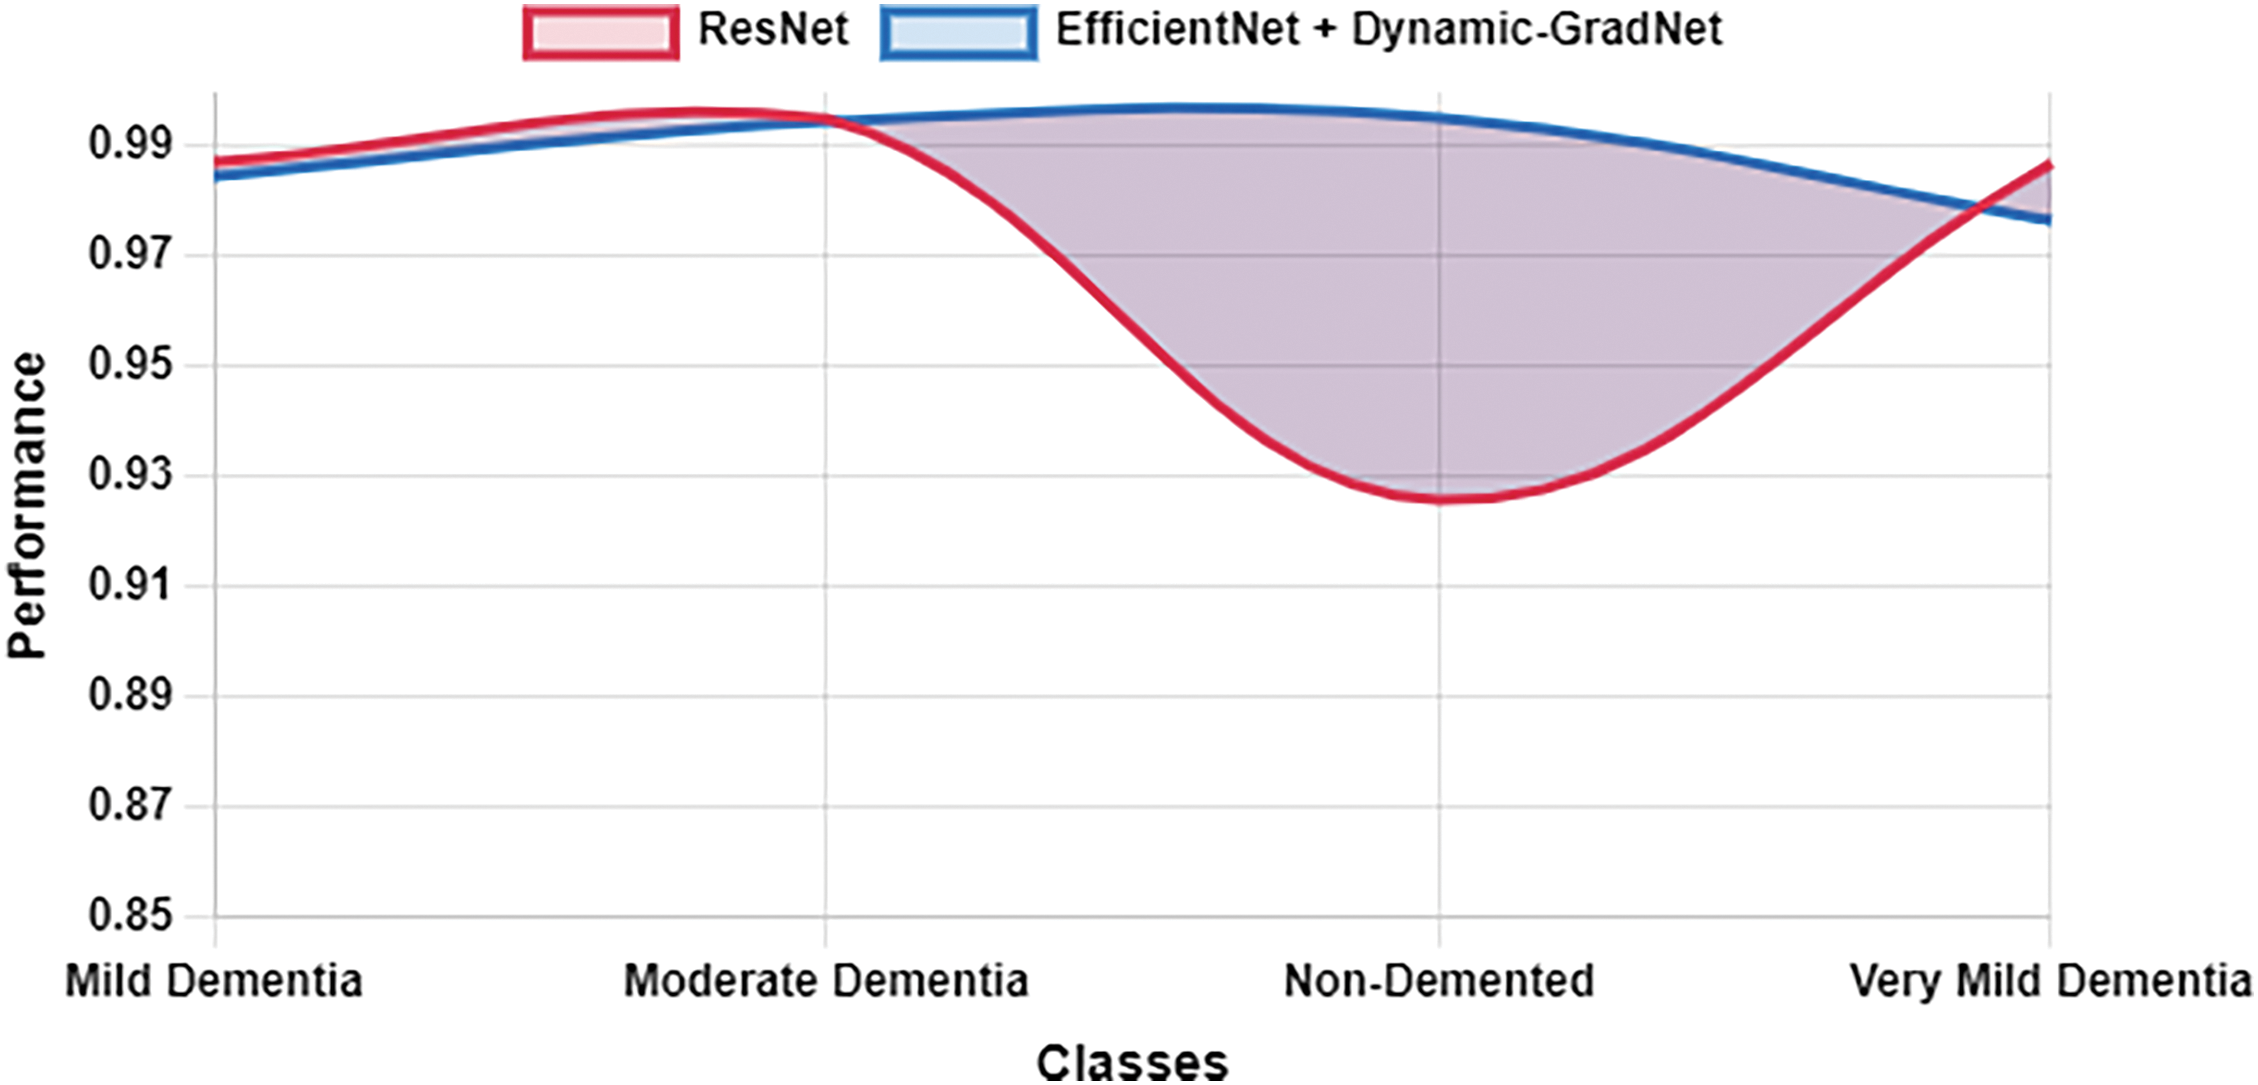
Figure 14: Sensitivity ResNet vs. EfficientNet with dynamic GradNet
5.1 Comparative Analysis of Model Performance: ResNet, RegNet, DenseNet, EfficientNet, and EfficientNet with Dynamic GradNet
The results from the comparative analysis reveal significant insights into the performance of various deep learning models, including ResNet, RegNet, DenseNet, EfficientNet, and the proposed EfficientNet with Dynamic GradNet, in the context of AD classification. These models were evaluated across four distinct categories: mild dementia, moderate dementia, nondemented, and very mild dementia. The discussion below highlights key trends and observations, focusing on the tradeoffs between precision, recall, the F1 score, and accuracy and the models’ generalizability.
5.1.1 Mild Dementia Classification
In the mild dementia class, EfficientNet with Dynamic GradNet achieved the highest F1 score (0.9881), indicating a well-balanced performance between precision and recall. This outcome suggests that the proposed model is highly effective in maintaining a low false positive rate while still capturing the majority of true positives. Interestingly, EfficientNet achieved the highest accuracy (0.9976), indicating its proficiency in correct classification overall. However, the relatively low F1 score (0.9799) than that of EfficientNet with Dynamic GradNet suggests that EfficientNet may exhibit a slight imbalance between precision and recall, possibly leading to a greater number of false negatives in this category.
The consistently high performance of EfficientNet with Dynamic GradNet can be attributed to the integration of the Dynamic GradNet mechanism, which likely enhances the model’s robustness by dynamically adjusting gradient updates, leading to more stable and accurate predictions. The marginal yet meaningful improvements in precision and recall over other models highlight the advantage of this approach in handling the complex and nuanced features associated with early-stage dementia.
5.1.2 Moderate Dementia Classification
For the moderate dementia class, EfficientNet with Dynamic GradNet achieved the highest F1 score (0.9949), demonstrating a well-balanced performance between precision and recall. While DenseNet attained the highest accuracy (0.9999), F1 score remains a more comprehensive indicator of the model’s robustness, particularly in cases with class imbalance.
The results suggest that while DenseNet excels in capturing both positive and negative samples with high accuracy, EfficientNet with Dynamic GradNet may be more suitable when the primary concern is reducing false positive rates, which is often a priority in clinical settings. This tradeoff between accuracy and precision must be carefully considered when selecting a model for deployment in real-world diagnostic systems.
5.1.3 Nondemented Classification
In the nondemented class, EfficientNet with Dynamic GradNet demonstrated superior performance across multiple metrics, achieving the highest recall (0.9950), F1 score (0.9949), and accuracy (0.9953). This finding underscores its ability to accurately identify individuals who are not suffering from dementia, with minimal false negatives and false positives. High recall in this category is crucial, as misclassifying nondemented individuals could result in unnecessary anxiety and further diagnostic procedures.
Interestingly, ResNet and EfficientNet achieved the highest precision values (0.9973 and 0.9971, respectively), which indicates their effectiveness in minimizing false positives in this class. However, their lower recall values than that of EfficientNet with Dynamic GradNet suggests a potential shortcoming in correctly identifying all nondemented individuals, possibly leading to a greater number of false negatives. This trade-off between precision and recall is again evident, with EfficientNet with Dynamic GradNet offering a more balanced approach in this category.
5.1.4 Very Mild Dementia Classification
Early detection of dementia is crucial for timely intervention, and in the very mild dementia class, EfficientNet with Dynamic GradNet outperformed all other models in terms of precision (0.9779), F1 score (0.9773), and accuracy (0.9767). This finding highlights the model’s ability to accurately detect early-stage dementia while maintaining a low false positive rate. Given the subtle nature of early dementia symptoms, this performance is particularly noteworthy, as it demonstrates the model’s ability to distinguish between very mild cognitive impairment and normal aging processes.
Moreover, EfficientNet with Dynamic GradNet exhibited exceptional performance in the very mild dementia category, surpassing all other models in terms of precision, recall, and F1 score. Its remarkable ability to detect early-stage dementia with minimal false positives and near perfect sensitivity makes it a highly reliable tool for early diagnosis. The model’s superior F1 score highlights its robustness in accurately identifying true cases while maintaining a low misclassification rate. As a result, EfficientNet with Dynamic GradNet stands out as the most powerful and efficient model for detecting this crucial early-stage of dementia.
The relatively low performance of other models in this class, particularly ResNet F1 score (0.8527) and RegNet F1 score (0.8893), suggests that these architectures may struggle with the fine-grained distinctions required for early dementia classification. The enhanced performance of EfficientNet with Dynamic GradNet can likely be attributed to its dynamic gradient adjustment mechanism, which allows for better generalizability in categories with subtle and overlapping features.
5.2 Comprehensive Model Comparison
5.2.1 Generalization across All Classes
When comparing the models’ average performance across all classes, it is evident that EfficientNet with Dynamic GradNet stands out, achieving the highest average precision (0.9896), recall (0.9878), F1 score (0.9887), and accuracy (0.9903). This finding suggests that the proposed model not only excels in individual categories but also generalizes effectively across the entire dataset. The consistency in its performance, coupled with low variance in key metrics, indicates that EfficientNet with Dynamic GradNet offers a highly reliable solution for multiclass dementia classification.
The superior performance of EfficientNet with Dynamic GradNet across all classes can be attributed to its ability to adapt dynamically to different data distributions and class imbalances, which is a common challenge in medical datasets. The model’s ability to maintain high sensitivity (recall) and specificity across all categories further reinforces its potential as a robust tool for clinical applications, where both high true positive rates and low false positive rates are critical.
5.2.2 Sensitivity and Specificity
The sensitivity (recall) and specificity analysis across classes further highlights the strengths of EfficientNet with Dynamic GradNet. For the nondemented and moderate dementia classes, the model achieved the highest specificity values (0.9991 and 0.9964, respectively), indicating its strong ability to minimize false positives.
This balance between sensitivity and specificity underscores the clinical applicability of EfficientNet with Dynamic GradNet, as it has the ability to correctly identify true positives while minimizing false positives, thereby reducing the risk of misdiagnosis and unnecessary treatments.
The proposed EfficientNet with Dynamic GradNet model consistently outperformed existing architectures across multiple dementia classification tasks. Its superior precision, recall, F1 score, and accuracy—coupled with its ability to generalize well across different classes—make it an ideal candidate for clinical deployment in AD diagnosis. The model’s dynamic gradient adjustment mechanism allows it to handle the inherent complexities and imbalances in medical datasets, ensuring both high sensitivity and specificity. These findings suggest that EfficientNet with Dynamic GradNet offers a valuable contribution to the field of medical image analysis, particularly in the early detection of dementia, where accurate and timely diagnosis is paramount.
5.3 Generalizability of Dynamic GradNet
The proposed Dynamic GradNet model has been trained and evaluated on MRI images from the OASIS dataset. Given that GradCAM operates on feature maps extracted from convolutional layers, the model’s design is theoretically adaptable to other medical imaging modalities such as CT and PET scans. Convolutional neural networks (CNNs), including EfficientNet, have demonstrated flexibility in handling different imaging data, making it feasible to apply transfer learning techniques for adapting Dynamic GradNet to alternative modalities.
However, MRI, CT, and PET scans exhibit substantial differences in contrast, resolution, and feature representation, which may require modifications in preprocessing steps such as normalization and intensity scaling. While the core model architecture remains unchanged, adjustments in image standardization and augmentation strategies would be necessary to optimize performance across different modalities. Future research may focus on fine tuning Dynamic GradNet using multi-modal datasets, evaluating its robustness in cross modality diagnostic settings. This extension will ensure the model’s broader applicability in clinical decision support systems, enhancing its real-world utility beyond MRI based Alzheimer’s diagnosis.
5.4 Potential Integration into Clinical Diagnostic Workflows
The proposed Dynamic GradNet framework not only enhances classification performance but also presents a significant step toward integrating deep learning models into clinical diagnostic workflows. Unlike conventional post-hoc interpretability approaches, our method actively refines the learning process, ensuring the model consistently prioritizes clinically relevant brain regions. This improvement is particularly valuable for computer aided diagnosis (CAD) systems, where reliability and transparency are crucial for adoption in real-world medical imaging applications. By reducing false positives, particularly in early-stage dementia detection, and improving model interpretability, Dynamic GradNet aligns well with the needs of radiologists and neurologists. Furthermore, its adaptability to existing MRI-based diagnostic tools suggests potential applicability in automated diagnostic systems and future AI-assisted medical imaging software. These findings highlight the feasibility of integrating Dynamic GradNet into clinical settings, paving the way for its implementation in decision support systems for Alzheimer’s disease diagnosis.
By integrating GradCAM into the training process, this framework not only improves model interpretability but also enhances its practical applicability in clinical settings, where explain ability is essential for trust and adoption by healthcare professionals. This advancement facilitates its integration into decision-support systems, aiding radiologists and neurologists in Alzheimer’s disease diagnosis.
This study underscores the importance of dynamic spatial focus in the diagnosis of AD and introduces the EfficientNet GradNet model as an effective approach for improving diagnostic accuracy and interpretability. A comparison of four state-of-the-art CNN architectures revealed that EfficientNet outperformed the others in terms of accuracy, precision, recall, and F1 score, particularly in the early stages of dementia. The integration of Dynamic GradNet further enhanced the model’s ability by enabling it to focus on the most relevant regions in medical images while reducing the impact of less critical areas such as image edges or irrelevant organ sections. This focus not only provides better interpretability but also improves the model’s learning process during the training phase by emphasizing anatomically significant regions.
In medical imaging, some portions of images, such as peripheral areas or non-crucial regions, may not contribute significantly to the classification process. Dynamic GradNet ensures that the model focuses on the critical areas required for accurate diagnosis, minimizing the influence of irrelevant portions of images. This capability is essential both for enhancing model interpretability and for guiding learning in the training phase, where the model needs to prioritize the most important patterns.
One of the key contributions of this study is highlighting the importance of dynamic spatial focus in medical diagnostics. This approach could serve as a foundation for future studies on spatial prioritization, where precise anatomical localization plays a crucial role in improving diagnostic accuracy, particularly in neurodegenerative diseases. By demonstrating the impact of spatial focus on performance, this study opens the door for further exploration into how spatial attention mechanisms can be tailored for other medical conditions, potentially leading to more refined diagnostic tools that leverage the most critical regions in medical images.
In the future, several avenues can be explored. First, researchers could focus on improving the model’s performance in classifying complex cases, such as mixed or ambiguous forms of dementia. Comparative studies with other imaging modalities, such as CT or PET, could be performed to assess the model’s adaptability across different types of medical imaging.
To further evaluate the generalizability of Dynamic GradNet, future work will explore its adaptation to different imaging modalities, such as computed tomography (CT) and positron emission tomography (PET). While the model’s architecture remains unchanged, modifications in preprocessing strategies, including normalization, intensity scaling, and domain specific augmentations, will be considered to optimize performance across different imaging techniques. Additionally, training and validation on multi-modal datasets will provide insights into the model’s robustness and effectiveness in cross modality diagnostic settings. This extension will help establish Dynamic GradNet as a more versatile tool for clinical decision support, ensuring its applicability beyond MRI-based Alzheimer’s diagnosis.
Finally, incorporating more advanced interpretability frameworks, such as explainable AI (XAI) techniques, could provide deeper insights into the model’s decision making process, fostering greater trust in AI-assisted diagnostic tools.
Overall, EfficientNet with Dynamic GradNet has significant potential in supporting AD diagnosis. Continued refinement and innovation in this direction can further increase the accuracy and clinical applicability of this model, meaningfully contributing to the future of AI technologies in medical diagnostics. Moreover, the importance of dynamic spatial focus could serve as a key stepping stone for further studies, driving advancements in how medical imaging models prioritize and interpret critical spatial information across various diseases.
Acknowledgement: The author would like to thank the editors and reviewers for their valuable work and constructive feedback. We also extend our gratitude to the Open Access Series of Imaging Studies (OASIS) project and Kaggle for providing the OASIS MRI dataset, which includes over 80,000 brain MR images categorized by Alzheimer’s Disease progression. The author would like to acknowledge Deanship of Graduate Studies and Scientific Research, Taif University for funding this work.
Funding Statement: This research was funded by Taif University, Saudi Arabia. The author would like to acknowledge Deanship of Graduate Studies and Scientific Research, Taif University for funding this work.
Availability of Data and Materials: The dataset used in this study is publicly available. We acknowledge the Open Access Series of Imaging Studies (OASIS) project and Kaggle for providing the OASIS MRI dataset, which includes over 80,000 brain MR images categorized by Alzheimer’s Disease progression. The dataset can be accessed at https://www.kaggle.com/datasets/ninadaithal/imagesoasis/data (accessed on 19 November 2024).
Ethics Approval: Not applicable.
Conflicts of Interest: The author declares no conflicts of interest to report regarding the present study.
References
1. Aramadaka S, Mannam R, Sankara Narayanan R, Bansal A, Yanamaladoddi VR, Sarvepalli SS, Vemula SL. Neuroimaging in Alzheimer’s disease for early diagnosis: a comprehensive review. Cureus. 2023;15(5):e38544. doi:10.7759/cureus.38544. [Google Scholar] [PubMed] [CrossRef]
2. Frisoni GB, Fox NC, Jack CR, Scheltens P, Thompson PM. The clinical use of structural MRI in Alzheimer disease. Nat Rev Neurol. 2010;6(2):67–77. doi:10.1038/nrneurol.2009.215. [Google Scholar] [PubMed] [CrossRef]
3. Feng X, Provenzano FA, Small SA. A deep learning MRI approach outperforms other biomarkers of prodromal Alzheimer’s disease. Alzheimer’s Res Ther. 2022;14(1):45–5. doi:10.1186/s13195-022-00985-x. [Google Scholar] [PubMed] [CrossRef]
4. Litjens G, Kooi T, Bejnordi BE, Setio AA, Ciompi F, Ghafoorian M, et al. A survey on deep learning in medical image analysis. Med Image Anal. 2017;42(13):60–88. doi:10.1016/j.media.2017.07.005. [Google Scholar] [PubMed] [CrossRef]
5. Shen D, Wu G, Suk HI. Deep learning in medical image analysis. Annu Rev Biomed Eng. 2017;19(1):221–48. doi:10.1146/annurev-bioeng-071516-044442. [Google Scholar] [PubMed] [CrossRef]
6. Andrej K, Li F. Deep visual-semantic alignments for generating image descriptions. In: 2015 IEEE Conference on Computer Vision and Pattern Recognition (CVPR); 2015; Boston, MA, USA. p. 3128–37. doi:10.1109/CVPR.2015.7298932. [Google Scholar] [CrossRef]
7. Radosavovic I, Kosaraju RP, Girshick R, He K, Dollár P. Designing network design spaces. In: 2020 IEEE/CVF Conference on Computer Vision and Pattern Recognition (CVPR). Seattle, WA, USA; 2020. p. 10428– 36. doi:10.1109/cvpr42600.2020.01044. [Google Scholar] [CrossRef]
8. Maddury S, Desai K. DeepAD: a deep learning application for predicting amyloid standardized uptake value ratio through PET for Alzheimer’s prognosis. Front Artif Intell. 2023;6:1091506. doi:10.3389/frai.2023.1091506. [Google Scholar] [PubMed] [CrossRef]
9. He K, Zhang X, Ren S, Sun J. Deep residual learning for image recognition. In: Proceedings of the IEEE Conference on Computer Vision and Pattern Recognition (CVPR); 2016; Los Alamitos, CA, USA: IEEE Computer Society. p. 770–8. doi:10.1109/cvpr.2016.90. [Google Scholar] [CrossRef]
10. Shi C, Yao X, Luo S, Zhou L, Wu T. Classification of Alzheimer’s disease via deep residual network. In: International Conference on Image, Vision and Intelligent Systems; 2023 Aug 16–18; Baoding, China; 2024. p. 557–64. doi:10.1007/978-981-97-0855-0_53. [Google Scholar] [CrossRef]
11. Huang G, Liu Z, Van Der Maaten L, Weinberger KQ. Densely connected convolutional networks//and others. In: 2017 IEEE Conference on Computer Vision and Pattern Recognition (CVPR); 2017; Honolulu, HI, USA. doi:10.1109/CVPR.2017.243. [Google Scholar] [CrossRef]
12. Zhou T, Ye X, Lu H, Zheng X, Qiu S, Liu Y. Dense convolutional network and its application in medical image analysis. Biomed Res Int. 2022;2022(1):2384830. doi:10.1155/2022/2384830. [Google Scholar] [PubMed] [CrossRef]
13. Tan M, Le Q. Efficientnet: rethinking model scaling for convolutional neural networks. In: Proceedings of the 36th International Conference on Machine Learning (ICML); 2019 May; Long Beach, CA, USA:PMLR. p. 6105–14. doi:10.48550/arXiv.1905.11946. [Google Scholar] [CrossRef]
14. Hoang GM, Kim UH, Kim JG. Vision transformers for the prediction of mild cognitive impairment to Alzheimer’s disease progression using mid-sagittal sMRI. Front Aging Neurosci. 2023;15:1102869. doi:10.3389/fnagi.2023.1102869. [Google Scholar] [PubMed] [CrossRef]
15. Xie Y, Yang B, Guan Q, Zhang J, Wu Q, Xia Y. Attention mechanisms in medical image segmentation: a survey. arXiv:2305.17937. 2023. [Google Scholar]
16. Serrano-Pozo A, Frosch MP, Masliah E, Hyman BT. Neuropathological alterations in Alzheimer disease. Cold Spring Harb Perspect Med. 2011;1(1):6189–9. doi:10.1101/cshperspect.a006189. [Google Scholar] [PubMed] [CrossRef]
17. Liu M, Zhang D, Shen D. Hierarchical fusion of features and classifier decisions for Alzheimer’s disease diagnosis. Hum Brain Mapp. 2015;36(3):1202–16. doi:10.1002/hbm.22254. [Google Scholar] [PubMed] [CrossRef]
18. Liu M, Cheng D, Wang K, Wang Y. Multi-modality cascaded convolutional neural networks for Alzheimer’s disease diagnosis. Neuroinformatics. 2018;16:295–308. doi:10.1007/s12021-018-9370-4. [Google Scholar] [PubMed] [CrossRef]
19. Suk HI, Lee SW, Shen D, Alzheimer’s Disease Neuroimaging Initiative. Deep sparse multi-task learning for feature selection in Alzheimer’s disease diagnosis. Brain Struct Funct. 2016;221(5):2569–87. doi:10.1007/s00429-015-1059-y. [Google Scholar] [PubMed] [CrossRef]
20. Li R, Wang X, Lawler K, Garg S, Bai Q, Alty J. Applications of artificial intelligence to aid early detection of dementia: a scoping review on current capabilities and future directions. J Biomed Inform. 2022;127:104030. doi:10.1016/j.jbi.2022.104030. [Google Scholar] [PubMed] [CrossRef]
21. Fathi S, Ahmadi A, Dehnad A, Almasi-Dooghaee M, Sadegh M. Alzheimer’s disease neuroimaging initiative. A deep learning-based ensemble method for early diagnosis of Alzheimer’s disease using MRI images. Neuroinformatics. 2024;22(1):89–105. doi:10.1007/s12021-023-09646-2. [Google Scholar] [PubMed] [CrossRef]
22. Yaqoob N, Khan MA, Masood S, Albarakati HM, Hamza A, Alhayan F, et al. Prediction of Alzheimer’s disease stages based on ResNet-Self-attention architecture with Bayesian optimization and best features selection. Front Comput Neurosci. 2024;18:1393849. doi:10.3389/fncom.2024.1393849. [Google Scholar] [PubMed] [CrossRef]
23. Agarwal D, Berbís MA, Luna A, Lipari V, Ballester JB, de la Torre-Díez I. Automated medical diagnosis of Alzheimer’s disease using an efficient net convolutional neural network. J Med Syst. 2023;47(1):57. doi:10.1007/s10916-023-01941-4. [Google Scholar] [PubMed] [CrossRef]
24. Dhinagar NJ, Thomopoulos SI, Laltoo E, Thompson PM. Efficiently training vision transformers on structural MRI scans for alzheimer’s disease detection. In: 2023 45th Annual International Conference of the IEEE Engineering in Medicine & Biology Society (EMBC); 2023 Jul; Sydney, Australia: IEEE. p. 1–6. doi:10.1109/EMBC40787.2023.10341190. [Google Scholar] [PubMed] [CrossRef]
25. Sun H, Wang A, Wang W, Liu C. An improved deep residual network prediction model for the early diagnosis of Alzheimer’s disease. Sensors. 2021;21(12):4182. doi:10.3390/s21124182. [Google Scholar] [PubMed] [CrossRef]
26. Hassan N, Miah ASM, Shin J. Residual-based multi-stage deep learning framework for computer-aided Alzheimer’s disease detection. J Imag. 2024;10(6):141. doi:10.3390/jimaging10060141. [Google Scholar] [PubMed] [CrossRef]
27. Gottapu RD, Dagli CH. DenseNet for anatomical brain segmentation. Procedia Comput Sci. 2018;140(4):179–85. doi:10.1016/j.procs.2018.10.327. [Google Scholar] [CrossRef]
28. Saleh AW, Gupta G, Khan SB, Alkhaldi NA, Verma A. An Alzheimer’s disease classification model using transfer learning DenseNet with embedded healthcare decision support system. Decis Anal J. 2023;9(45):100348. doi:10.1016/j.dajour.2023.100348. [Google Scholar] [CrossRef]
29. Priyadarshini P, Kanungo P, Kar T. Multigrade brain tumor classification in MRI images using Fine tuned efficientnet. e-Prime—advances in electrical engineering. Electron Energy. 2024;8(20):100498. doi:10.1016/j.prime.2024.100498. [Google Scholar] [CrossRef]
30. Aborokbah M. Alzheimer’s disease MRI classification using EfficientNet: a deep learning model. In: 2024 4th International Conference on Applied Artificial Intelligence (ICAPAI); 2024; Halden, Norway; 2024. p. 1–8. doi:10.1109/ICAPAI61893.2024.10541281. [Google Scholar] [CrossRef]
31. Zhang Y, Hong D, Mcclement D, Oladosu O, Pridham G, Slaney G. Grad-CAM helps interpret the deep learning models trained to classify multiple sclerosis types using clinical brain magnetic resonance imaging. J Neurosci Methods. 2021;353:109098. doi:10.1016/j.jneumeth.2021.109098. [Google Scholar] [PubMed] [CrossRef]
32. Shaji S, Ganapathy N, Swaminathan R. Classification of Alzheimer’s condition using MR brain images and inception-residual network model. Curr Dir Biomed Eng. 2021;7(2):763–6. doi:10.1515/cdbme-2021-2195. [Google Scholar] [CrossRef]
33. Krishnan D, Bishnoi A, Bansal S, Ravi V, Ravi P. Enhancing classification of Alzheimer’s disease using spatial attention mechanism. Open Neuroimag J. 2024;(1):17–7. doi:10.2174/0118744400305746240626043912. [Google Scholar] [CrossRef]
34. Sun H, Wang A, He S. Temporal and spatial analysis of Alzheimer’s disease based on an improved convolutional neural network and a resting-state FMRI brain functional network. Int J Environ Res Public Health. 2022;19(8):4508–8. doi:10.3390/ijerph19084508. [Google Scholar] [PubMed] [CrossRef]
35. Marcus DS, Wang TH, Parker J, Csernansky JG, Morris JC, Buckner RL. Open Access Series of Imaging Studies (OASIScross-sectional MRI data in young, middle-aged, nondemented, and demented older adults. J Cogn Neurosci. 2007;19(9):1498–507. doi:10.1162/jocn.2007.19.9.1498. [Google Scholar] [PubMed] [CrossRef]
36. Marcus DS, Fotenos AF, Csernansky JG, Morris JC, Buckner RL. Open access series of imaging studies: longitudinal MRI data in nondemented and demented older adults. J Cogn Neurosci. 2010;22(12):2677–84. doi:10.1162/jocn.2009.21407. [Google Scholar] [PubMed] [CrossRef]
37. Lamontagne PJ, Benzinger TL, Morris JC, Keefe S, Hornbeck R, Xiong C, et al. OASIS-3: longitudinal neuroimaging, clinical, and cognitive dataset for normal aging and Alzheimer disease. medrxiv; 2019. doi:10.1101/2019.12.13.19014902. [Google Scholar] [CrossRef]
38. AithalN.(n.d.). OASIS Alzheimer’s detection [Data set]. Kaggle. [cited 2025 Feb 10]. Available from: https://www.kaggle.com/datasets/ninadaithal/imagesoasis. [Google Scholar]
Cite This Article
 Copyright © 2025 The Author(s). Published by Tech Science Press.
This work is licensed under a Creative Commons Attribution 4.0 International License , which permits unrestricted use, distribution, and reproduction in any medium, provided the original work is properly cited.
 Downloads
 Citation Tools